
Segmentation and Tracking of Anticyclonic Eddies during a Submarine Volcanic Eruption Using Ocean Colour Imagery


Abstract
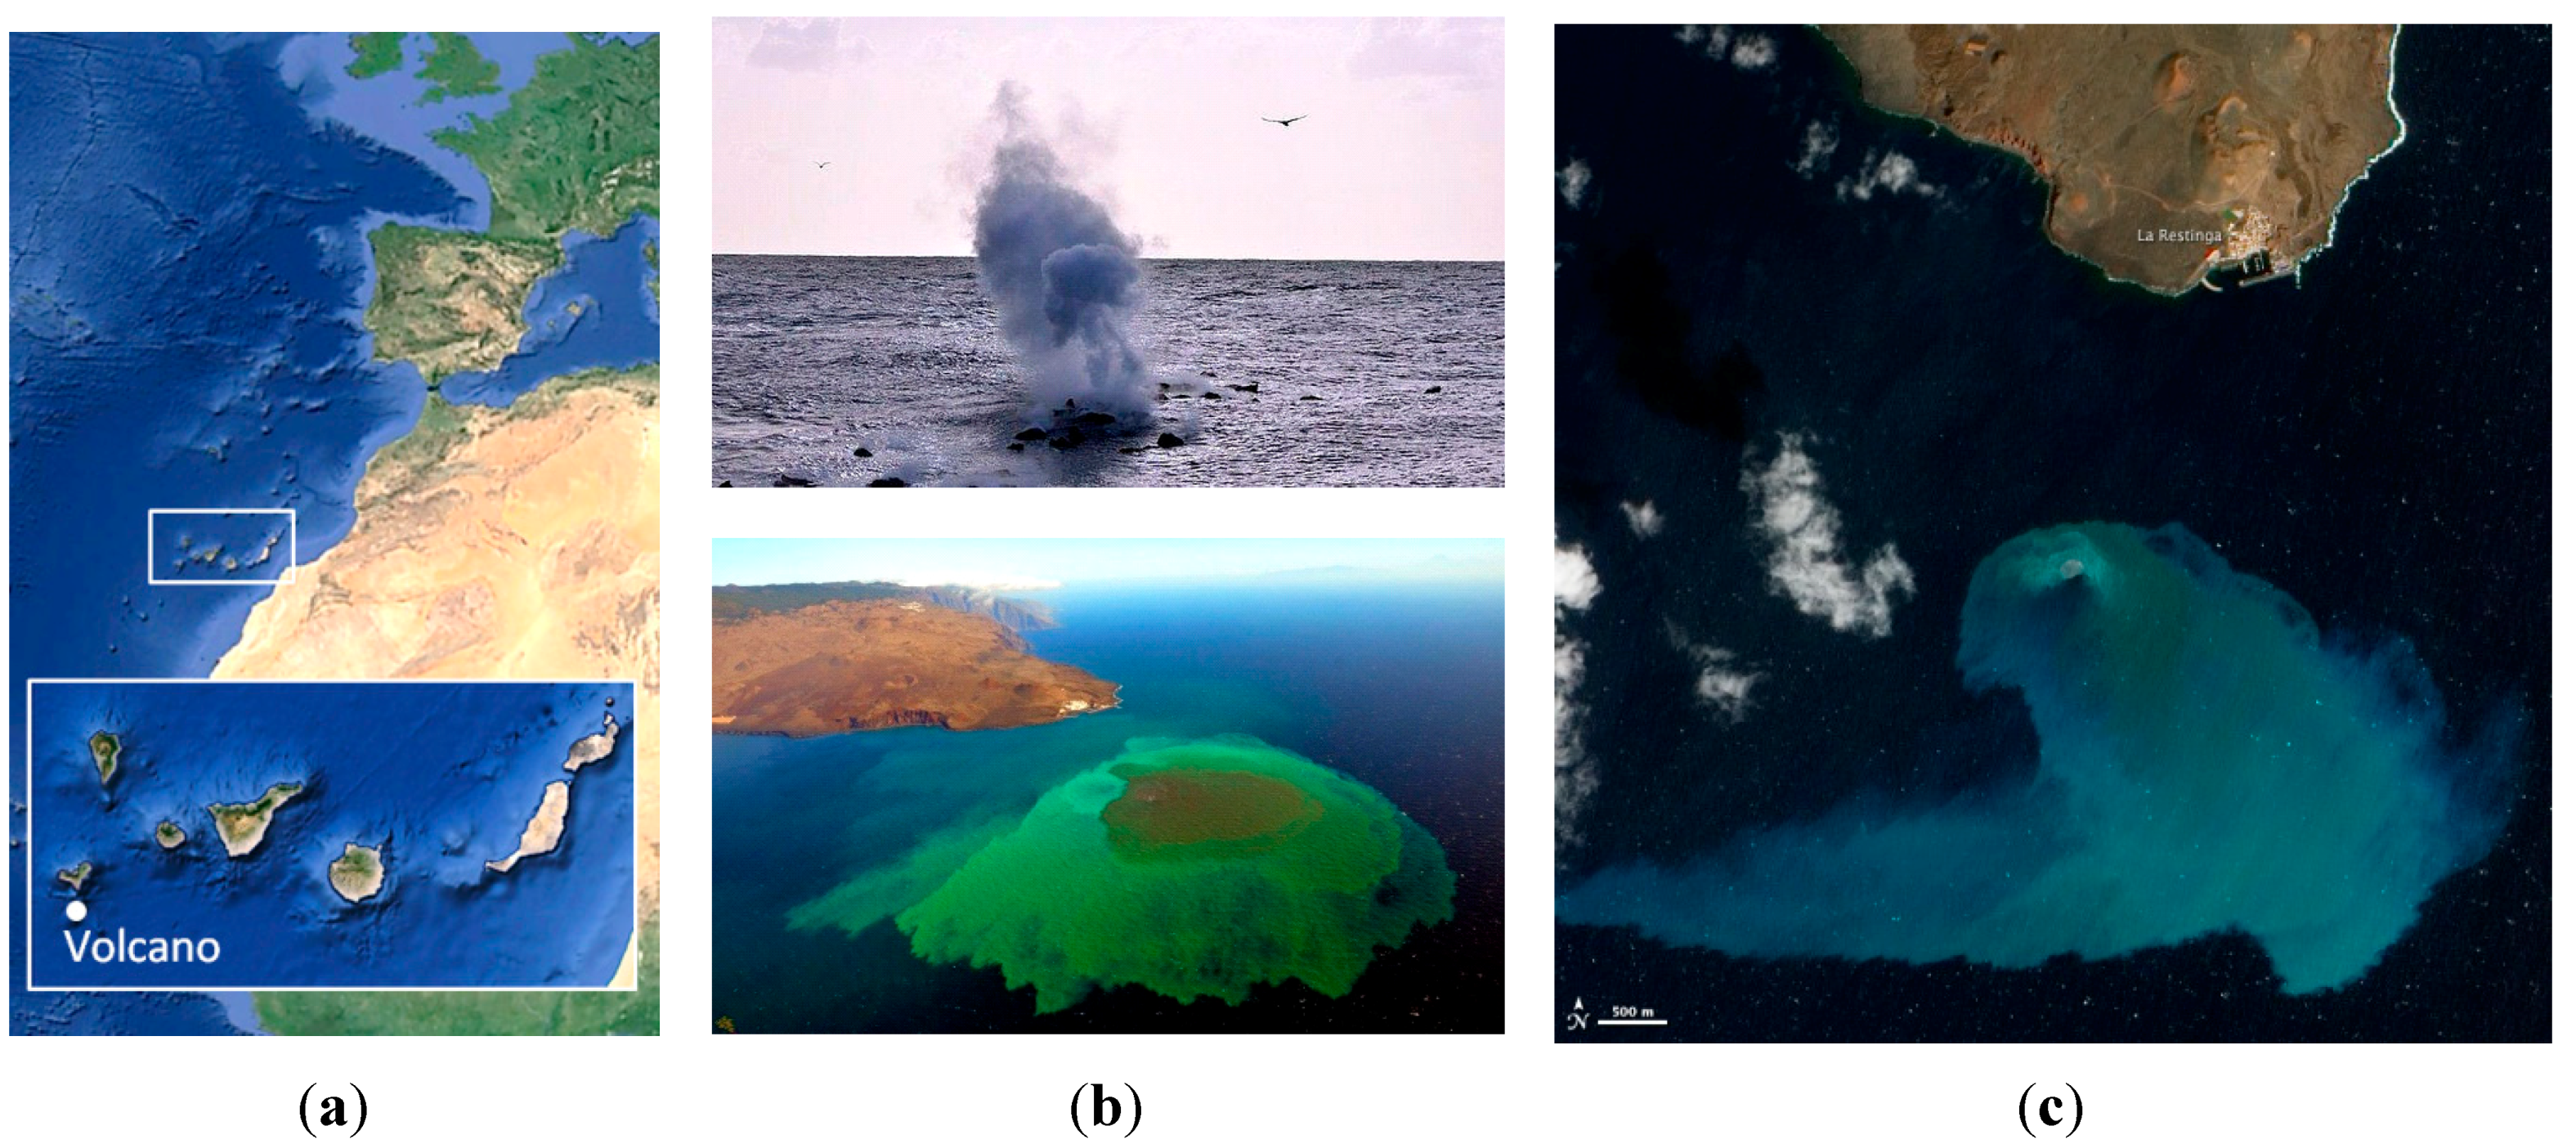
:1. Introduction

2. Methodology
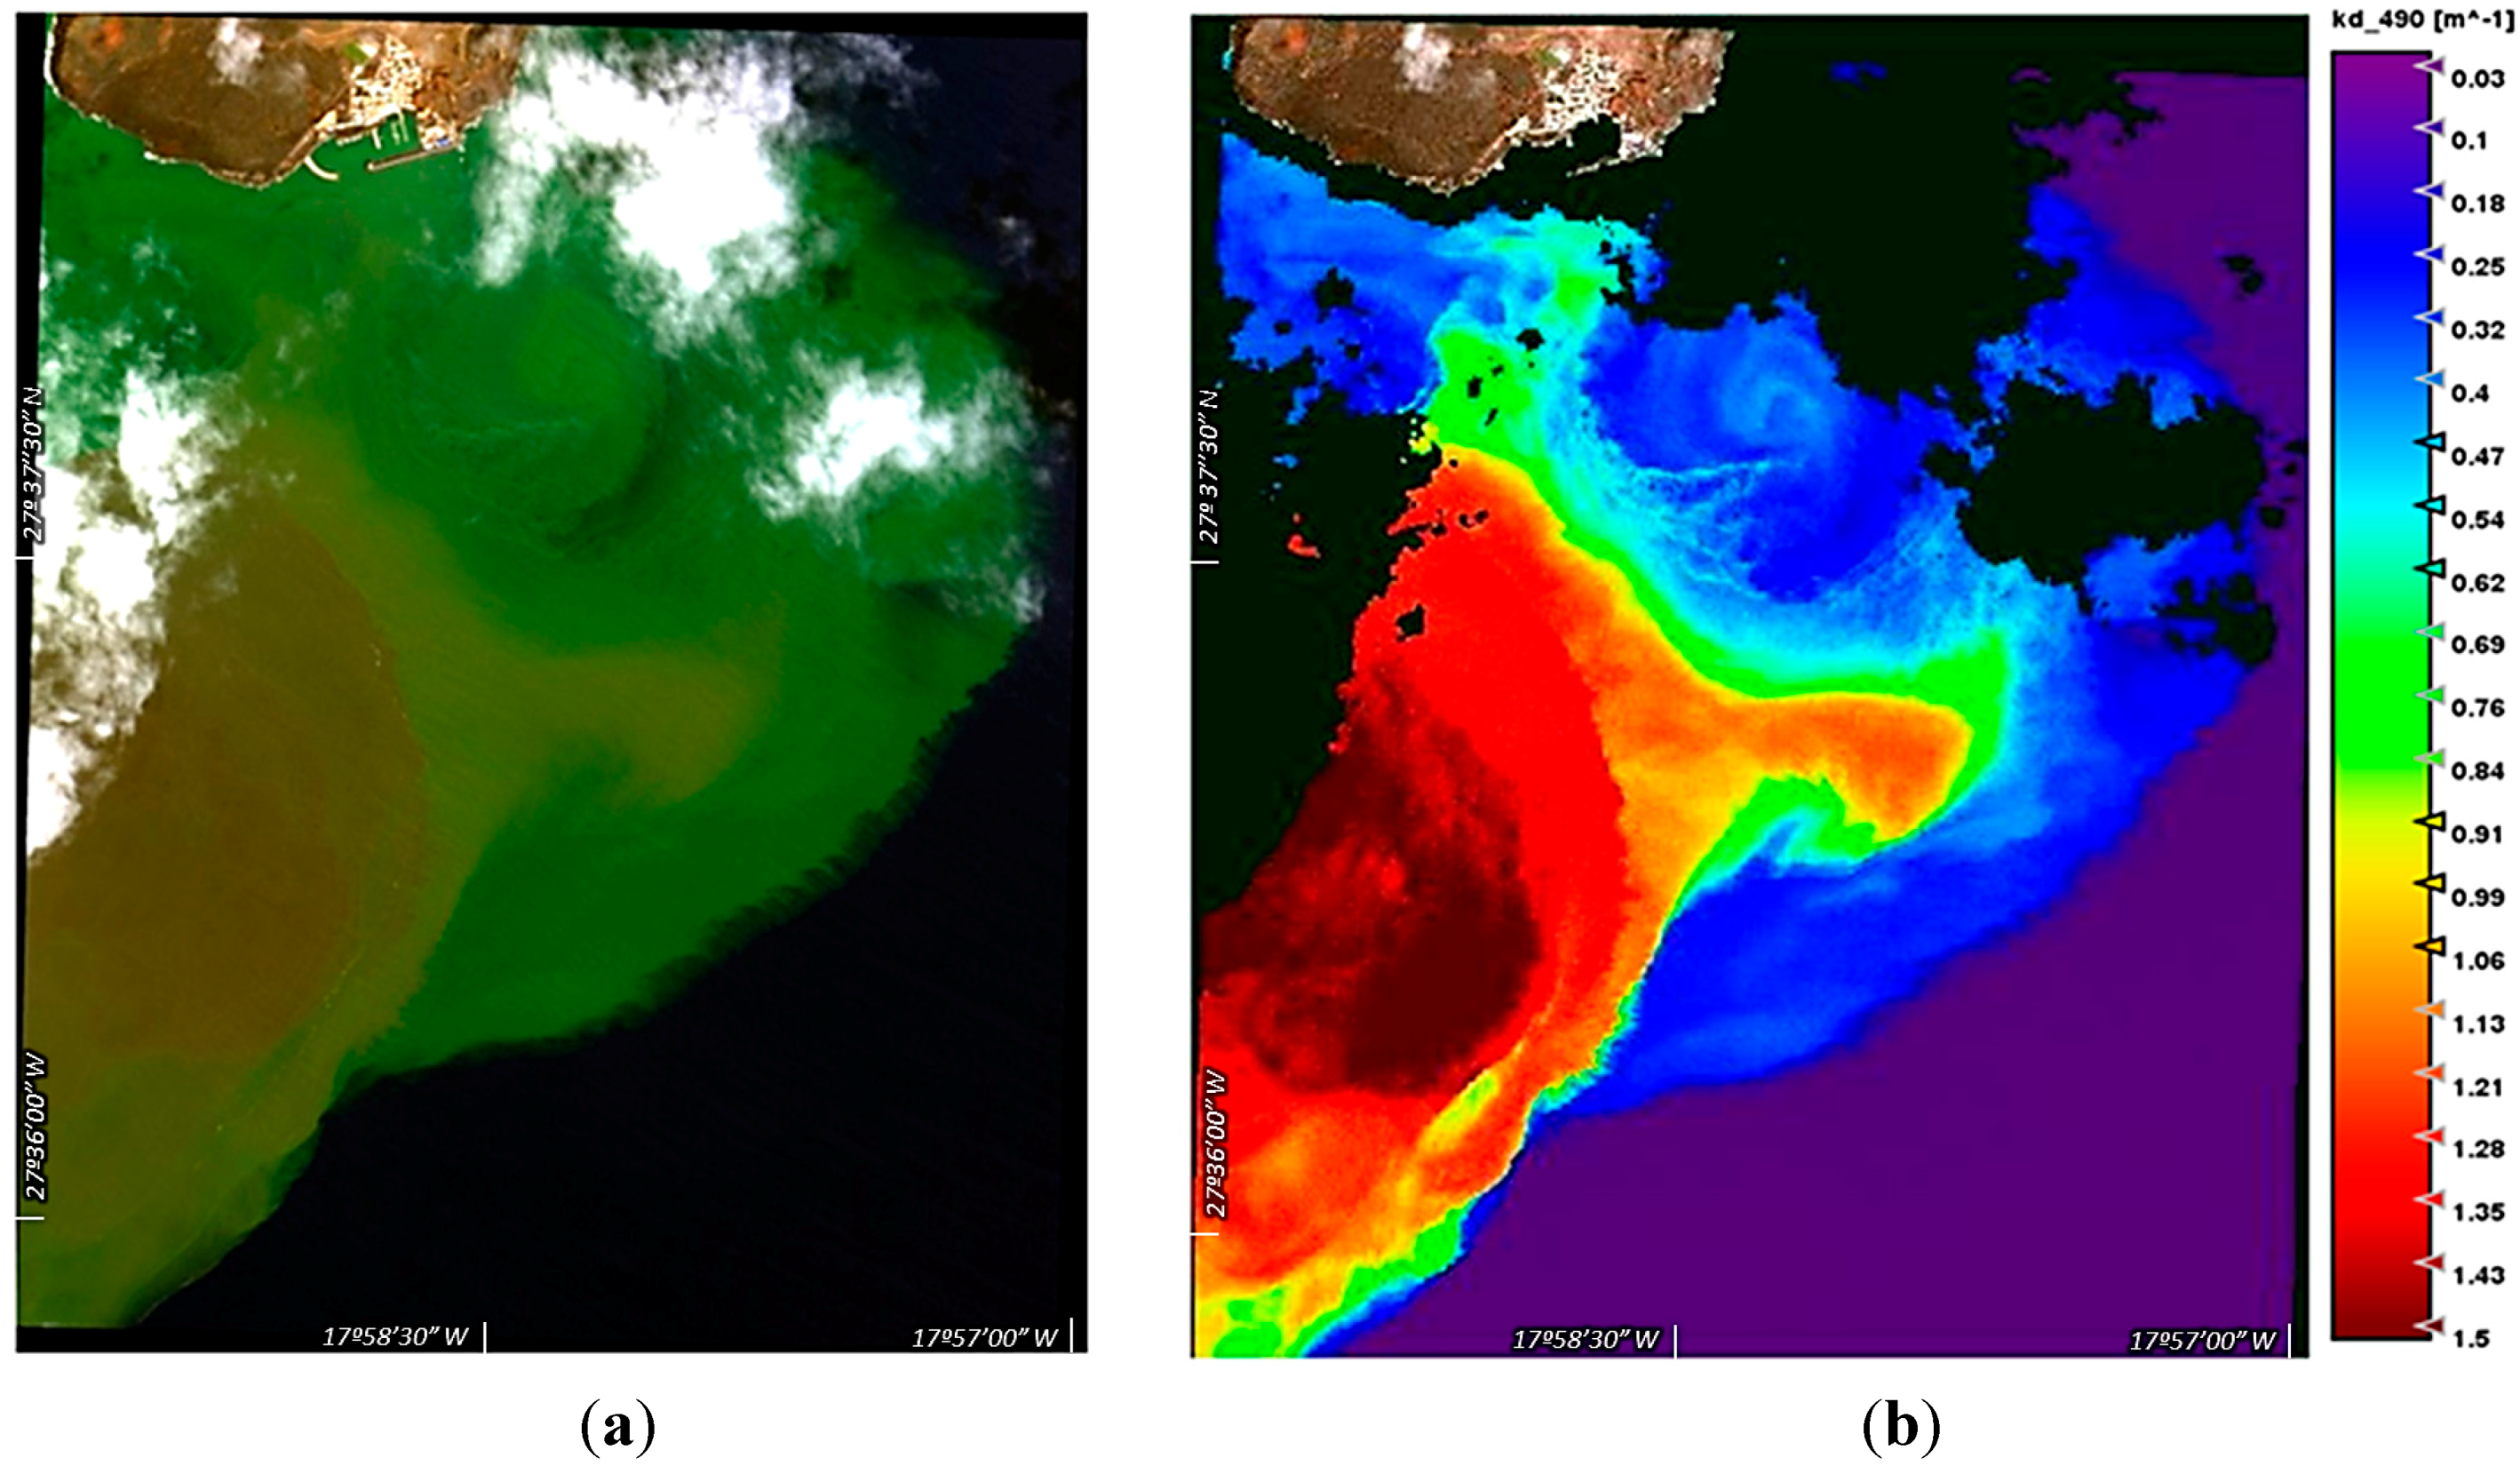
2.1. Ocean Colour Imagery


2.2. Methodology for the Precise Segmentation of Eddies
- (i)
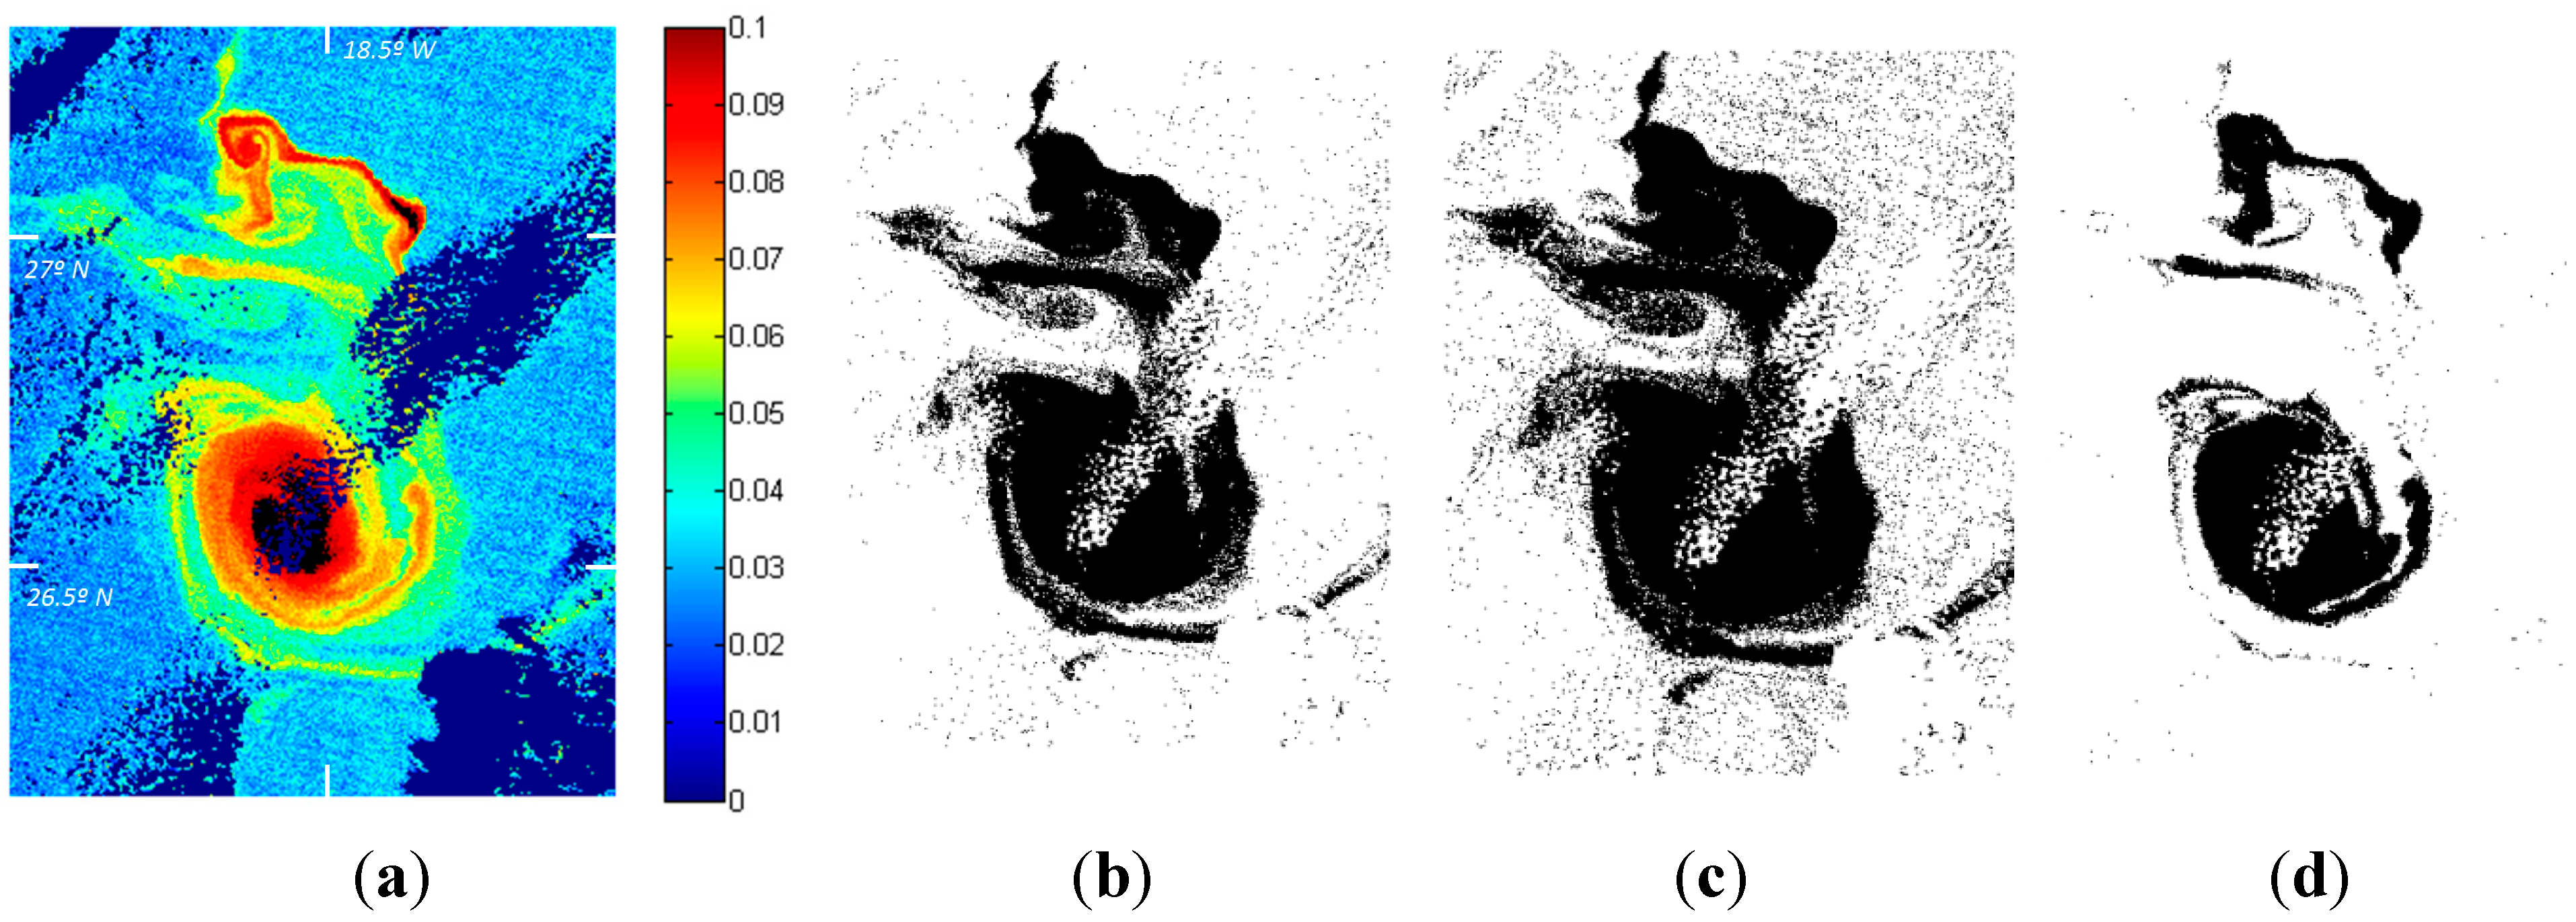
- Initial eddy detection: First, a pre-processing is applied to the MODIS/MERIS Kd images. Next, the initial segmentation stage is applied with the possibility to select different clustering and thresholding algorithms. Finally, a post-processing is required to remove isolated noisy pixels or to fill holes in the eddy structure due to clouds. After the initial detection, the structure is well identified; however the fine detail of the emerging filaments cannot be preserved without incorporating unwanted areas.
- (ii)
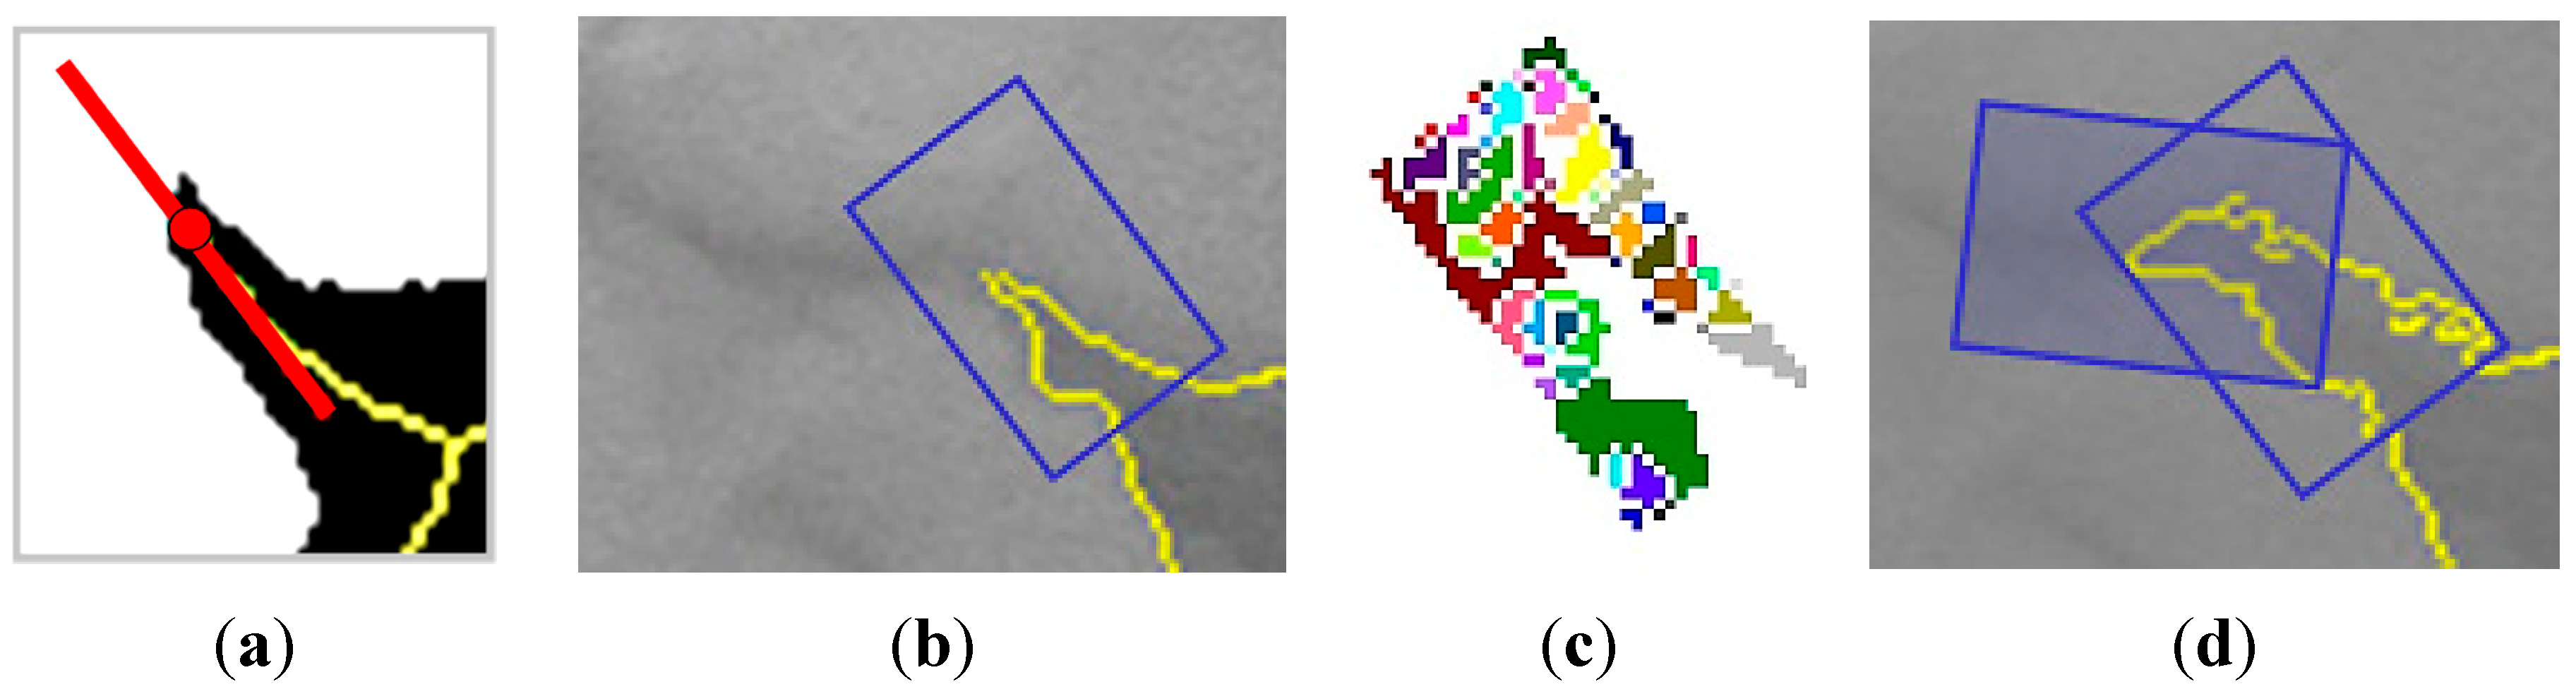
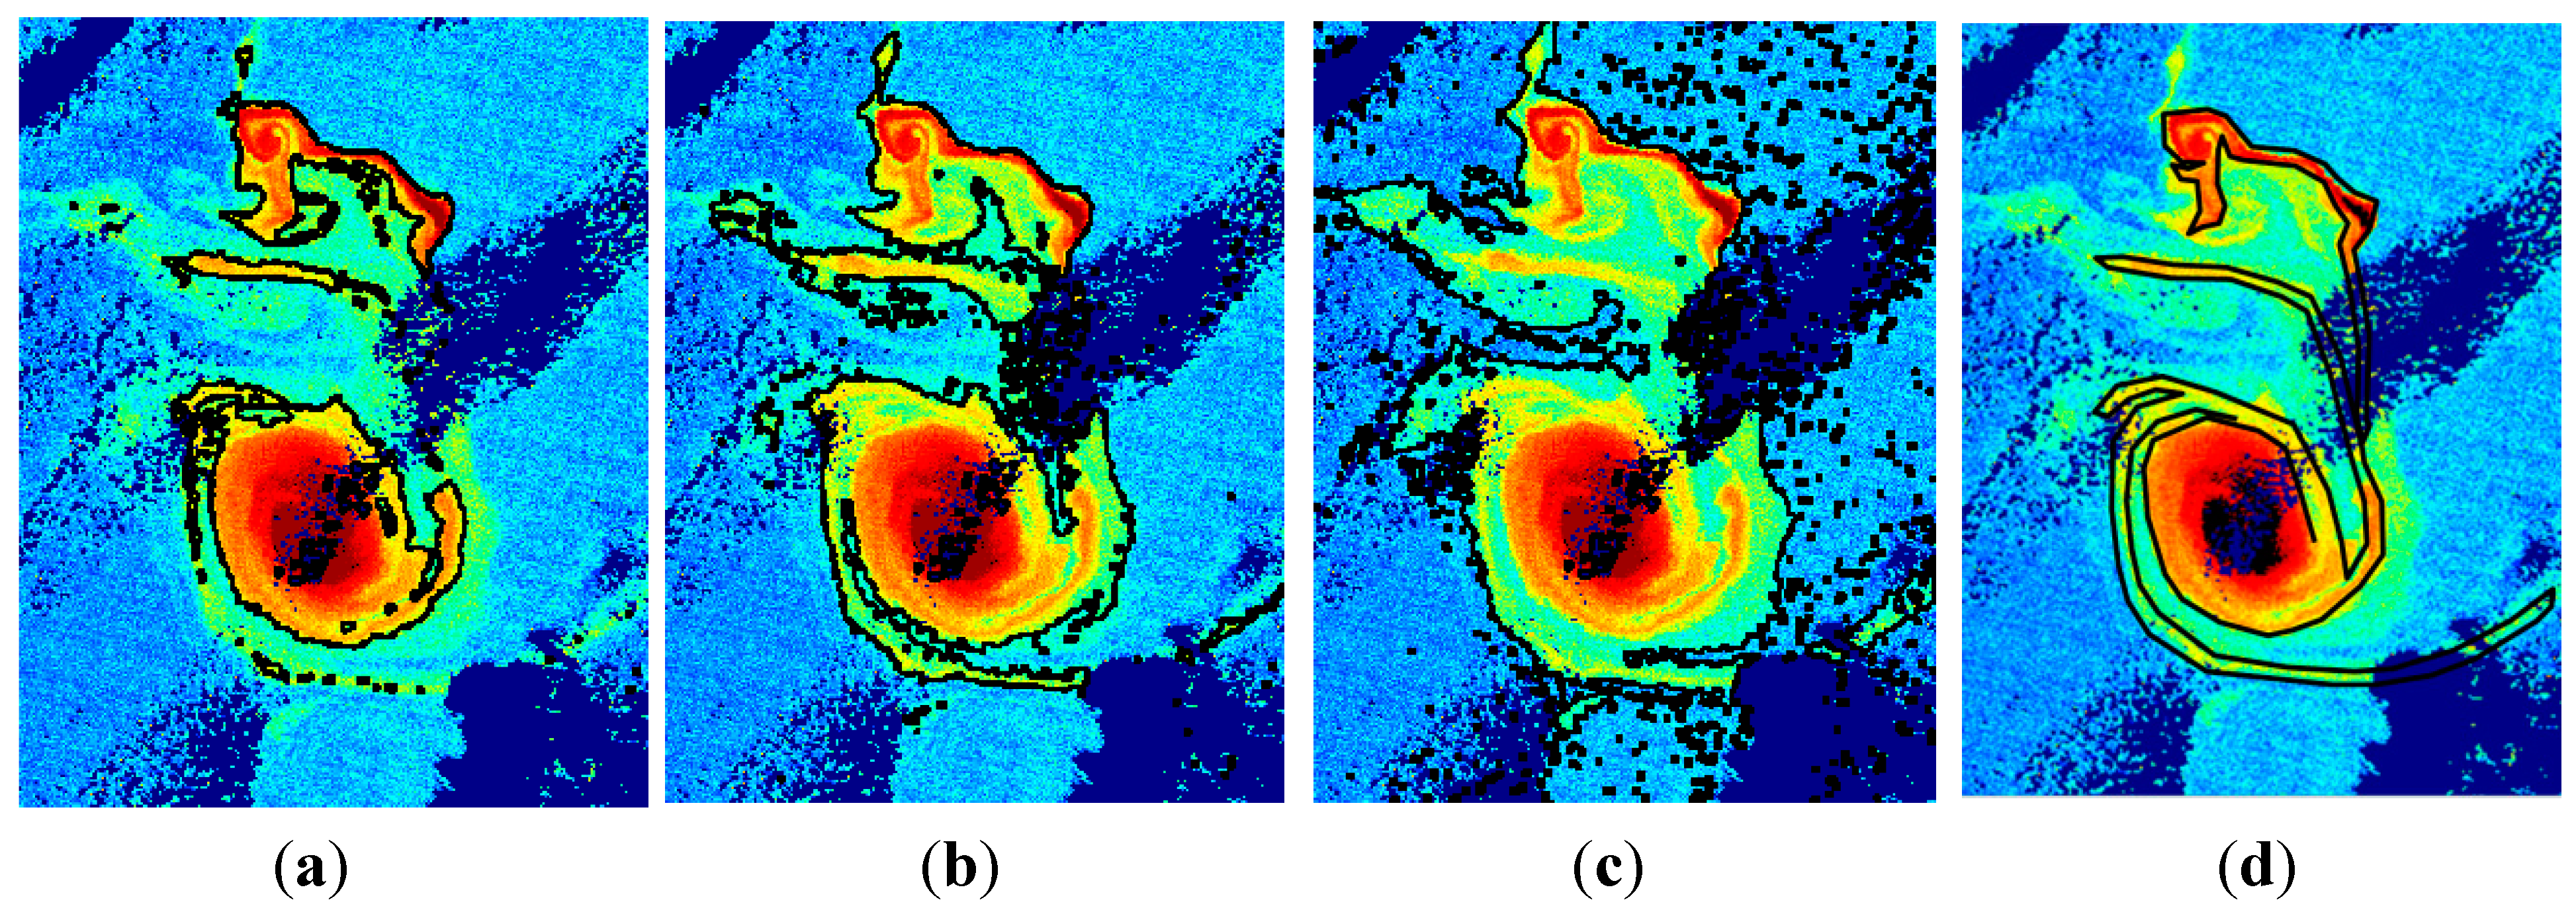
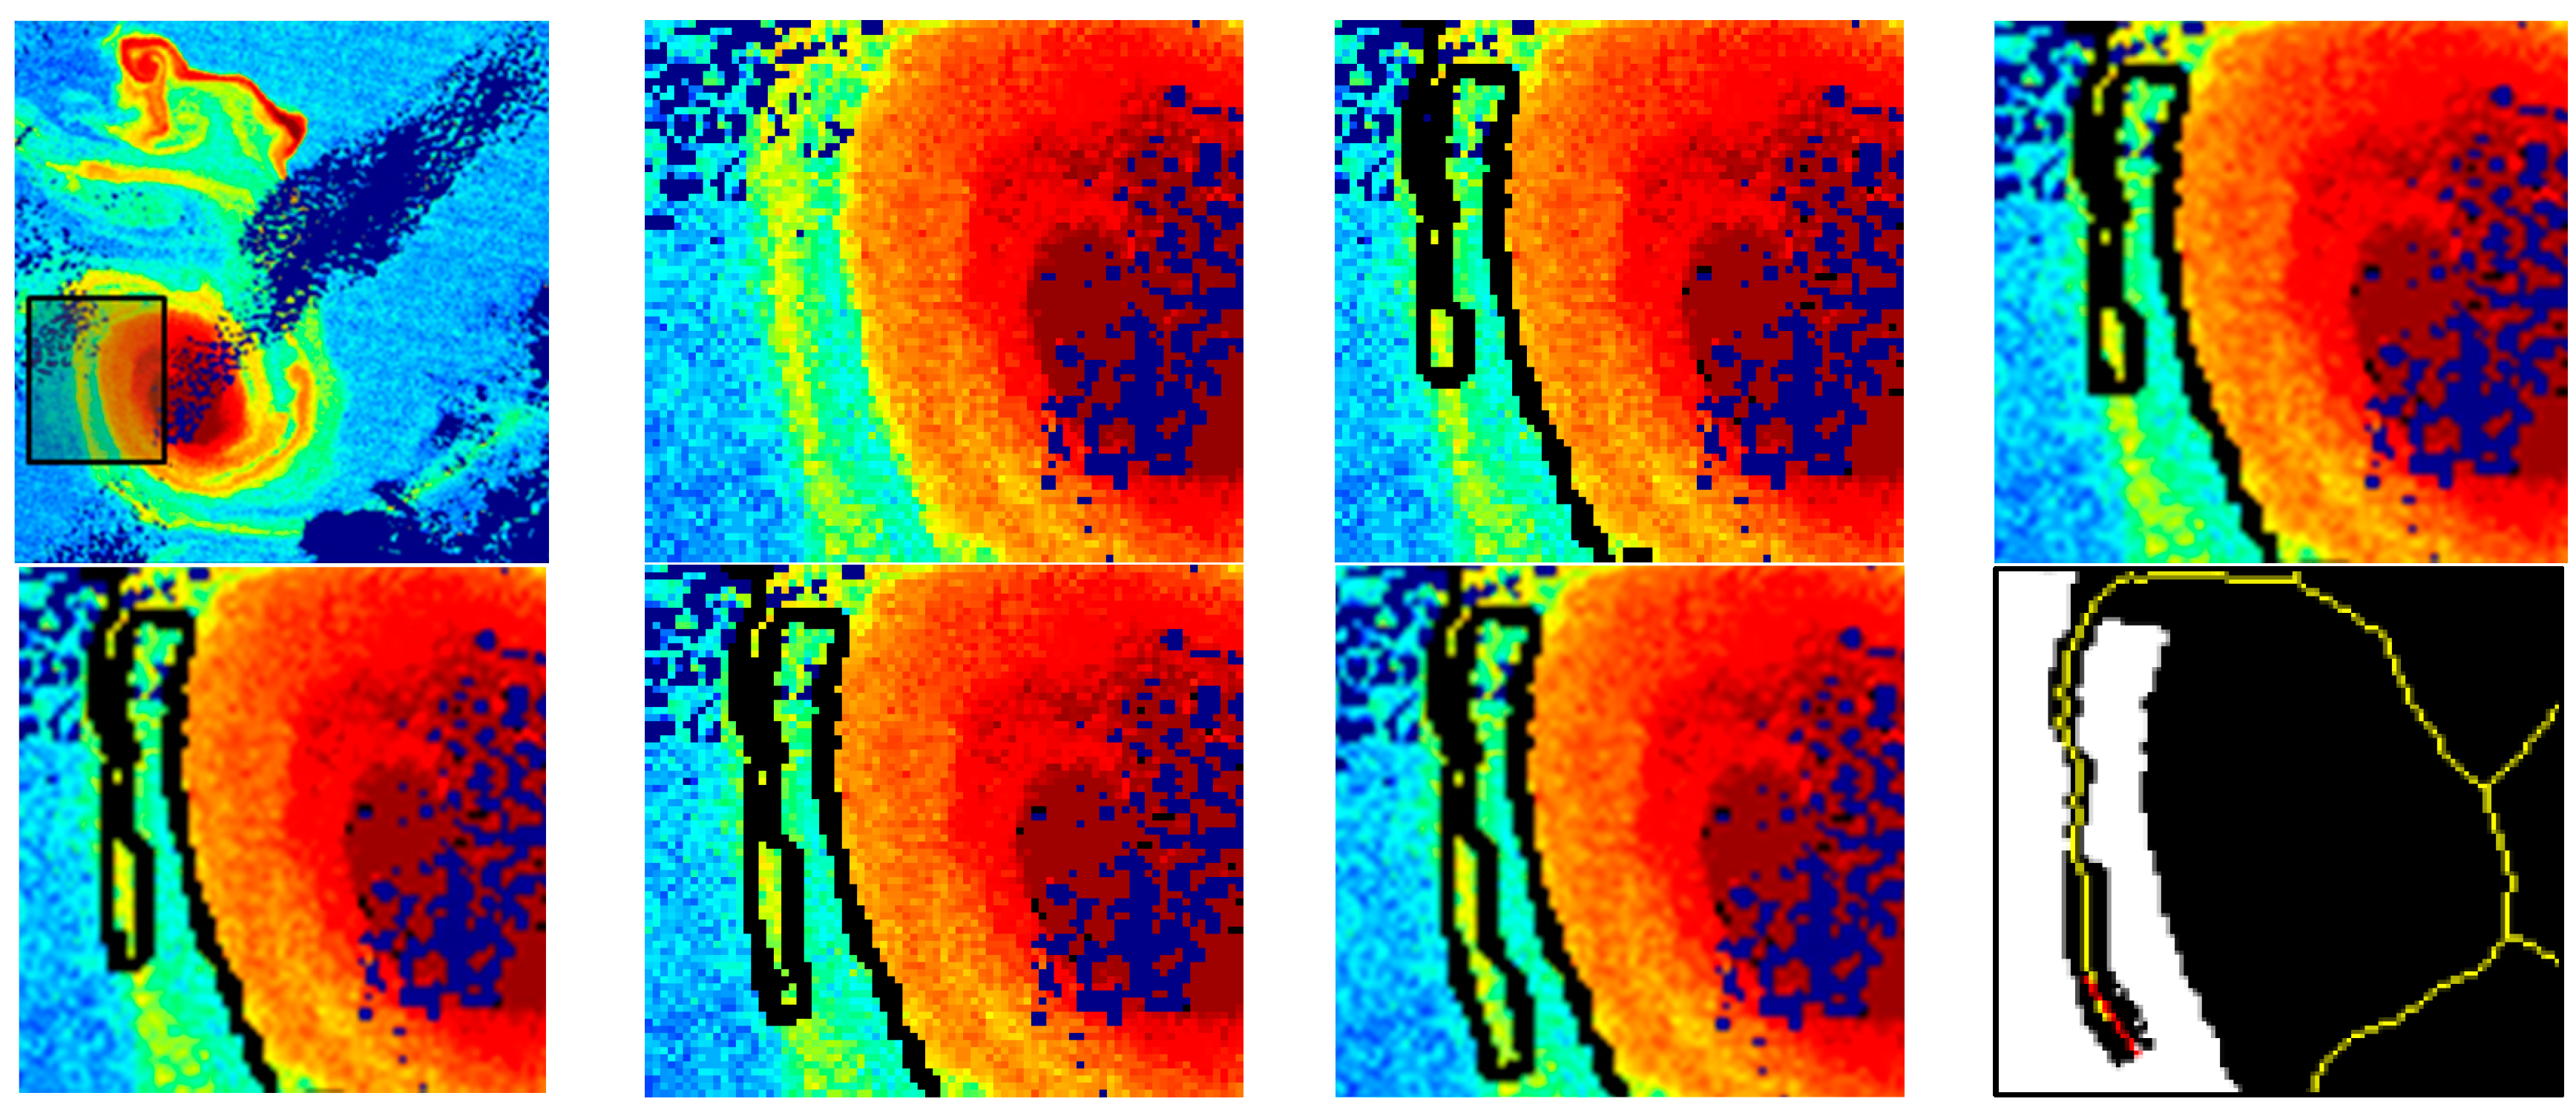
- Eddy growth: The precise delimitation is of fundamental importance when analysing the structure and its evolution, so controlled growing techniques are applied only where filaments appear. Points to grow and their directions are found using the skeleton of the initial structure detected. At each point, a window with the corresponding orientation and size masks the image and new pixels are added to the structure after the application of thresholding or watershed region growing algorithms. This process is iteratively applied to achieve the desired fine segmentation.

2.2.1. Initial Eddy Detection
Pre-Processing
Initial Segmentation

Post-Processing

2.2.2. Eddy Growing
Identification of Points to Grow and Direction
Segmentation-Based Iterative Growing
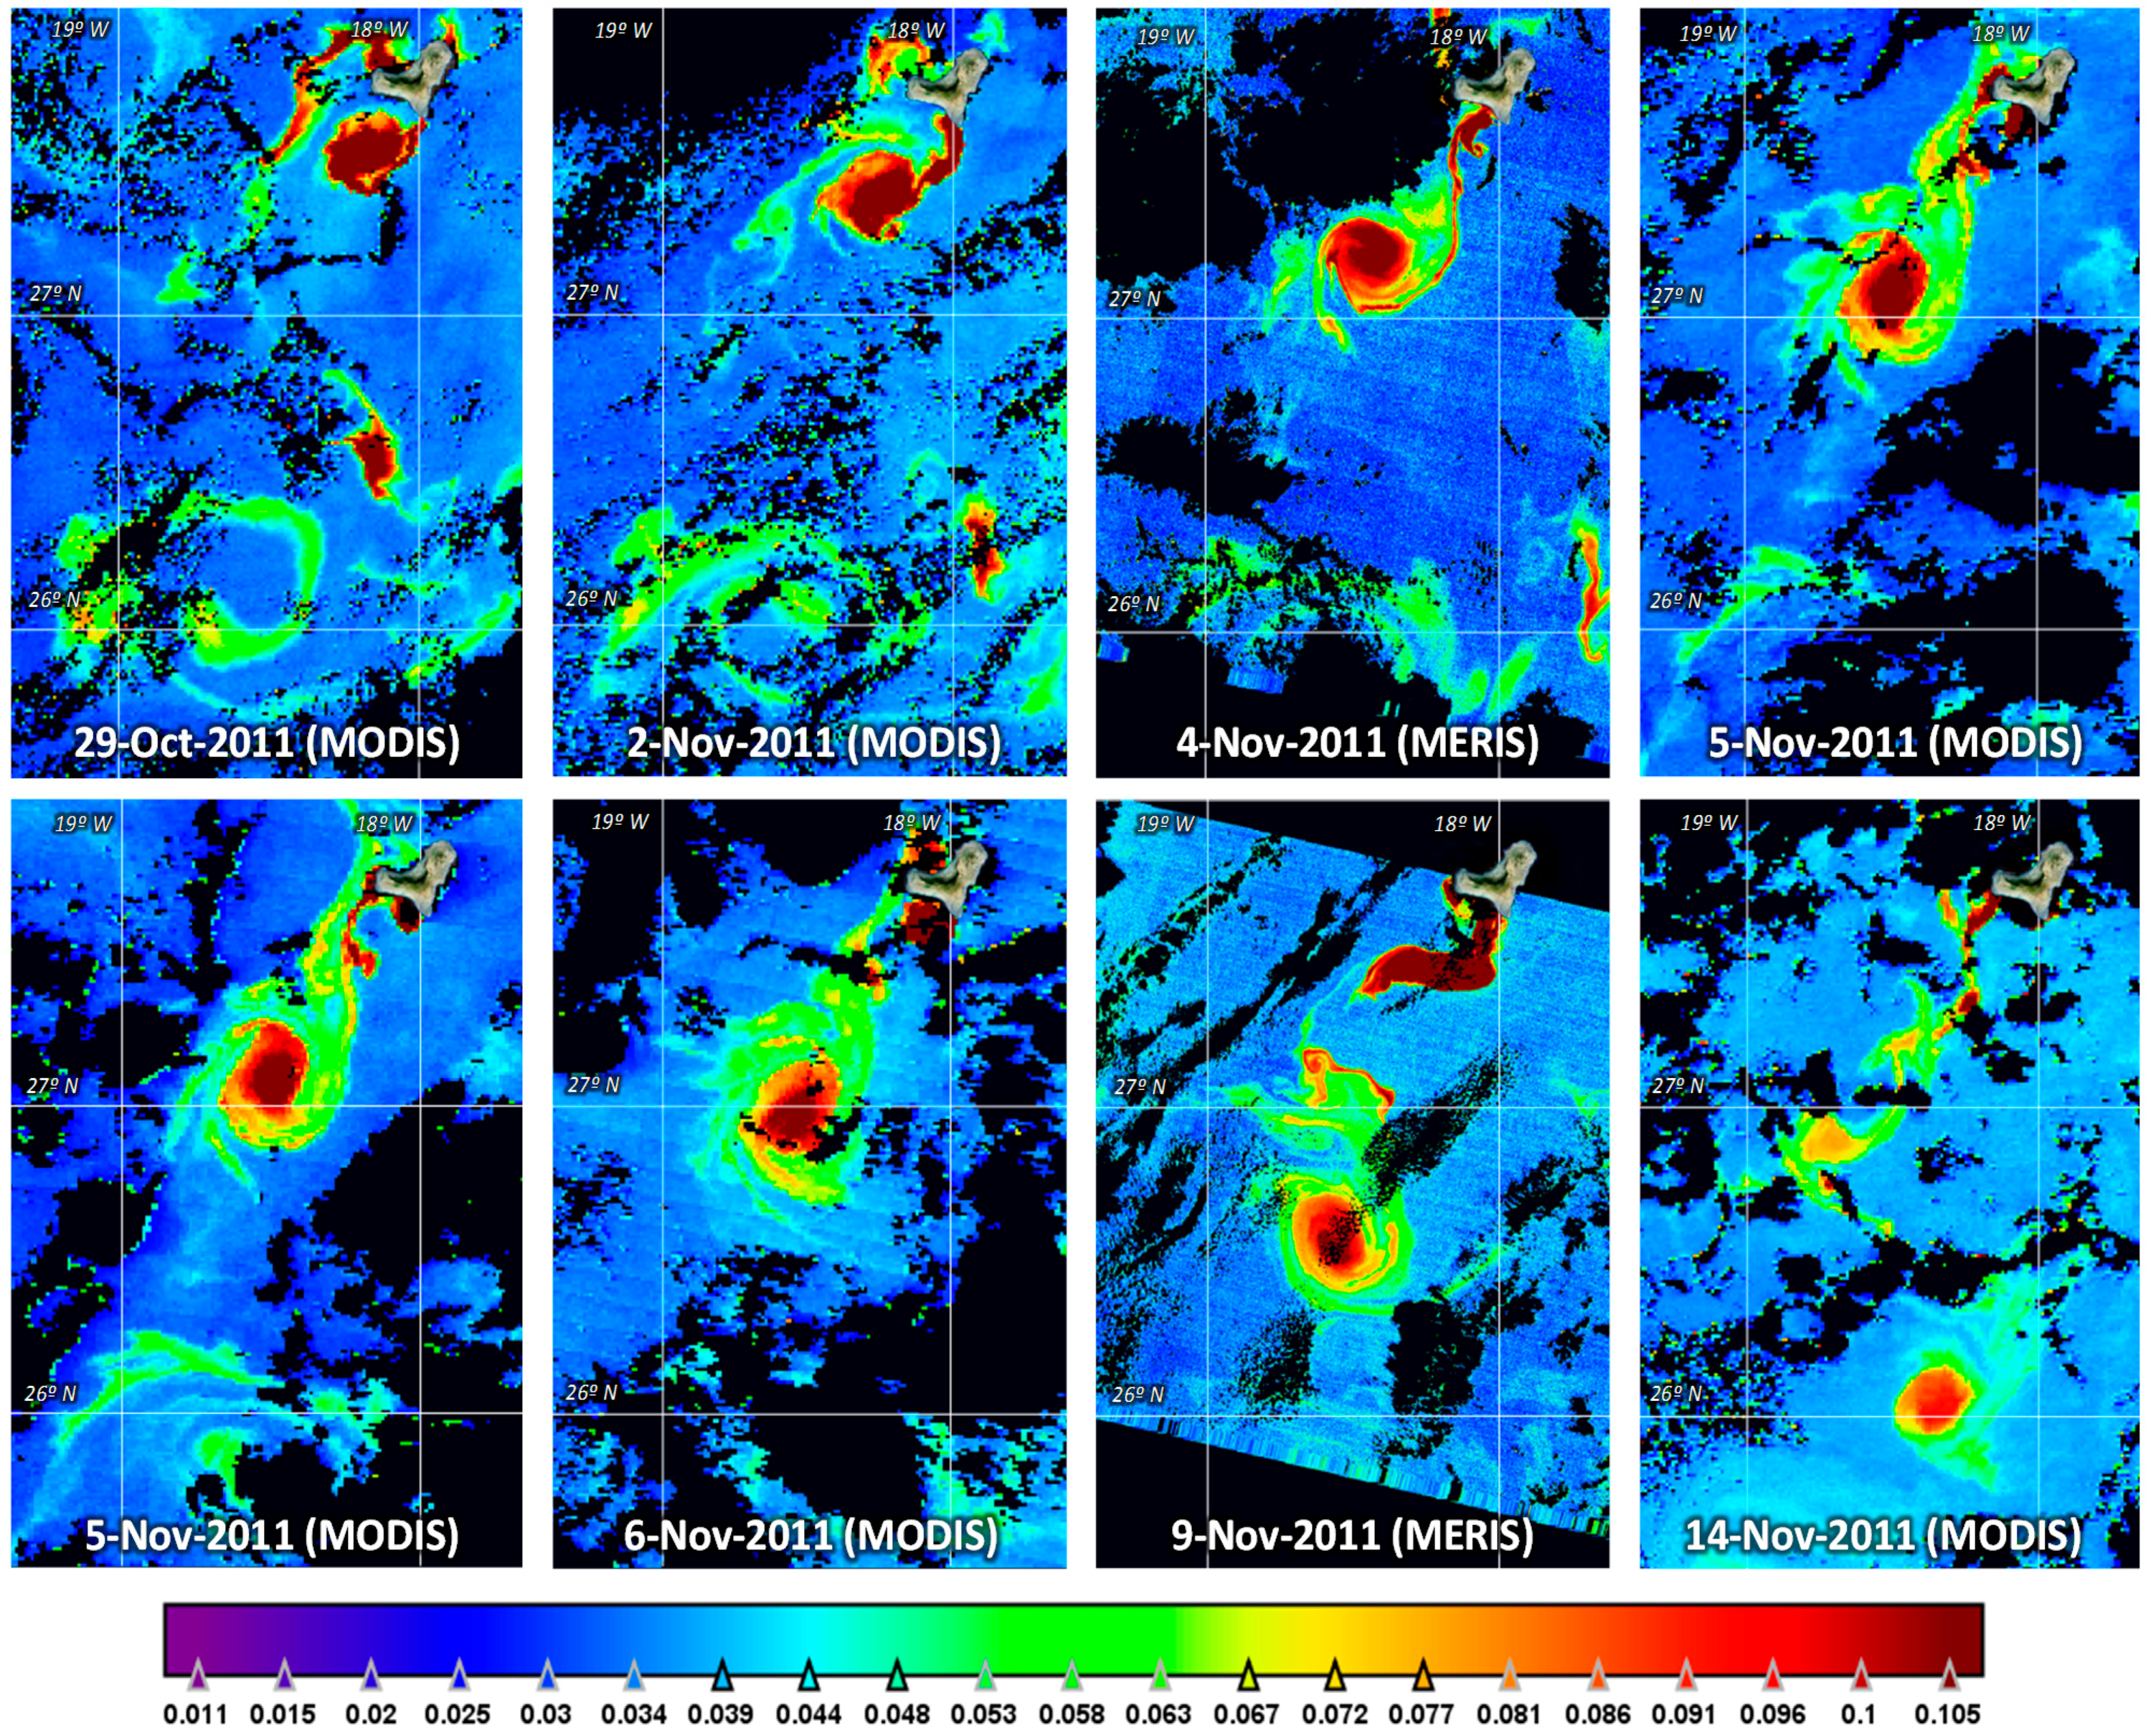
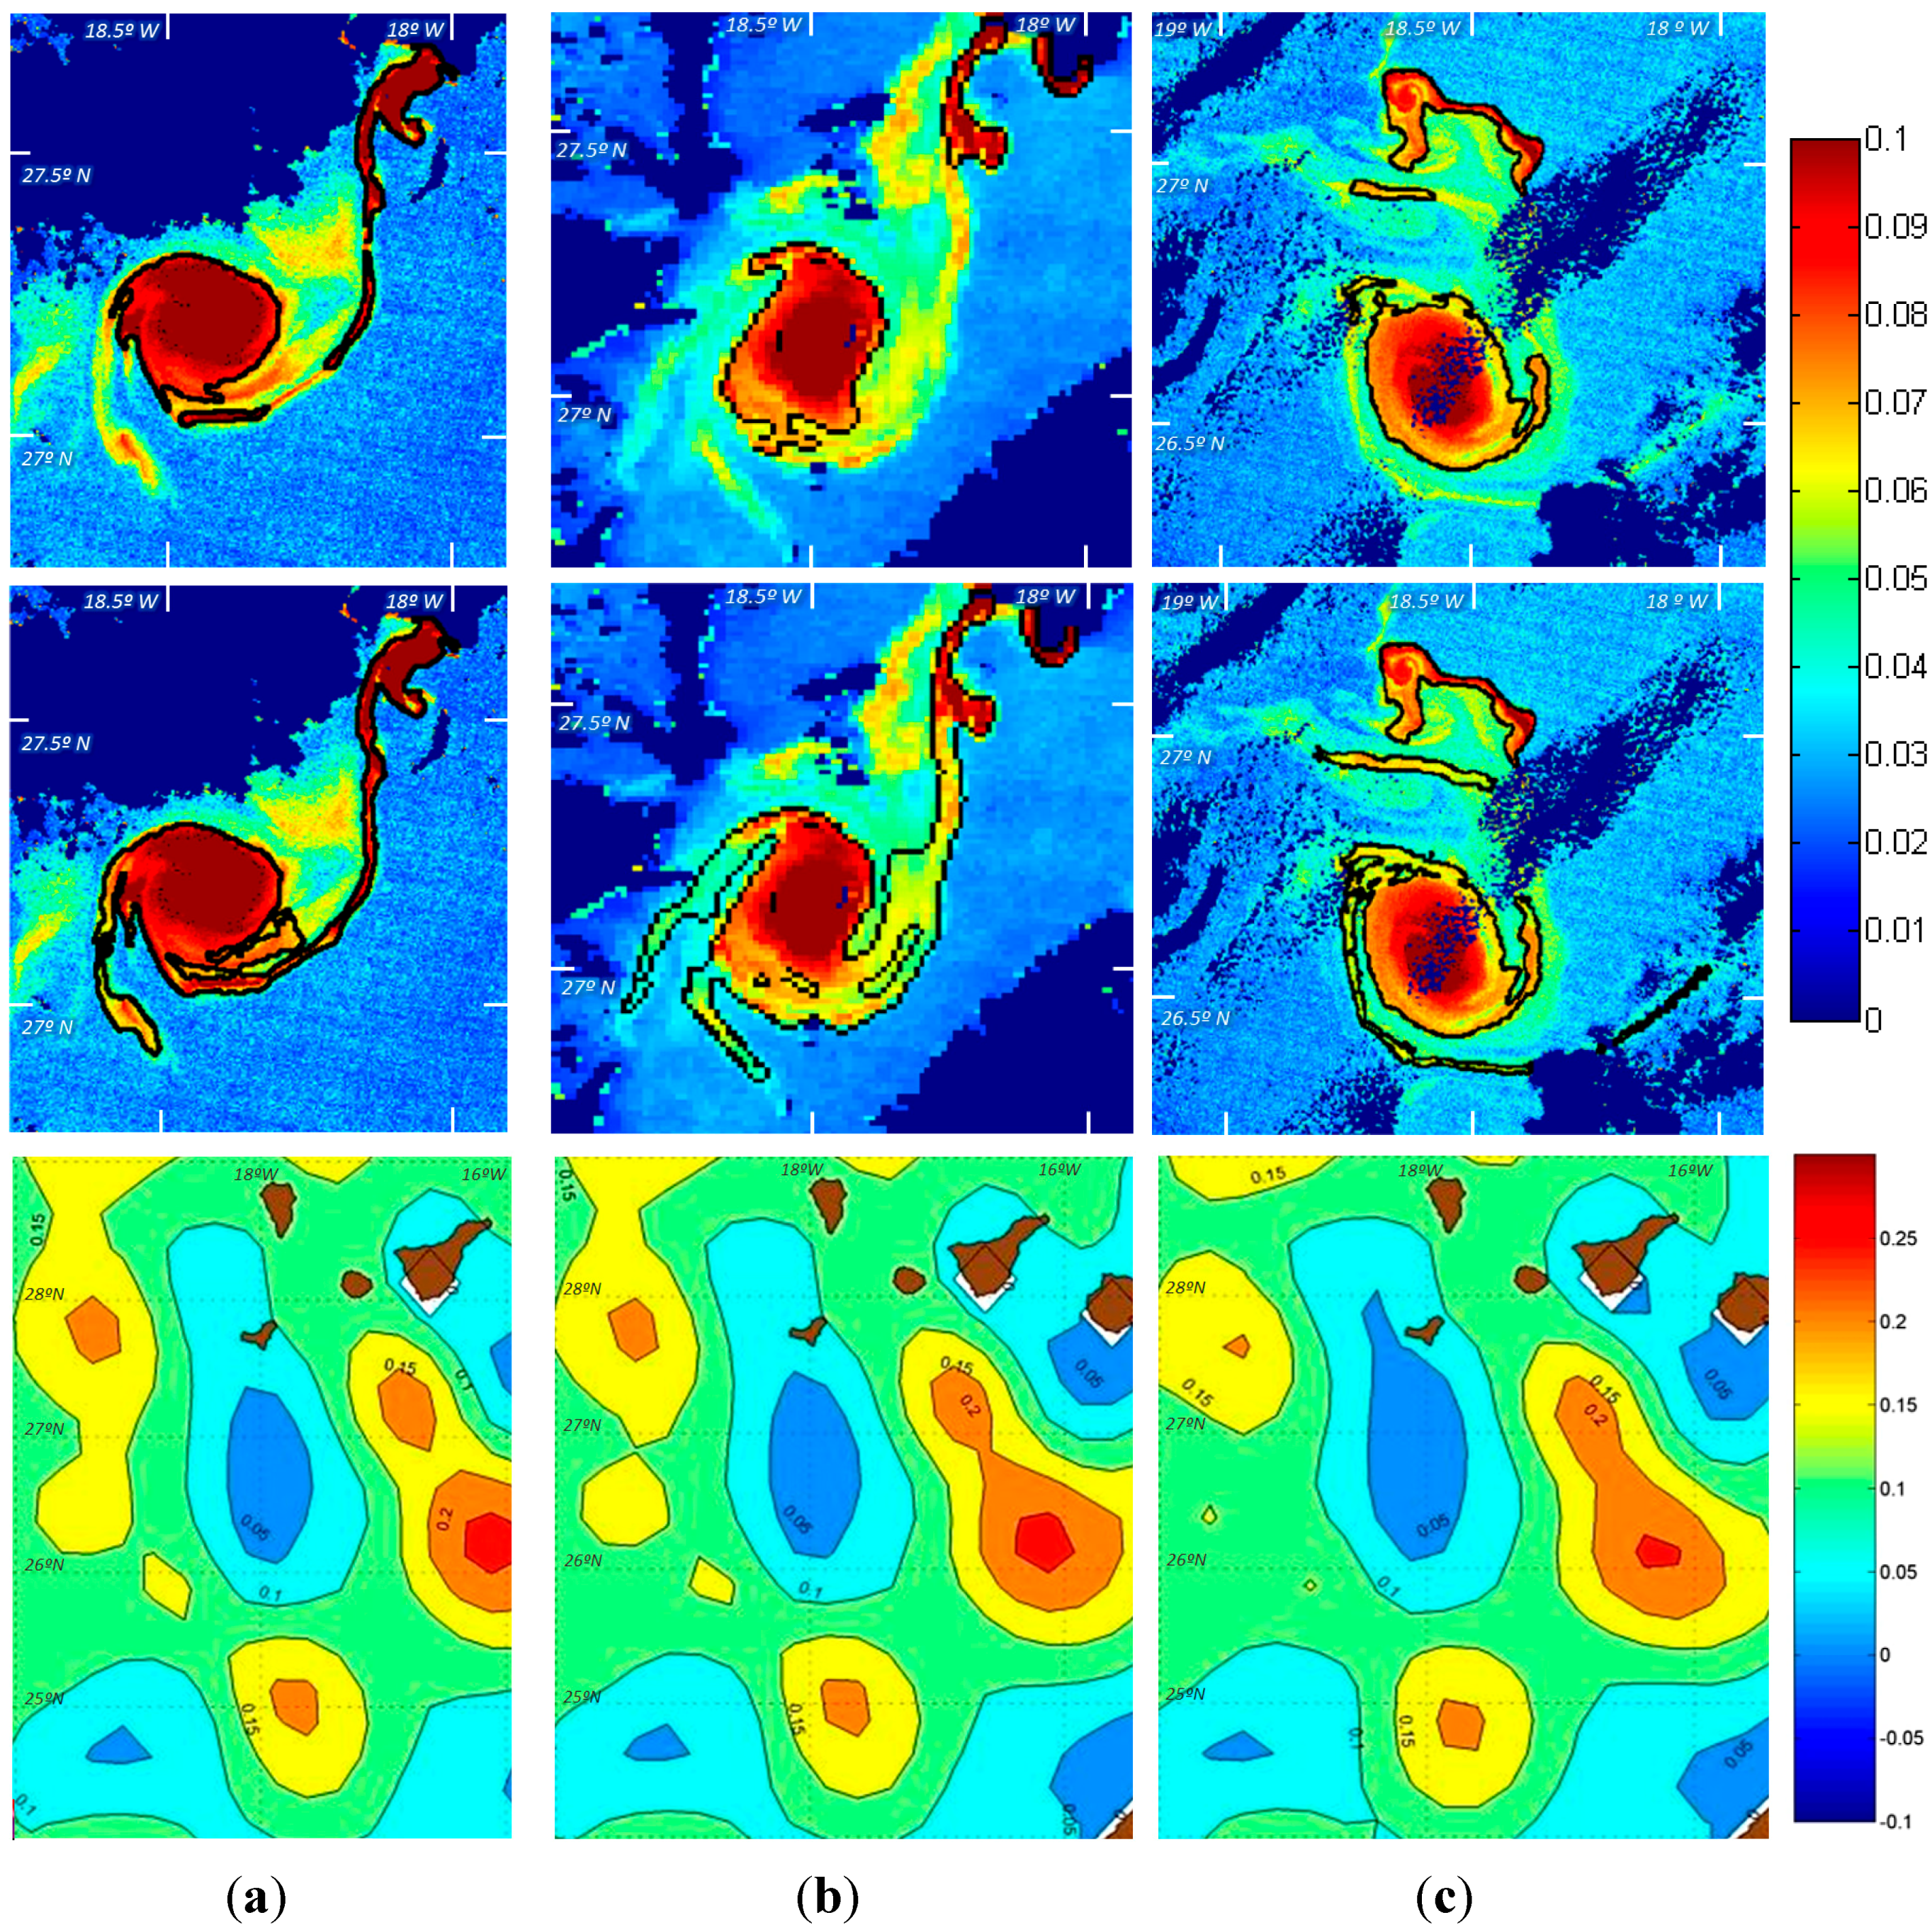
3. Results and Discussion


| Date | Centroid | Area (km2) | Perimeter (km) | Semi-Major axis (km) | Semi-Minor axis (km) | Ecc. | |
|---|---|---|---|---|---|---|---|
| Latitude | Longitude | ||||||
| November 4 | 27.1819° | −18.4426° | 623 | 187 | 15.67 | 13.23 | 0.54 |
| November 5 | 27.0866° | −18.5024° | 680 | 152 | 18.67 | 12.61 | 0.62 |
| November 9 | 26.5727° | −18.5751° | 697 | 174 | 17.22 | 13.14 | 0.65 |

4. Conclusions
Acknowledgments
Author Contributions
Conflicts of Interest
References
- Chelton, D.B.; Schlax, M.G.; Samelson, R.M. Global observations of nonlinear mesoscale eddies. Progr. Oceanogr. 2011, 91, 167–216. [Google Scholar] [CrossRef]
- McGillicuddy, D.J.; Anderson, L.A.; Bates, N.R.; Bibby, T.; Buesseler, K.O.; Carlson, C.A.; Davis, C.S.; Ewart, C.; Falkowski, P.G.; Goldthwait, S.A.; et al. Eddy/wind interactions stimulate extraordinary mid-ocean plankton blooms. Science 2007, 316, 1021–1026. [Google Scholar] [CrossRef] [PubMed]
- Danabasoglu, G.; Ferrari, R.; McWilliams, J.C. Sensitivity of an ocean general circulation model to a parameterization of near surface eddy fluxes. J. Clim. 2008, 21, 1192–1208. [Google Scholar] [CrossRef]
- Stramma, L.; Bange, H.W.; Czeschel, R.; Lorenzo, L.; Frank, M. On the role of mesoscalar eddies for the biological productivity and biogeochemistry in the eastern topical Pacific Ocean off Peru. Biogeosciences 2013, 10, 7293–7306. [Google Scholar] [CrossRef]
- Sangrà, P.; Pelegrí, J.L.; Hernández-Guerra, A.; Arregui, I.; Martín, J.M.; Marrero-Díaz, A.; Martínez, A.; Ratsimandresy, A.W.; Rodríguez-Santana, A. Life History of an anticyclonic eddy. J. Geophys. Res. 2005, 11, C03021. [Google Scholar]
- Sangrà, P.; Auladell, M.; Marrero-Díaz, A.; Pelegrí, J. L.; Fraile-Nuez, E.; Rodríguez-Santana, A.; Martín, J.M.; Mason, E.; Hernández-Guerra, A. On the nature of oceanic eddies shed by the Island of Gran Canaria. Deep-Sea Res. I 2007, 54, 687–709. [Google Scholar] [CrossRef]
- Jiménez, B.; Sangrà, P.; Mason, E. A numerical study of the relative importance of wind and topographic forcing on oceanic eddies shedding by deep water islands. Ocean Model. 2008, 22, 146–157. [Google Scholar] [CrossRef]
- Lasternas, S.; Piedeleu, M.; Sangrà, P.; Duarte, C.M.; Agustí, S. Forcing of dissolved organic carbon release by phytoplankton by anticyclonic mesoscale eddies in the subtropical NE Atlantic Ocean. Biogeosciences 2013, 10, 2129–2143. [Google Scholar] [CrossRef]
- Sangrà, P.; Pascual, A.; Rodríguez-Santana, A.; Machín, F.; Mason, E.; McWilliams, J.C.; Pelegrí, J.L.; Dong, C.; Rubio, A.; Arístegui, J.; et al. The Canary Eddy Corridor: A major pathway for long-lived eddies in the subtropical North Atlantic. Deep-Sea Res. I 2009, 56, 2100–2114. [Google Scholar] [CrossRef]
- Quartly, G.; Chen, G. Introduction to the Special Issue on “Satellite Altimetry: New Sensors and New Applications”. Sensors 2006, 6, 616–619. [Google Scholar] [CrossRef]
- Liu, Y.; Dong, C.M.; Guan, Y.; Chen, D.; McWilliams, J.; Nencioli, F. Eddy analysis in the subtropical zonal band of the North Pacific Ocean. Deep-Sea Res. I 2012, 68, 54–67. [Google Scholar] [CrossRef]
- Xiu, P.; Chai, F.; Xue, H.; Shi, L.; Chao, Y. Modeling the mesoscale eddy field in the Gulf of Alaska. Deep-Sea Res. I 2012, 63, 102–117. [Google Scholar] [CrossRef]
- Ruiz, S.; Pelegri, J.L.; Emelianov, M.; Pascual, A.; Mason, E. Geostrophic and ageostrophic circulation of a shallow anticyclonic eddy off Cape Bojador. J. Geophys. Res.-Oceans 2014, 119, 1257–1270. [Google Scholar] [CrossRef]
- Mason, E.; Pascual, A.; McWilliams, J.C. A New Sea Surface Height-Based Code for Oceanic Mesoscale Eddy Tracking. J. Atmos. Ocean. Technol. 2014, 31, 1181–1188. [Google Scholar] [CrossRef]
- Lohrenz, S.E.; Cai, W.-J.; Chen, X.; Tuel, M. Satellite Assessment of Bio-Optical Properties of Northern Gulf of Mexico Coastal Waters Following Hurricanes Katrina and Rita. Sensors 2008, 8, 4135–4150. [Google Scholar] [CrossRef]
- Shapiro, G.I.; Stanichny, S.V.; Stanychna, R.R. Anatomy of shelf-deep sea exchanges by a mesoscale eddy in the North West Black Sea as derived from remotely sensed data. Remote Sens. Environ. 2010, 114, 867–875. [Google Scholar] [CrossRef]
- Watanabe, E. Beaufort shelf break eddies and shelf-basin exchange of Pacific summer water in the western Arctic Ocean detected by satellite and modeling analyses. J. Geophys. Res.-Oceans 2011, 116, C08034. [Google Scholar]
- Alpers, W.; Brandt, P.; Lazar, A.; Dagorne, D.; Sow, B.; Faye, S.; Hansen, M.W.; Rubino, A.; Poulain, P.M.; Brehmer, P. A small-scale oceanic eddy off the coast of West Africa studied by multi-sensor satellite and surface drifter data. Remote Sens. Environ. 2013, 129, 132–143. [Google Scholar] [CrossRef]
- Dong, C.; Nencioli, F.; Liu, Y.; McWilliams, J.C. An Automated Approach to Detect Oceanic Eddies from Satellite Remote Sensed Sea Surface Temperature Data. IEEE Geosci. Remote Sens. Lett. 2011, 8, 1055–1059. [Google Scholar] [CrossRef]
- Eugenio, F.; Martin, J.; Marcello, J.; Fraile-Nuez, E. Environmental monitoring of El Hierro Island submarine volcano, by combining low and high resolution satellite imagery. Int. J. Appl. Earth Obs. Geoinf. 2014, 29, 53–66. [Google Scholar] [CrossRef]
- Fraile-Nuez, E.; González-Dávila, M.; Santana-Casiano, J.M.; Arístegui, J.; Alonso-González, I.J.; Hernández-León, S.; Blanco, M.J.; Rodríguez-Santana, A.; Hernández-Guerra, A.; Gelado-Caballero, M.D.; et al. The Submarine Volcano Eruption at the Island of El Hierro: Physical-chemical Perturbation and Biological Response. Sci. Rep. 2012. [Google Scholar] [CrossRef]
- Yi, J.; Du, Y.; He, Z.; Zhou, C. Enhancing the accuracy of automatic eddy detection and the capability of recognizing the multi-core structures from maps of sea level anomaly. Ocean Sci. 2014, 10, 39–48. [Google Scholar] [CrossRef]
- Vantaram, S.R.; Saber, E. Survey of contemporary trends in color image segmentation. J. Electron. Imaging 2012, 21, 9011–90128. [Google Scholar] [CrossRef]
- Thakur, P.; Madaan, N. A survey of Image Segmentation Techniques. Int. J. Res. Comput. Appl. Robot. 2014, 2, 158–165. [Google Scholar]
- Agarwal, M.; Singh, V. A Methodological Survey and Proposed Algorithm on Image Segmentation using Genetic Algorithm. Int. J. Comput. Appl. 2013, 67, 7–17. [Google Scholar]
- Dey, V.; Zhang, Y.; Zhong, M. A review of image segmentation techniques with remote sensing perspective. In Proceedings of the ISPRS TC VII Symposium–100 Years ISPRS, Vienna, Austria, 5–7 July 2010.
- Narkhede, H.P. Review of Image Segmentation Techniques. Int. J. Sci. Mod. Eng. 2013, 1, 54–61. [Google Scholar]
- Zhang, Y.; Liu, X.; Yin, Y.; Wang, M.; Qin, B. A simple optical model to estimate diffuse attenuation coefficient of photosynthetically active radiation in an extremely turbid lake from surface reflectance. Opt. Express 2012, 20, 18. [Google Scholar]
- Ackermann, S.; Frey, R.; Strabala, K.; Liu, Y.; Gumley, L.; Baum, B.; Menzel, P.H. Discriminating clear-sky form cloud with MODIS. In NASA_MODIS Algorithm Theoretical Basis Document (MOD35); University of Wisconsin: Madison, WI, USA, 2010; Version 6.1. [Google Scholar]
- Marcello, J.; Marqués, F.; Eugenio, F. Automatic tool for the precise detection of upwelling and filaments in remote sensing imagery. IEEE Trans. Geosci. Remote Sens. 2005, 43, 1605–1616. [Google Scholar] [CrossRef]
- Marcello, J.; Eugenio, F.; Marqués, F. Evaluation of thresholding techniques applied to oceanographic remote sensing imagery. In Proceedings of the SPIE-Remote Sensing Europe, Maspalomas, Spain, 10 November 2004.
- Soille, P. Morphological Image Analysis: Principles and Applications; Springer-Verlag: Berlin, Germany, 2003. [Google Scholar]
- AVISO. Available online: http://www.aviso.altimetry.fr/en/home.html (accessed on 3 March 2014).
- Dong, C.; McWilliams, J.C.; Shchepetkin, A. Island wakes in deep water. J. Phys. Oceanogr. 2007, 37, 962–998. [Google Scholar] [CrossRef]
- Koumoutsakos, P. Inviscid Axisymmetrization of an Elliptical Vortex. J. Comput. Phys. 1997, 138, 821–857. [Google Scholar] [CrossRef]
© 2015 by the authors; licensee MDPI, Basel, Switzerland. This article is an open access article distributed under the terms and conditions of the Creative Commons Attribution license (http://creativecommons.org/licenses/by/4.0/).
Share and Cite
Marcello, J.; Eugenio, F.; Estrada-Allis, S.; Sangrà, P. Segmentation and Tracking of Anticyclonic Eddies during a Submarine Volcanic Eruption Using Ocean Colour Imagery. Sensors 2015, 15, 8732-8748. https://doi.org/10.3390/s150408732
Marcello J, Eugenio F, Estrada-Allis S, Sangrà P. Segmentation and Tracking of Anticyclonic Eddies during a Submarine Volcanic Eruption Using Ocean Colour Imagery. Sensors. 2015; 15(4):8732-8748. https://doi.org/10.3390/s150408732
Chicago/Turabian StyleMarcello, Javier, Francisco Eugenio, Sheila Estrada-Allis, and Pablo Sangrà. 2015. "Segmentation and Tracking of Anticyclonic Eddies during a Submarine Volcanic Eruption Using Ocean Colour Imagery" Sensors 15, no. 4: 8732-8748. https://doi.org/10.3390/s150408732
APA StyleMarcello, J., Eugenio, F., Estrada-Allis, S., & Sangrà, P. (2015). Segmentation and Tracking of Anticyclonic Eddies during a Submarine Volcanic Eruption Using Ocean Colour Imagery. Sensors, 15(4), 8732-8748. https://doi.org/10.3390/s150408732