Article

CO Sensing Performance of a Micro Thermoelectric Gas Sensor with AuPtPd/SnO2 Catalyst and Effects of a Double Catalyst Structure with Pt/α-Al2O3

National Institute of Advanced Industrial Science and Technology (AIST), 2266-98 Shimo-Shidami, Moriyama-ku, Nagoya 463-8560, Japan
*
Authors to whom correspondence should be addressed.
Present address: The Institute of Scientific and Industrial Research (ISIR), Osaka University, 8-1 Mihogaoka, Ibaraki, Osaka 567-0047, Japan
Sensors 2015, 15(12), 31687-31698; https://doi.org/10.3390/s151229873
Submission received: 12 November 2015 / Revised: 9 December 2015 / Accepted: 9 December 2015 / Published: 15 December 2015
(This article belongs to the Section Chemical Sensors)

Abstract

:
The CO sensing properties of a micro thermoelectric gas sensor (micro-TGS) with a double AuPtPd/SnO2 and Pt/α-Al2O3 catalyst were investigated. While several nanometer sized Pt and Pd particles were uniformly dispersed on SnO2, the Au particles were aggregated as particles measuring >10 nm in diameter. In situ diffuse reflectance Fourier transform Infrared spectroscopy (DRIFT) analysis of the catalyst showed a CO adsorption peak on Pt and Pd, but no clear peak corresponding to the interaction between CO and Au was detected. Up to 200 °C, CO combustion was more temperature dependent than that of H2, while H2 combustion was activated by repeated exposure to H2 gas during the periodic gas test. Selective CO sensing of the micro-TGS against H2 was attempted using a double catalyst structure with 0.3–30 wt% Pt/α-Al2O3 as a counterpart combustion catalyst. The sensor output of the micro-TGS decreased with increasing Pt content in the Pt/α-Al2O3 catalyst, by cancelling out the combustion heat from the AuPtPd/SnO2 catalyst. In addition, the AuPtPd/SnO2 and 0.3 wt% Pt/α-Al2O3 double catalyst sensor showed good and selective CO detection. We therefore demonstrated that our micro-TGS with double catalyst structure is useful for controlling the gas selectivity of CO against H2.

Graphical Abstract

1. Introduction

Breath gas contains a range of marker gases that can be associated with disease and metabolism [1,2]. These gases, including CO, H2, and CH4, are present in concentrations of several ppm, and hence, accurate analysis of low concentrations of the gases is important for medical applications. In addition, for regular hospital health checks, the gas detector must be easy to adjust and give a fast response. We propose a micro thermoelectric gas sensor (micro-TGS), which uses the thermoelectric detection of a combustion catalyst, for monitoring H2 [3,4], CO [5,6,7], and CH4 [8,9] in human breath gas. The micro-TGS is an inflammable gas sensor with promising gas responsivity, and shows a clear linear relationship to allow the detection of gases at the ppm level [3].
Au-loaded catalysts have been reported for use in micro-TGSs for CO detection, with Au/Co3O4 catalysts exhibiting high selectivity to CO but low detection sensitivity [5,6]. Loading of Au, Pt, and Pd on cobalt oxide (Co3O4 and CoO) catalysts has been reported to improve the detection sensitivity to CO [7], as Pt and Pd particles are also widely used as catalysts for CO oxidation [10,11]. The micro-TGS containing the AuPtPd/CoO catalyst exhibited improved performance at 1 ppm CO in dry air, and good selectivity towards CO over H2 gas [7]. However, a reduction in CO sensitivity of the cobalt oxide catalysts was observed upon continuous use of the micro-TGS [6]. It is assumed that the deactivation of Au particles [12] or cobalt oxide [13] may cause this reduction in CO sensitivity. We therefore chose to focus on SnO2 as a catalyst support for the micro-TGS. SnO2 is a well-known n-type semiconducting oxide, and is used in semiconductor-type gas sensors. In addition, studies into the CO oxidation activity of SnO2 catalysts either with or without noble metals have been previously reported [14,15,16]. Sakai and Itoh reported the sensing properties of Pt, Pd, and Au loaded on SnO2 (AuPtPd/SnO2) thick films as semiconductor-type gas sensors for volatile organic compounds (VOCs). As the addition of three noble metals to SnO2 appears to improve their sensitivity to VOCs [17,18], we attempted the incorporation of an AuPtPd/SnO2 combustion catalyst in our micro-TGS for CO detection.
In the micro-TGS systems, the selectivity of the AuPtPd/SnO2 catalyst must be easily controllable. The H2 selectivity for the micro-TGS containing a Pt/α-Al2O3 catalyst can be controlled by the operating temperature, as the catalyst operating temperature is approximately 100 °C [3,4]. However, for CO and CH4, selectivity is lower, as a higher catalyst temperature is required for the oxidation of CO and CH4. In this context, we previously attempted to control CO and CH4 selectivity using a “double catalyst structure” [8,19]. This structure adjusts the balance of the combustion heats of catalysts deposited on the thermoelectric film in the micro-TGS device. Thus, changes in the sensing properties of the micro-TGS are expected when employing the double catalyst structure.
We herein report our investigations into the sensing properties of an AuPtPd/SnO2 catalyst on a micro-TGS using a double catalyst structure design. The CO oxidation properties and sensing properties were compared using diffuse reflectance infrared Fourier transform spectroscopy and morphological observations. Furthermore, the effects of the double catalyst structure containing a Pt/α-Al2O3 catalyst on the selective CO sensing properties of the micro-TGS are also discussed.

2. Experimental Section

2.1. Preparation of the Double Catalyst Micro-TGS

The micro-TGS device measuring 4 × 4 mm2 was composed of a p-type B-doped SiGe pattern, a Pt heater, and an electrode line pattern on a double-sided polished Si substrate. Processing details for the B-doped SiGe thin film and its pattern were reported previously [4]. The Pt micro-heater and electrode lines were prepared using a lift-off technique, and the reverse side of the Si substrate was etched out using an aqueous KOH solution to prepare the membrane structure.
The AuPtPd/SnO2 catalyst powder was prepared by reference to Itoh’s method [18] and is represented schematically in Figure 1. Au, Pt, and Pd colloids were purchased from Tanaka Kikinzoku Kogyo K.K., Tokyo, Japan, respectively. A catalyst containing 1 wt% Au (2 wt% Au colloidal suspension), 1 wt% Pt (4 wt% Pt colloidal suspension), and 1 wt% Pd (4 wt% Pd colloidal suspension) was added to SnO2 powder (particle size 100 nm; Sigma-Aldrich, St. Louis, MO, USA) in water. Mixing was carried out at 70 °C, followed by drying at 90 °C to give the catalyst powder. This powder was calcined at 350 °C in an electric furnace for 2 h under air. The calcined powder was then dispersed in ethanol, and the floating particles retrieved and mixed with a vehicle containing terpineol, ethyl cellulose, and distilled water (9:1:5 wt. ratio) to give a paste. The catalyst pastes were then applied to the micro-TGS device using an air dispenser (MUSASHI Engineering, Inc., Tokyo, Japan), and the devices were calcined at 300 °C for 2 h. Finally, the devices were mounted on stems, and connected using gold-bonding wire to prepare the micro-TGS.
Figure 1. Schematic representation of the AuPtPd/SnO2 catalyst powder and micro thermoelectric gas sensor (micro-TGS) preparation.
Sensors 15 29873 g001
To enhance the micro-TGS selectivity of CO over H2, a double catalyst structure was employed, as described in previous reports [8]. The Pt/α-Al2O3 catalyst powder (0.3, 3, and 30 wt%) for H2 combustion was prepared by mixing and subsequent calcination at 300 °C, as described previously [3,4].
The structure and working principle of the double catalyst micro-TGS are based on our previously reported study [8,19]. As shown in Figure 2, AuPtPd/SnO2 and 0.3–30 wt% Pt/α-Al2O3 catalysts were deposited on the hot (point A) and cold (point B) side of a micro-TGS device, respectively. Hot side indicates a position to commonly put a catalyst, and cold side show the position of without catalyst on micro-TGS. It is expected that the AuPtPd/SnO2 catalyst will oxidize both H2 and CO. However, Pt/α-Al2O3 is a combustion catalyst for H2, [3,4] hence, the combustion heat of the Pt/α-Al2O3 catalyst (at point B) reduces the temperature difference between the points A and B. As a result, when a mixture of H2 and CO is introduced into the calorimetric-TGS device, the sensor response of the AuPtPd/SnO2 catalyst to H2 will be inhibited. The design and composition of single and double catalyst type structures of the AuPtPd/SnO2 and 0.3–30 wt% Pt/α-Al2O3 catalysts of the micro-TGSs are given in Figure 3 and Table 1.
Figure 2. Optical images of the AuPtPd/SnO2 and Pt/Al2O3 catalysts on the Si membrane of the micro-TGS (a), and a side view of the double catalyst structure (b).
Sensors 15 29873 g002
Figure 3. Double catalyst structures with AuPtPd/SnO2 (A: Hot side) and 0.3–30 wt% Pt/α-Al2O3 (B: Cold side) catalysts for the micro-TGS: (a) No Pt catalyst; (b) 0.3 wt% Pt catalyst; (c) 3 wt% Pt catalyst, and (d) 30 wt% Pt catalyst.
Sensors 15 29873 g003
Table 1. Design of AuPtPd/SnO2 and Pt/α-Al2O3 double catalyst structures.
NotationDesignPt content in Pt/α-Al2O3
wt%
0PtAuPtPd/SnO2 + no catalyst0
0.3PtAuPtPd/SnO2 + Pt/α-Al2O30.3
3PtAuPtPd/SnO2 + Pt/α-Al2O33
30PtAuPtPd/SnO2 + Pt/α-Al2O330

2.2. Catalyst Powder Characterization

The morphology of the catalyst powder was observed by transmission electron microscopy (TEM; Tecnai Osiris, FEI, OR, USA) with high-angle annular dark field scanning transmission electron microscopy (STEM-HAADF), at an accelerating voltage of 200 kV. Elemental mapping of Au, Pt, Pd, and Sn was carried out using STEM-energy dispersive X-ray spectroscopy (STEM-EDS). CO adsorption and oxidation of the catalyst powder were investigated by diffuse reflectance Fourier transform Infrared spectroscopy (DRIFT) analysis (Nexus 470 FTIR, Nicolet, Waltham, MA, USA), at 25, 50, 100, 200, and 300 °C. As measurement gases, 10,000 ppm CO in dry air and 10,000 ppm CO in Ar were used at a flow rate of 50 cm3/min. DRIFT spectra were measured in absorbance mode without switching carrier gas (Air or Ar).

2.3. Investigation of Gas Sensing Properties

Measurement system of sensing properties of micro-TGS is shown in Figure 4. The sensor response of micro-TGS for H2, CO, and CH4 was investigated using a gas flow chamber with a volume of 60 cm3. The voltage applied to the micro-TGS device was adjusted to control the heater temperatures (50–250 °C) and was monitored using an IR camera (LAIRD-270A, Nikon Co., Tokyo, Japan). To test the micro-TGS, pure dry air was allowed to flow into the chamber together with the test gases (in dry air) in the following order: Dry air, test gas, and dry air. Each step lasted 90 s with a gas flow rate of 200 cm3/min. The voltage across the thermoelectric thin film of the micro-TGS varied by the combustion heat of the catalysts, a phenomenon based on the Seebeck principle. The voltage signal (Vs) was corrected using a digital multimeter (K2700, TFF Co. Keithley Inst., Tokyo, Japan) following pretreatment of the double catalyst micro-TGS with 10,000 ppm H2 in dry air at 200 °C. The response of Vs (ΔV) is defined by Equation (1):
ΔV = Vs(170–180)Vs(80–90)
where Vs(170–180) and Vs(80–90) are the averages of Vs over 170–180 s (in test gas) and 80–90 s (in dry air), respectively. The sensor response was investigated by measuring the voltage across the micro-TGS at 1000 ppm CO, H2, and CH4 at 50–250 °C and 10–10,000 ppm CO or H2 at 200 °C. The stability of the sensor responses was determined by subjecting the micro-TGS to a gas sensitivity test at 200 °C, for 1, 2, and 9 days.
Figure 4. Measurement system of gas sensing properties of micro-TGS.
Sensors 15 29873 g004

3. Results and Discussion

3.1. Catalyst Microstructure

Figure 5 shows the TEM images of the AuPtPd/SnO2 catalyst powder. Both well-dispersed SnO2 particles (20–50 nm) (Figure 5a), and small metal particles (3 nm) supported on SnO2 particles can clearly be seen (Figure 5b). It should be noted here that the high combustion performance of the catalyst is affected by its porous structure and particle size. The grain size of the aggregated metal particles was several nanometers, similar to the starting colloidal particle, resulting in relatively good dispersion. However, to investigate whether each metal element (i.e., Pt, Pd, and Au) is alloyed or not, the catalyst was analyzed by STEM and elemental mapping.
Figure 5. Transmission electron microscopy (TEM) images of the AuPtPd/SnO2 catalyst powder: (a) low magnification (17,500) and (b) high magnification (88,000).
Sensors 15 29873 g005
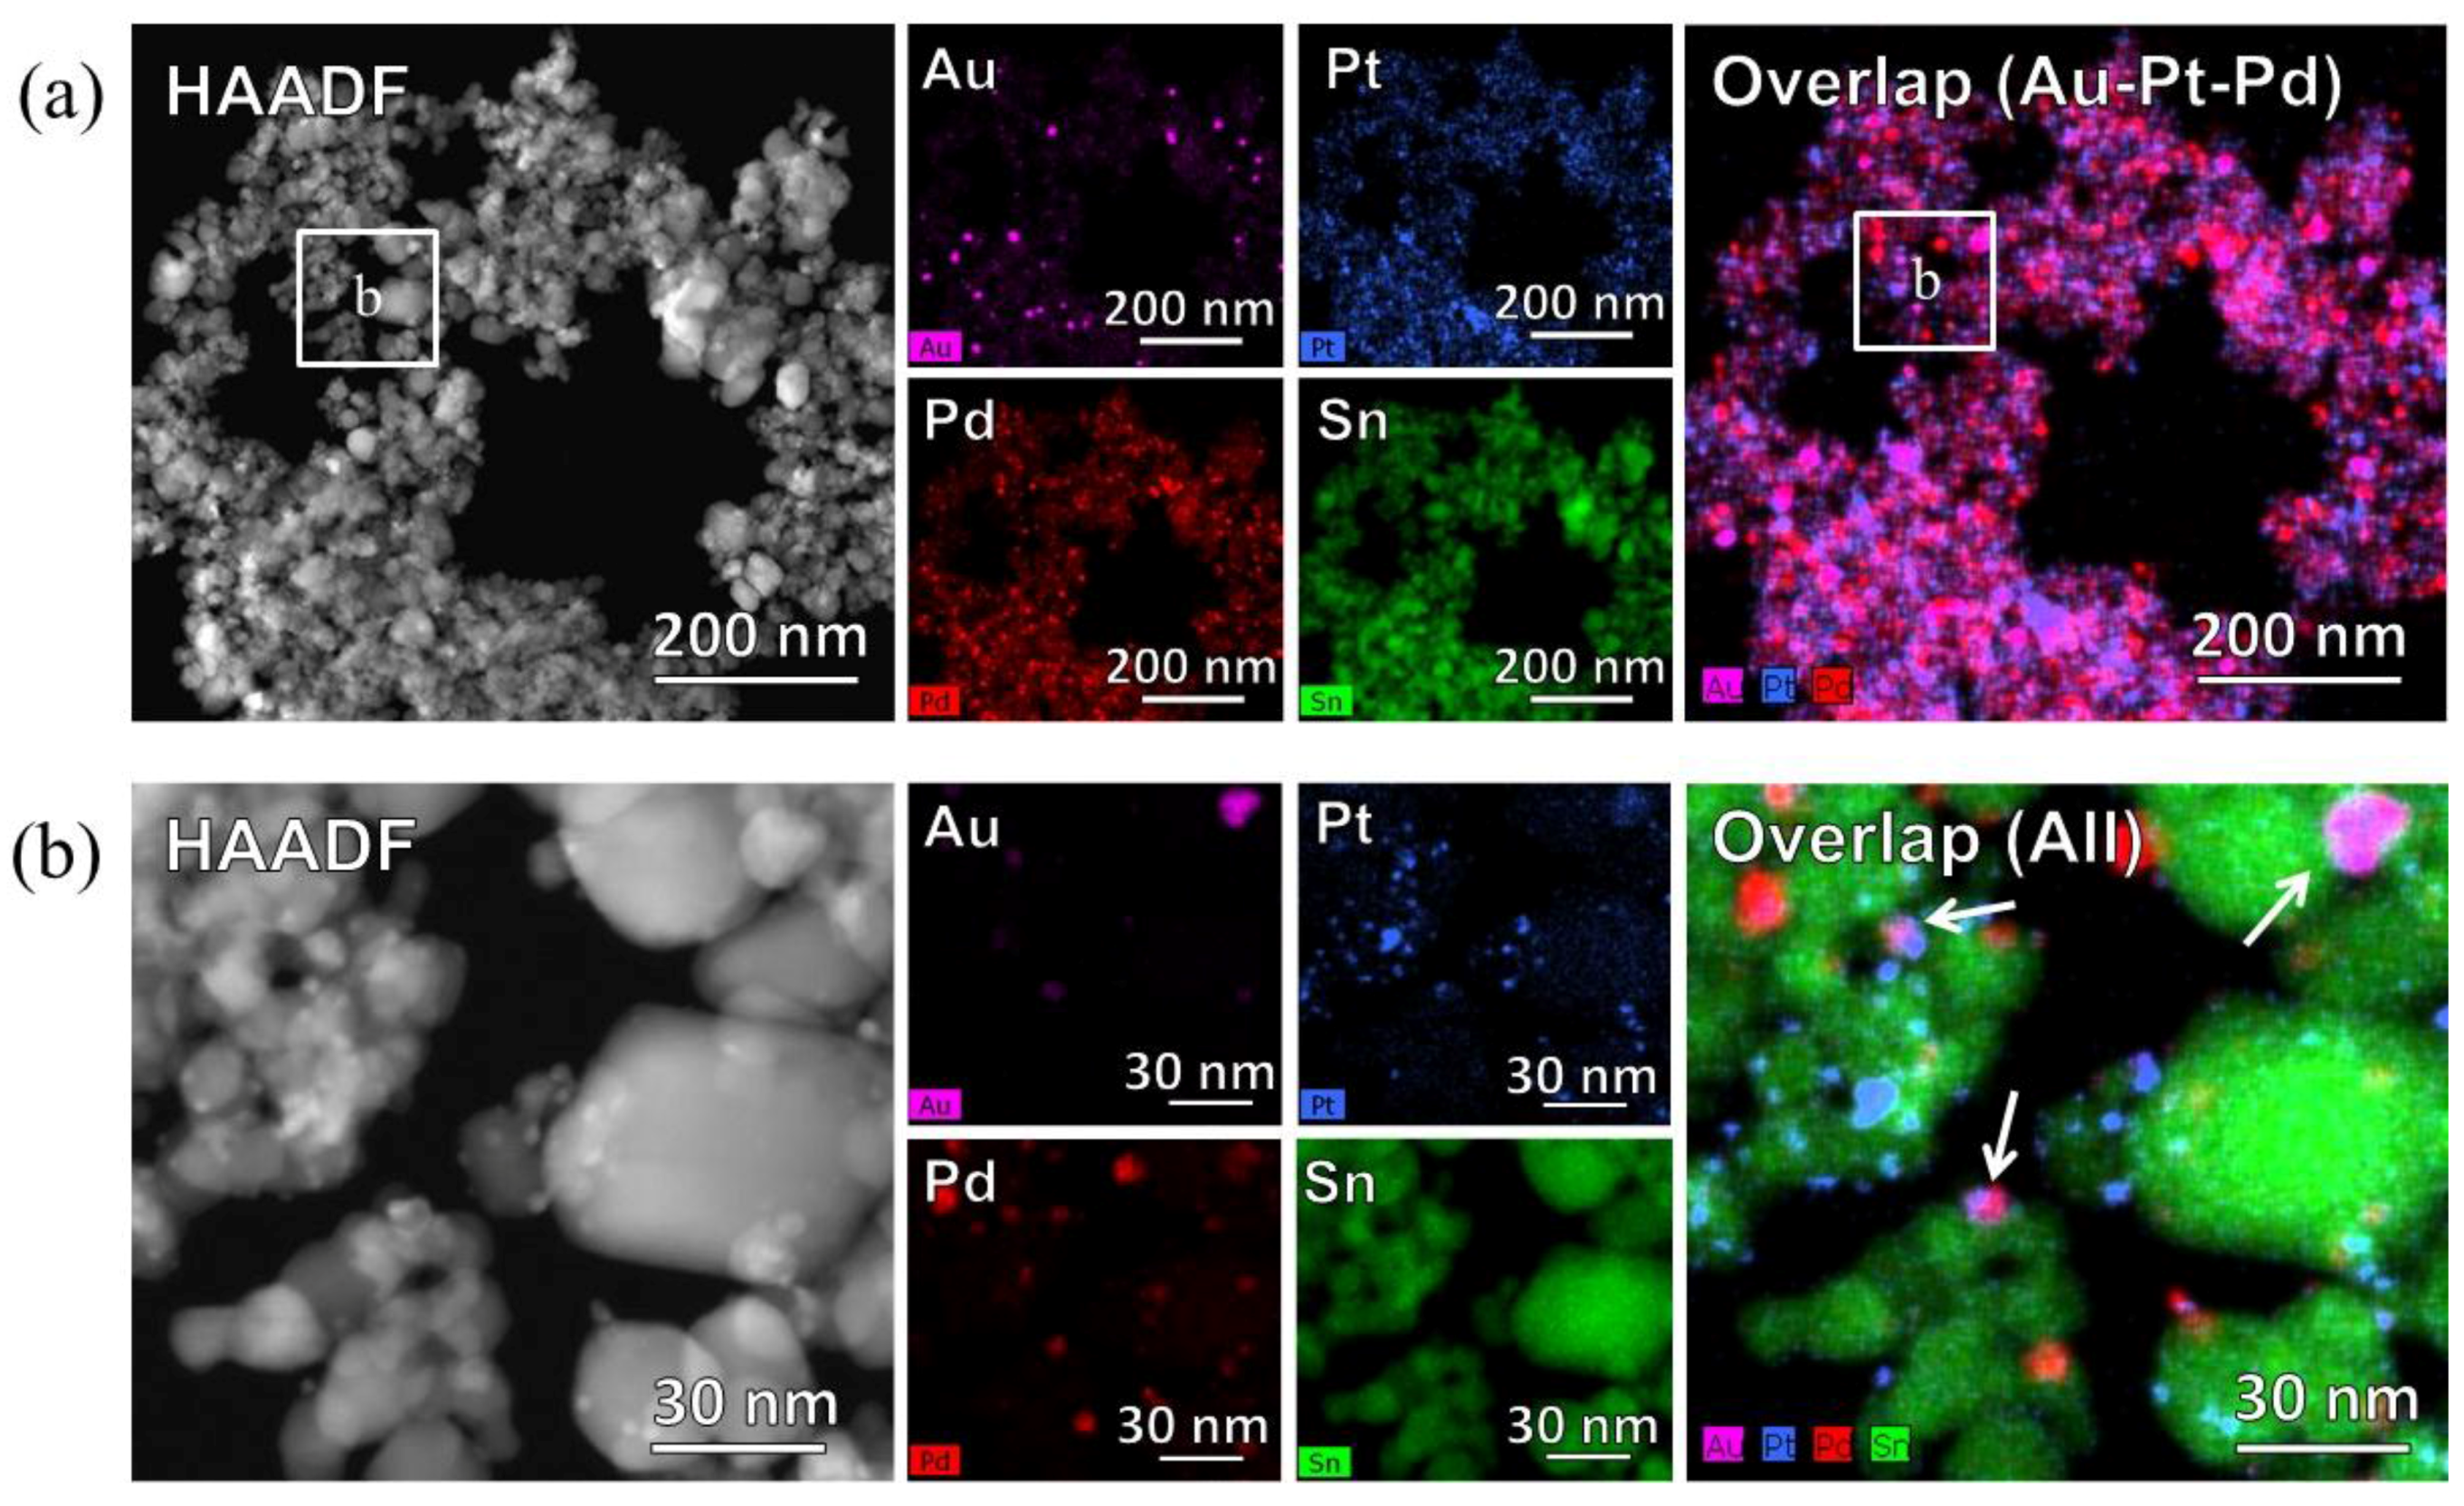
Figure 6 shows the High-angle annular dark field scanning transmission electron microscopy (STEM-HAADF) images and STEM-energy dispersive X-ray spectroscopy (STEM-EDS) mapping of the Au, Pt, Pd, and Sn distributions in the catalyst powder. Low magnification images (Figure 6a) indicate that the noble metals were dispersed over the SnO2 particles. However, in the high magnification images (Figure 6b), only the Pt and Pd nanoparticles were deposited and dispersed on SnO2 particles, while the Au nanoparticles aggregated as 10 nm particles, overlapping with Pt and Pd, as indicated by arrows in the overlap image of Figure 6b.
Figure 6. High-angle annular dark field scanning transmission electron microscopy (STEM-HAADF) and STEM-energy dispersive X-ray spectroscopy (STEM-EDS) images of the AuPtPd/SnO2 catalyst powder. (a) STEM-HAADF image and EDS maps of Au, Pt, Pd, Sn, and Overlap (Au-Pt-Pd) at low magnification (110,000), and (b) STEM-HAADF image and EDS maps of Au, Pt, Pd, Sn, and Overlap at high magnification (630,000).
Sensors 15 29873 g006

3.2. DRIFT Characterization of the Catalyst

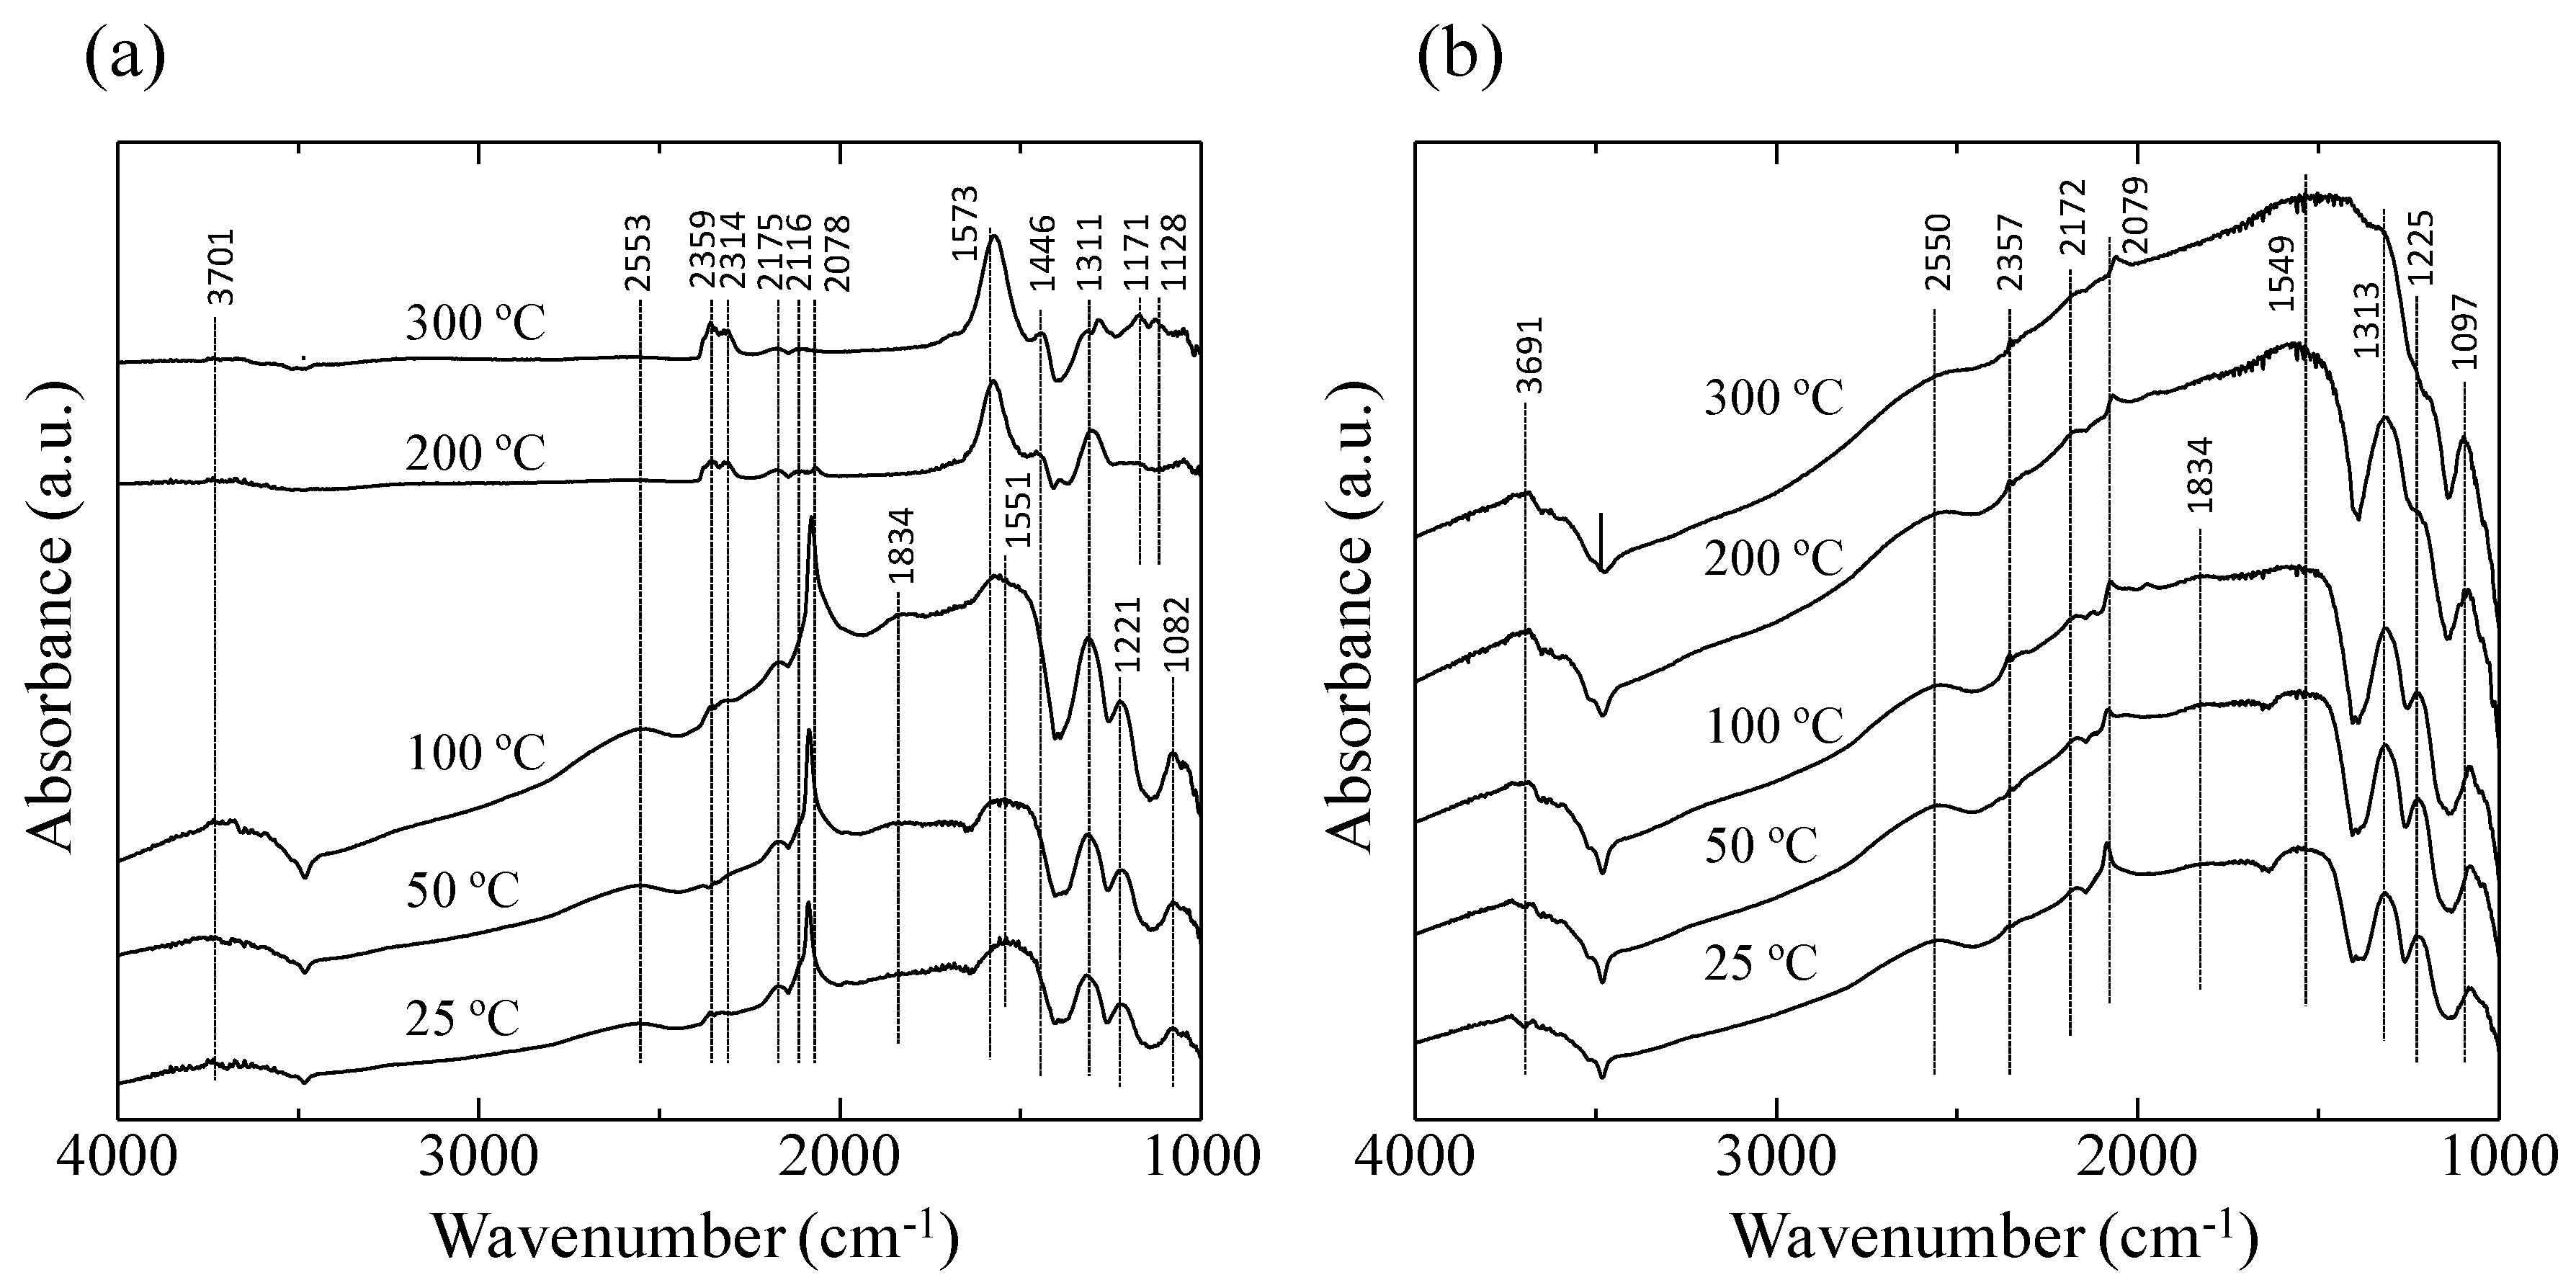
Figure 7 shows the 1000–4000 cm−1 region of the diffuse reflectance Fourier transform Infrared spectroscopy (DRIFT) spectra of the AuPtPd/SnO2 catalyst at 25–300 °C in 10,000 ppm CO in both dry air (Figure 7a) and in Ar (Figure 7b). As can be seen in Figure 7a, at lower temperatures (25–100 °C), bands at 1082, 1221, 1311, and 1551 cm−1 were observed, corresponding to vibrations of the carbonate species on noble metals or SnO2 [15,20]. The bands at 1834, 2078, 2116, and 2175 cm−1 could be assigned to CO. In particular, the sharp peak at 2078 cm−1 and the broad peak at 1834 cm−1 correspond to the linear and bridging bonds of the CO-Pt and CO-Pd bands, respectively [21]. The peak intensity corresponding to CO adsorption decreased with increasing the catalyst temperature. At catalyst temperatures of 200 and 300 °C, bands at 2314 and 2359 cm−1, corresponding to CO2, were observed, confirming the oxidation of CO by the AuPtPd/SnO2 catalyst. For the experiments employing 10,000 ppm CO in Ar (Figure 7b), the peaks corresponding to the carbonate species (at 1097, 1225, 1313, 1549, 2079, and 2172 cm−1) were detected at 25–200 °C. However, in contrast to the experiments employing 10,000 ppm CO in dry air (Figure 7a), peaks corresponding to CO2 were not detected.
Figure 7. Diffuse reflectance Fourier transform Infrared spectroscopy (DRIFT) spectra of the AuPtPd/SnO2 catalyst powder at 25–300 °C, in (a) 10,000 ppm CO in dry air, and (b) 10,000 ppm CO in Ar.
Sensors 15 29873 g007
The DRIFT spectra (Figure 7) clearly showed a peak corresponding to CO adsorption on the Pt and Pd particles at 2078 cm−1, but no sharp peak corresponding to CO adsorption on the metallic Au site was detected at 2112 cm−1 as shown in previous researches [15,22]. This indicated that less CO oxidation took place on the Au particles compared to the Pt and Pd particles. As shown in the STEM-EDS images (Figure 6), Au particles formed aggregates, thus increasing their particle size (≥10 nm). This can be explained by previous studies showing that the oxidation reaction of the Au catalyst slowed with increasing particle diameter, with a particle size of <10 nm being required [12]. In addition, Haruta et al., reported that the combination of Au with transition metal oxides resulted in high catalytic activities [23]. Therefore, CO oxidation by Au would be expected to be lower than that of Pt or Pd when considering the large particle size and the effect of non-transition metal (SnO2) catalysis carriers.

3.3. Sensor Gas Response

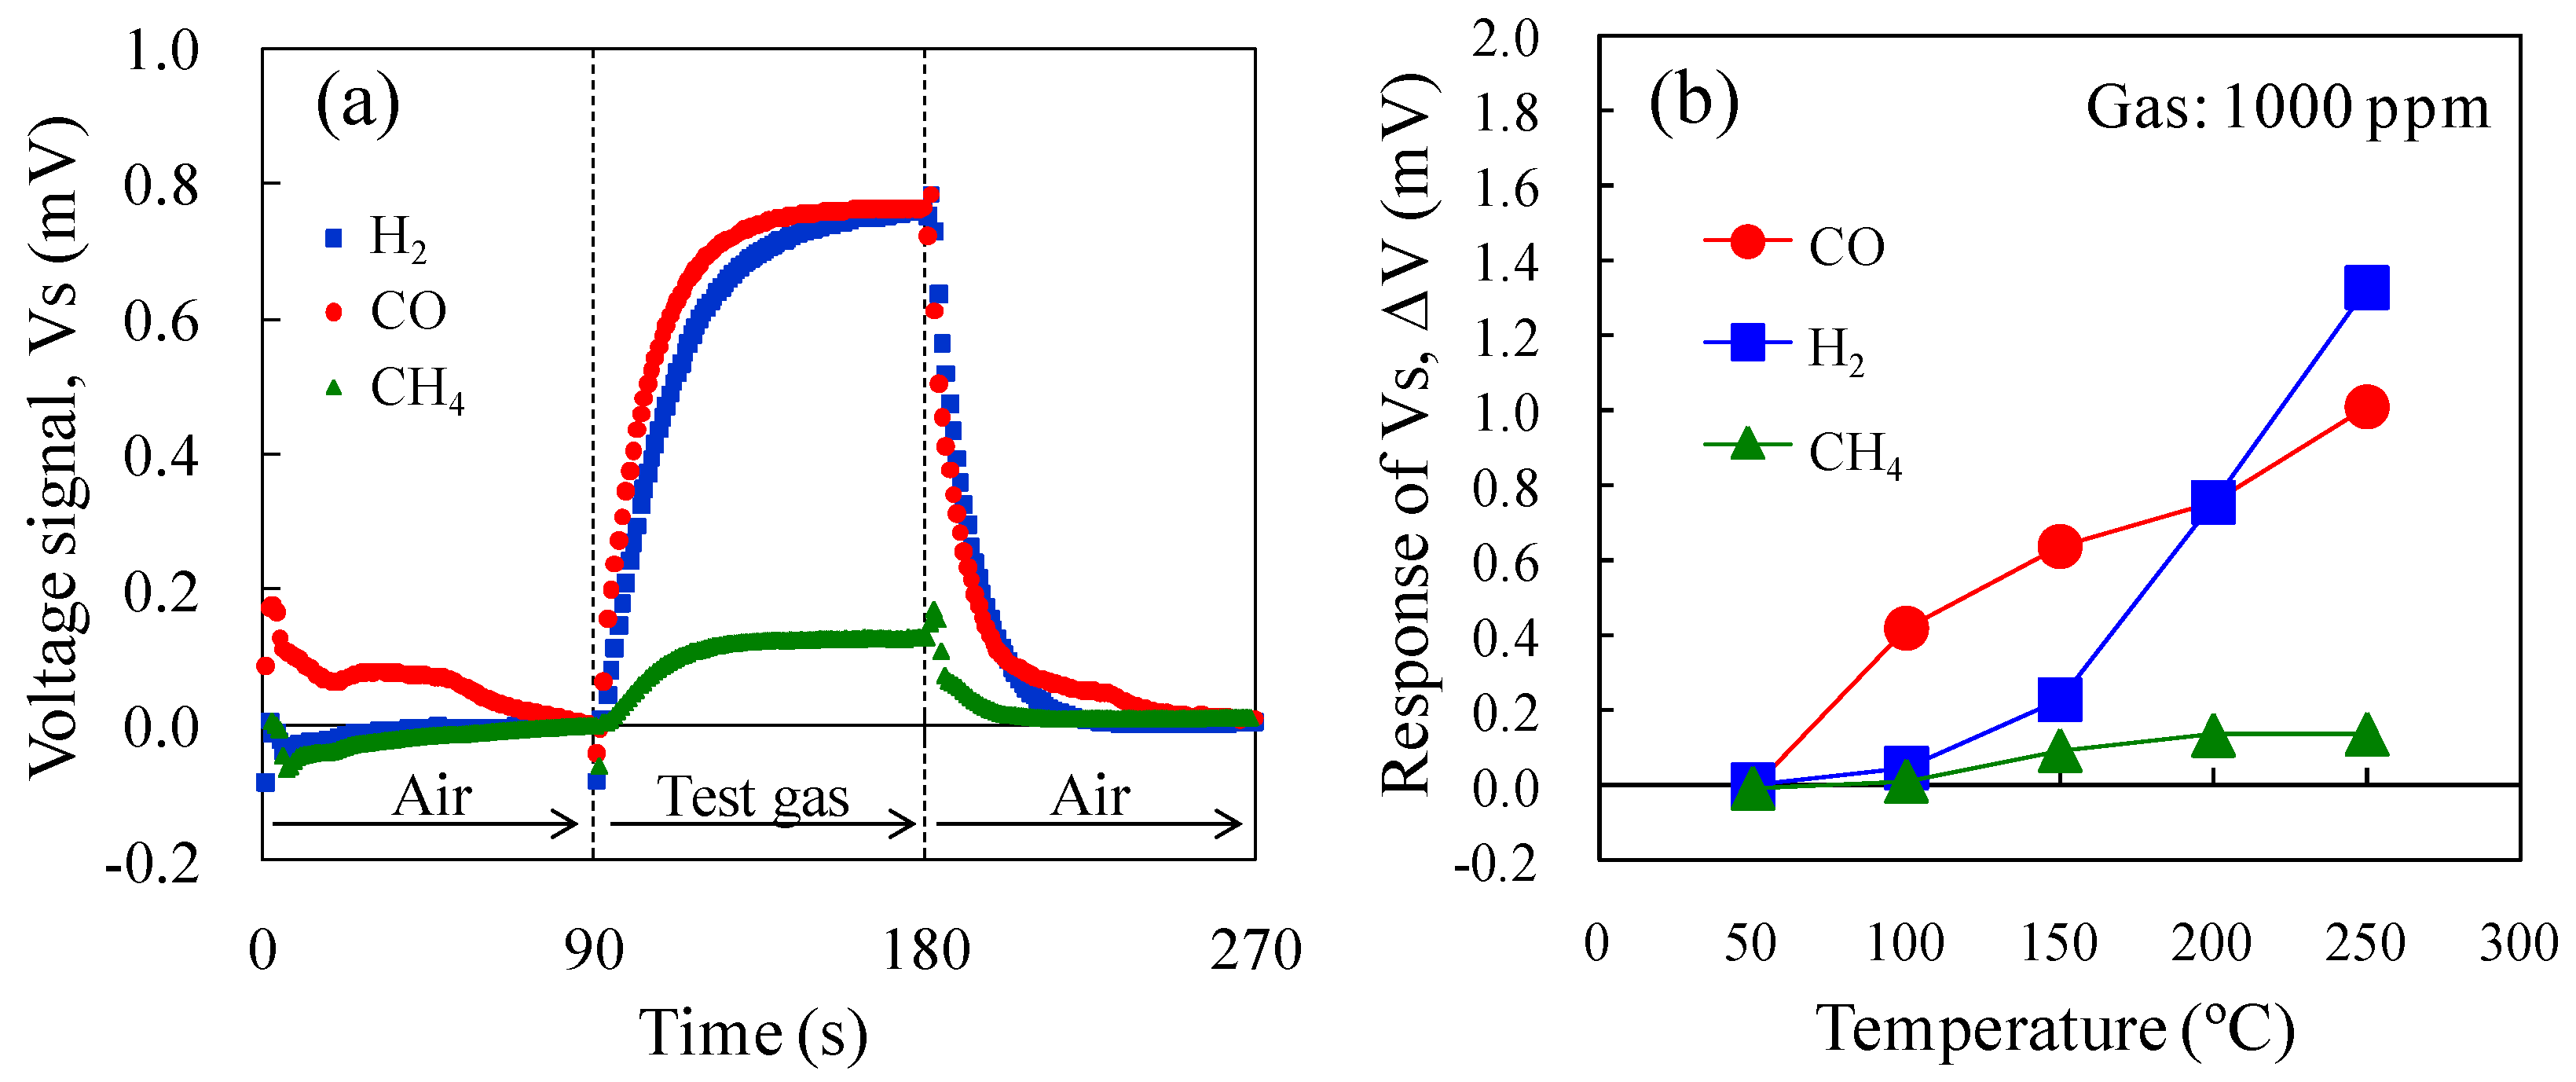
Figure 8a shows the Vs of the micro-TGS with AuPtPd/SnO2 catalyst at 200 °C for 1000 ppm CO, H2, and CH4. The combustion performance of the catalyst is directly related to the Vs of the sensor. At a catalyst temperature of 200 °C, the CO and H2 sensing properties of the micro-TGS were comparable, while CH4 combustion was not effective and the Vs was low. The temperature dependence of the ΔV of the AuPtPd/SnO2 micro-TGS for 1000 ppm CO, H2, and CH4 is shown in Figure 8b. The H2 and CO sensing signals increased to 1.4 and 1.0 mV at 250 °C, respectively. Up to temperatures of 200 °C, the Vs for CO of this micro-TGS was higher than that of ΔV for H2. In addition, the CH4 sensing signal increased slightly to 0.14 mV at 250 °C. Considering our previously reported results [9] on a micro-TGS with Pd/θ-Al2O3 catalyst, to achieve ppm detection of CH4, a catalyst temperature of 400 °C was required. Thus, the catalyst temperature of 250 °C used in the present study was too low to achieve CH4 combustion.
Figure 8. Vs of the AuPtPd/SnO2 micro-TGS for 1000 ppm H2, CO, and CH4 in dry air. (a) Response curves of the micro-TGS at a catalyst temperature of 200 °C, and (b) the ΔV of the micro-TGS at 25–300 °C.
Sensors 15 29873 g008
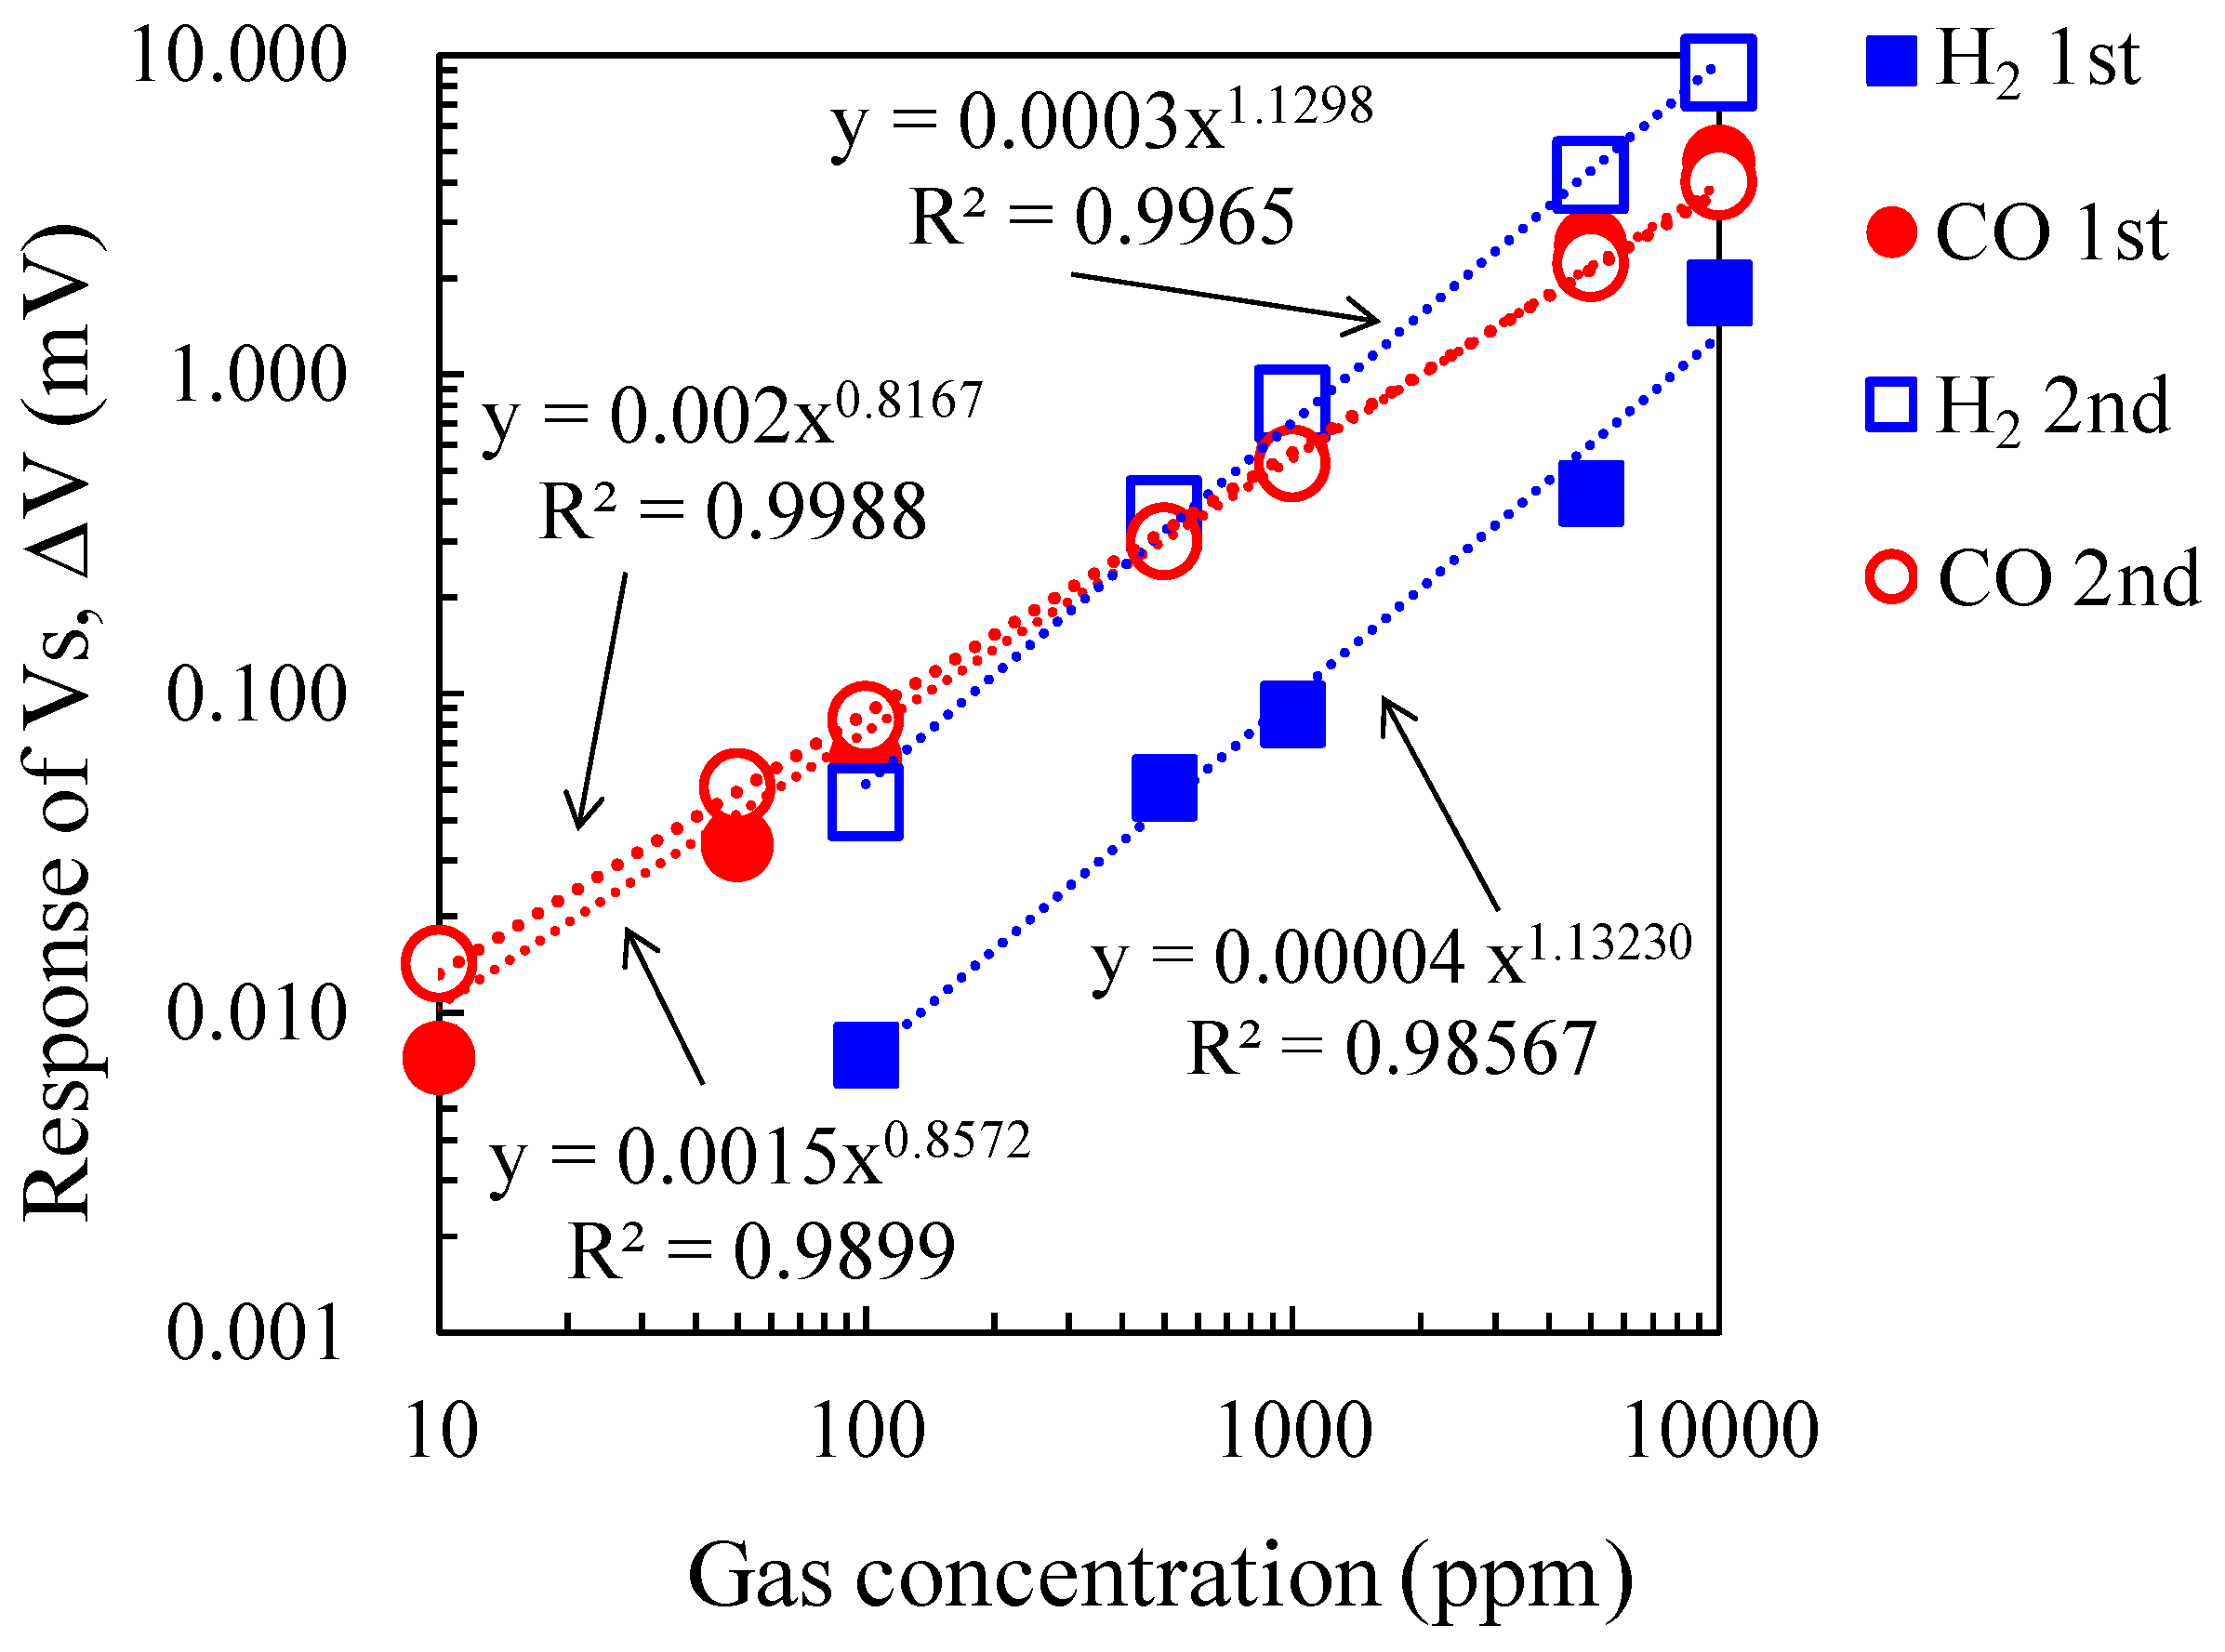
Figure 9 shows the double logarithmic plot of gas concentration and ΔV of the micro-TGS with AuPtPd/SnO2 catalyst at 200 °C for 10–10,000 ppm of CO and H2. The plots were fitted to the power approximation curve “y = axb”, and the sensor ΔV for these gases showed good linear dependence. While the gas concentration dependence of ΔV for CO was unchanged, the ΔV of the second measurement for H2 increased linearly, and the values became comparable to those of the ΔV for CO. 
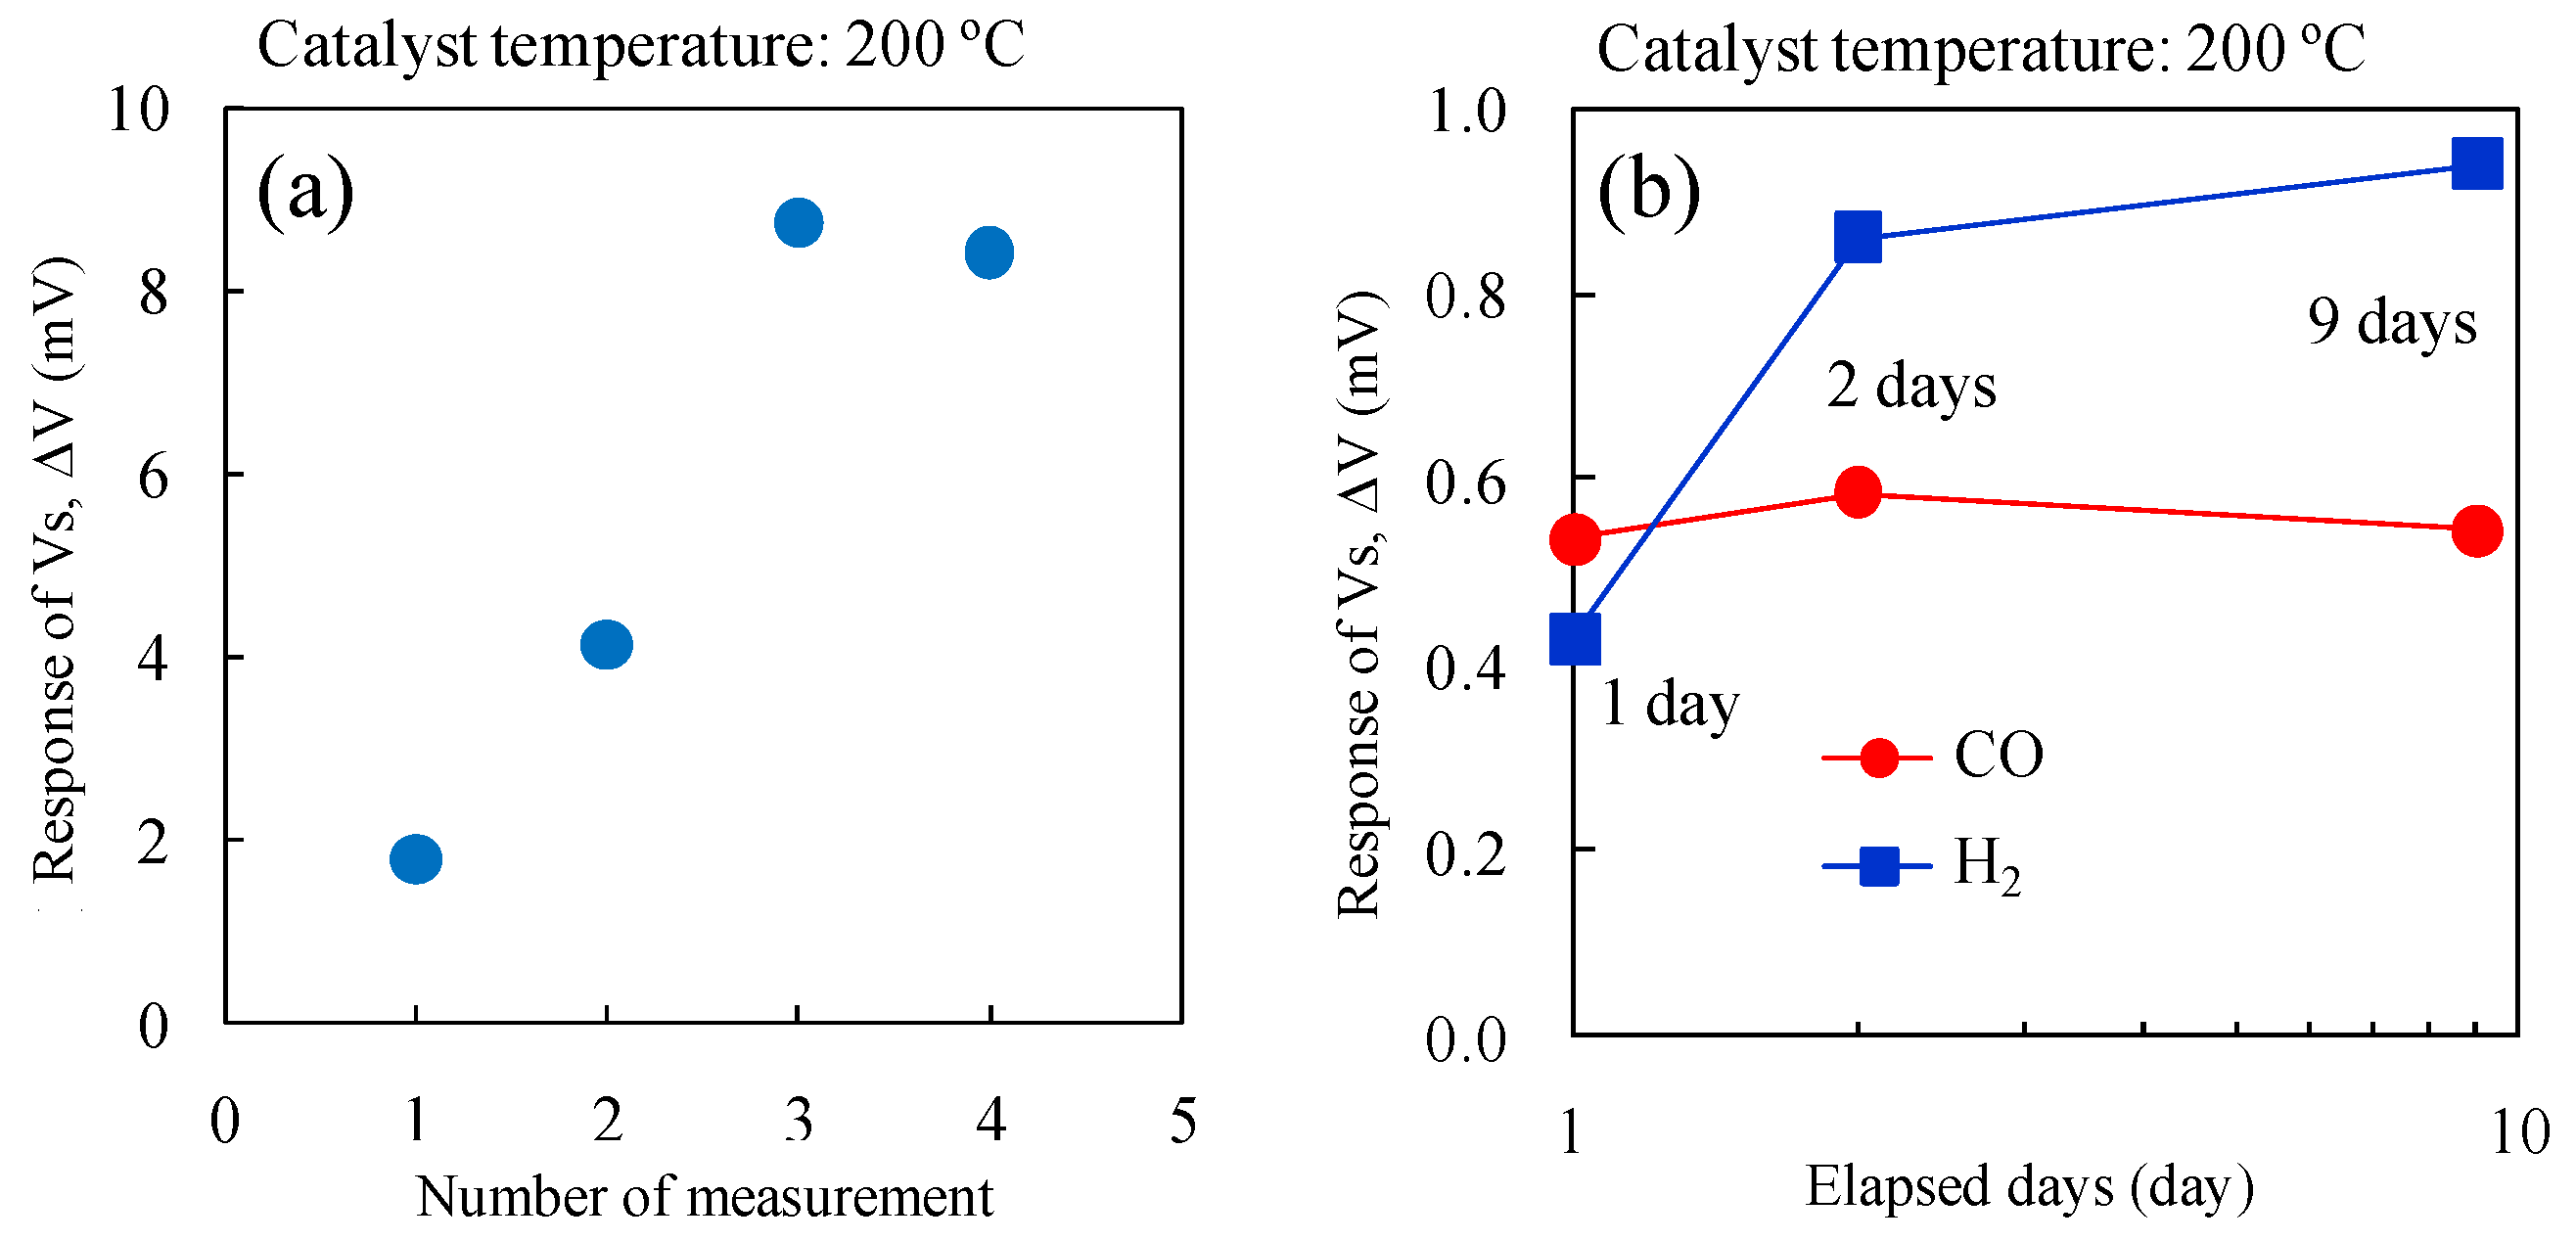
Figure 10a shows the change in ΔV for the micro-TGS with AuPtPd/SnO2 during repeated measurements with 10,000 ppm H2 at a catalyst temperature of 200 °C. The long-term stability of the ΔV of the micro-TGS at 1000 ppm CO or H2 in dry air at 200 °C is shown in Figure 10b. The CO response of the micro-TGS remained fairly constant, while the H2 response increased with time. It therefore appears that the chemical state, composition, or dispersed state of Pt and Pd nanoparticles on SnO2 was altered by pretreatment with 10,000 ppm H2 in dry air.
Figure 9. ΔV against CO and H2 concentration for the micro-TGS, from 10–10,000 ppm in dry air.
Sensors 15 29873 g009
Figure 10. Gas response of the micro-TGS with AuPtPd/SnO2 catalyst: (a) ΔV against time for the micro-TGS with 10,000 ppm H2 in dry air; and (b) long-term stability of ΔV from the micro-TGS with AuPtPd/SnO2 catalyst for 1000 ppm H2 in dry air or 1000 ppm CO in dry air at 200 °C for 1–9 days.
Sensors 15 29873 g010
We previously reported the CO response of the micro-TGS with noble metal-loaded cobalt oxide catalysts [5,6,7]. The ΔV of the AuPtPd/SnO2 micro-TGS for CO was comparable to that of the micro-TGS with either AuPtPd/Co3O4 or AuPtPd/CoO catalysts [7]. In addition, the stability of ΔV of the micro-TGS with AuPtPd/SnO2 catalyst observed in this study was higher than that of the previously reported micro-TGS with Au/Co3O4 catalyst [6]. These results indicate that the AuPtPd/SnO2 micro-TGS is useful as a CO gas sensor. Furthermore, this study revealed that this micro-TGS is required to control the varying ΔV of H2 in order to improve its CO selectivity against H2.

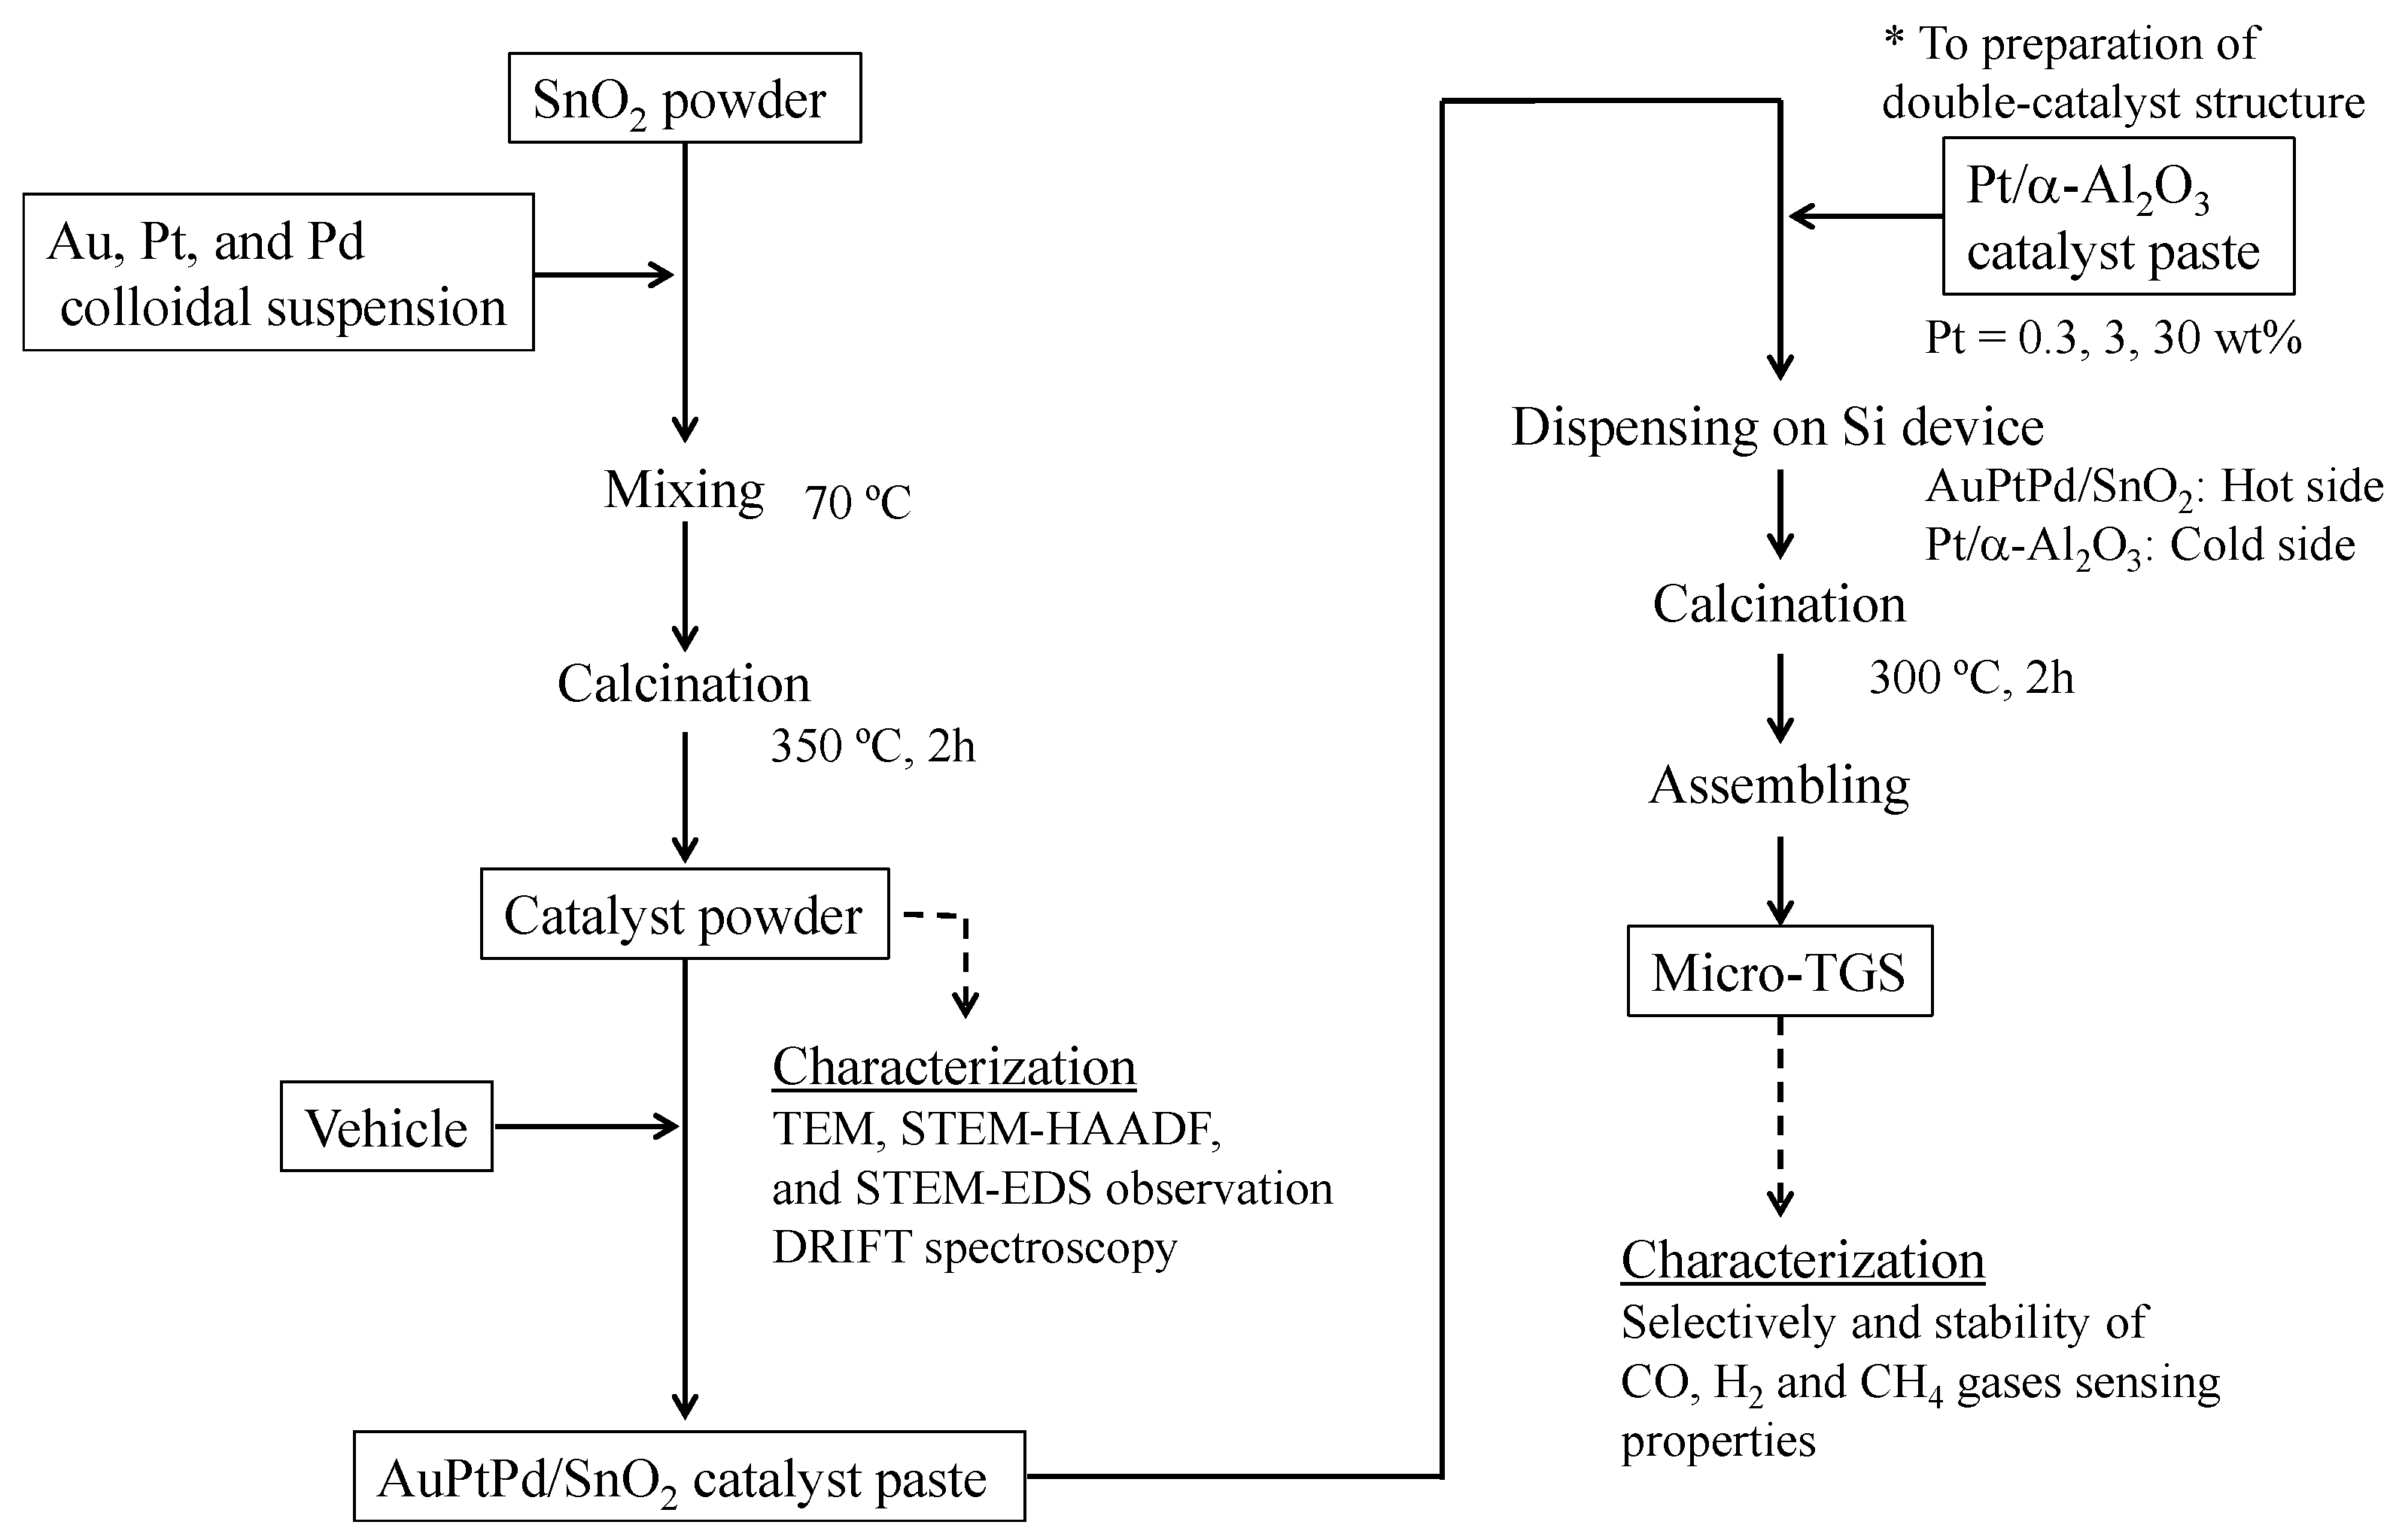
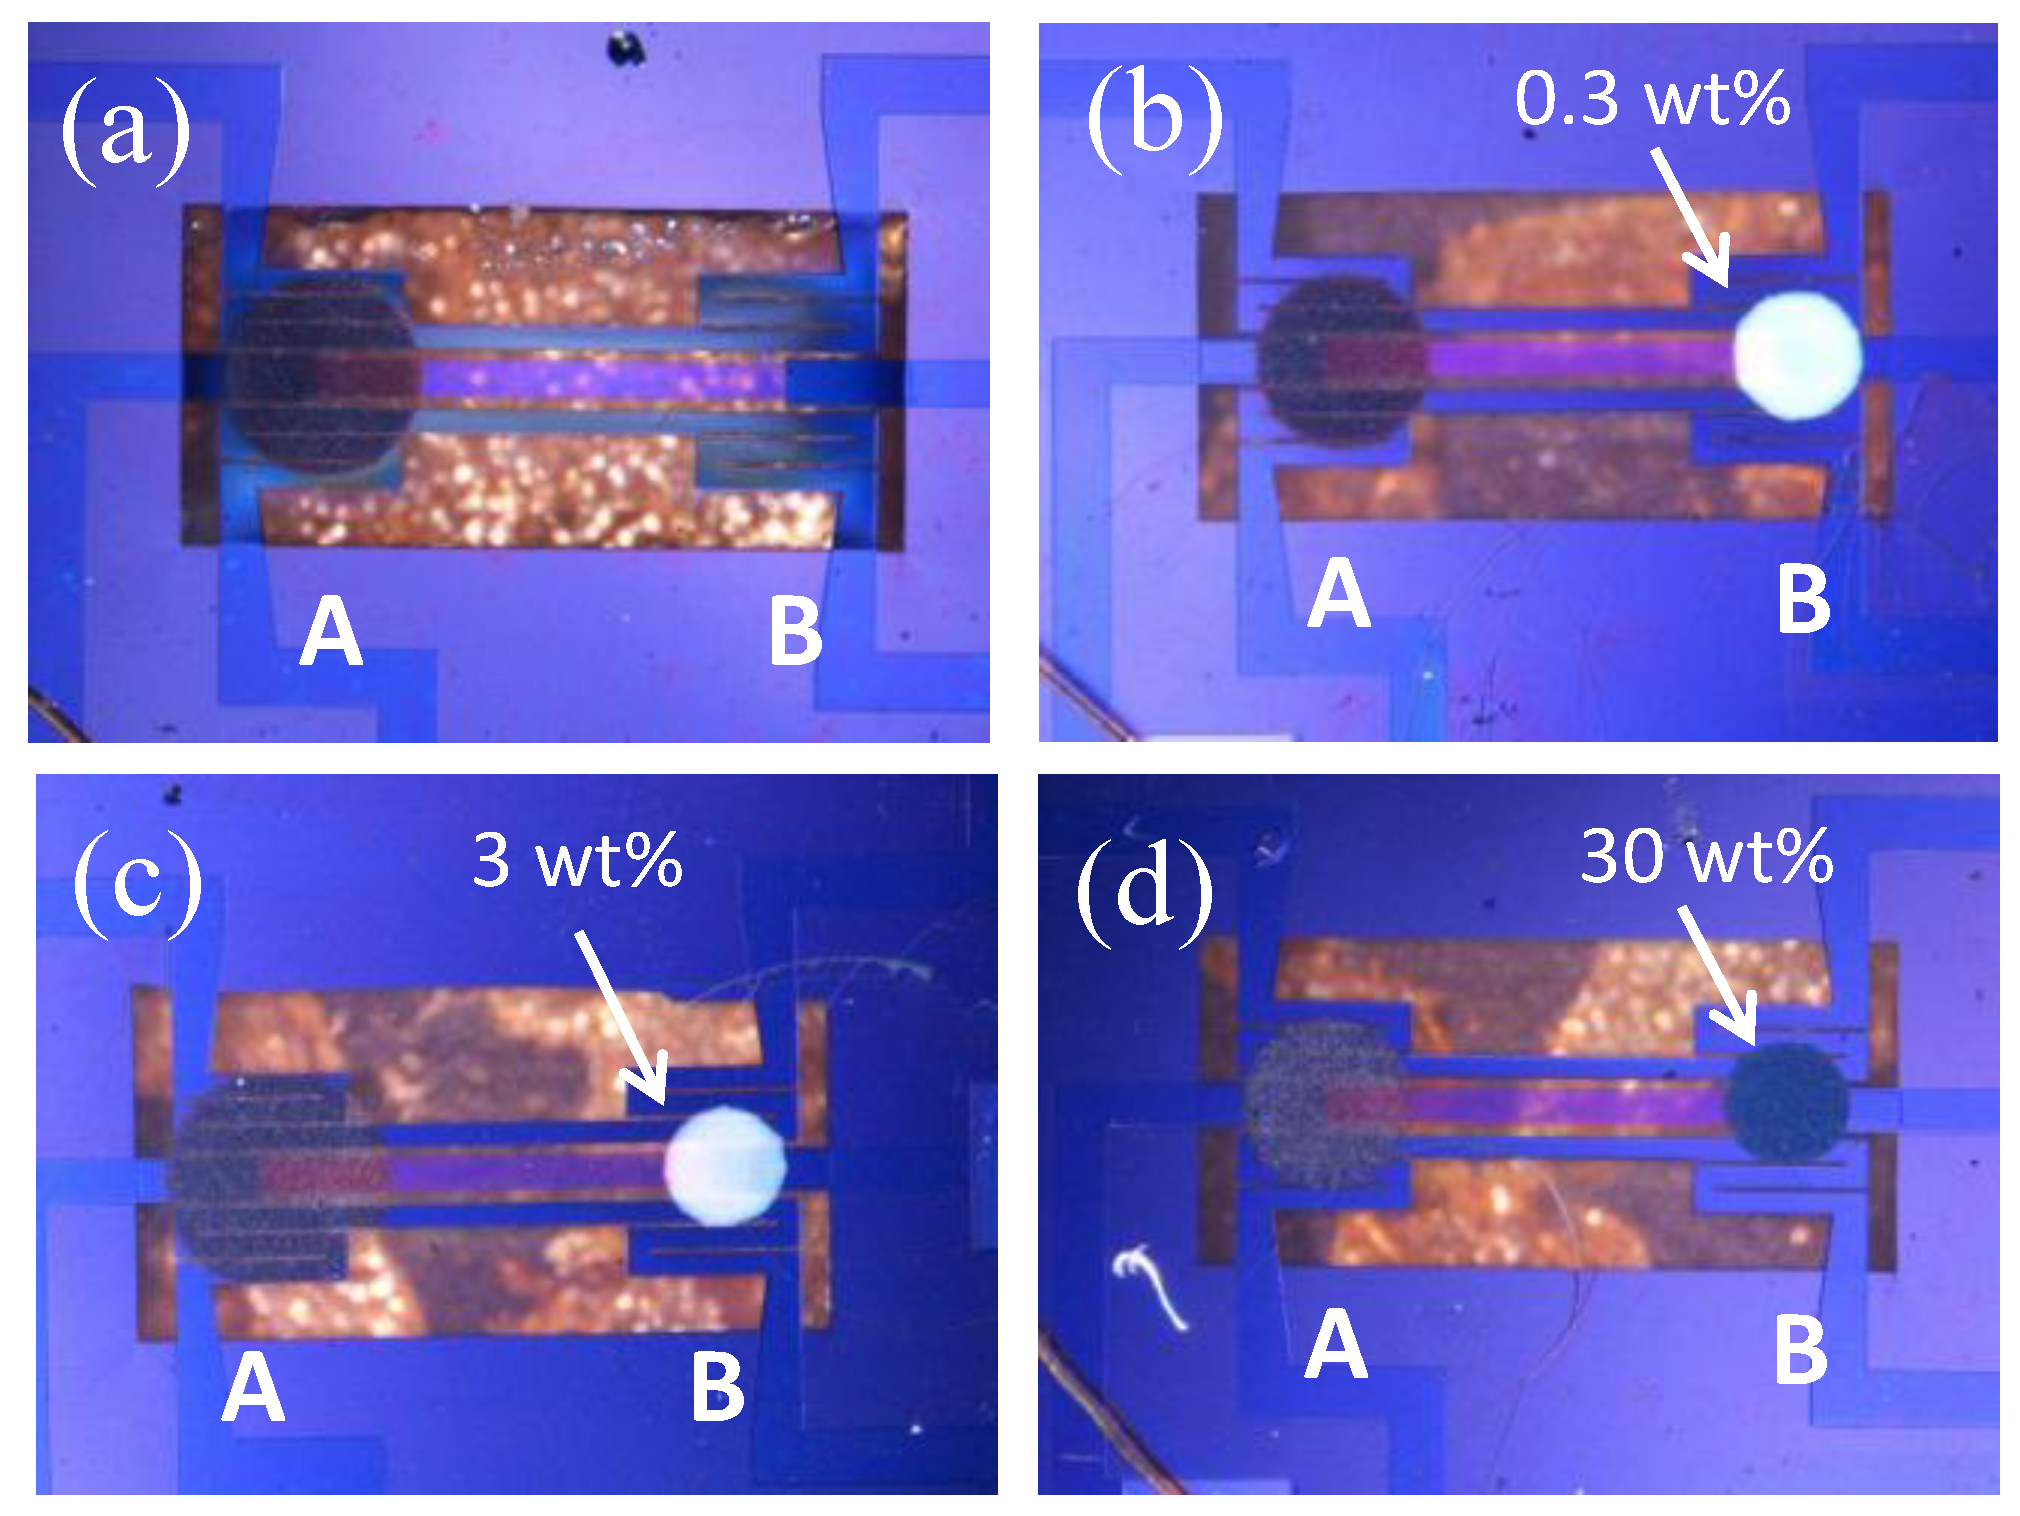
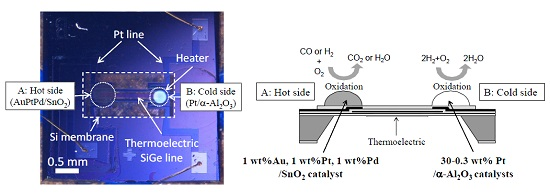
3.4. Double Catalyst Structure

We previously attempted implementing the double catalyst micro-TGS structure for use as a hydrogen sensor [19], along with calorimetric-TGS devices [8] to control sensor selectivity. In the present study, to enhance CO selectivity, changes in the CO and H2 sensing properties of the micro-TGS with AuPtPd/SnO2 catalyst containing a double catalyst structure were investigated. The AuPtPd/SnO2 catalyst, which was deposited on the hot side (point A) of the micro-TGS device, burned both H2 and CO gases. In contrast, the Pt/α-Al2O3 catalyst, which was deposited on the cold side (point B) of the micro-TGS device, oxidized only H2. We therefore aimed for the combustion heat of H2 (QH2) to deduct from the combustion heat of H2 and CO (QH2 + QCO) for the AuPtPd/SnO2 catalyst, by employing various Pt contents for the Pt/α-Al2O3 catalyst.
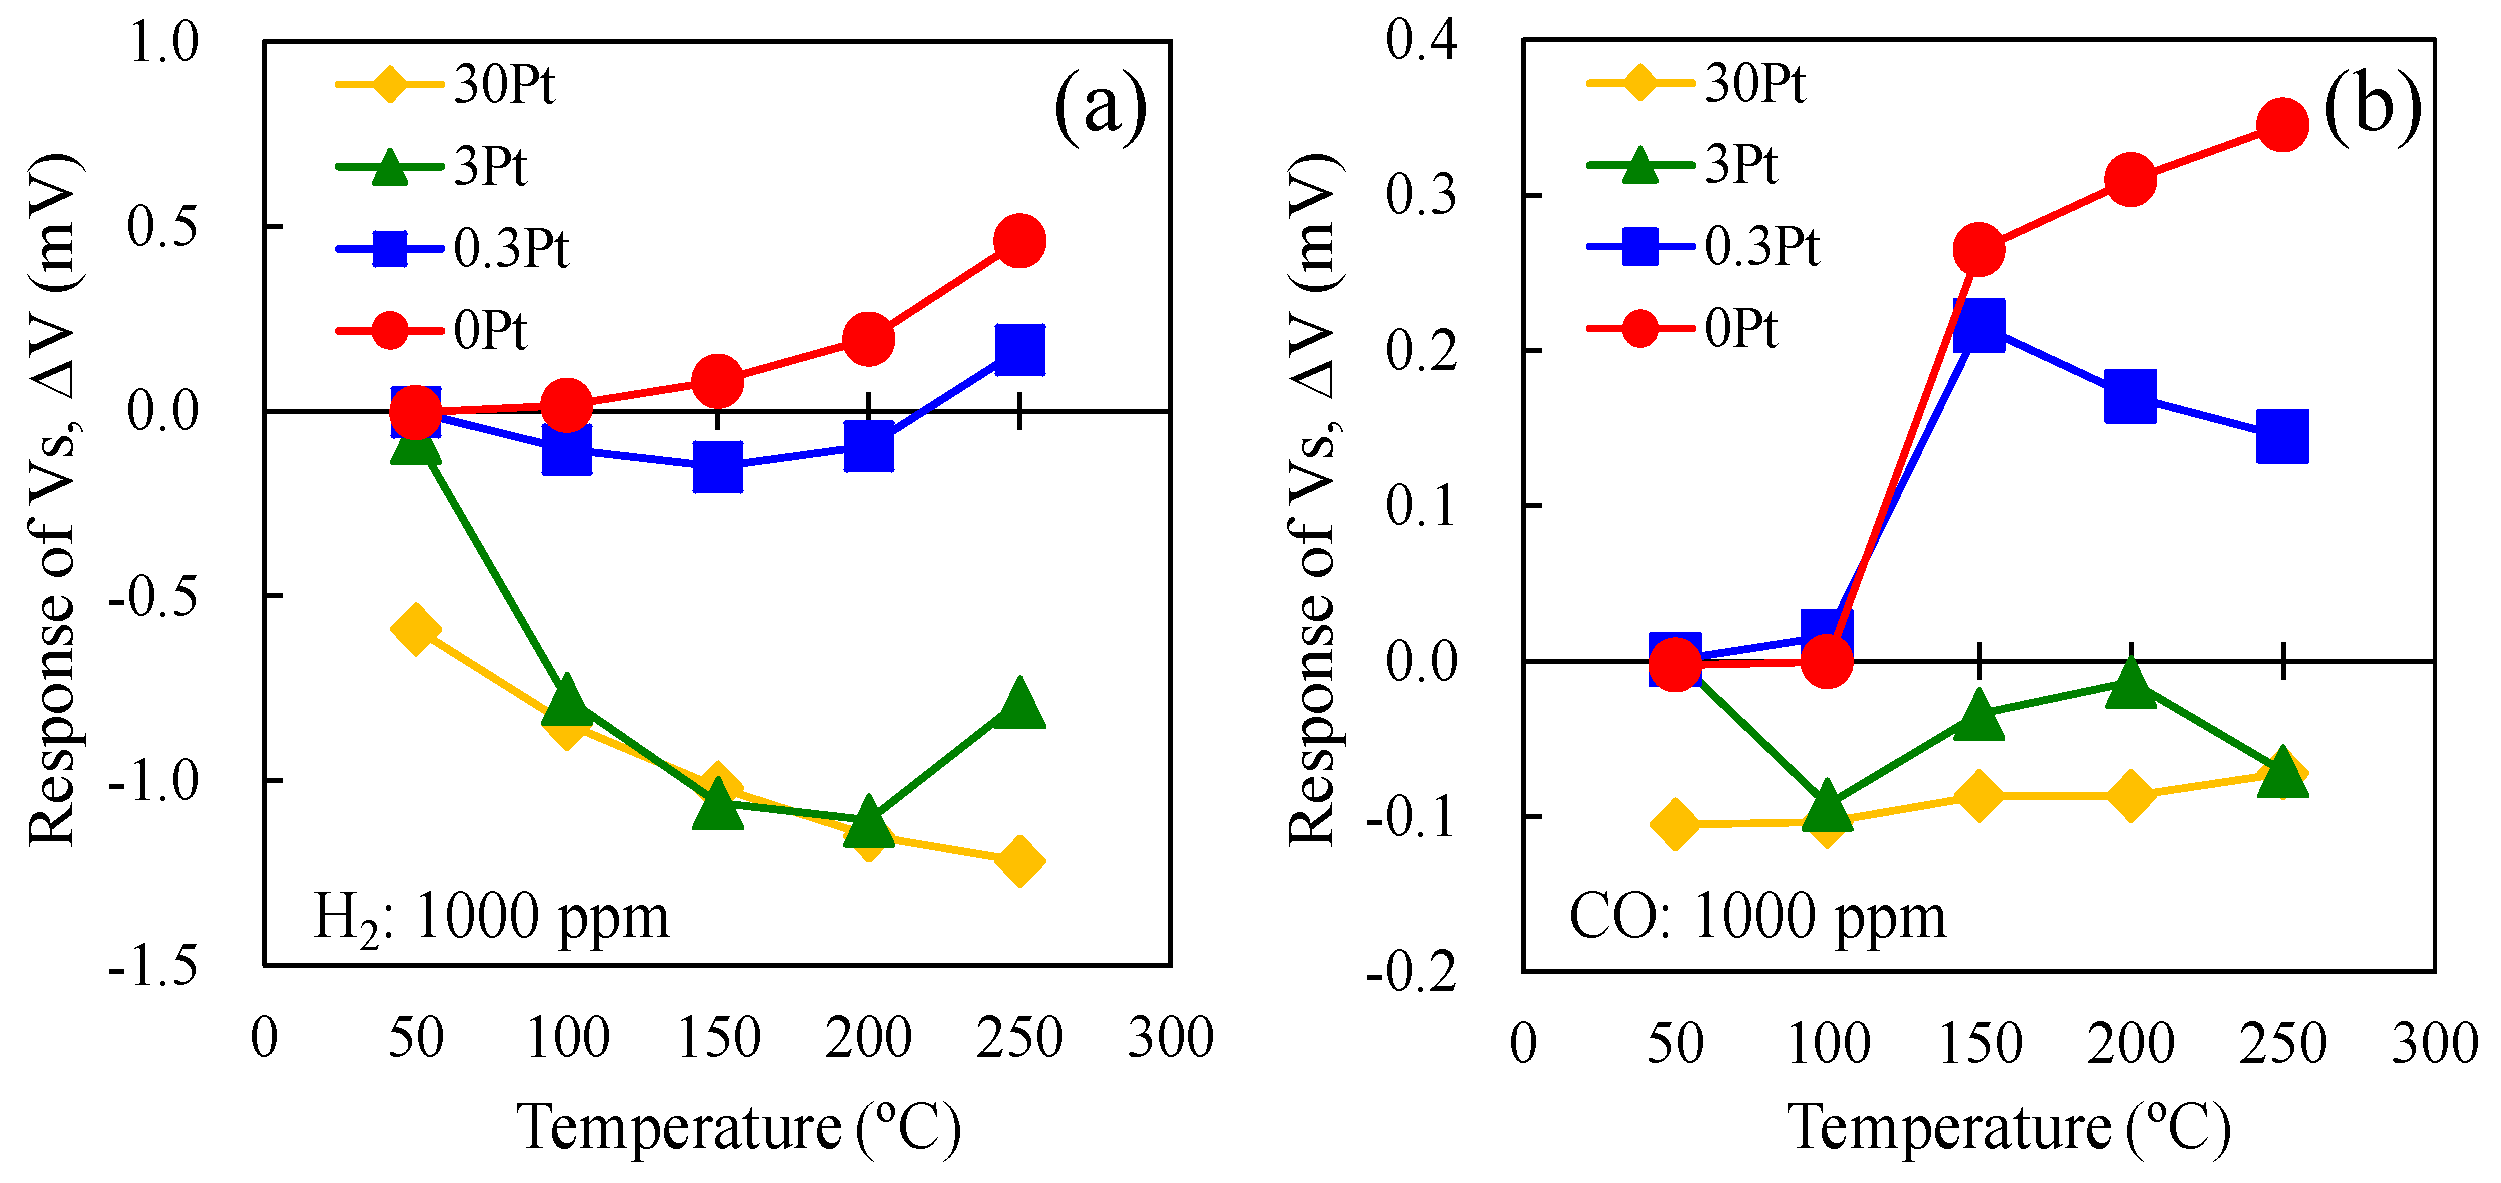
Figure 11 shows the temperature dependence of the ΔV of the double catalyst micro-TGS with 1000 ppm H2 in dry air and 1000 ppm CO in dry air. The “0Pt” indicated the different batch of the same composition of AuPtPd/SnO2 micro-TGS. For the H2 gas response (Figure 11a), the values of ΔV for 3Pt and 30Pt were negative at all catalyst temperature, indicating a higher QH2 for Pt/α-Al2O3 than for AuPtPd/SnO2. The ΔV of 0.3Pt was negative at all catalytic temperatures except 250 °C. Thus, the amount of Pt in the Pt/α-Al2O3 catalyst greatly influenced the H2 sensitivity of the AuPtPd/SnO2 micro-TGS, which is in agreement with previously reported calorimetric-TGS devices [8]. In addition, the ΔV of 0Pt (in the absence of Pt/α-Al2O3 catalyst on the cold side) was positive, and increased with increasing catalyst temperature. For the CO response (Figure 11b), the ΔV values of 3Pt and 30Pt were also negative between 50–250 °C, indicating that the QCO from Pt/α-Al2O3 containing high quantities of Pt is significant in the double catalyst micro-TGS system. Furthermore, ΔV of 0.3Pt increased upon increasing the catalyst temperature to 150 °C, and then decreased gradually at higher temperatures. Figure 11a,b indicates that the Pt/α-Al2O3 catalyst oxidized both H2 and CO, and that the combustion heats of both 30Pt and 3Pt were higher than that of the AuPtPd/SnO2 catalyst, due to a negative ΔV. The high Pt content in the Pt/α-Al2O3 catalyst therefore appeared to accelerate the oxidation reaction of H2 and CO. Indeed, this Pt/α-Al2O3 catalyst is a combustion catalyst for various gases, including both H2 and CO. With an increase in Pt content on the cold (point B) side of the Pt/α-Al2O3 catalyst, a decrease in the ΔV of H2 and CO was observed for the micro-TGS. Thus, ΔV varied in the order: 0Pt > 0.3Pt ~ 3Pt > 30Pt. Considering these results, an optimal Pt content of <3 wt% should be used in the Pt/α-Al2O3 catalyst to give the best CO selectivity.
Figure 11. The ΔV of the single and double catalyst structure micro-TGS with AuPtPd/SnO2 and 0.3–30 wt% Pt/α-Al2O3 catalyst at 200 °C for (a) 1000 ppm H2, and (b) 1000 ppm CO in dry air.
Sensors 15 29873 g011
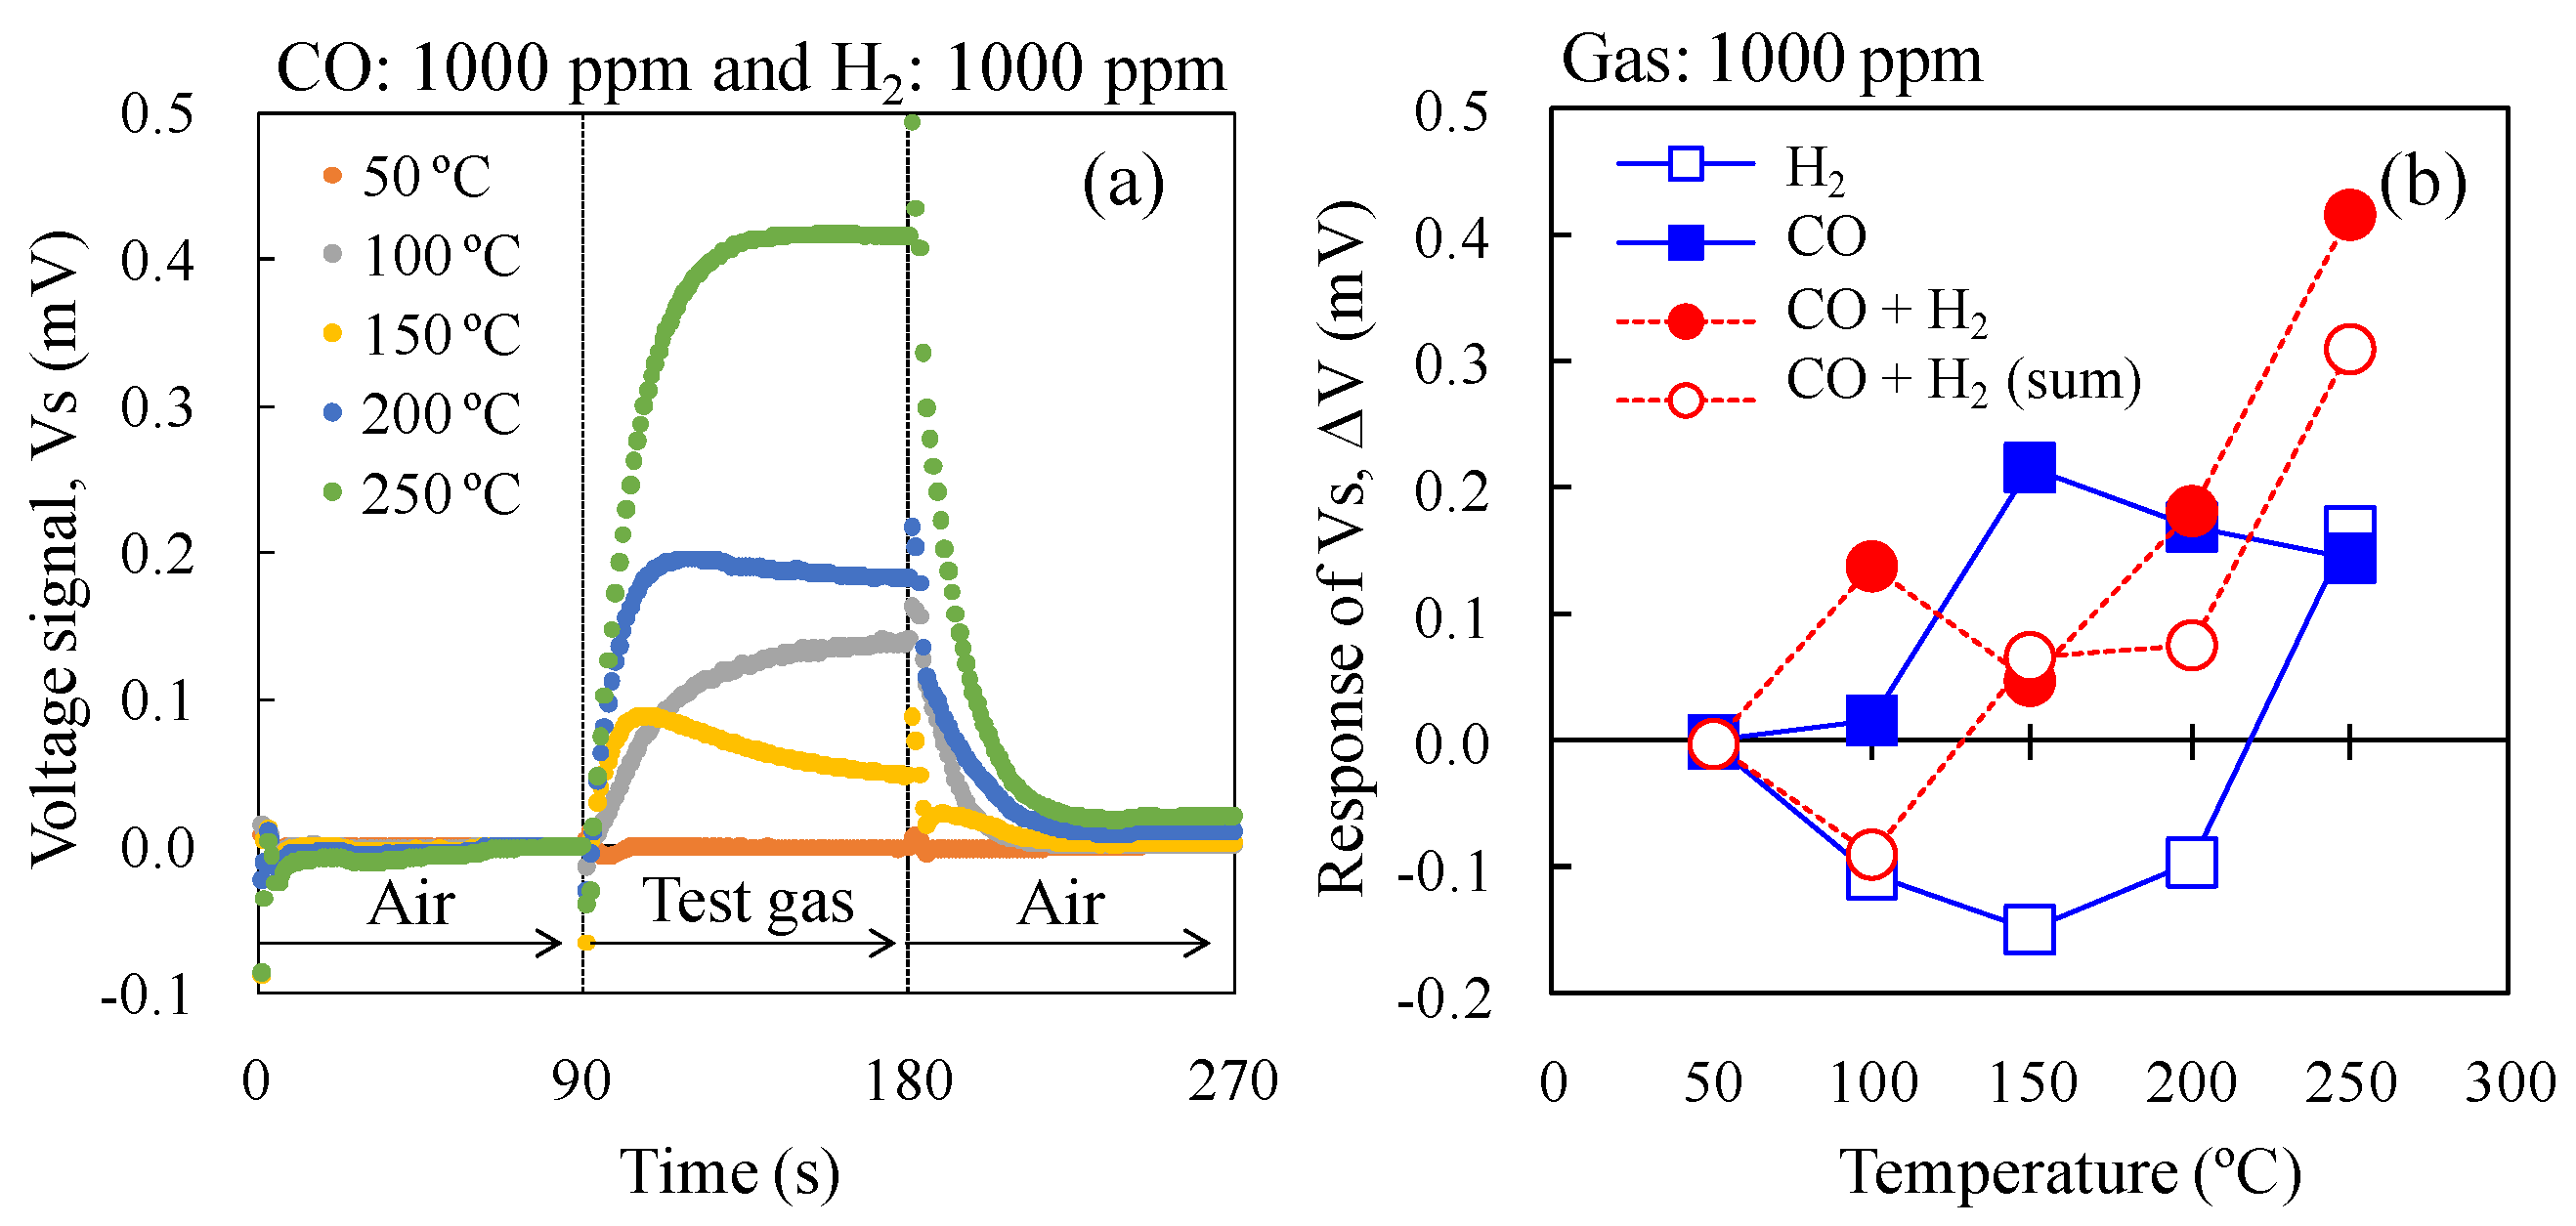
To investigate the CO selectively against H2, the ΔV of 0.3Pt to CO and H2 mixed gas in dry air was investigated (Figure 12), with the ΔV of 0.3Pt to CO and H2 shown in Figure 11 re-plotted in Figure 12b. At a catalyst temperature of 100 °C, the ΔV of 0.3Pt to the mixed gas was large, whereas those to CO and H2 were small and negative, respectively. It appears that the presence of H2 accelerated the oxidation of CO in the mixed gas on the AuPtPd/SnO2 catalyst. The combustion heat of the 0.3 wt% Pt/α-Al2O3 catalyst increased at 150 °C, due to the gradual decrease in ΔV with increasing temperature. In addition, between 150–250 °C, the ΔV of CO and H2 mixed gases increased with increasing catalyst temperature. At a catalyst temperature of 200 °C, the ΔV of 0.3Pt for the mixed gases was comparable to that for CO, indicating that 0.3Pt shows good CO selectivity against H2. Furthermore, at 250 °C, the ΔV of 0.3Pt to the mixed gas reached its highest value. However, the ΔV of 0.3Pt to H2 was positive while that to the mixed gas was comparable to the sum of the values for CO and H2. This indicates that the selectivity to CO of 0.3Pt decreased at a catalyst temperature of 250 °C. We therefore concluded that 0.3Pt gave the best CO selectivity against H2 on the double catalyst micro-TGS system at 200 °C.
Figure 12. Vs of the double catalyst micro-TGS with AuPtPd/SnO2 and 0.3 wt% Pt/α-Al2O3 catalysts. (a) Response curves of the micro-TGS at catalyst temperatures of 25–300 °C for mixed gas (1000 ppm CO and 1000 ppm H2) in dry air; (b) Catalyst temperature dependence of the ΔV of the micro-TGS for 1000 ppm CO, 1000 ppm H2, mixed gas (1000 ppm CO + 1000 ppm H2), and calculated data (the sum of single gas data).
Sensors 15 29873 g012
From Figure 12b, the ΔV of experimental data of mixed gas was higher than that of calculated data (the sum of single gas data), at catalyst temperature of 100 °C. This result indicated that, at 100 °C, the combustion of 0.3 wt% Pt/α-Al2O3 for CO and H2 (cold side) was inhibited by adsorption of CO, compared to the case of AuPtPd/SnO2 catalyst (Hot side). On the other hand, the CO combustion on the AuPtPd/SnO2 catalyst (hot side) was relatively not inhibited much. Therefore combustion heat is generated and ΔV of experimental data showed the positive value. However the ΔV of experimental data was similar to that of calculated data from 150 °C and more. Therefore, at catalyst temperature of 200 °C, the tendency of ΔV of mixed gas could be estimated from the sum of ΔV of pure H2 and pure CO.

4. Conclusions

We investigated the CO, H2, and CH4 sensing properties of a micro thermoelectric gas sensor (micro-TGS) containing the AuPtPd/SnO2 catalyst as a CO gas sensor. CO oxidation by the catalyst powder was investigated, with the catalytic oxidation of CO by Pt and Pd particles being prominent compared to that by Au particles. This performance was related to the difference in size and dispersion of nanoparticles. While several nanometer sized Pt and Pd particles were uniformly dispersed on SnO2, the Au particles aggregated to form particles of >10 nm diameter. In situ DRIFT analysis of the catalyst showed a CO adsorption peak on Pt and Pd, but no clear interaction peak between CO and Au was detected. CO combustion by the AuPtPd/SnO2 catalyst was more temperature dependent than that of H2 up to 200 °C, with H2 combustion being activated by repeated exposure of H2 gas during the periodic gas test. Selective CO sensing against H2 of the micro-TGS was then attempted using a double catalyst structure containing 0.3–30 wt% Pt/α-Al2O3 as a counterpart combustion catalyst. The CO and H2 output voltage signal of the double catalyst micro-TGS decreased with an increase in Pt content in the counterpart catalyst, with optimal selective CO detection being achieved with the micro-TGS containing 0.3 wt% Pt/α-Al2O3. Future studies are now planned to investigate the gas concentration dependence of the double catalyst micro-TGS response voltage for breath analysis.

Acknowledgments

This work was supported by the Knowledge Hub Aichi (the priority research project: P3-G3-S1) of Aichi Prefecture, Japan. The authors are grateful to Atsuko Hotta (AIST, Japan), Michi Yamaguchi (AIST, Japan), and Takaomi Nakashima (AIST, Japan) for their technical support in the preparation and investigation of the micro-TGS. TEM, STEM-HAADF, and STEM-EDS observations that were conducted at the Nano-Processing Facility, supported by the IBEC Innovation Platform, AIST. The authors are grateful to Noriyuki Saitou (AIST, Japan) for his support with the TEM, STEM-HAADF, and STEM-EDS observations. The authors also wish to thank Kazuo Sato (Aichi Institute of Technology, Japan) and Takaharu Kondo (Chubu University, Japan) for their comments regarding the present study.

Author Contributions

Woosuck Shin and Toshio Itoh conceived and designed the present study; Tomoyo Goto performed the experiments, analyzed the data and wrote the paper; and Takafumi Akamatsu contributed the experiment methods. All authors discussed the results and the implications of this manuscript.

Conflicts of Interest

The authors declare no conflict of interest.

References

  1. Di Francesco, F.; Fuoso, R.; Trivella, M.G.; Ceccarini, A. Breath analysis: Trends in techniques and clinical applications. Microchem. J. 2005, 79, 405–410. [Google Scholar] [CrossRef]
  2. Shin, W. Medical applications of breath hydrogen measurements. Anal. Bioanal. Chem. 2014, 406, 3931–3939. [Google Scholar] [CrossRef] [PubMed]
  3. Nishibori, M.; Shin, W.; Izu, N.; Itoh, T.; Matsubara, I. Sensing performance of thermoelectric hydrogen sensor for breath hydrogen analysis. Sens. Actuators B Chem. 2009, 137, 524–528. [Google Scholar] [CrossRef]
  4. Shin, W.; Nishibori, M.; Houlet, L.F.; Itoh, T.; Matsubara, I. Fabrication of thermoelectric gas sensors on micro-hotplates. Sens. Actuators B Chem. 2009, 139, 340–345. [Google Scholar] [CrossRef]
  5. Nishibori, M.; Shin, W.; Izu, N.; Itoh, T.; Matsubara, I. CO combustion catalyst for micro gas sensor application. J. Mater. Sci. 2011, 46, 1176–1183. [Google Scholar] [CrossRef]
  6. Nishibori, M.; Shin, W.; Izu, N.; Itoh, T.; Matsubara, I. CO oxidation performance of Au/Co3O4 catalyst on the micro gas seonsor device. Catal. Today 2013, 201, 85–91. [Google Scholar] [CrossRef]
  7. Nagai, D.; Nakashima, T.; Nishibori, M.; Itoh, T.; Izu, N.; Shin, W. Thermoelectric gas sensor with CO combustion catalyst for ppm level carbon monoxide detection. Sens. Actuators B Chem. 2013, 182, 789–794. [Google Scholar] [CrossRef]
  8. Park, N.H.; Akamatsu, T.; Itoh, T.; Izu, N.; Shin, W. Calorimetric thermoelectric gas sensor for the detection of hydrogen, methane and mixed gases. Sensors 2014, 14, 8350–8362. [Google Scholar] [CrossRef] [PubMed]
  9. Nagai, D.; Nishibori, M.; Itoh, T.; Kawabe, T.; Sato, K.; Shin, W. Ppm level methane detection using micro-thermoelectric gas sensors with Pd/Al2O3 combustion catalyst films. Sens. Actuators B Chem. 2015, 206, 488–494. [Google Scholar] [CrossRef]
  10. Park, E.D.; Lee, D.; Lee, H.C. Recent progress in selective CO removal in a H2-rich stream. Catal. Today 2009, 139, 280–290. [Google Scholar] [CrossRef]
  11. Satsuma, A.; Osaki, K.; Yanagihara, M.; Ohyama, J.; Shimizu, K. Activity controlling factors for low-temperature oxidation of CO over supported Pd catalysts. Appl. Catal. B 2013, 132–133, 511–518. [Google Scholar] [CrossRef]
  12. Kung, H.H.; Kung, M.C.; Costello, C.K. Supported Au catalysts for low temperature CO oxidation. J. Catal. 2003, 216, 425–432. [Google Scholar] [CrossRef]
  13. Xie, X.; Li, Y.; Liu, Z.Q.; Haruta, M.; Shen, W. Low-temperature oxidation of CO catalysed by Co3O4 nanorods. Nature 2009, 458, 746–749. [Google Scholar] [CrossRef] [PubMed]
  14. Gadgil, M.M.; Sasikala, R.; Kulshreshtha, S.K. CO oxidation over Pd/SnO2 catalyst. J. Mol. Catal. 1994, 87, 297–309. [Google Scholar] [CrossRef]
  15. Wang, S.; Wang, Y.; Jiang, J.; Liu, R.; Li, M.; Wang, Y.; Su, Y.; Zhu, B.; Zhang, S.; Huang, W.; Wu, S. A DRIFT study of low-temperature CO oxidation over Au/SnO2 catalyst prepared by co-precipitation method. Catal. Commun. 2009, 10, 640–644. [Google Scholar] [CrossRef]
  16. Lu, Z.; Ma, D.; Yang, L.; Wang, X.; Xu, G.; Yang, Z. Direct CO oxidation by lattice oxygen on the SnO2(110) surface: A DFT study. Phys. Chem. Chem. Phys. 2014, 16, 12488–12494. [Google Scholar] [CrossRef] [PubMed]
  17. Sakai, Y.; Kadosaki, M.; Matsubara, I.; Itoh, T. Preparation of total VOC sensor with sensor-response stability for humidity by noble metal addition to SnO2. J. Ceram. Soc. Jpn. 2009, 117, 1297–1301. [Google Scholar] [CrossRef]
  18. Itoh, T.; Nakashima, T.; Akamatsu, T.; Izu, N.; Shin, W. Nonanal gas sensing properties of platinum, palladium, and gold-loaded tin oxide VOCs sensors. Sens. Actuators B Chem. 2013, 187, 135–141. [Google Scholar] [CrossRef]
  19. Nishibori, M.; Shin, W.; Houlet, L.F.; Tajima, K.; Itoh, T.; Izu, N.; Matsubara, I. Preparation of micro-thermoelectric hydrogen sensor loading two kinds of catalysts to enhance gas selectivity. J. Ceram. Soc. Jpn. 2007, 115, 748–750. [Google Scholar] [CrossRef]
  20. Amalric-Popescu, D.; Bozon-Verduraz, F. Infrared studies on SnO2 and Pd/SnO2. Catal. Today 2001, 70, 139–154. [Google Scholar] [CrossRef]
  21. Childers, D.; Saha, A.; Schweitzer, N.; Rioux, R.M.; Miller, J.T.; Meyer, R.J. Correlating heat of adsorption of CO to reaction selectivity: Geometric effects vs electronic effects in neopentane isomerization over Pt and Pd catalysts. ACS Catal. 2013, 3, 2487–2496. [Google Scholar] [CrossRef]
  22. Raphulu, M.C.; McPherson, J.; van der Lingen, E.; Anderson, J.A.; Scurrell, M.S. Investigation of the active site and the mode of Au/TiO2 catalyst deactivation using diffuse reflectance infrared fourier transform spectroscopy (DRIFTS). Gold Bull. 2010, 43, 21–28. [Google Scholar] [CrossRef]
  23. Haruta, M.; Yamada, N.; Kobayashi, T.; Iijima, S. Gold catalysts prepared by coprecipitation for low-temperature oxidation of hydrogen and of carbon monoxide. J. Catal. 1989, 115, 301–309. [Google Scholar] [CrossRef]

