1. Introduction
Quartz tuning forks are designed for high-precision frequency control and are widely used in clocks, watches, and digital circuit frequency standards. By taking advantage of their extreme stability in frequency, their high quality factor, their self-sensing and self-actuating capabilities, and the ease with which the vibration signal may be obtained with fewer components than the conventional atomic force microscopy (AFM) probes, and so on, they can be used as force sensors in AFM [
1,
2,
3,
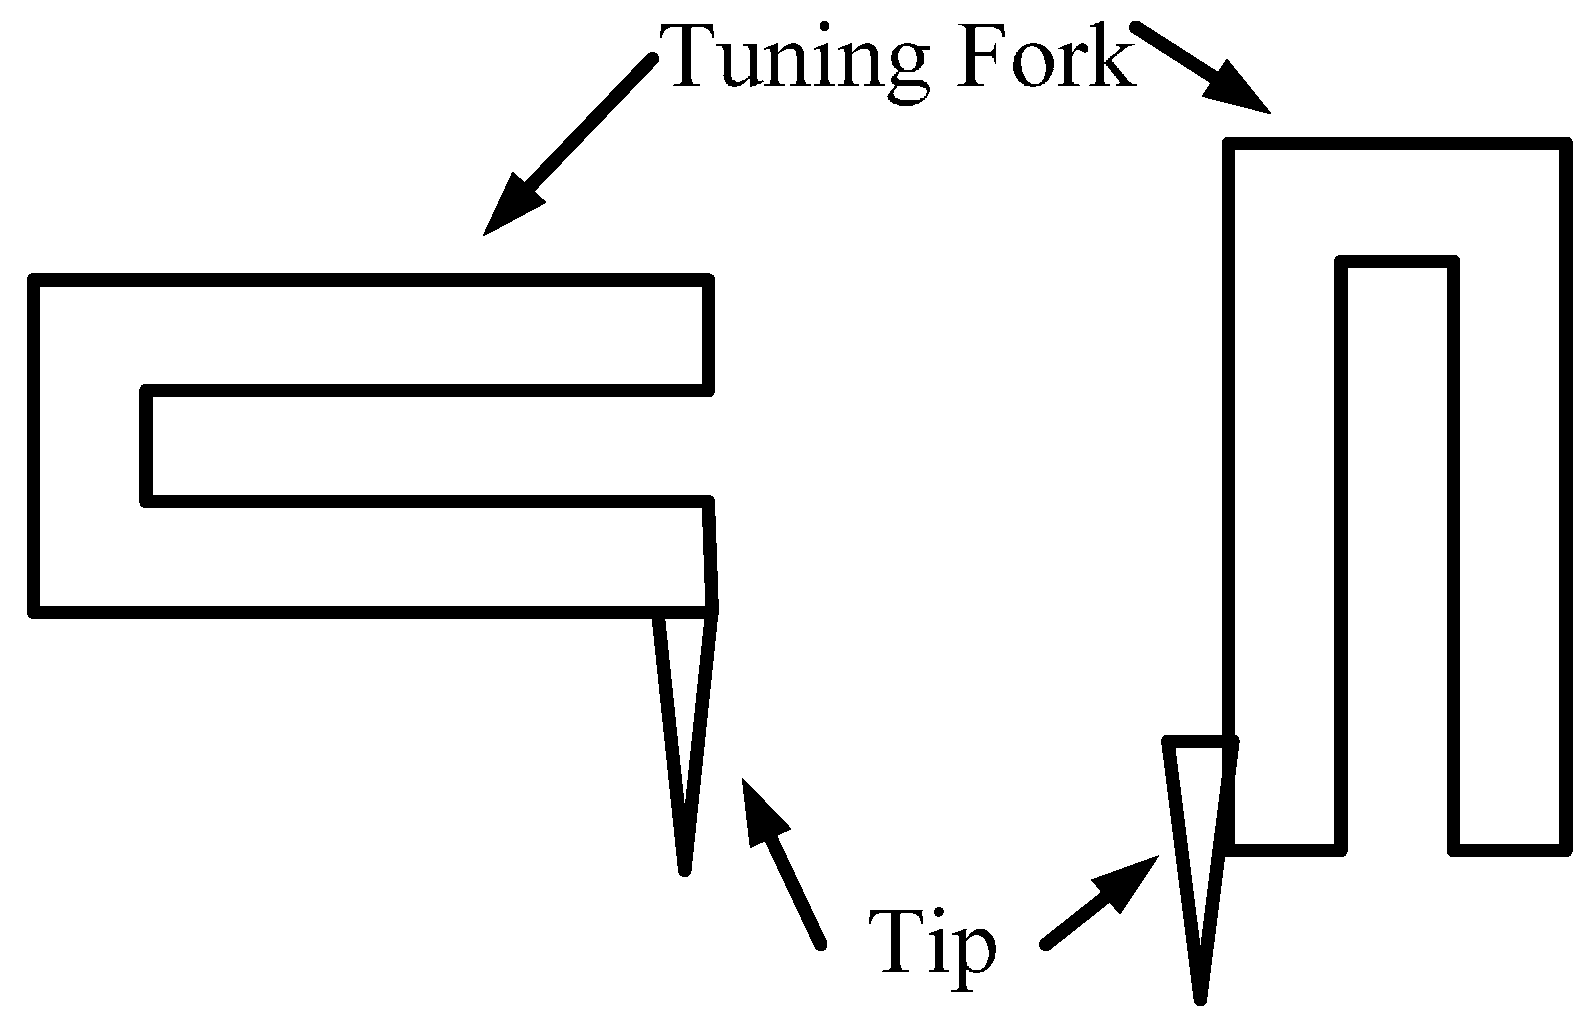
4]. The tuning fork AFM probes are typically realized in two forms (
Figure 1). The tip of the probe could be a carbon nanotube, a fiber, a conventional AFM cantilever, or another type of stylus.
Figure 1.
Typical tuning fork probe structures.
Figure 1.
Typical tuning fork probe structures.
These probes retain their high quality factor and high prong stiffness which makes them a stable source for small vibration amplitudes. On the other hand, the high stiffness is a drawback when measuring soft samples. To couple a soft cantilever to the quartz tuning fork, Bayat
et al. designed a novel probe [
5] which has been commercialized by the Nanosensors Corporation (Neuchatel, Switzerland). As shown in
Figure 2, a U-shaped silicon nitride cantilever is combined in a symmetrical arrangement with a quartz tuning fork. A slant probing tip is at the free end of the cantilever. The two legs of the cantilever are fixed to the two prongs of the tuning fork respectively. The parameters of the Akiyama probe are as follows: the resonant frequency is 45–55 kHz; the spring constant is about 5 N/m; the cantilever’s length, width, thickness are respectively 310 μm, 90 μm, 3.7 μm; and the diameter of the tip is less than 15 nm. The tip point is vertical, and lies perpendicular to the lateral plane defined by the tuning fork and cantilever. Under the excitation of the tuning fork, the probe is self-sensing by converting the deflection of the cantilever to a change in charge.
Figure 2.
The appearance and motion of an Akiyama probe.
Figure 2.
The appearance and motion of an Akiyama probe.
For the long, soft cantilever, this Akiyama probe cannot be used in non-contact AFM at its first eigenmode like the conventional tuning fork probe can [
6]. As is well known, a cantilever working at higher eigenmode frequencies can increase the effective stiffness [
7,
8]. Thus, working at a higher eigenmode can extend the range of application of the Akiyama probe.
2. Finite Element Analysis of the Probe
To account for realistic probe geometries and the electric field distribution, finite element analysis (FEA) can be a powerful tool. ANSYS was used in this FEA and the parameters [
2] are shown in
Table 1.
Table 1.
FEA parameters.
| Parameters | Tuning Fork (Quartz) | Cantilever (SiN) |
|---|
| Elastic constant matrix/GPa |
| None |
| Piezoelectric constant matrix C/m2 |
| None |
| Permittivity F/m | 4.43, 4.43, 4.63 (x-, y-, z-directions, respectively) | |
| Young modulus, GPa | None | 180 |
| Poisson’s ratio | None | 0.28 |
| Density kg/m3 | 2290 | 2300 |
| Length, μm | 2690 | 310 |
| Width, μm | 220 | 90 |
| Thickness, μm | 100 | 3.7 |
| Finite element | SOLID226 | SOLID95 |
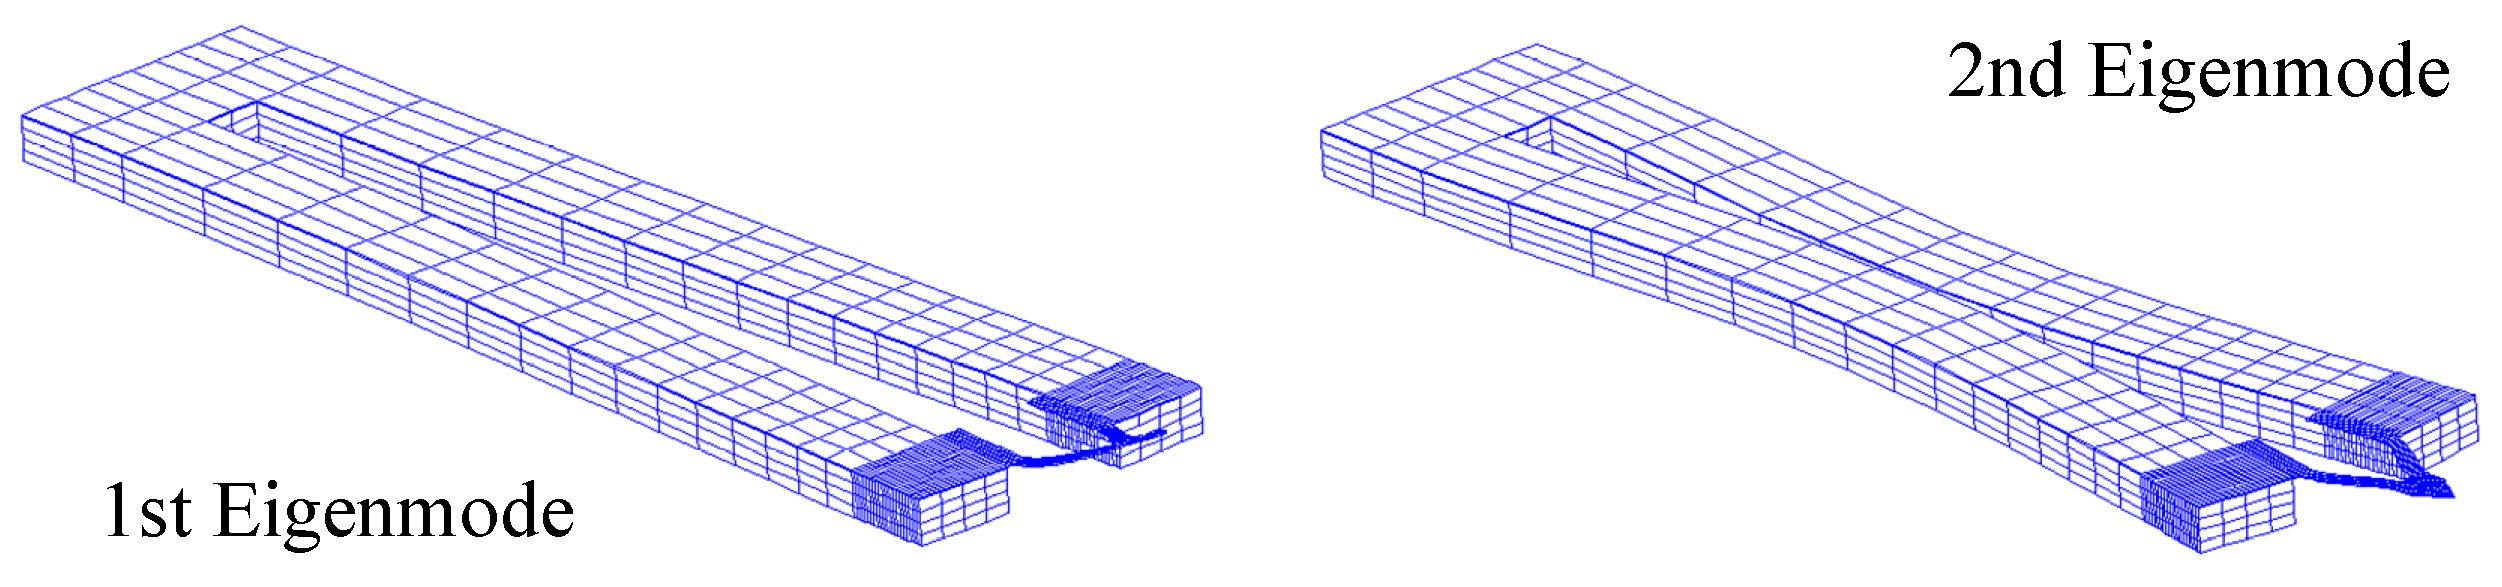
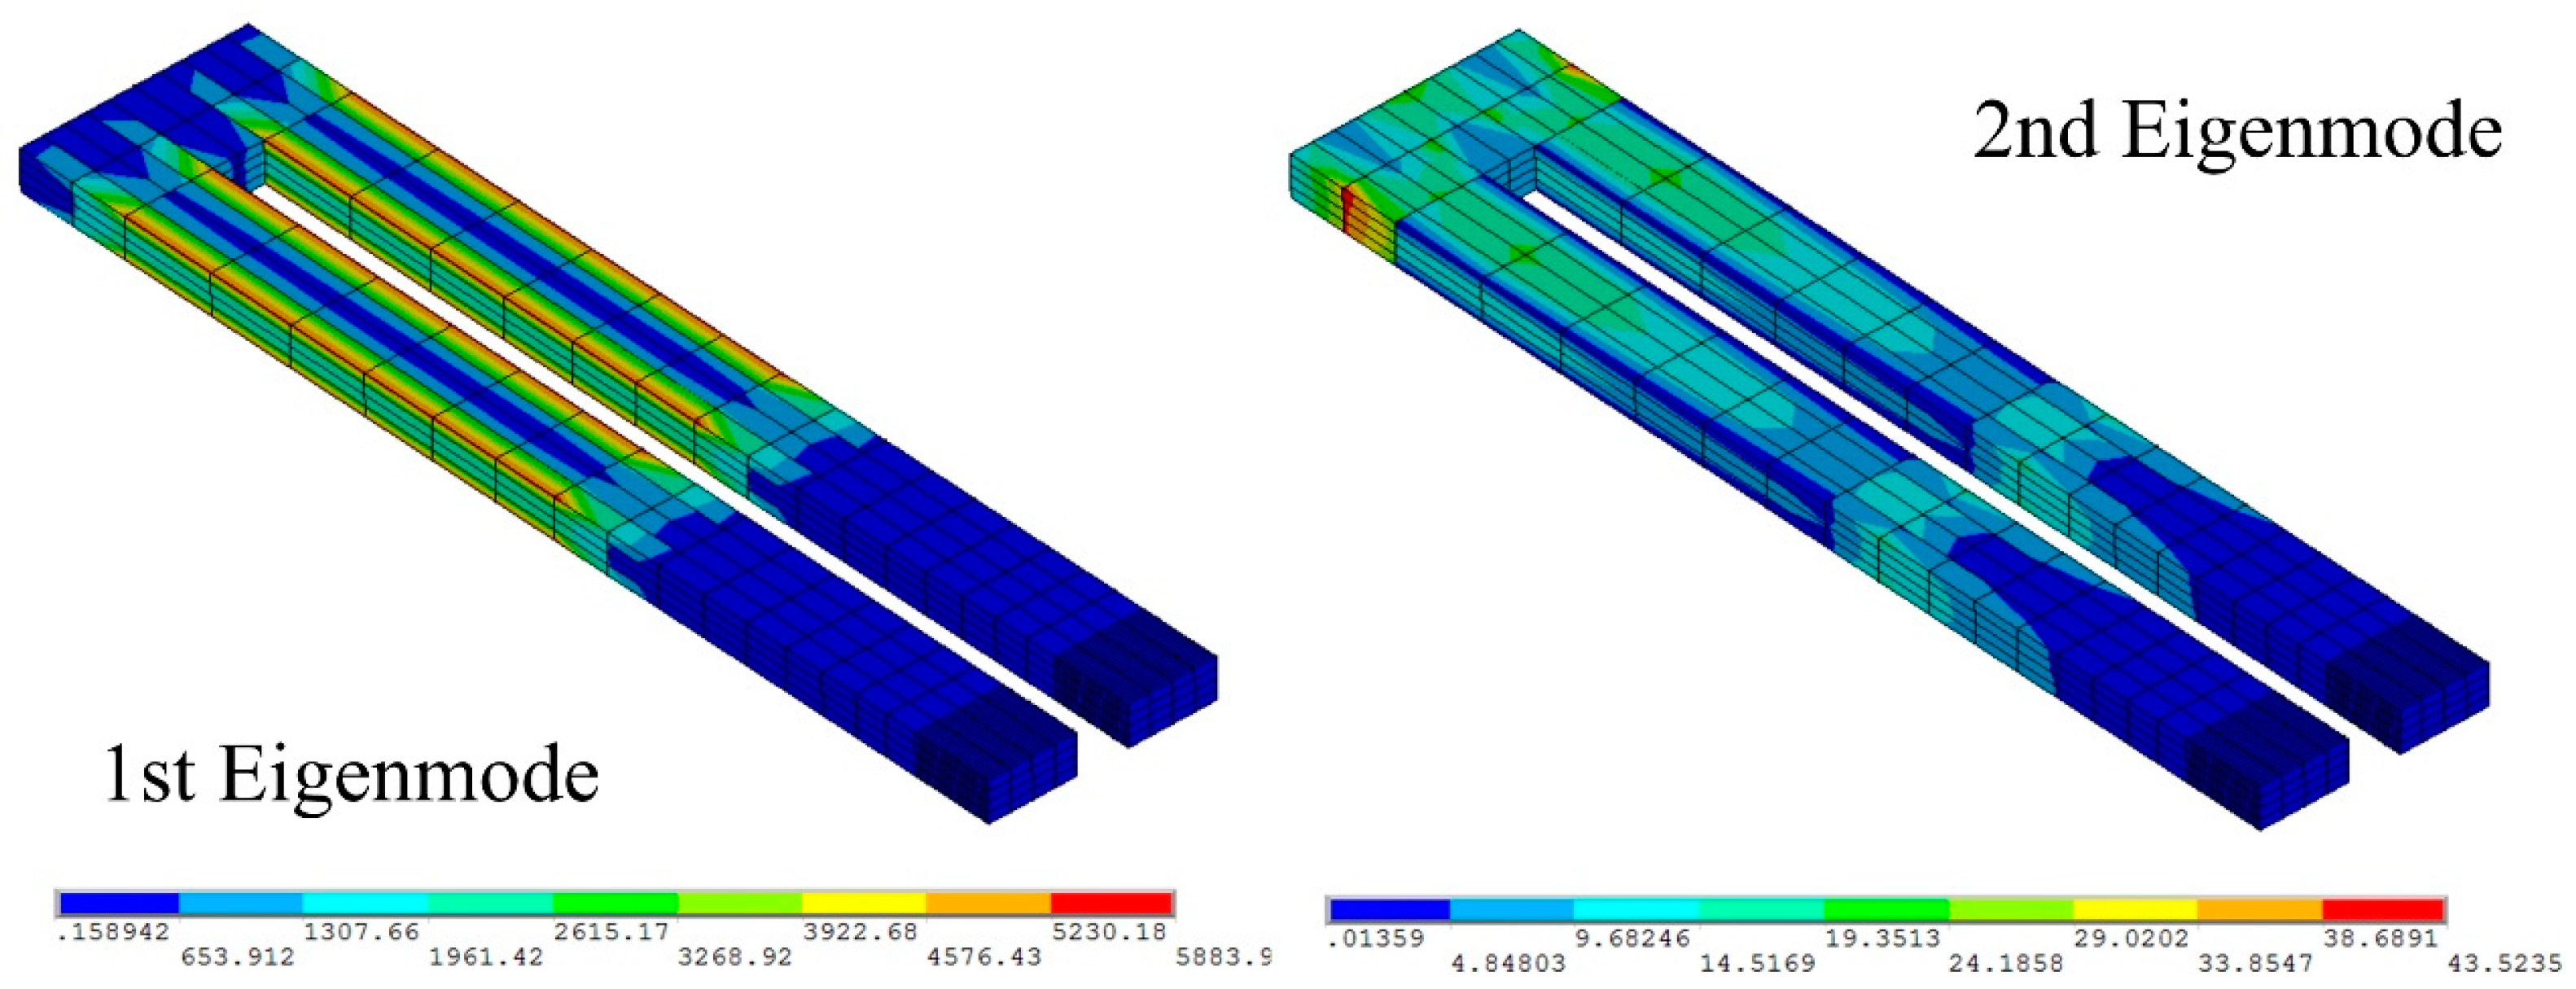
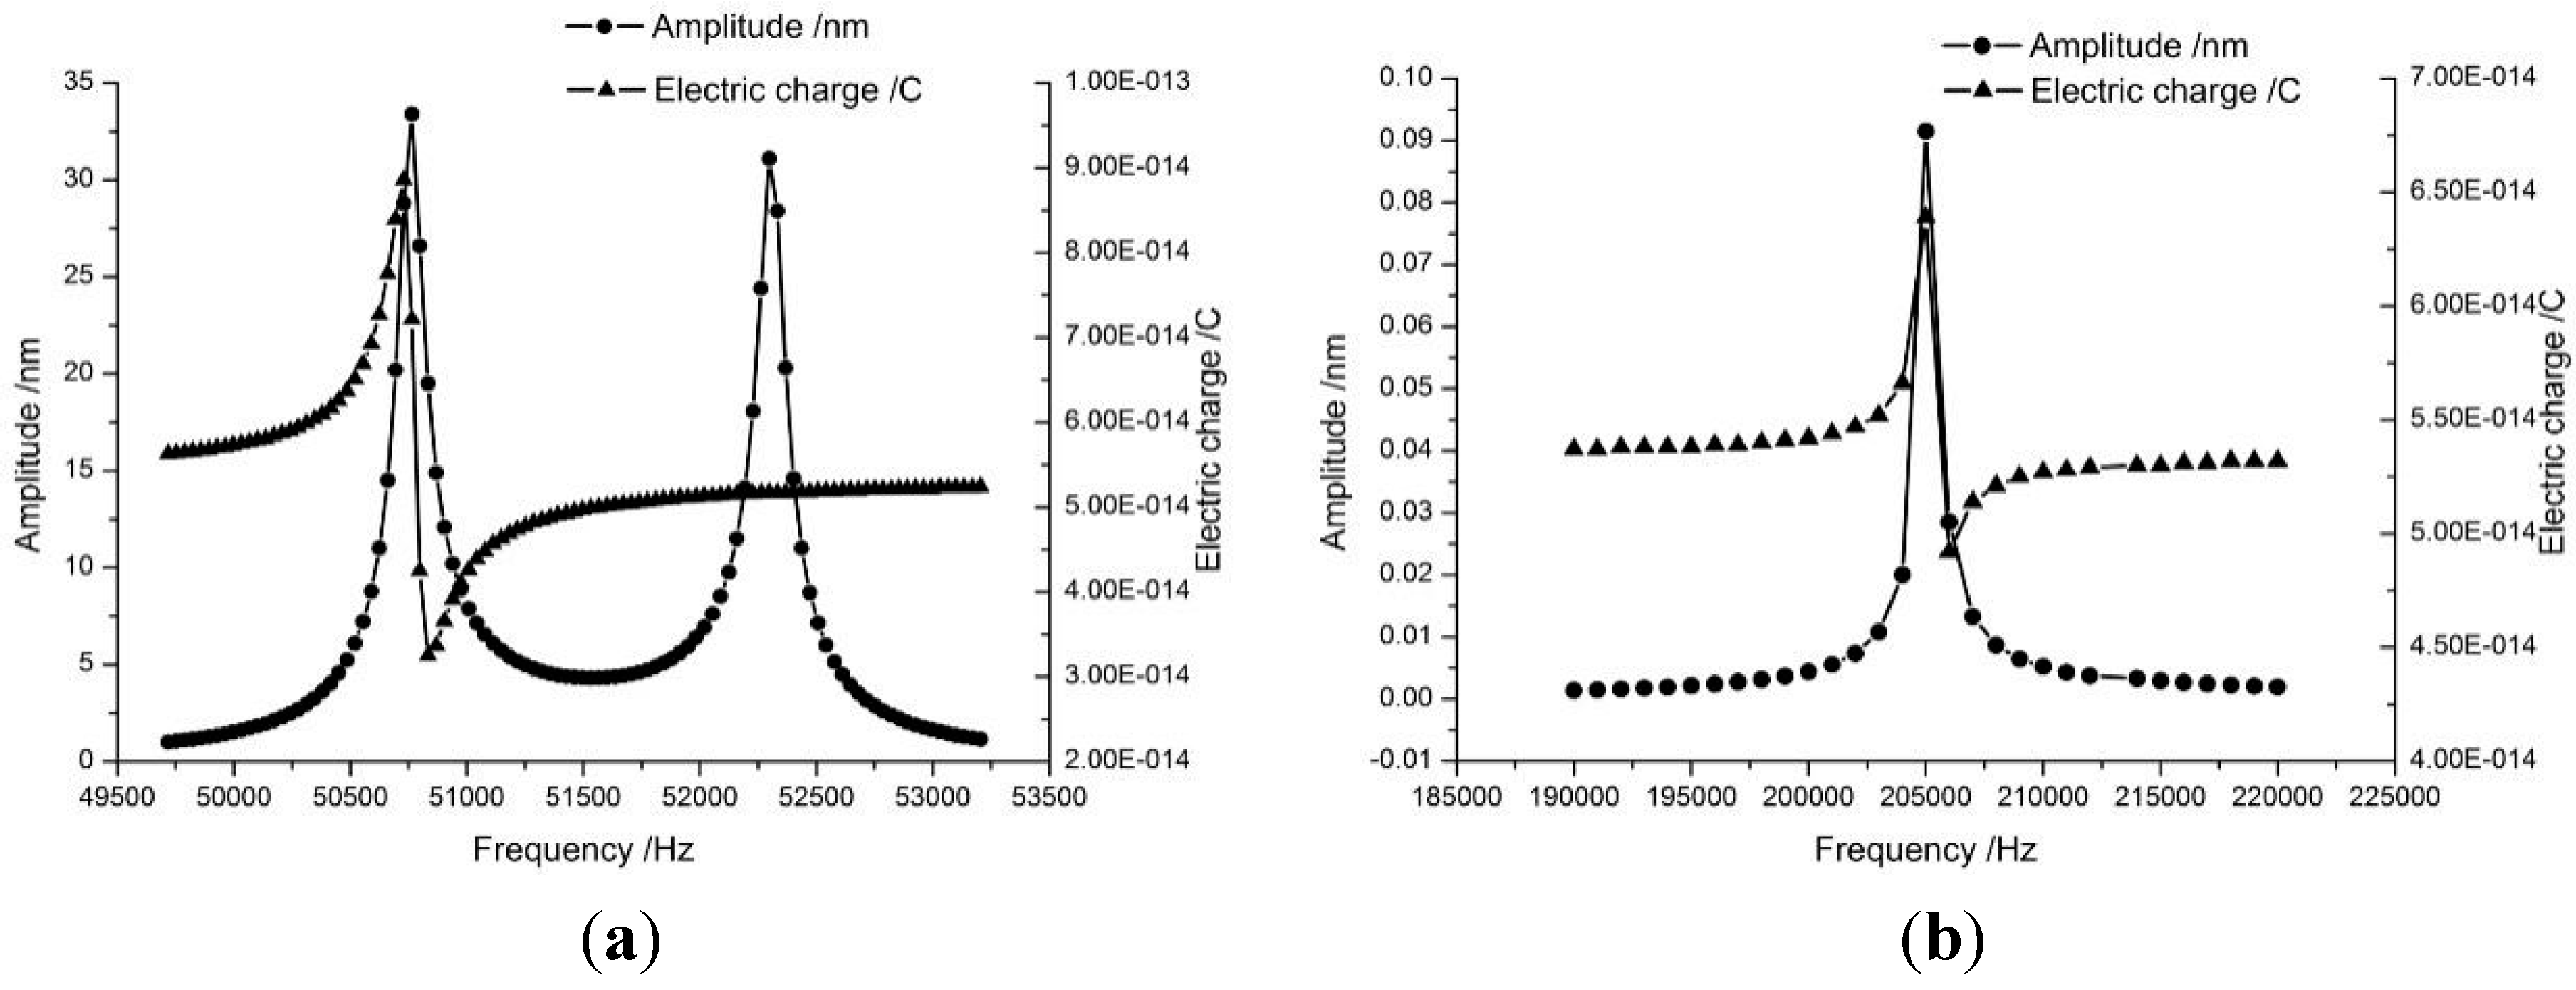
Figure 3 and
Figure 4 are the results of the physical and electric analysis at the first and the second eigenmodes respectively. As shown in
Figure 5, the vibration amplitude of the second eigenmode is much smaller than that of the first eigenmode, but the electric charge outputs are of the same order of magnitude, which means that the Akiyama probe can obtain detectable low-level outputs.
Figure 3.
The vibration analysis of the Akiyama probe.
Figure 3.
The vibration analysis of the Akiyama probe.
Figure 4.
The electric field analysis of the Akiyama probe.
Figure 4.
The electric field analysis of the Akiyama probe.
Figure 5.
The frequency response curve predicted by FEA. (a) The first eigenmode; (b) The second eigenmode.
Figure 5.
The frequency response curve predicted by FEA. (a) The first eigenmode; (b) The second eigenmode.
Conventional small-amplitude AFMs often use short, stiff cantilevers to keep the small vibrations on a low level and ensure that the vibration can be detected. This Akiyama probe, with its long cantilever, may manifest unique behavior while working as a small-amplitude AFM.
3. Results and Discussion
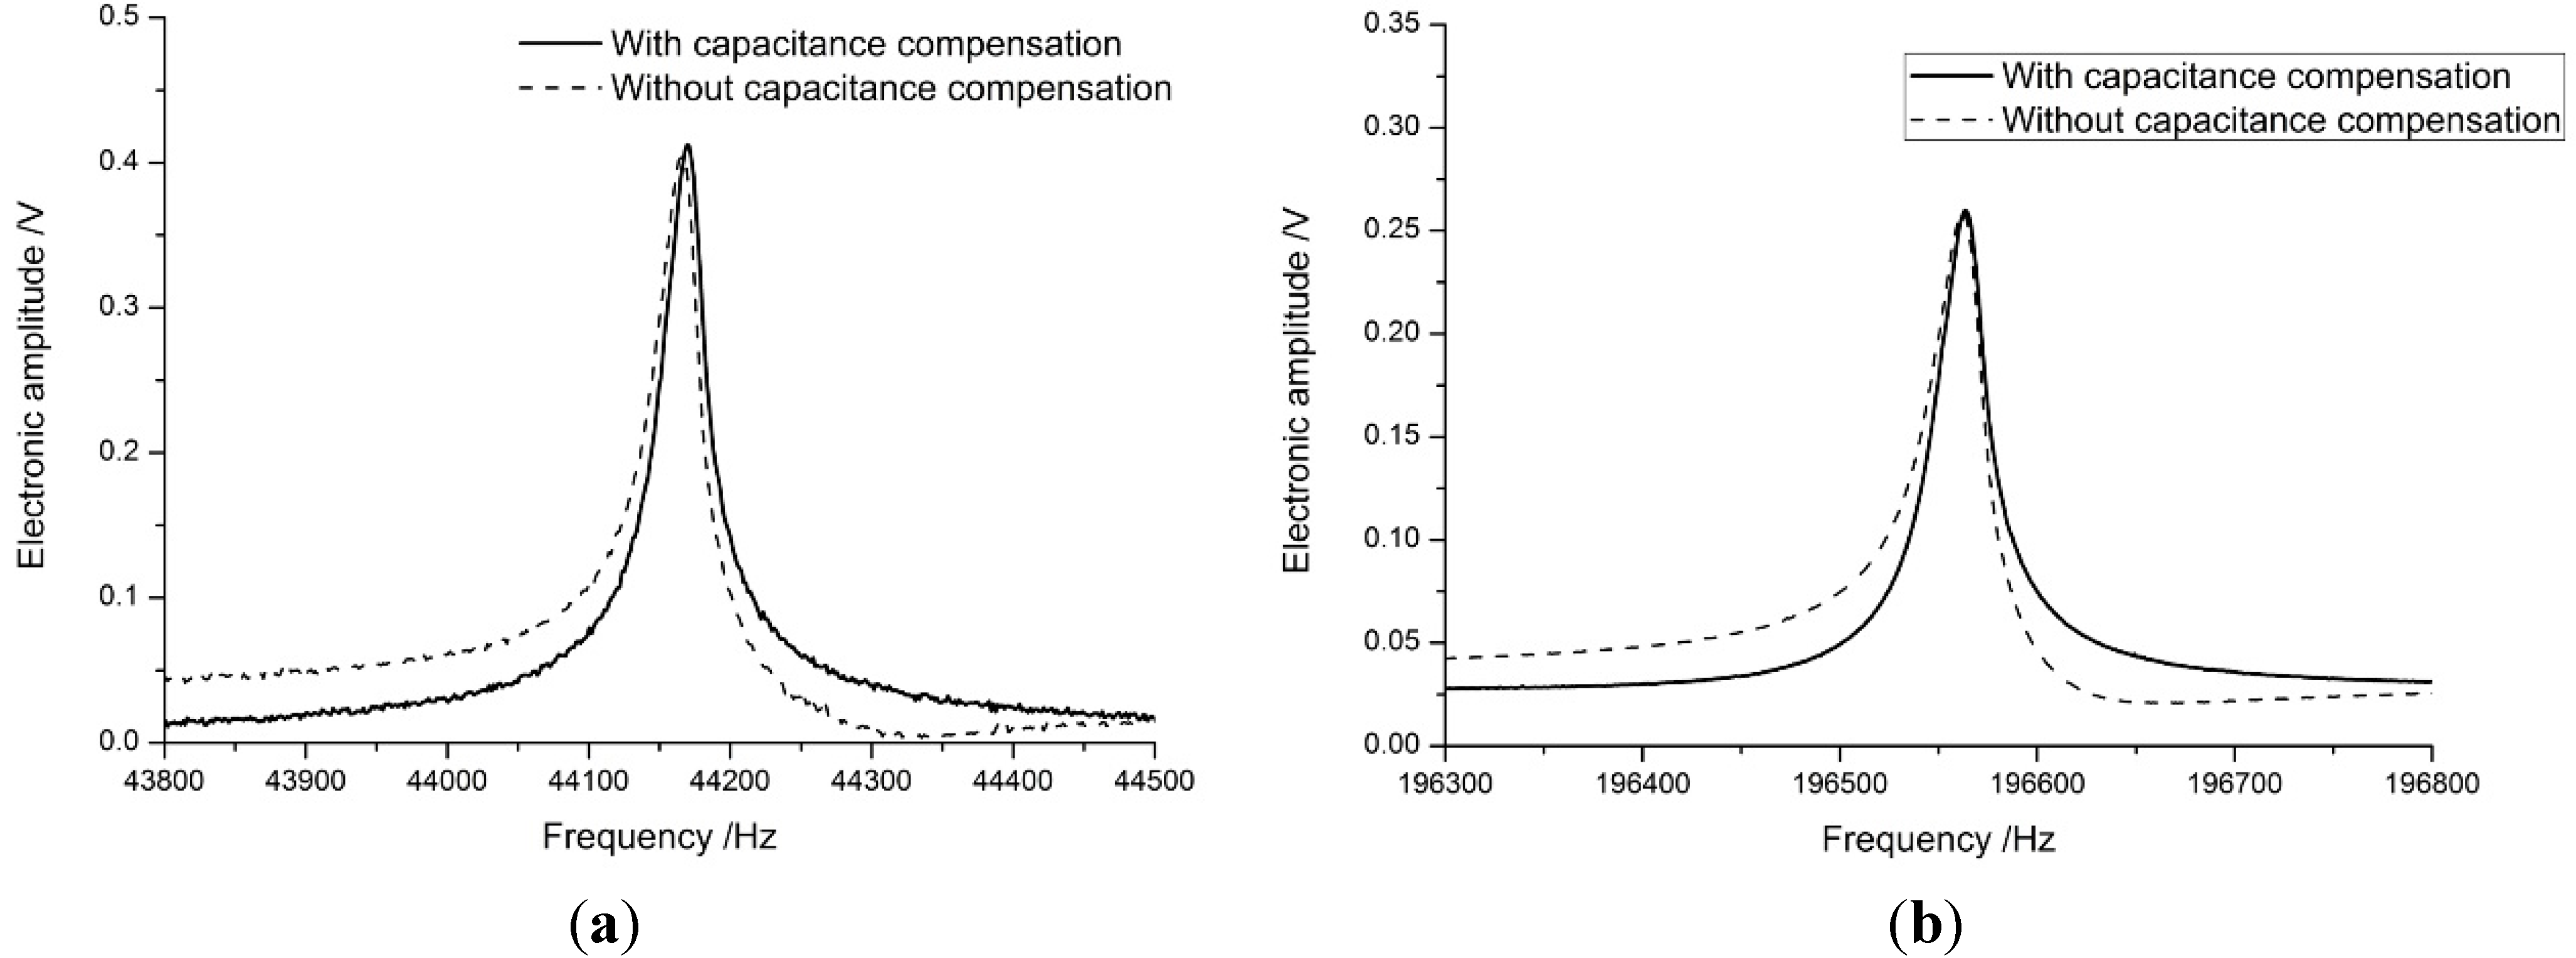
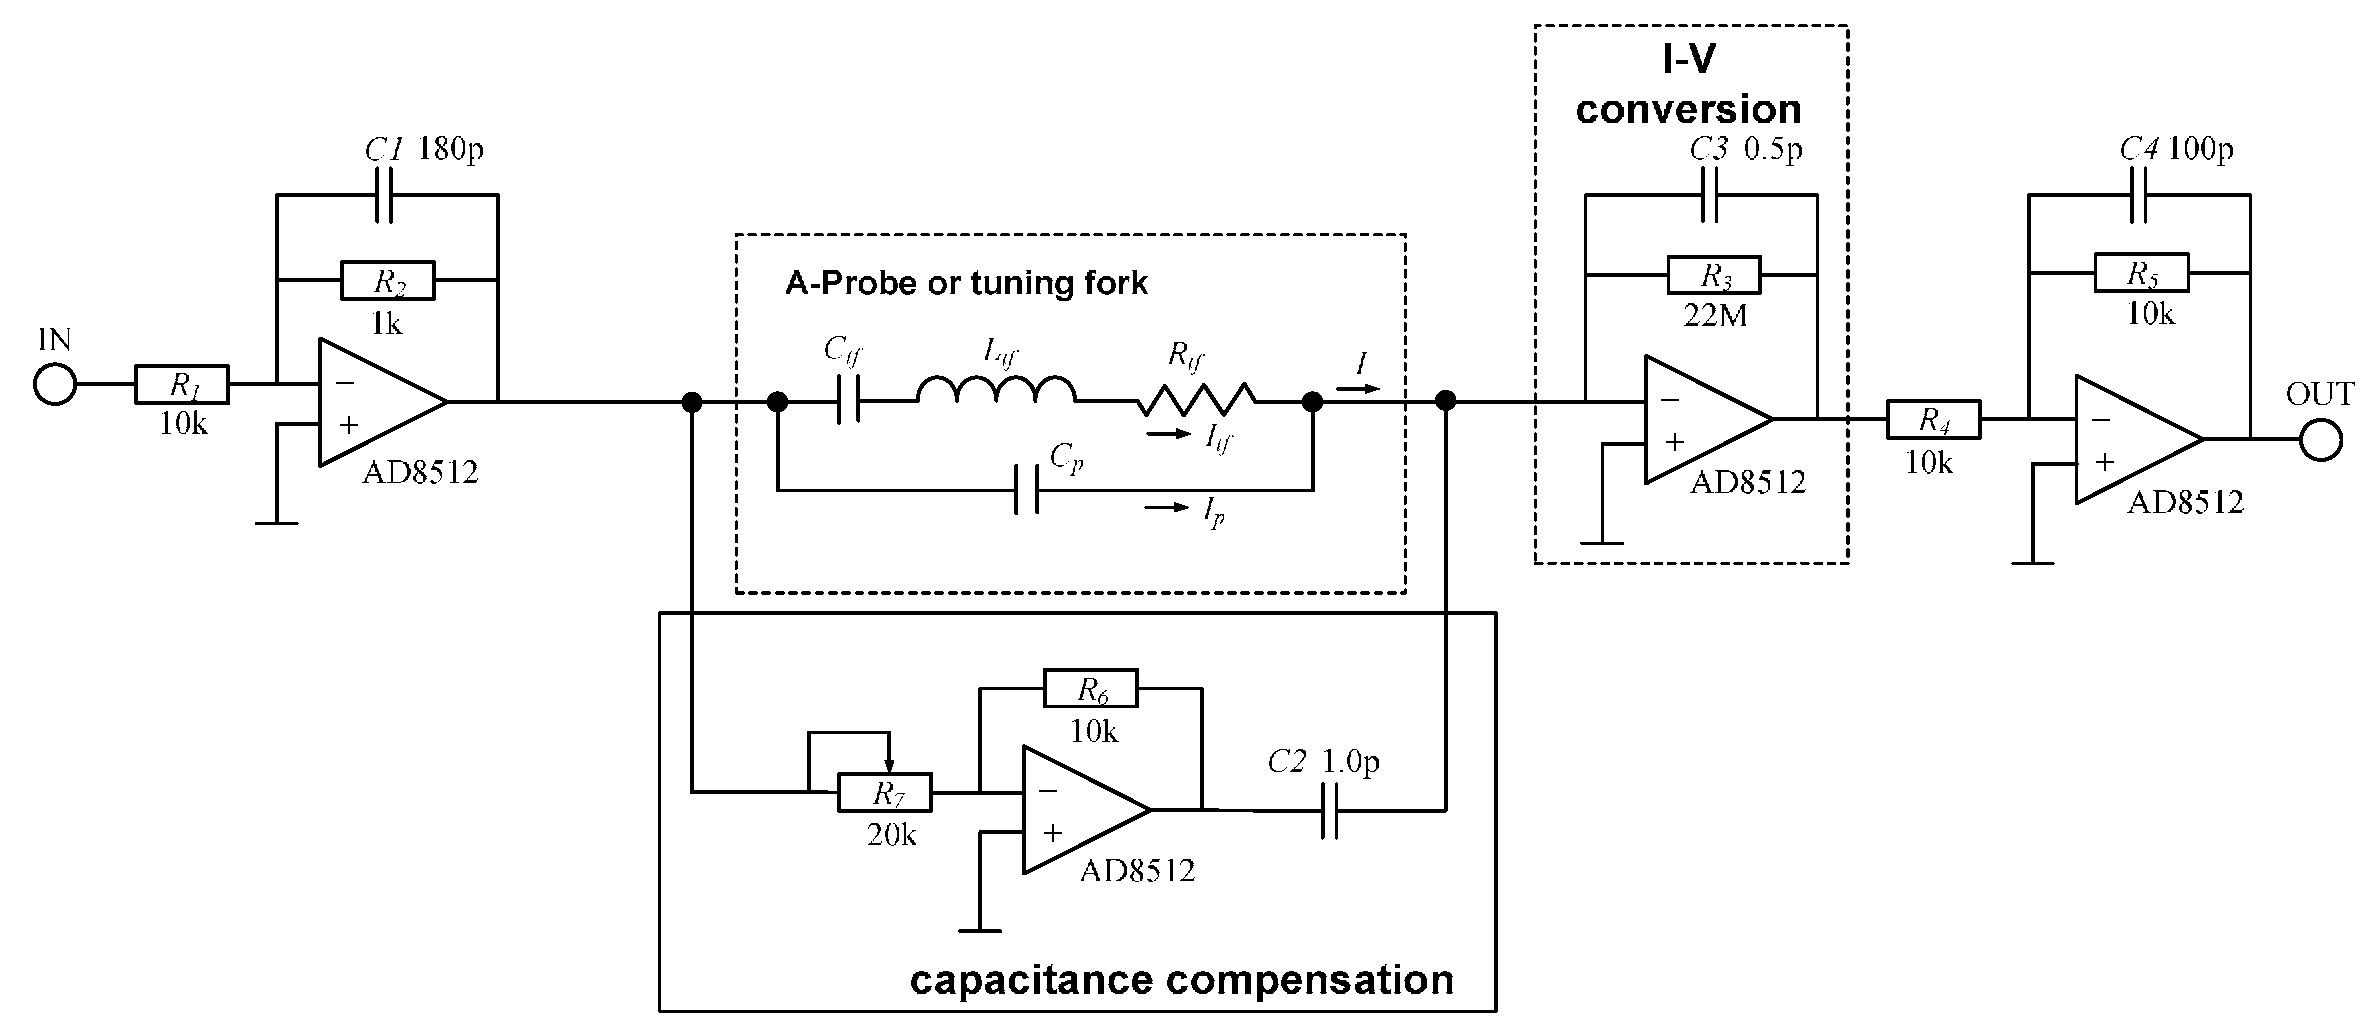
The Akiyama probe uses an amplification board based on a typical circuit [
2] for I-V conversion and capacitance compensation, as shown in
Figure 6 and the influence of the parasitic capacitance is shown in
Figure 7.
Figure 6.
Typical circuit diagram for an Akiyama probe amplification board.
Figure 6.
Typical circuit diagram for an Akiyama probe amplification board.
Figure 7.
The electrical amplitude-frequency response of an Akiyama probe. (a) The first eigenmode; (b) The second eigenmode.
Figure 7.
The electrical amplitude-frequency response of an Akiyama probe. (a) The first eigenmode; (b) The second eigenmode.
3.1. Frequency Response of the Probe
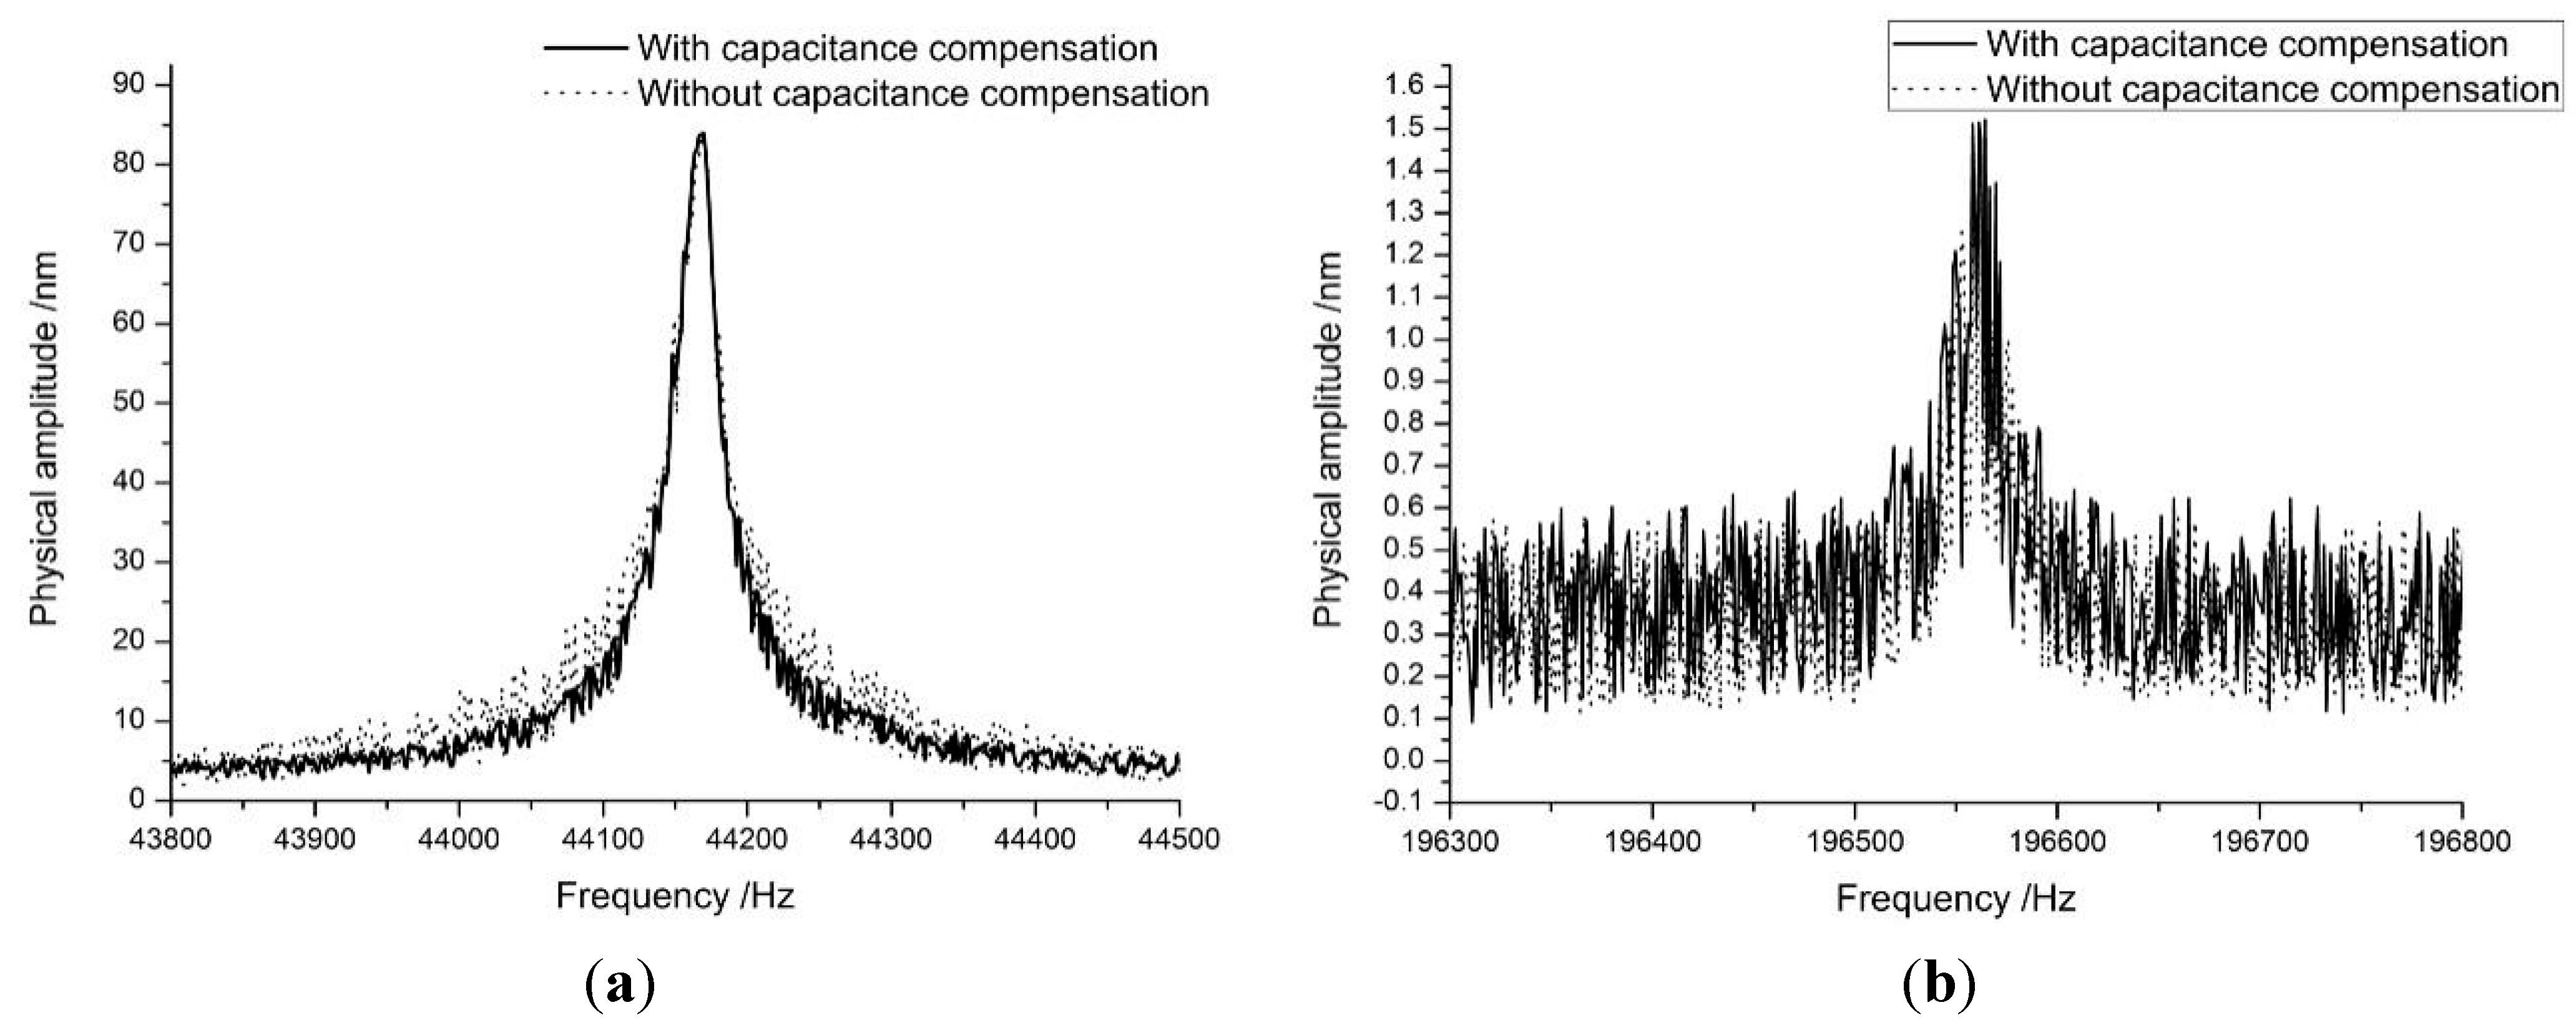
The vibration amplitude of the cantilever is measured by laser Doppler vibrometer (LDV). As shown in
Figure 8, the amplitude of the first eigenmode is about 85 nm, the second eigenmode’s amplitude is about 1.5 nm which is of the same order of magnitude as the conventional small amplitude AFM. The LDV controller (OFV-3001, Polytec, Waldbronn, Germany) had a velocity decoder resolution of 0.5 μm/s (RMS), a maximum frequency of 250 kHz, and a measuring range of 5 mm/s/V.
Figure 8.
The vibration amplitude-frequency response of an Akiyama probe. (a) The first eigenmode; (b) The second eigenmode.
Figure 8.
The vibration amplitude-frequency response of an Akiyama probe. (a) The first eigenmode; (b) The second eigenmode.
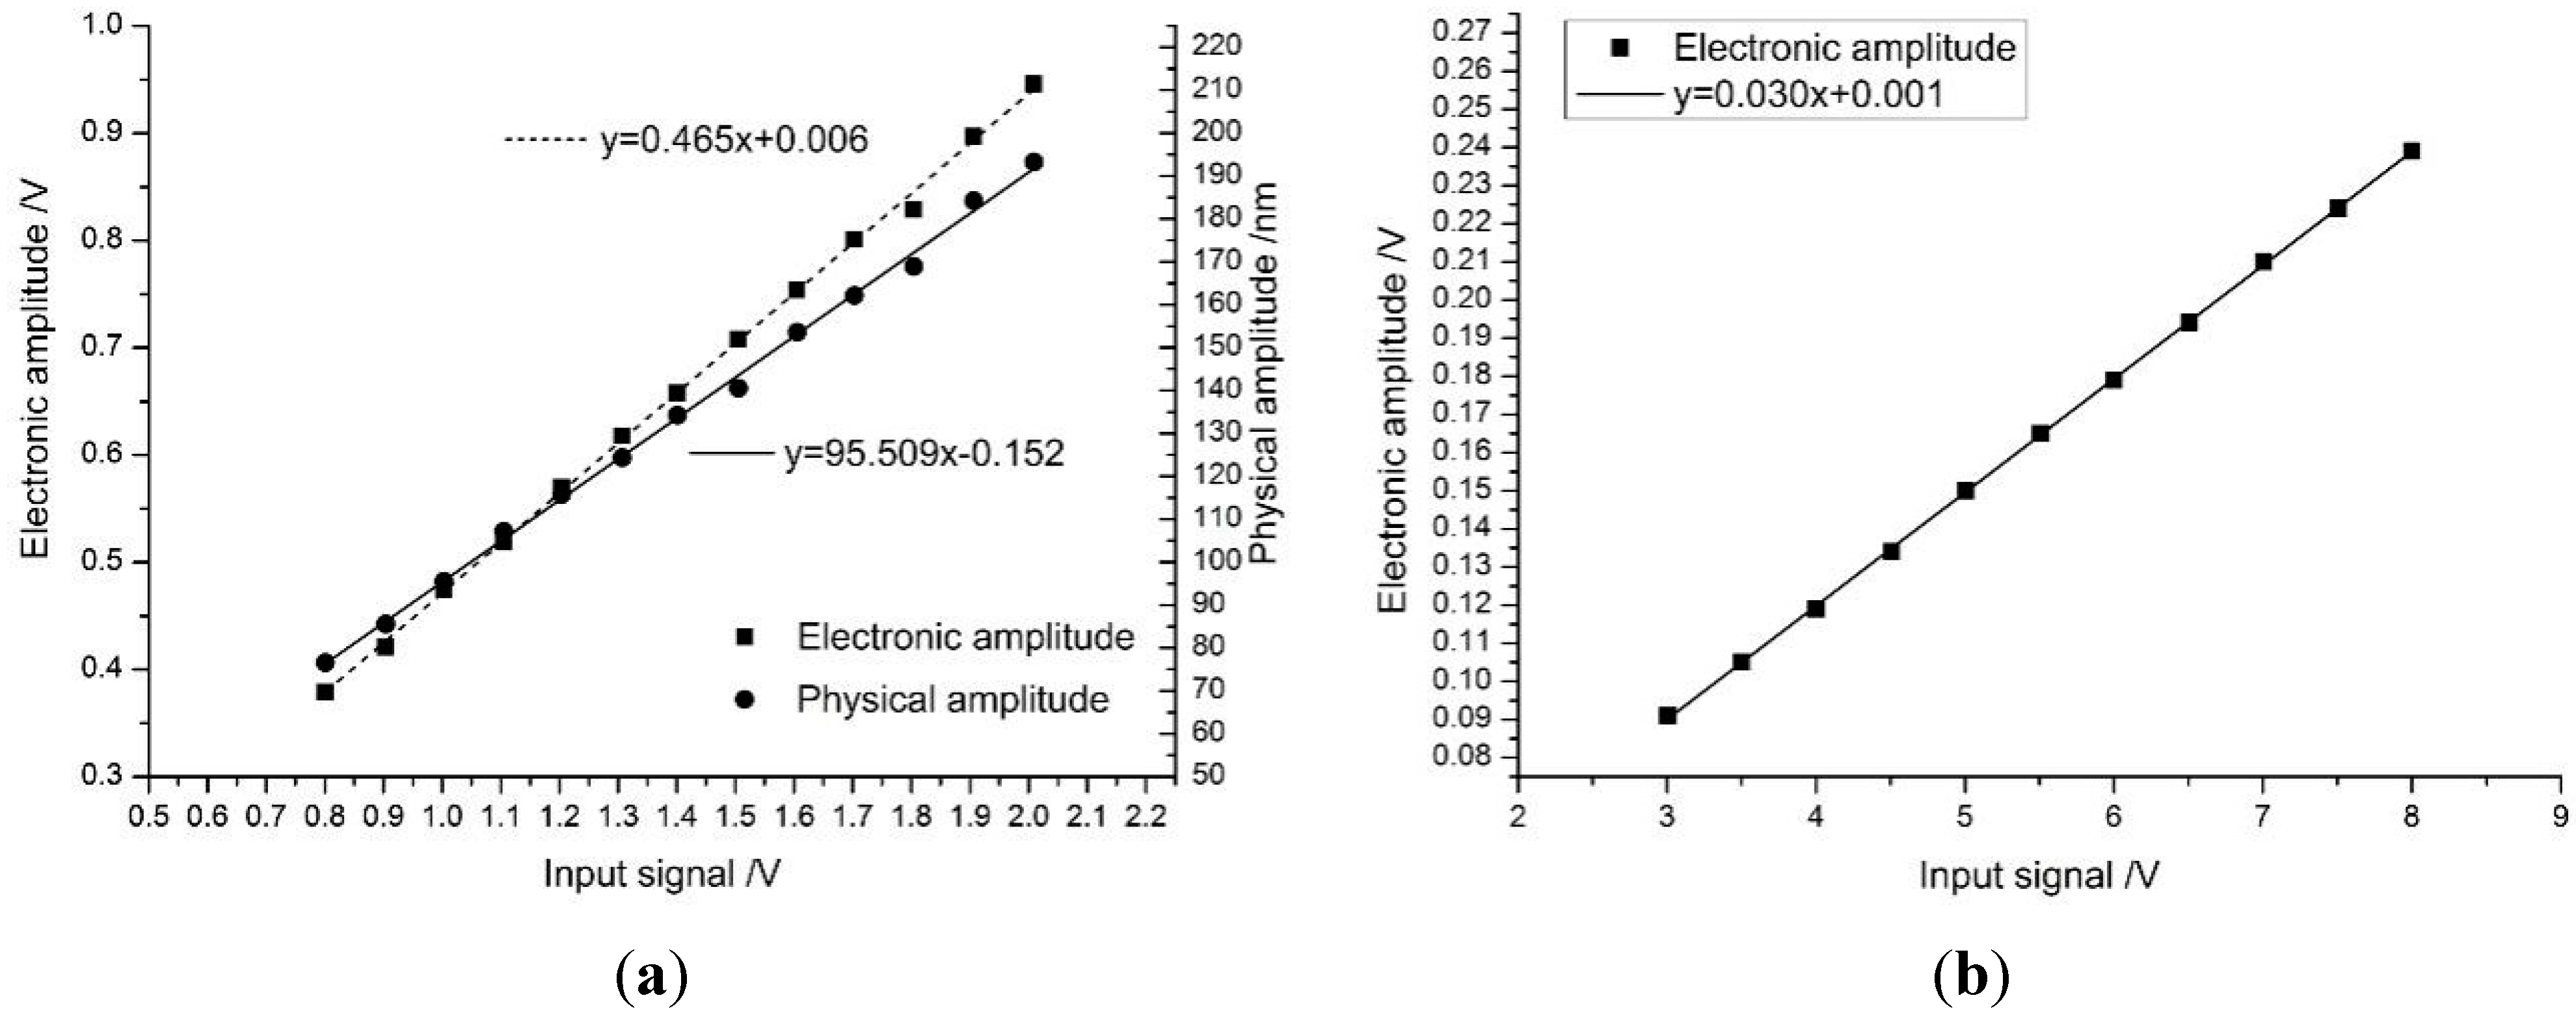
Differing from the FEA prediction, the electrical output from the second eigenmode was only 10% of that of the first eigenmode, the sensitivity is 0.030 against 0.465 as shown in
Figure 9; however, the signal was still easily obtained with the same amplification as that for the first eigenmode, so the amplification board can remain the same for different tests. This meant that the same system could accomplish both normal tapping and small-amplitude tapping modes by changing the excitation signal frequency alone.
Figure 9.
The scale (sensitivity) of the first and second eigenmodes. (a) The first eigenmode; (b) The second eigenmode.
Figure 9.
The scale (sensitivity) of the first and second eigenmodes. (a) The first eigenmode; (b) The second eigenmode.
3.2. The Approach Curve
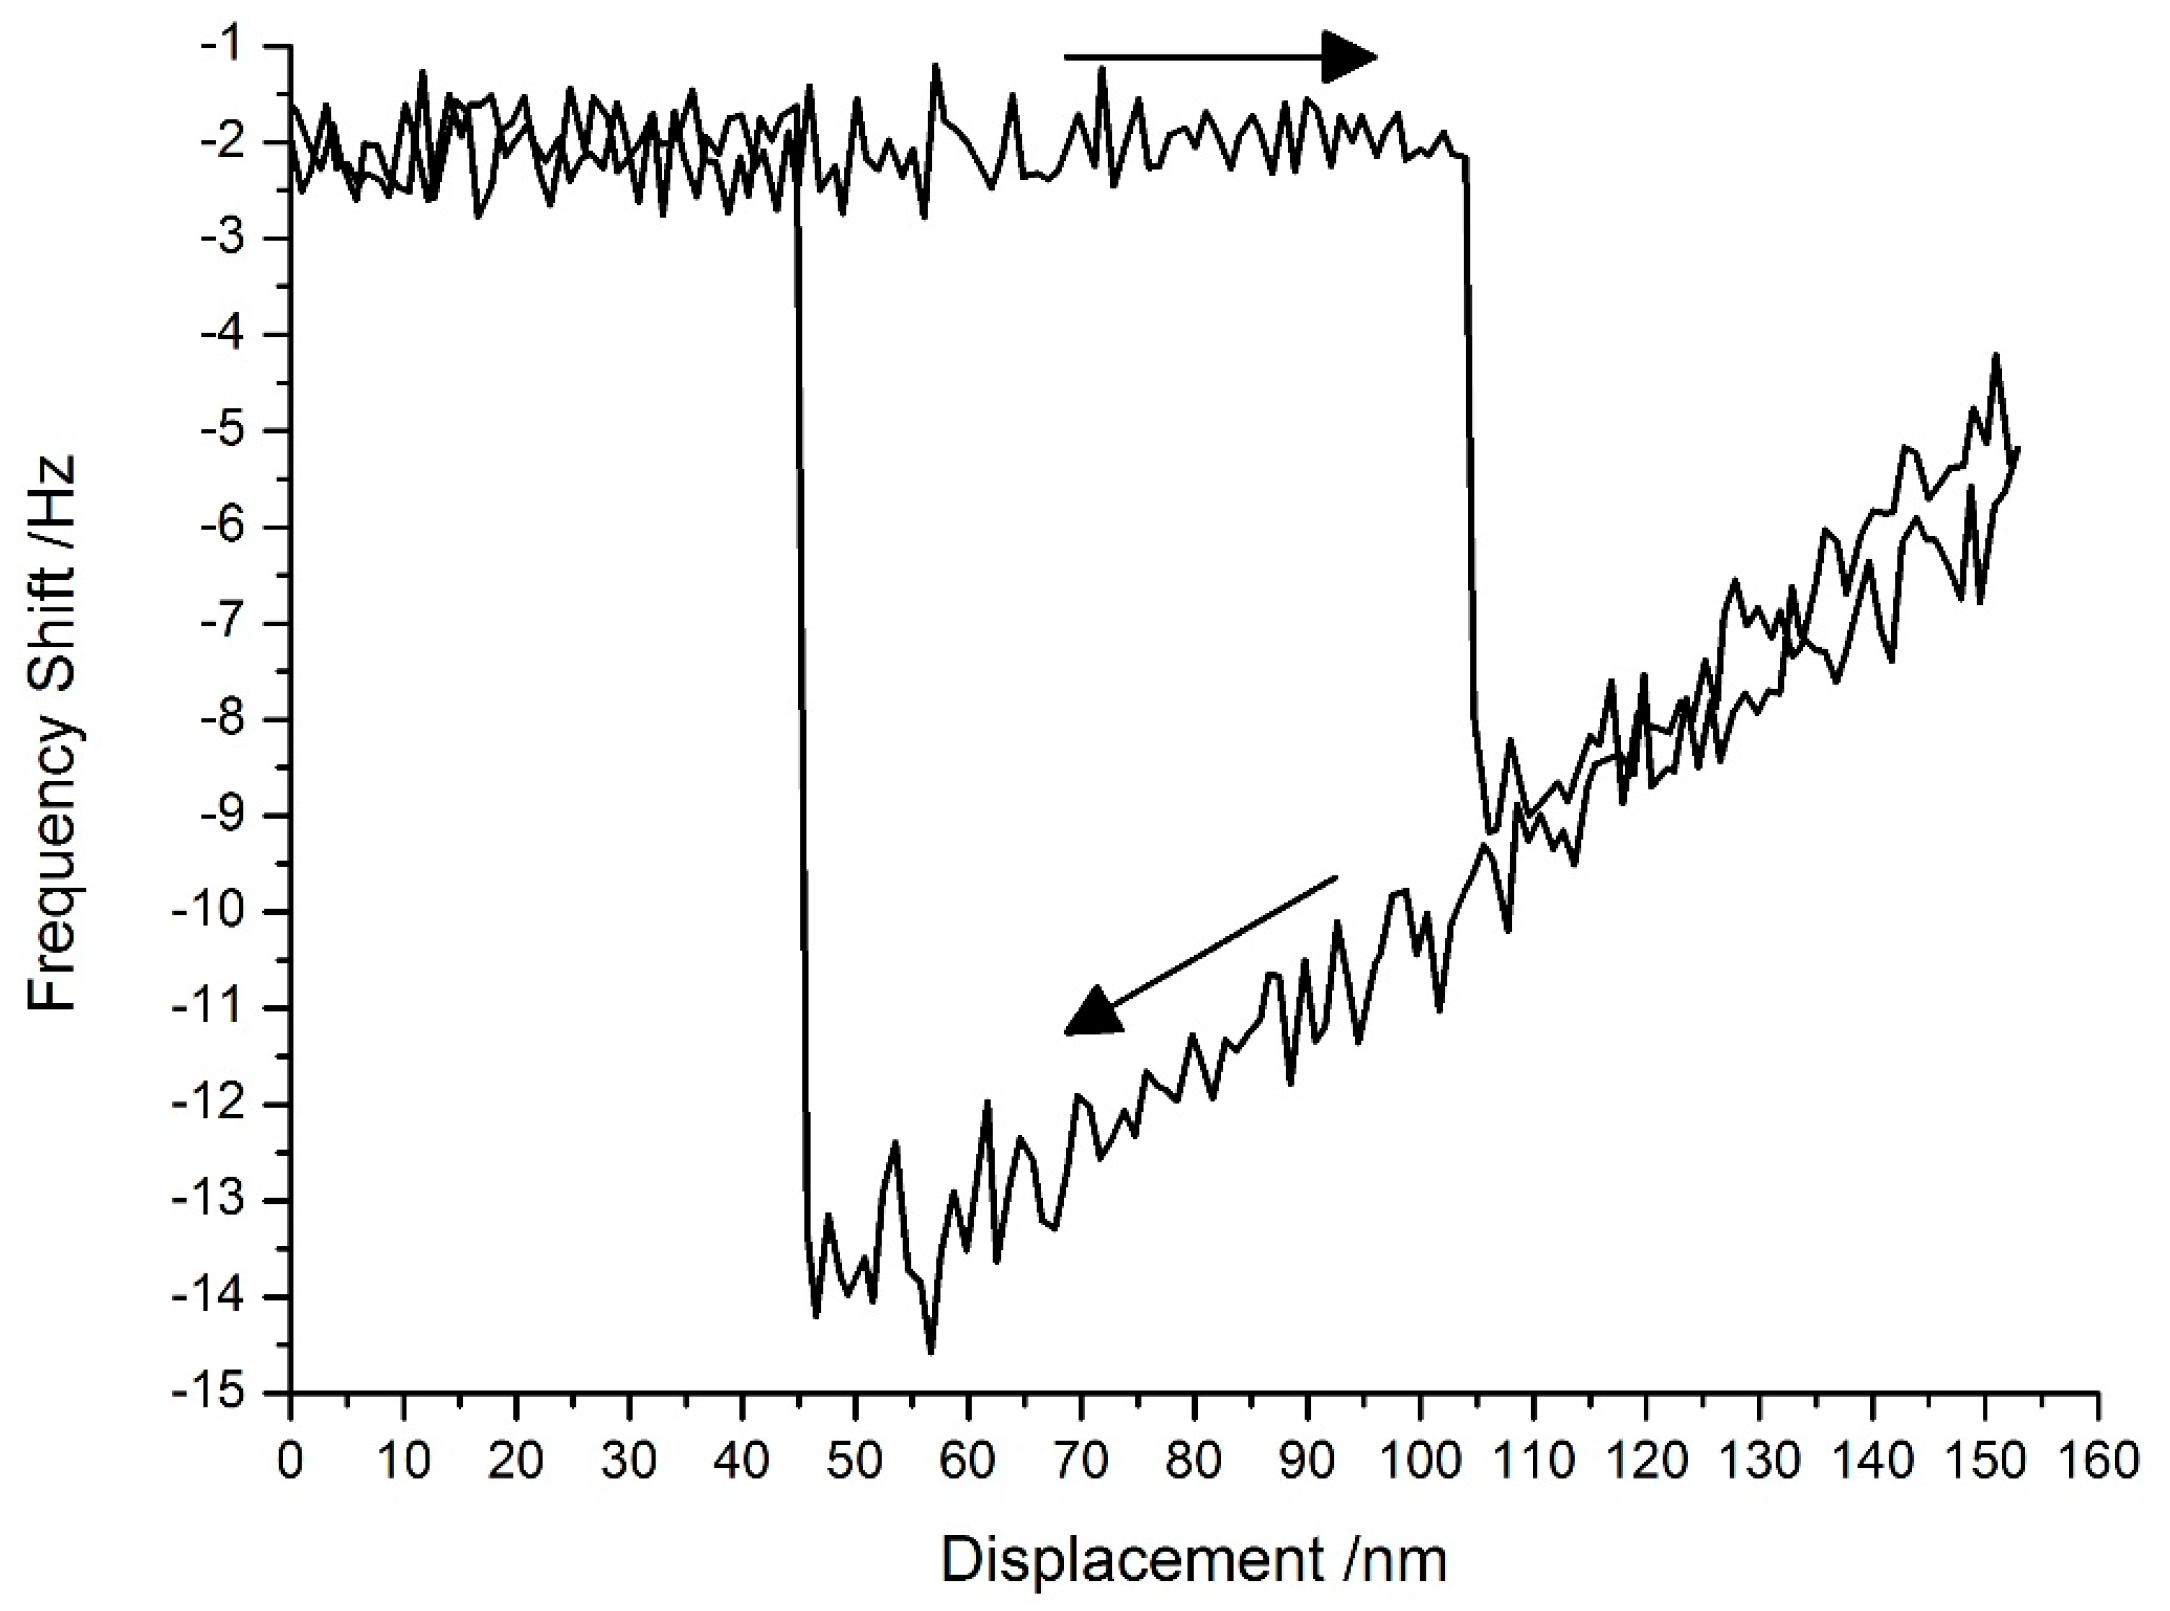
The tuning fork probes can work in FM non-contact mode [
1]. In the test system, a phase-locked loop (PLL) was used to trace the resonant frequency of the Akiyama probe during its approach to the sample surface. The PLL (HF2PLL, Zurich Instruments, Zurich, Switzerland) had a frequency resolution of 0.8 μHz. The approach curve shown in
Figure 10 lay in the attraction region within which non-contact AFM worked.
Figure 10.
The approach curve for the second eigenmode in FM mode.
Figure 10.
The approach curve for the second eigenmode in FM mode.
Compared with the 0.8 Hz/nm sensitivity of the first eigenmode in the repulsion region, the sensitivity of the second eigenmode was about 0.09 Hz/nm; however, under standard atmospheric conditions, the signal-to-noise ratio was not good enough to obtain a higher resolution.
3.3. The Resolution of the Probe
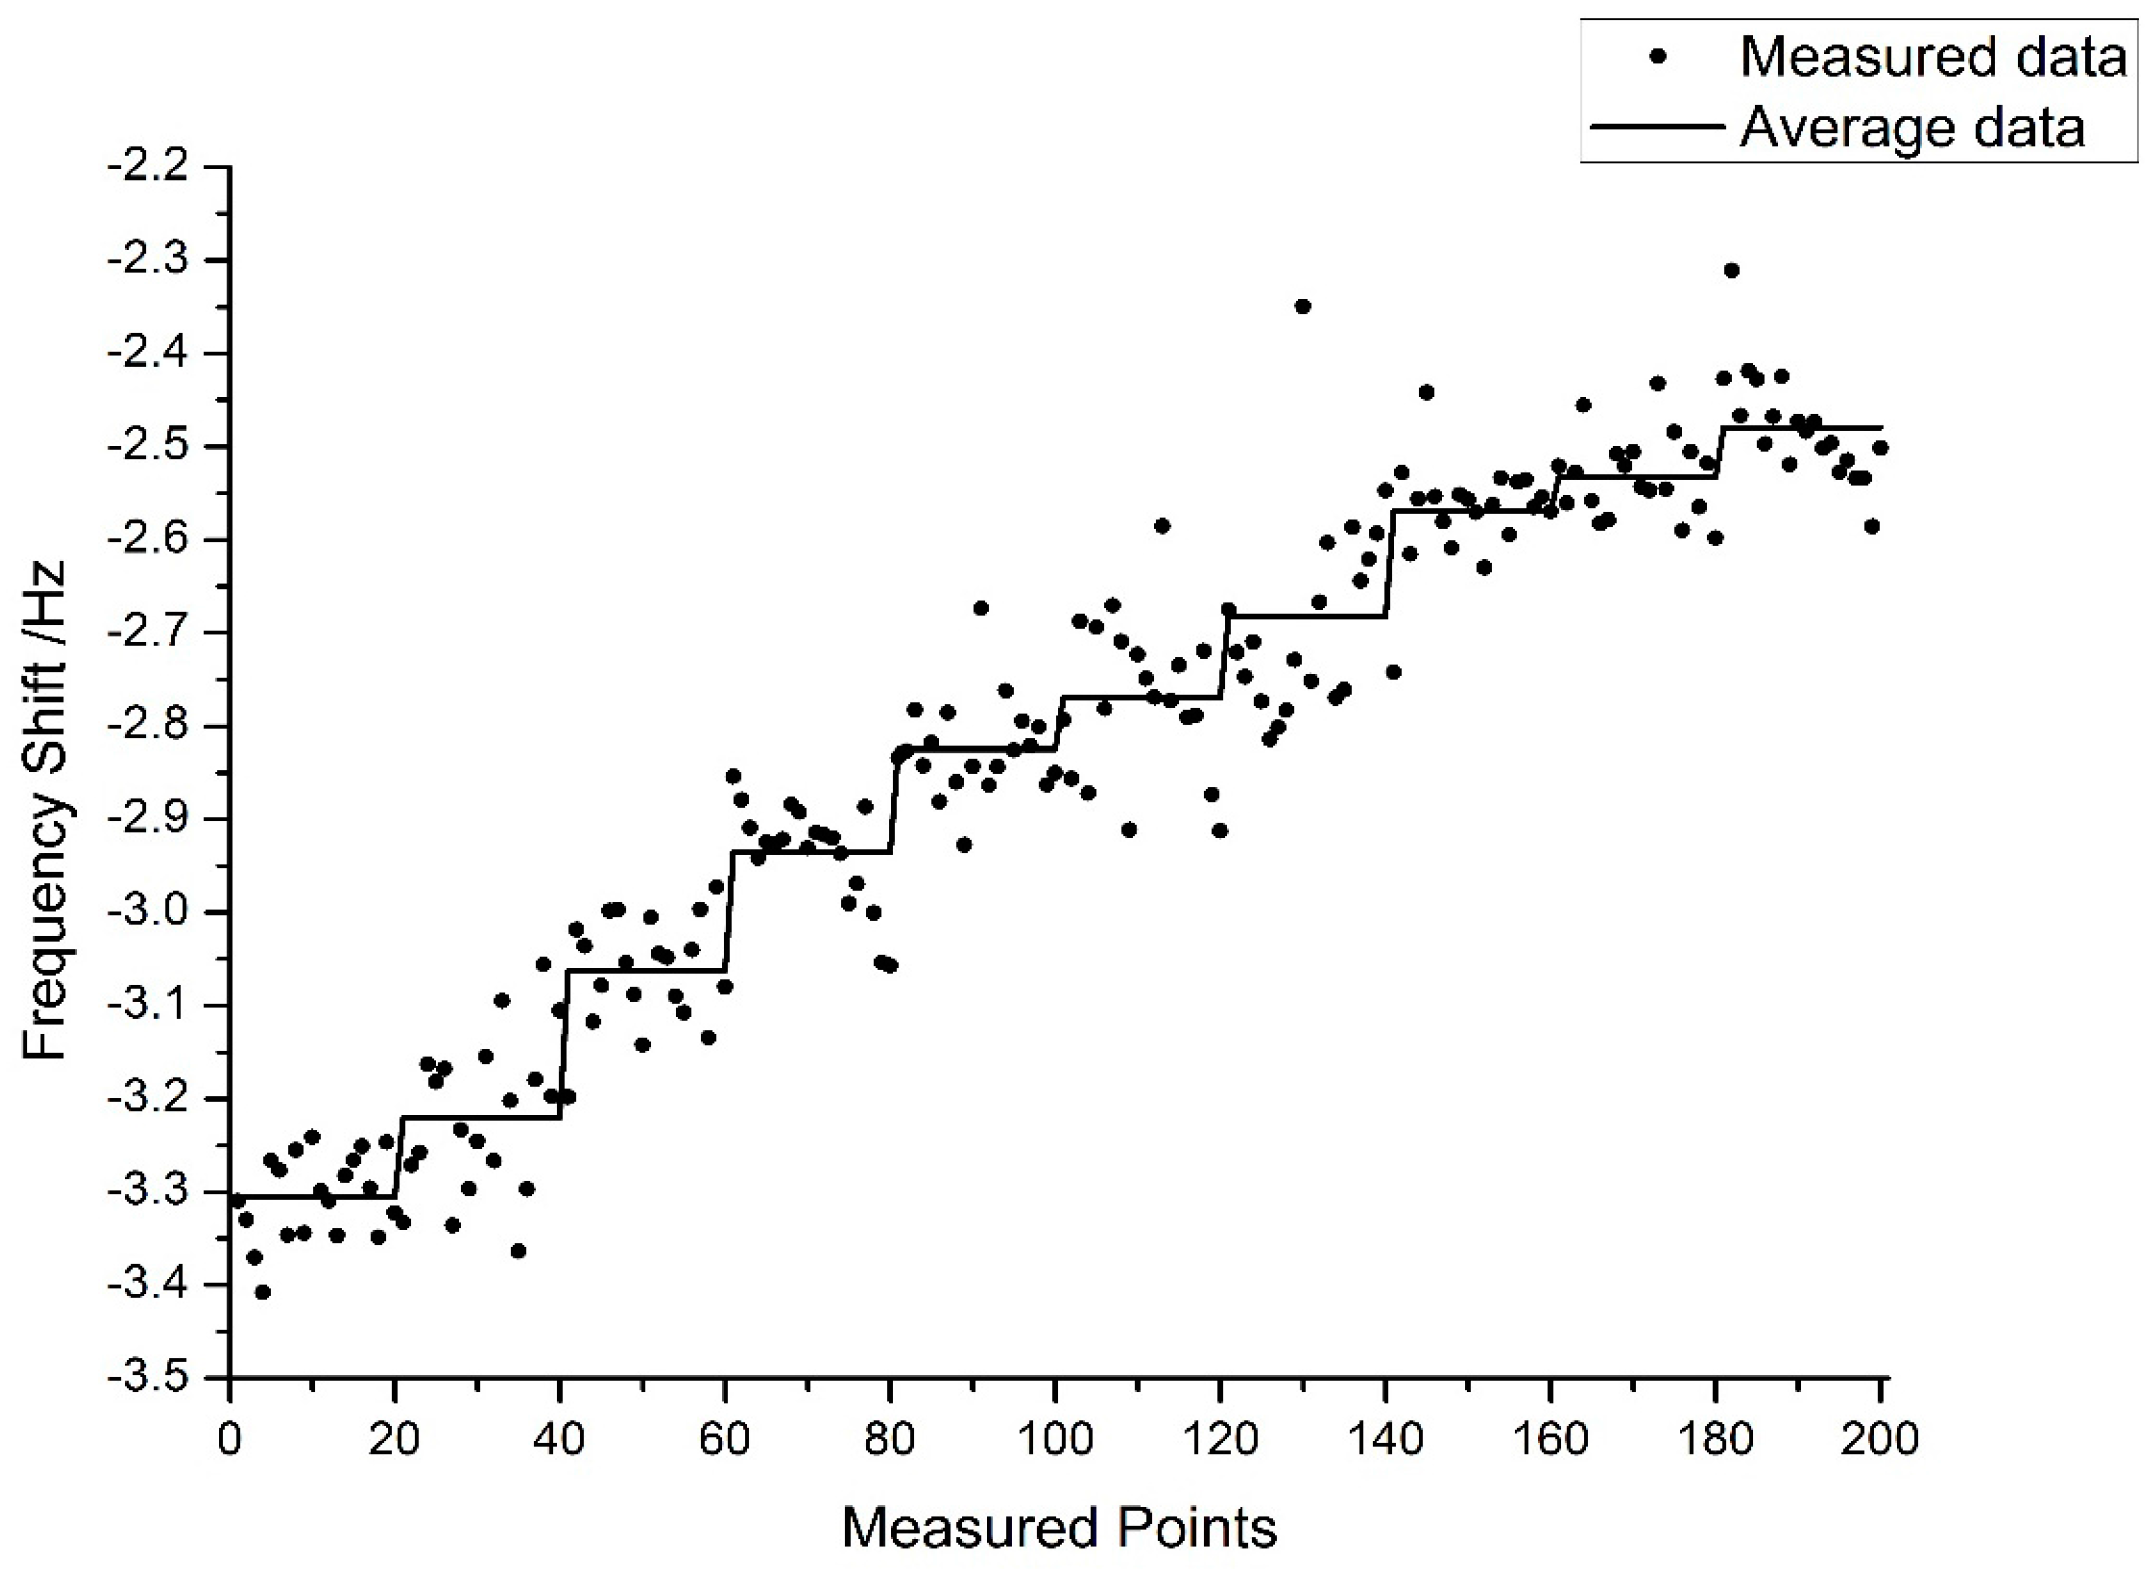
This test used a piezo-stage to raise the sample in steps of 2 nm after the probe touched the surface with measurements taken at 20 points per step, the measured data and average data of each step are shown in
Figure 11.
Figure 11.
The resolution of an Akiyama probe (2 nm increments).
Figure 11.
The resolution of an Akiyama probe (2 nm increments).
Although the noise was apparent, the 2 nm steps in the average data plot are visible in
Figure 11, which meant that this mode can realize a resolution of 2 nm.
4. Conclusions
For a special structure, an Akiyama probe can be used as an FM-mode, non-contact AFM sensor in its second eigenmode, although its cantilever is long and soft. According to the results, the second eigenmode Akiyama probe was similar to the conventional tuning fork AFM probe working under non-contact mode for which the signal-to-noise ratio is not good enough to obtain a better resolution under atmospheric conditions. One advantage of the self-sensing, self-actuating AFM probe based on a tuning fork was the simplicity with which it could be assembled for vacuum AFM to improve the signal-to-noise ratio. Thus, it was appropriate for the measurement of different samples, such as soft or movable samples, and for the use of the Akiyama probe in small-amplitude tapping mode or in non-contact mode, under vacuum, without changing either the probe or the equipment.
Acknowledgments
The authors acknowledge the support of the Tianjin Natural Science Fund (No. 14JCZDJC39400), the National Key Technology Research and Development MOST Programme (No. 2011BAK15B02), and the 111 Project fund (B07014).
Author Contributions
Zhichao Wu, study design and software design; Tong Guo, literature research and study design; Ran Tao, hardware design and data acquisition; Leihua Liu, test design and data acquisition; Jinping Chen, data analysis and manuscript editing; Xing Fu, data analysis and manuscript revision; Xiaotang Hu, manuscript revision and study concepts.
Conflicts of Interest
The authors declare no conflict of interest.
References
- De Oteyza, D.G.; Gorman, P.; Chen, Y.-C.; Wickenburg, S.; Riss, A.; Mowbray, D.J.; Etkin, G.; Pedramrazi, Z.; Tsai, H.-Z.; Rubio, A.; et al. Direct Imaging of Covalent Bond Structure in Single-Molecule Chemical Reactions. Science 2013, 340, 1434–1437. [Google Scholar] [CrossRef] [PubMed]
- Zhao, J. Study on Development of Self-Sensing AFM Head and Hybrid Measurement System. Ph.D. Thesis, Tianjin University, Tianjin, China, 2011. [Google Scholar]
- Zhao, J.; Guo, T.; Ma, L.; Fu, X.; Hu, X. Metrological atomic force microscope with self-sensing measuring head. Sens. Actuators A 2011, 167, 267–272. [Google Scholar] [CrossRef]
- Guo, T.; Wang, S.; Dorantes-Gonzalez, D.J.; Chen, J.; Fu, X.; Hu, X. Development of a Hybrid Atomic Force Microscopic Measurement System Combined with White Light Scanning Interferometry. Sensors 2012, 12, 175–188. [Google Scholar] [CrossRef] [PubMed]
- Bayat, D.; Akiyama, T.; de Rooij, N.F.; Staufer, U. Dynamic behavior of the tuning fork AFM probe. Microelectron. Eng. 2008, 85, 1018–1021. [Google Scholar] [CrossRef]
- Akiyama, T.; de Rooij, N.F.; Staufer, U.; Detterbeck, M.; Braendlin, D.; Waldmeier, S.; Scheidiger, M. Implementation and characterization of a quartz tuning fork based probe consisted of discrete resonators for dynamic mode atomic force microscopy. Rev. Sci. Instrum. 2010, 81. [Google Scholar] [CrossRef] [PubMed]
- Lozano, J.R.; Kiracofe, D.; Melcher, J.; Garcia, R.; Raman, A. Calibration of higher eigenmode spring constants of atomic force microscope cantilevers. Nanotechnology 2010, 21. [Google Scholar] [CrossRef] [PubMed]
- Frentrup, H.; Allen, M.S. Error in dynamic spring constant calibration of atomic force microscope probes due to nonuniform cantilevers. Nanotechnology 2011, 22. [Google Scholar] [CrossRef] [PubMed]
© 2015 by the authors; licensee MDPI, Basel, Switzerland. This article is an open access article distributed under the terms and conditions of the Creative Commons Attribution license (http://creativecommons.org/licenses/by/4.0/).


