Article

Integration of a Miniature Quartz Crystal Microbalance with a Microfluidic Chip for Amyloid Beta-Aβ42 Quantitation

1
Shenzhen Key Laboratory of Special Functional Materials & Shenzhen Engineering Laboratory for Advance Technology of Ceramics, College of Materials Science and Engineering, Shenzhen University, Shenzhen 518060, China
2
College of Electronic Science and Technology, Shenzhen University, Shenzhen 518060, China
3
College of Chemistry and Chemical Engineering, Hunan Normal University, Changsha 410081, China
*
Authors to whom correspondence should be addressed.
Sensors 2015, 15(10), 25746-25760; https://doi.org/10.3390/s151025746
Submission received: 24 June 2015 / Revised: 18 September 2015 / Accepted: 22 September 2015 / Published: 12 October 2015

Abstract

:
A miniature quartz crystal microbalance (mQCM) was integrated with a polydimethylsiloxane (PDMS) microfluidic device for on-chip determination of amyloid polypeptide–Aβ42. The integration techniques included photolithography and plasma coupling. Aβ42 antibody was immobilized on the mQCM surface using a cross-linker method, and the resonance frequency of mQCM shifted negatively due to antibody-antigen binding. A linear range from 0.1 µM to 3.2 µM was achieved. By using matrix elimination buffer, i.e., matrix phosphate buffer containing 500 µg/mL dextran and 0.5% Tween 20, Aβ42 could be successfully detected in the presence of 75% human serum. Additionally, high temperature treatments at 150 °C provided a valid method to recover mQCM, and PDMS-mQCM microfluidic device could be reused to some extent. Since the detectable Aβ42 concentration could be as low as 0.1 µM, which is close to cut-off value for Alzheimer patients, the PDMS-mQCM device could be applied in early Alzheimer’s disease diagnosis.

1. Introduction

Alzheimer’s disease (AD), a kind of irreversible progressive neurodegenerative disease, has been ranked as the 3rd killer of the elderly, only next to angiocardiopathy and cancer. Nowadays there are over 25 million cases of AD around the whole world, with about 5 million of these being found in China. Early prediction of AD is very important, since it is helpful to slow down the progression of the disease. Two amyloid polypeptides–Aβ40 and Aβ42, found in serum and cerebrospinal fluid, are proved to be the biomarkers of Alzheimer disease. The dominant mutation of amyloid polypeptide–Aβ4 protein precursor gene on normal chromosomes 21 and pressenilin-1 or 2 gene on chromosomes 14 is seen in AD patients before the age of 65. Amyloid precursor protein (APP), which belongs to the type I membrane glycoproteins, has at least 10 isomers arising from different splicing of 19 exons. The main transcripts are APP695, APP751 and APP770 [1,2,3]. The mechanism causing AD is still not clear. Research is concentrated on the structure of the neuron plaque and never fibers. The major component of neuron plaques is β-amyloid polypeptides (Aβ) generated from amyloid precursor protein (APP) by enzymatic cleavage involving β- and γ-secretase activities. Two kinds of Aβ configuration in neuron plaque are Aβ40 and Aβ42, which can be found in the serum and cerebrospinal fluid of healthy persons. The Aβ40 concentration in AD patients is equal to that observed in healthy persons. However, the Aβ42 concentration decreases significantly in AD patients, which reflects an increase of insoluble neuron plaque in the brain, therefore serum Aβ42 detection provides a valid method for early AD diagnosis.
Existing detection technologies are divided into two categories: one is traditional molecular biology techniques such as enzyme-linked immunosorbent assay [4,5], electrochemical analysis [6,7,8,9], and liquid chromatography-mass spectroscopy technology [10]; another is frontier techniques such as surface plasma resonance, dot imprinting immunology and resonance light-scattering analysis [11,12]. Yu [9] proposed a method for highly sensitive determination of soluble β-amyloid peptides (Aβ42) that employed a detection bioconjugate of HRP-Au-gelsolin as an electrochemical nanoprobe. Aβ42 was captured onto the electrode surface due to its specific binding to surface-confined gelsolin. Because 3,3,5,5-tetramethylbenzidine could be specifically catalyzed at 0.35V in the presence of H2O2 by HRP labeled on Au nanoparticles, this would produce a signal related to the amount of surface-confined HRP, thus realizing the detection of Aβ42 specifically. The proposed methodology displayed satisfactory sensitivity, with a detection limit down to 28 pM. Clarke [10] successfully separated serum β-amyloid peptides in several minutes through an Atlantics C8 chromatographic column, and detected the amount of endogenous Aβ42 through combination with mass spectroscopy. The limit of detection was 0.2 pM. Yu [12] detected β-amyloid peptides by the fluorescence signal increase at 463 nm of a new hybrid fluorescent probe–Fe3O4@Au upon reaction with β-amyloid peptides. The linear range is from 5.0 fM to 5.56 pM, with a detection limit down to 1.2 fM. Although they offer advantages of high-throughput, high-sensitivity and low detection limits, these methodologies usually involve arduous manual procedures, long incubation times, large sample consumption and photo-bleaching during fluorescence detection, which are not conducive to portable applications. Meanwhile, electrochemical technology and immunoassay have other shortcomings such as expensive bioprobes, tedious labeling steps, side reactions, and non-specific binding. Therefore, it is urgent to develop a low-cost and portable form technique for the determination of β-amyloid peptide.
Microfluidic-based approaches allow rapid and high-throughput analyses with less sample consumption, which make them very attractive for point-of-care diagnosis [13,14]. Existing detection techniques combined with microfluidic devices include electrochemical immunoassay [15], fluorescence methods [16] and surface-enhanced Raman scattering-based immunoassay [17]. These methods are not suitable for point-of-care diagnostics of peptides and proteins in human serum because they entail long response times, expensive instruments, and tedious labeling processes. The quartz crystal microbalance (QCM) is a type of mass sensitive transducer that has been extensively applied in the detection of proteins [18], antibodies [19], cancer biomarkers [20] and organic substances [21]. It works in a label-free fashion since the resonance frequency shift caused by mass loading on the surface condition can be measured directly. Few papers have reported the integration of miniature QCMs with microfluidic systems. A miniature QCM with a quartz diameter of 3 mm fixed on a PDMS flow cell for detecting protein A from Staphylococcus aureus in liquid phase was reported [22]. To reduce the boundary diffusion layer and total sample consumption, a miniaturized flow reaction chamber with a volume of 3.5 µL was developed for a quartz crystal microbalance with dissipation monitoring [23]. Meanwhile, microfluidic devices based on polydimethylsiloxane (PDMS) possess the advantages of low cost, rapid fabrication and excellent biocompatibility compared to those on quartz, silicon or glass. Hence, in this work, a 13 × 106 Hz miniature QCM resonator (mQCM) with a diameter of 6 mm was integrated with a PDMS microfluidic device for on-chip determination of amyloid polypeptide–Aβ42. The integration process, serum sample analysis and device reusability were investigated in detail.

2. Experimental

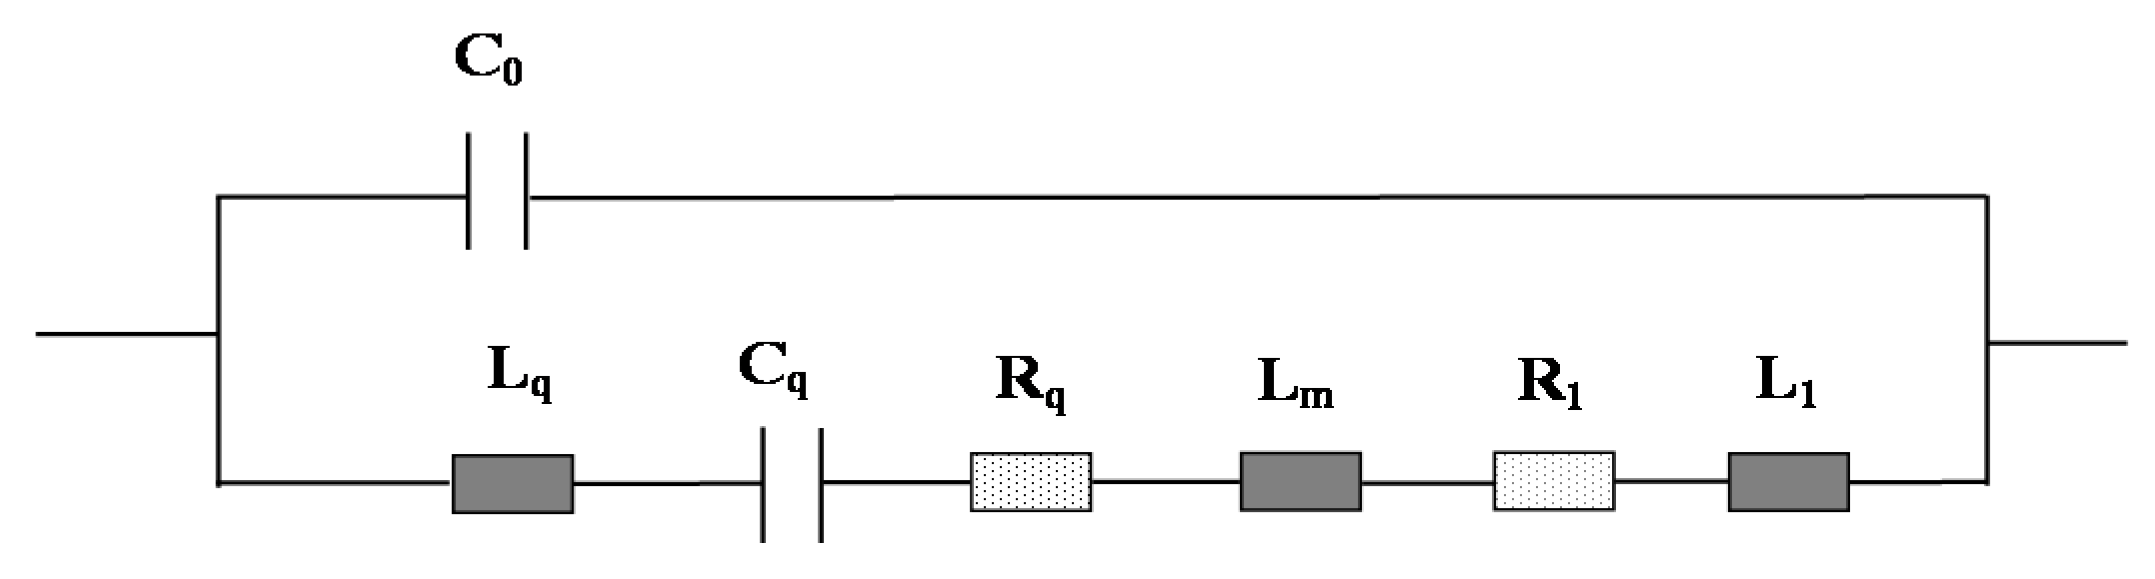
2.1. Principle of MQCM in a Liquid Microfluidic System

According to the Sauerbrey equation, the shift in resonance frequency (Δf0) resulting from a mass change (Δm) on the mQCM surface can be expressed as follows:
Δ f 0 = 2 f 0 2 A ρ q µ q Δ m
where f0 is the resonance frequency of bare mQCM, A is the piezoelectric active crystal area; µq and ρq are the elastic modulus and density of quartz, respectively. Figure 1 shows the equivalent circuit of a coated mQCM in liquid phase. The motional inductance (Lq) relates to the mechanical vibration inertia of quartz vibration process. The motional capacitance (Cq) corresponds to the mechanical elasticity and motional resistance Rq equivalent to the energy losses in the vibration process. The static capacity (C0) is formed from dielectric quartz substrate between the two electrodes when there is no vibration. Its value is related to the geometric size of the quartz and electrode area.
Figure 1. Equivalent circuit of a rigid layer-modified mQCM in liquid phase.
Sensors 15 25746 g001
When only one side of the quartz is in contact with liquid, an additional inductance (L1) and resistance (R1) will be formed by liquid loading. Their values are related to the mass, viscosity and density properties of the vibrating liquid. A thin rigid layer is commonly coated on mQCM sensor for specific applications, which brings an additional inductance by mass loading, named as Lm, as shown in Figure 1.
An equation reflecting liquid loading effects for our case can be derived from Martin’s equations [24] and the equation in reference [25,26]:
Δ R t = 2 π f Δ L t 4 π L qa Δ f   0  
where ΔRt and ΔLt are the changes in total resistance and total inductance, respectively. Lqa is the motional inductance for mQCM sensor in air. f0 can be used approximately in the calculation instead of f with an error below ca. 0.3%, because the f value is hard to obtain. Accordingly, if the experimental responses of ΔRt, Δf0 and ΔLt satisfy Equation (2), then the frequency shift (Δf0) should be governed by variation in the density and viscosity of local solution near mQCM sensor surface. Otherwise, mass change is the effective factor [27].
In real data analysis, ΔRt and ΔLt values can be calculated from following equations, which could be derived from the equations in reference [26]:
G = G m a x 2 = 1 2 R t  
Δ f G 1 / 2 = R t 2 π L t
where Gmax is maximum of conductance value; Rt and Lt are total resistance and total inductance, respectively. Δ f G 1 / 2 is the full width at half maximum of the conductance spectrum. Therefore, we will investigate in detail if there is any difference in the half bandwidth of the conductance spectrum between the bare and the modified mQCM sensor.

2.2. Chemicals and Reagents

3-Mercaptopropionic acid (3-MPA, ≥99.0%), N-hydroxysuccinimide (NHS, 98.0%), N-(3-dimethylaminopropyl)-N'-ethylcarbodiimide hydrochloride (EDC, ≥99.0%), bovine serum albumin (BSA, ≥97.0%) and human serum (from human male AB plasma) were purchased from Sigma-Aldrich (St. Louis, MO, USA). Monoclonal amyloid polypeptide Aβ42 antibody and Aβ42 were ordered from Zi-Yu Biotech Co. Ltd. (Shanghai, China). The Sylgard 184 silicon elastomer kit was purchased from Dow Corning (Midland, MI, USA). All chemicals were of analytical grade and used without further purification.

2.3. Fabrication of PDMS-mQCM Microfluidic Device
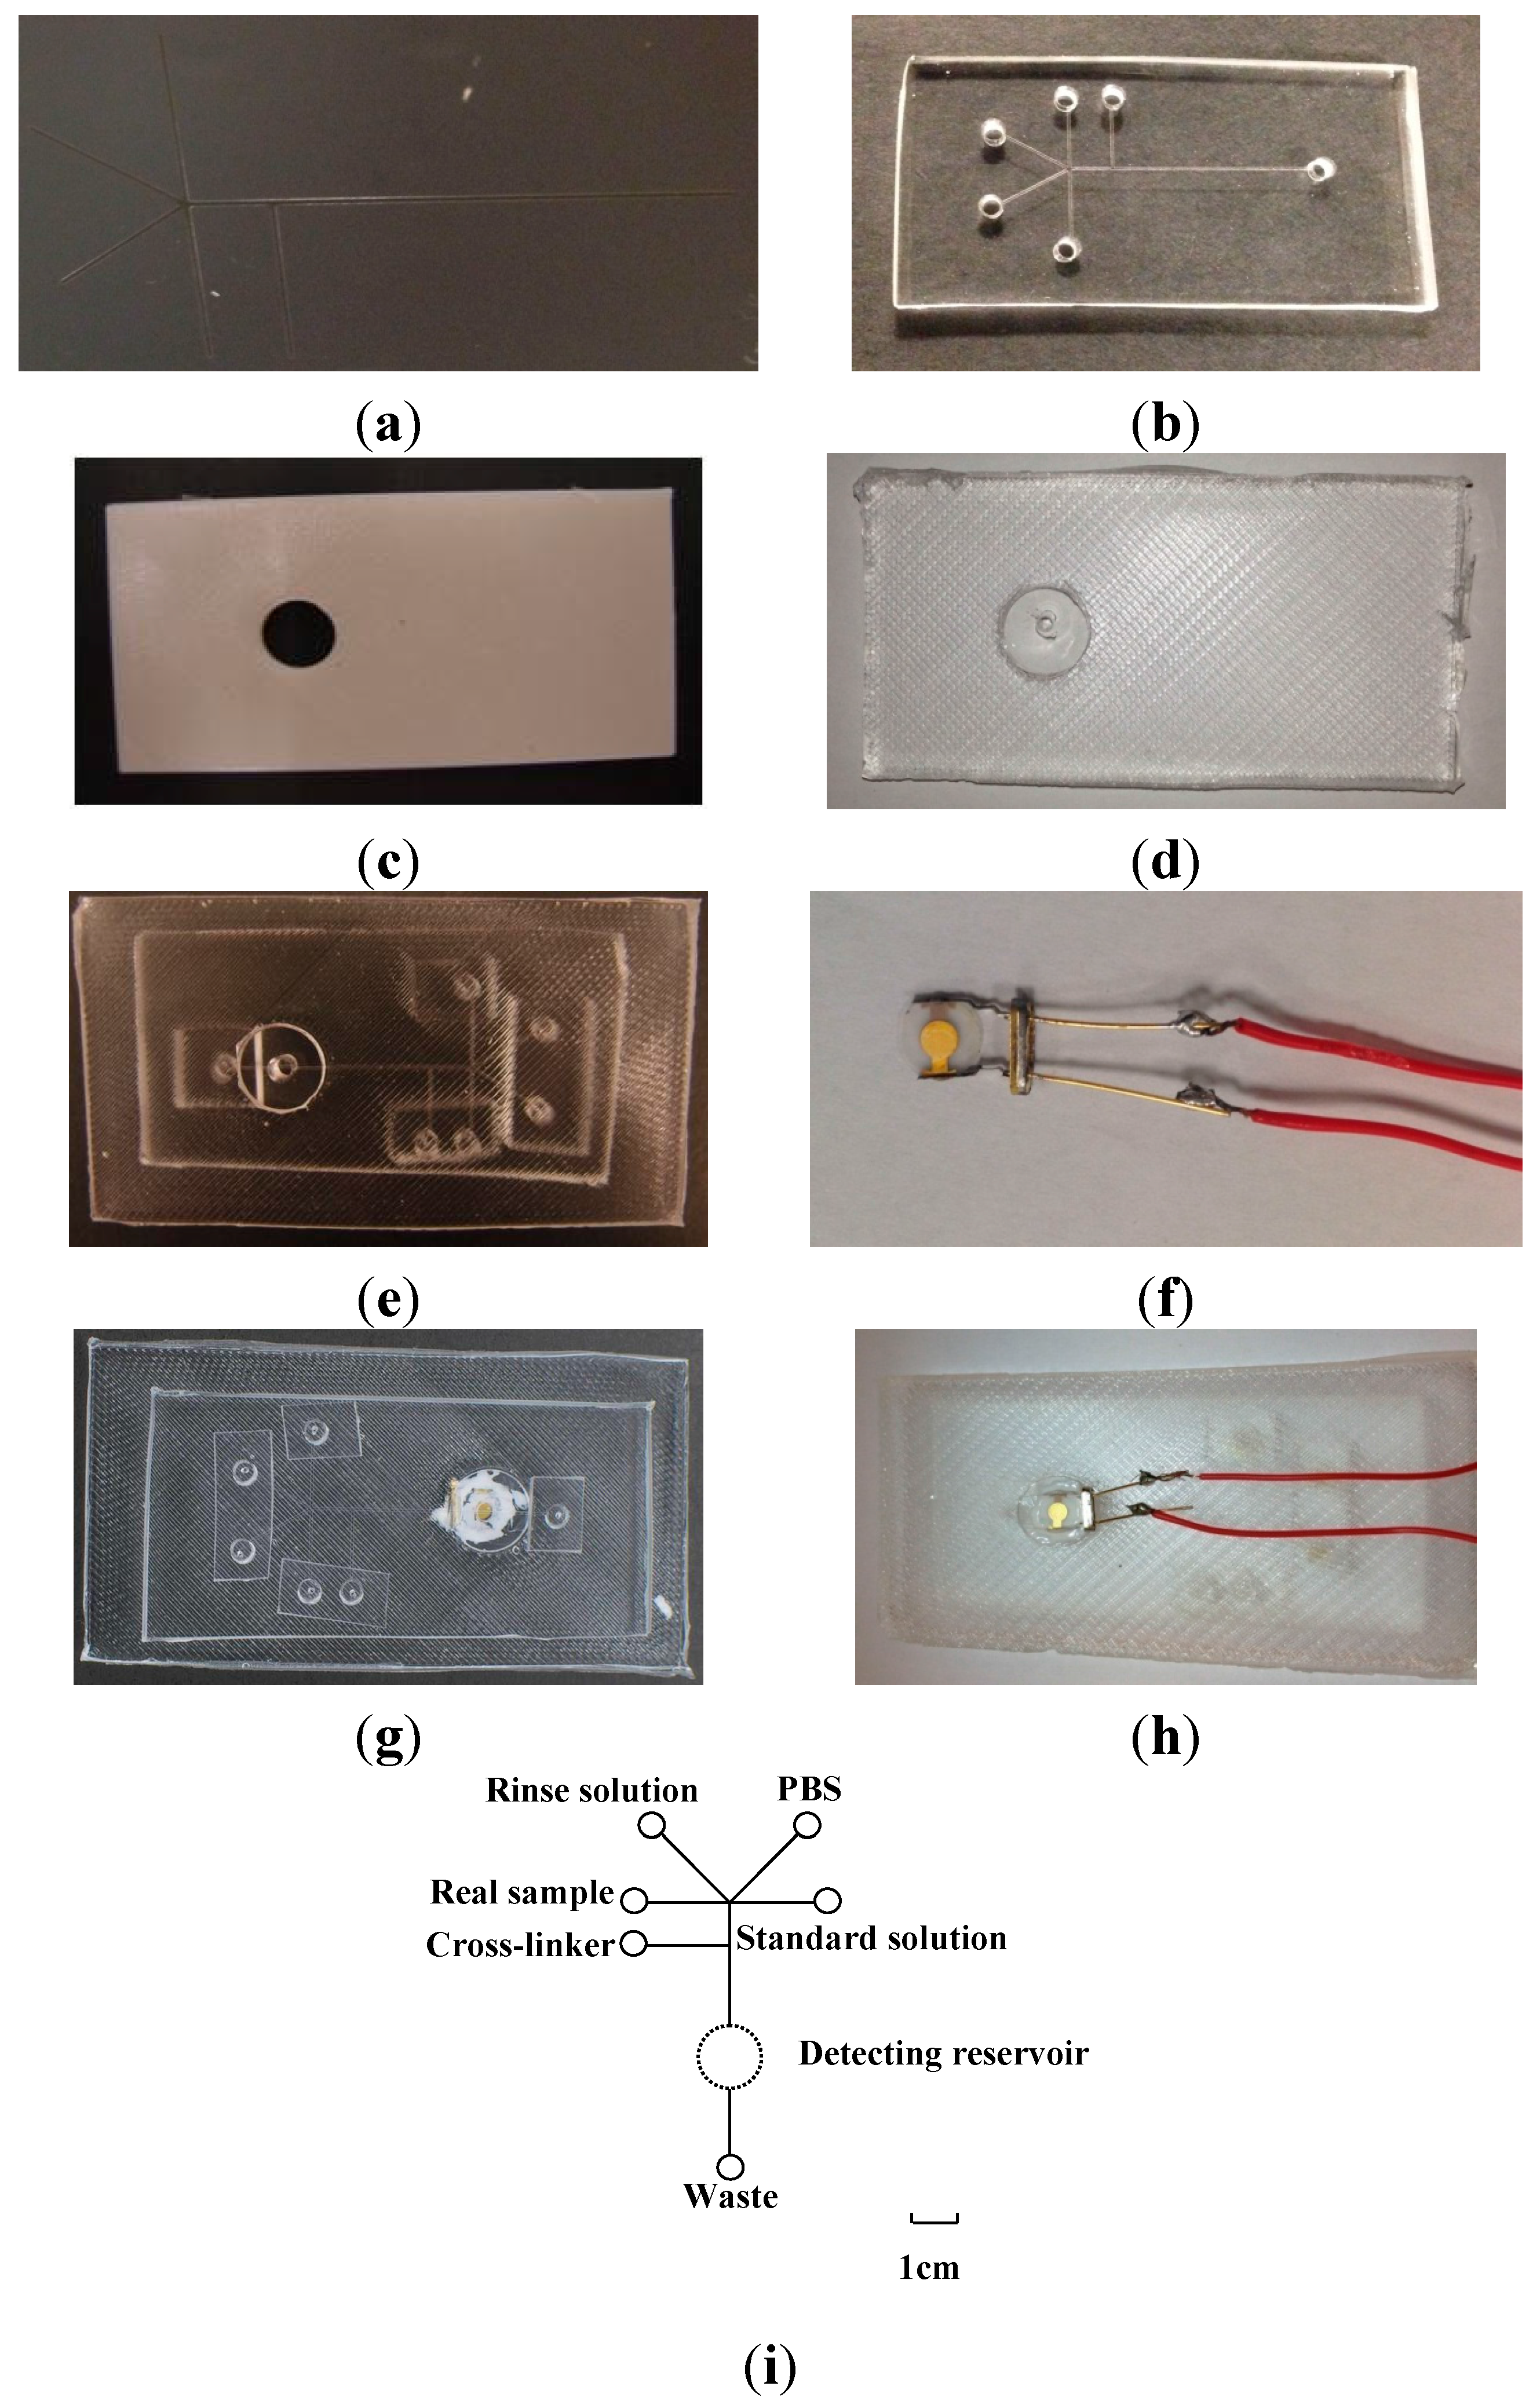
The detailed fabrication process is illustrated in Figure 2.
Figure 2. Photographs of (a) Si mold; (b) ABS mold; (c) PDMS microfluidic chip; (d) mounting PDMS slab; (e) PDMS-PDMS microfluidic device; (f) mQCM; (g) front-side and (h) backside of PDMS-mQCM microfluidic system; (i) Layout of an integrated PDMS-mQCM microfluidic system; standard solution: from 0.025 µM to 5.2 µM Aβ42. Scale bar: 1 cm.
Sensors 15 25746 g002

2.3.1. Si Mold

The silicon-mold fabrication follows standard photolithography procedures. Negative photoresist SU-8 2035 was spin-coated on N-type silicon (Si <100>) wafer surface at a speed of 1000 rpm for 40 s. The wafer was soft-baked at 65 °C for 3 min and then 95 °C for 9 min; and followed by exposure to UV light for 3 min together with the mask. After exposure, it underwent post-baking at 65 °C for 2 min and then at 95 °C for 7 min. The development lasted for 10 min using SU-8 developer. SU-8 with 100 µm width and 40 µm height was patterned on Si wafer, named as Si mold, as shown in Figure 2a. Si mold was prepared for imprinting PDMS microfluidic chip.

2.3.2. ABS Mold

Acrylonitrile butadiene styrene (ABS) is a thermoplastic polymer material which consists of acrylonitrile, butadiene and styrene monomers. A 40 mm × 70 mm ABS mold plane with a 10 mm diameter through-hole was fabricated by a prototyping machine (uPrint SE Plus, Chicago, IL, USA), as shown in Figure 2b.

2.3.3. PDMS Microfluidic Chip and Mounting PDMS Slab Molding

Firstly, Si and ABS mold was cleaned with a mixture of detergent and 70% ethanol (v/v = 1:10), rinsed with water and dried with N2 gas. Secondly, a curing agent and silicon elastomer of PDMS prepolymer were mixed thoroughly at a weight ratio of 1:10. The prepolymer mixture was poured on Si mold and ABS mold, and then degassed in a vacuum chamber for 2 h. Finally, molds were put on a heater for polymerization at 70 °C overnight. After curing, PDMS replicas were peeled from the mold. Holes with diameters of 3 mm were punched in the PDMS microfluidic chip at the end of the micro-channels (shown in Figure 2c). Another 3 mm hole was punched on the PDMS slab (shown in Figure 2d) to match the diameter of the gold electrode on the mQCM and worked as a solution reservoir.

2.3.4. PDMS-mQCM Microfluidic Device

Freshly prepared PDMS microfluidic chip and mounting PDMS slab were first treated by oxygen plasma and immediately brought in contact with each other, and finally baked at 80 °C for 2 h to achieve permanent bonding. To connect with tubing for solution injection, small PDMS pieces punched with 0.75 mm holes were also stuck to PDMS microfluidic chip by the oxygen plasma method. This PDMS-PDMS device is shown in Figure 2e. AT-cut quartz crystals with resonance frequency of 13 × 106 Hz (Chen Jing Electronics, Beijing, China) were used as mQCM sensors in this work. The diameter of quartz crystal was 6 mm, and diameter of gold electrode was 3 mm. Copper wires were soldered to the two legs of gold electrodes on mQCM, as shown in Figure 2f. The mQCM was fixed to PDMS-PDMS microfluidic device using 704 silicone gels (Wuxi Adhesive Factory, Wuxi, China), which formed a PDMS-mQCM microfluidic device, as shown in Figure 2g (front side) and Figure 2h (backside).

2.3.5. Layout of PDMS-mQCM Microfluidic Device

Figure 2i shows the layout of the PDMS-mQCM microfluidic device. As shown in the layout, rinse solution, buffer, cross-linker, Aβ42 standard solution and real sample are injected into the device from different reservoirs to avoid contamination. The total size of the PDMS-mQCM microfluidic device is around 50 mm (W) × 80 mm (L) × 6 mm (H).

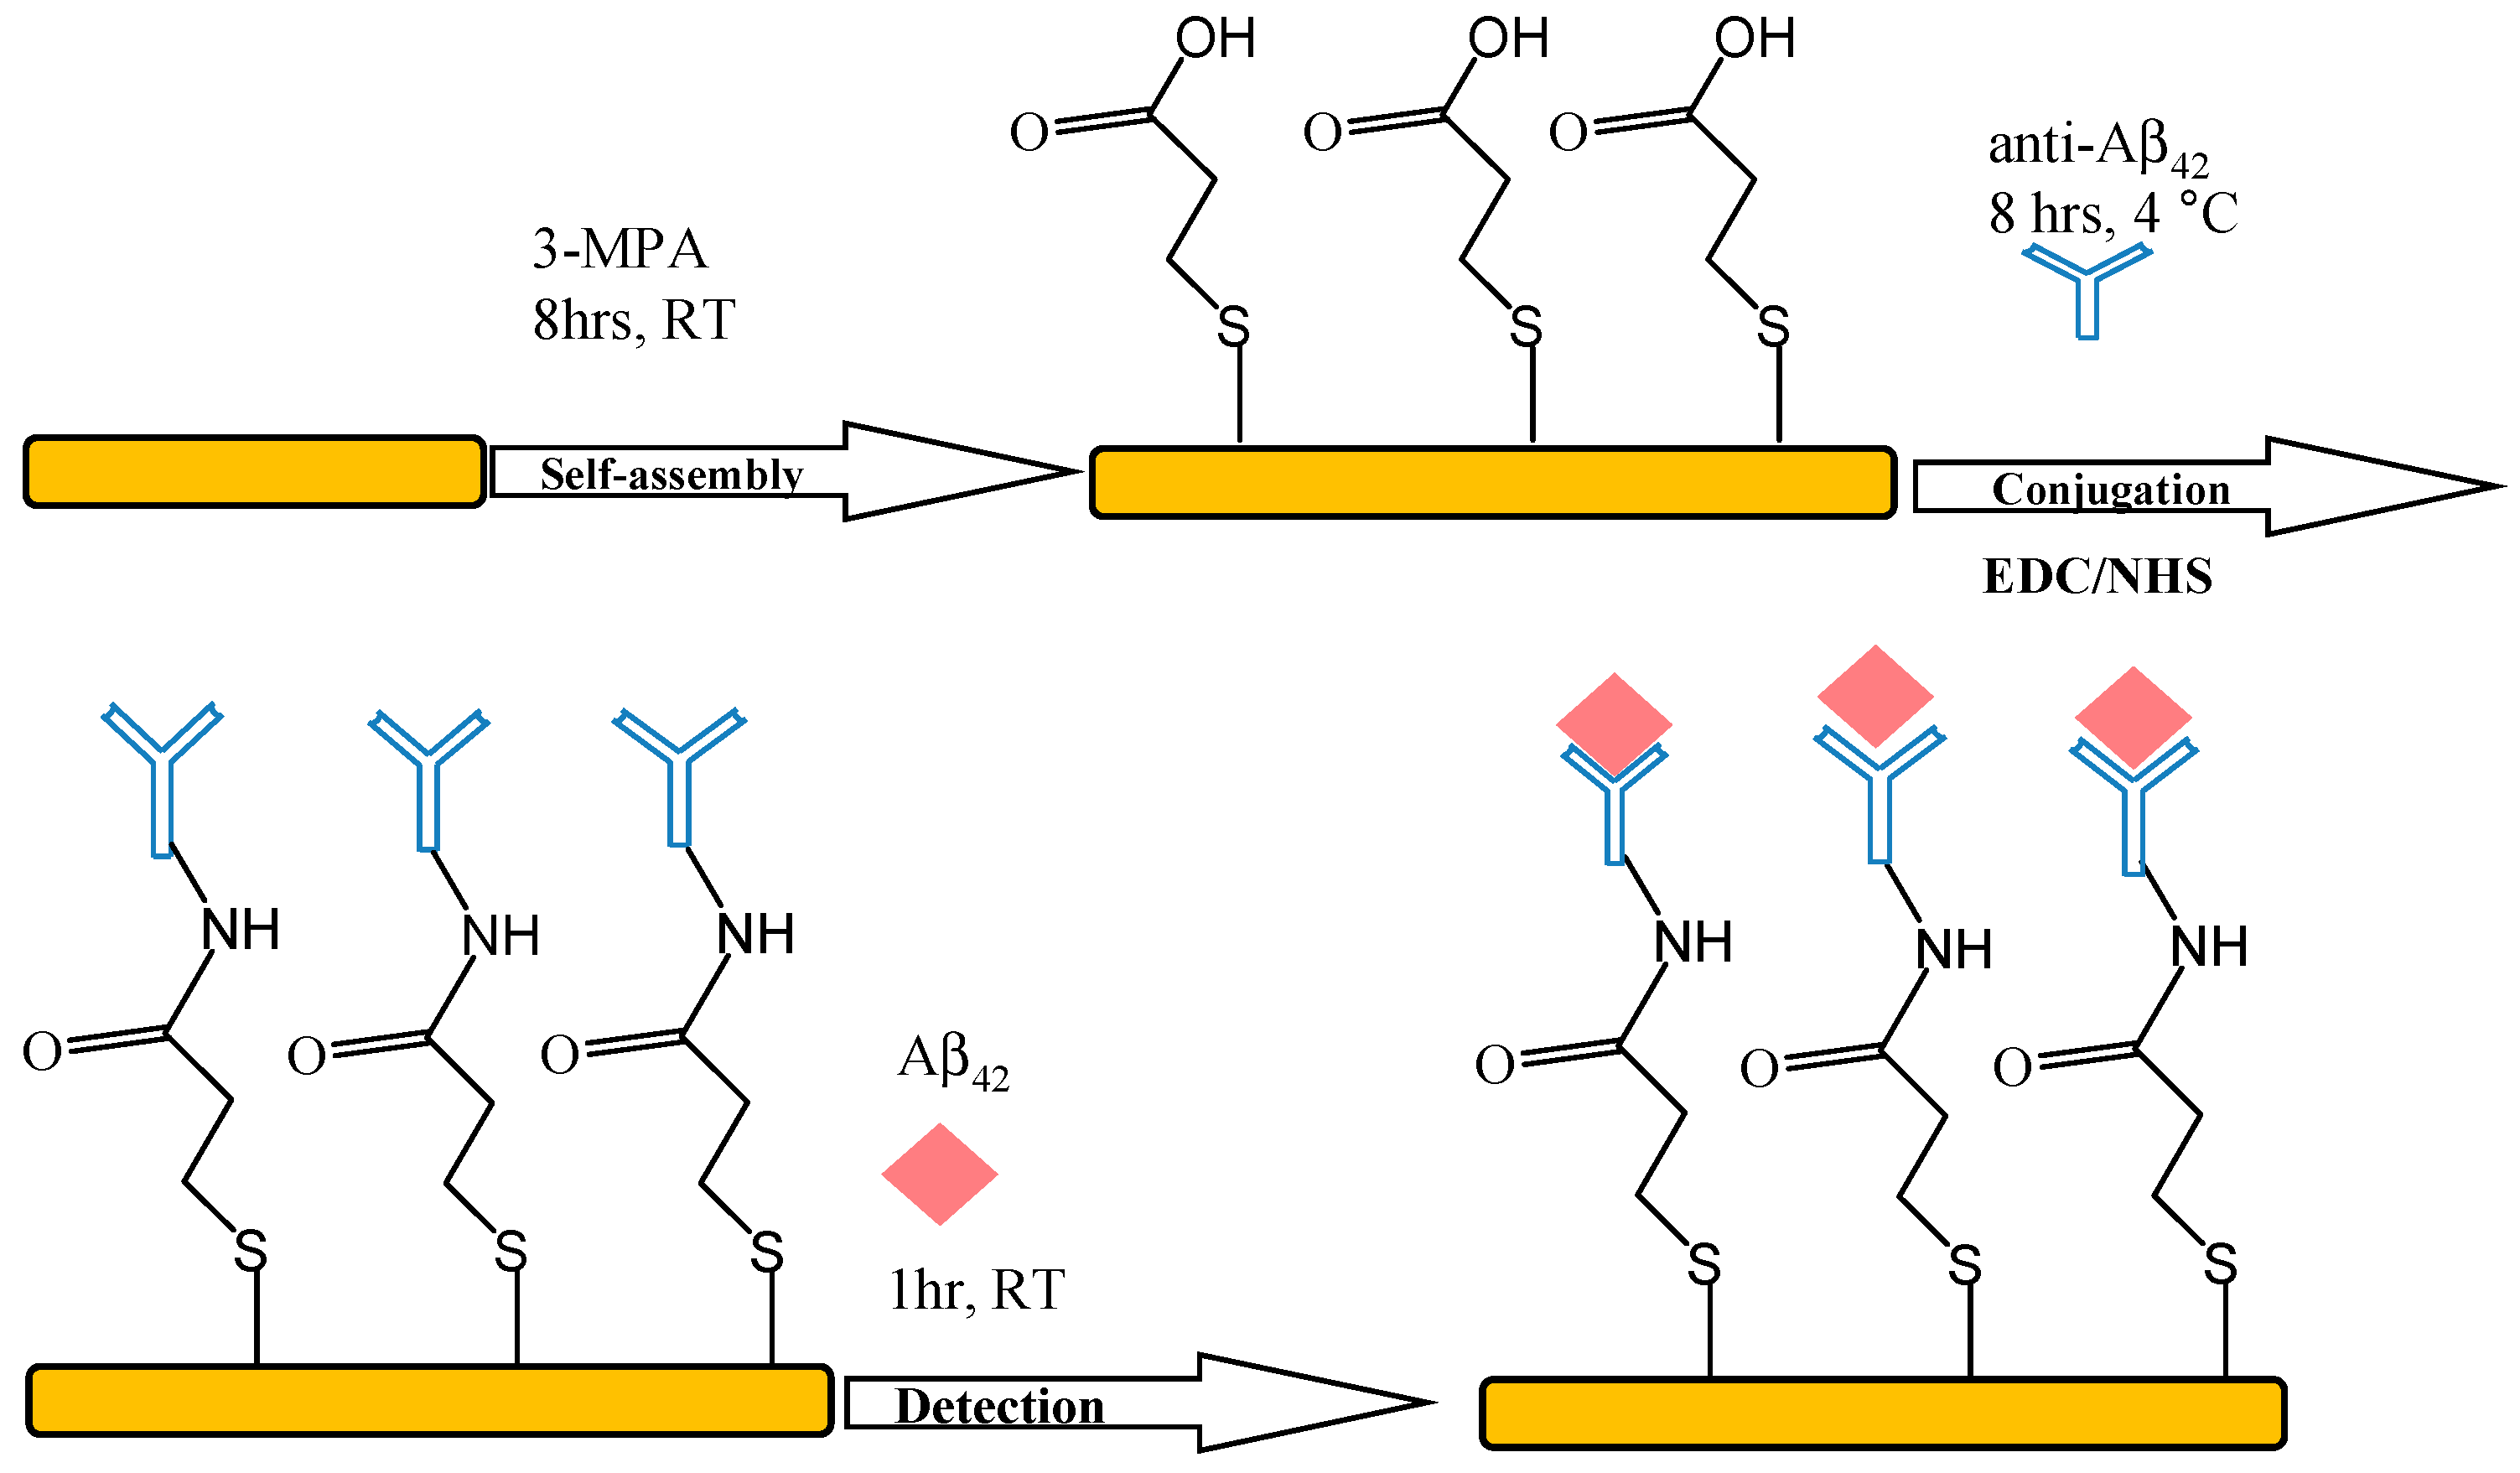
2.4. Immobilization of Aβ42 Antibody

A cross-linker method was adapted for Aβ42 antibody immobilization. Five mM 3-MPA solution was injected into the detection reservoir of the PDMS-mQCM microfluidic device for 8 h. Then the reservoir was rinsed with ethanol and water. Next 20 mM phosphate buffer solution (PBS, pH 7.0) containing 24 mg/mL EDC and 6 mg/mL NHS was injected into the reservoir and incubated for 1 h. The channels and reservoirs were rinsed with PBS afterwards. 2 µM Aβ42 antibody in PBS was then injected into the reservoir and incubated for 12 h at 4 °C, and rinsed with PBS thoroughly to remove the absorbed. Then the defective sites were blocked with 10 µM BSA in PBS. A schematic representation of these processes is shown in Figure 3.
Figure 3. Schematic representation of the immobilization process for Aβ42 antibody and detection of Aβ42.
Sensors 15 25746 g003

2.5. Measurements

42 can be extracted from blood serum and directly injected into the real sample reservoir of the PDMS-mQCM microfluidic device, and then rapidly determined by an Aβ42 antibody-modified mQCM sensor using the piezoelectric quartz crystal impedance technique (PQCI). Injection mode was adapted. All on-chip fluid flow was controlled via a network of syringes, valves and reservoirs. Syringes were connected to the inlet of PDMS-mQCM microfluidic device by using Teflon tubing for injecting specific volumes of solution. The resonance frequency response and other equivalent circuit parameters of the mQCM sensor during the antigen-antibody binding process were determined by the PQCI technique. Frequency response was measured by an impedance network analyzer (E5016B, Agilent Technology, Santa Clara, CA, USA). The conductance (G) and susceptance (B) of the sensor were also measured synchronously by an impedance test. Automatic data acquisition was achieved by a program written in Visual Basic 6.5 (VB 6.5). Impedance measurements were conducted under conditions of 1601 points, an IF bandwidth value of 5000 Hz, and a source power of 0 dBm. Acquired data was analyzed by a home-written Matlab program to extract the maximum G value and corresponding resonance frequency. All measurements were performed at a stable temperature of 25 ± 1 °C.

3. Results and Discussion

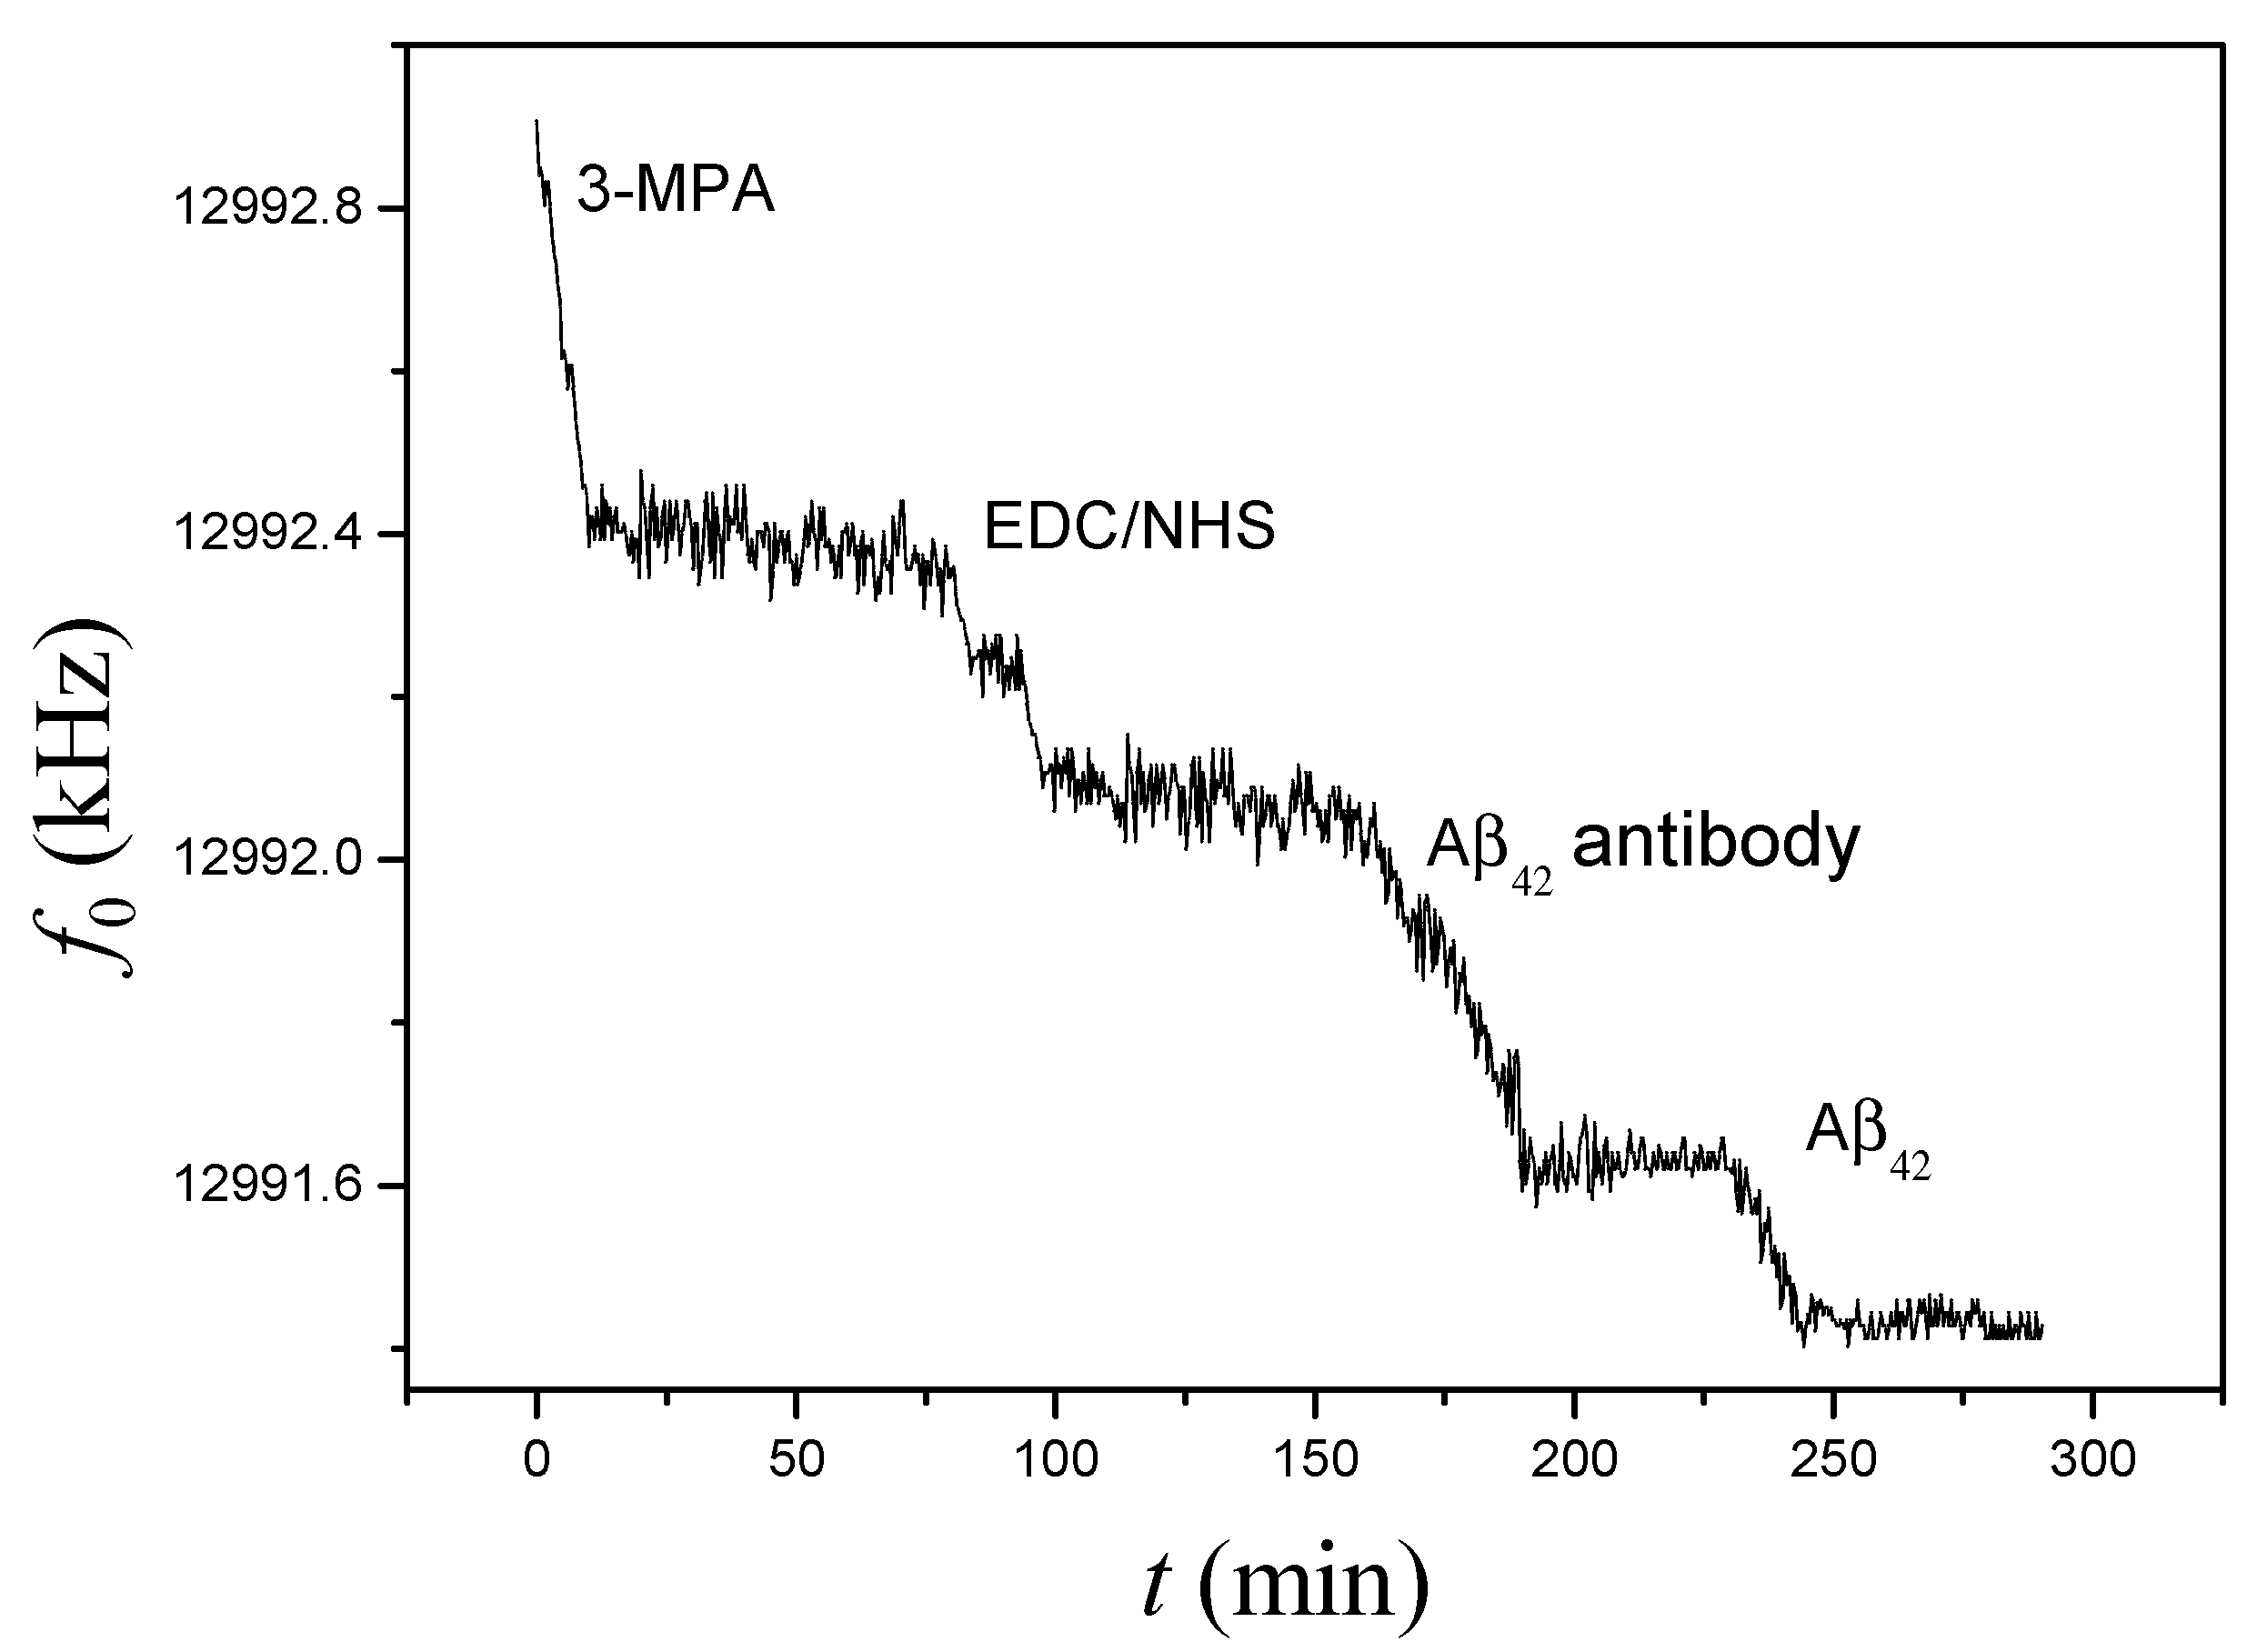
3.1. On-Chip Determination of Aβ42

Figure 4 shows the frequency response of the immobilization processes for Aβ42 antibody and Aβ42 on the PDMS-mQCM microfluidic device using a cross-linker method. Frequency shifts were observed for each step: −550.2 Hz for 3-MPA, −353.0 Hz for EDC and −443.0 Hz for Aβ42 antibody. The response frequency shift towards 0.8 µM Aβ42 was −195.6 Hz on the Aβ42 antibody-modified PDMS-mQCM microfluidic device.
Figure 4. On-line monitoring frequency response for a complete sequence of immobilization of Aβ42 antibody and detection of Aβ42 on PDMS-mQCM microfluidic system.
Sensors 15 25746 g004
Table 1. Comparison of equivalent circuit parameters between on the bare and those on modified mQCM in liquid phase.
DeviceGmax (mS)Rt (Ω)ΔRt (Ω)Δf0 (Hz)K
PDMS-mQCM3.79 ± 0.02504.5 ± 3.5NANANA
42 antibody-PDMS-mQCM1.23 ± 0.05860.6 ± 5.3356.1 ± 0.6−1528 ± 32.94 ± 0.03
42-Aβ42 antibody-PDMS-mQCM1.20 ± 0.03863.8 ± 6.83.2 ± 0.3−218 ± 146.74 ± 0.50
NA: not applicable; K = 4 π L qa Δ f 0 Δ R t ; Lqa is the motional inductance for mQCM sensor in air.
The frequency response for 3-MPA became stable after 75 min, which indicated that adsorption of –SH function groups on the mQCM surface approached saturation. Similar phenomena could be observed during EDC and Aβ42 antibody immobilization with 62 min and 70 min saturation times, respectively. Meanwhile, the conductance spectrum data during immobilization processes for Aβ42 antibody on the mQCM were analyzed. The calculated Gmax, Rt, f0, ΔRt and Δf0 values are given in Table 1. The K value was set for evaluation of the experimental responses (ΔRt and Δf0) satisfying Equation (4) or not. Lqa, the motional inductance for mQCM sensor in air, is 54.6 mH, which calculated from the conductance spectra of bare-mQCM sensor in air. As seen in Table 1, K values are above 1, so mass loading are an effective factor during the antibody immobilization step and the viscosity-density effect of the solution near the interface can be negligible.

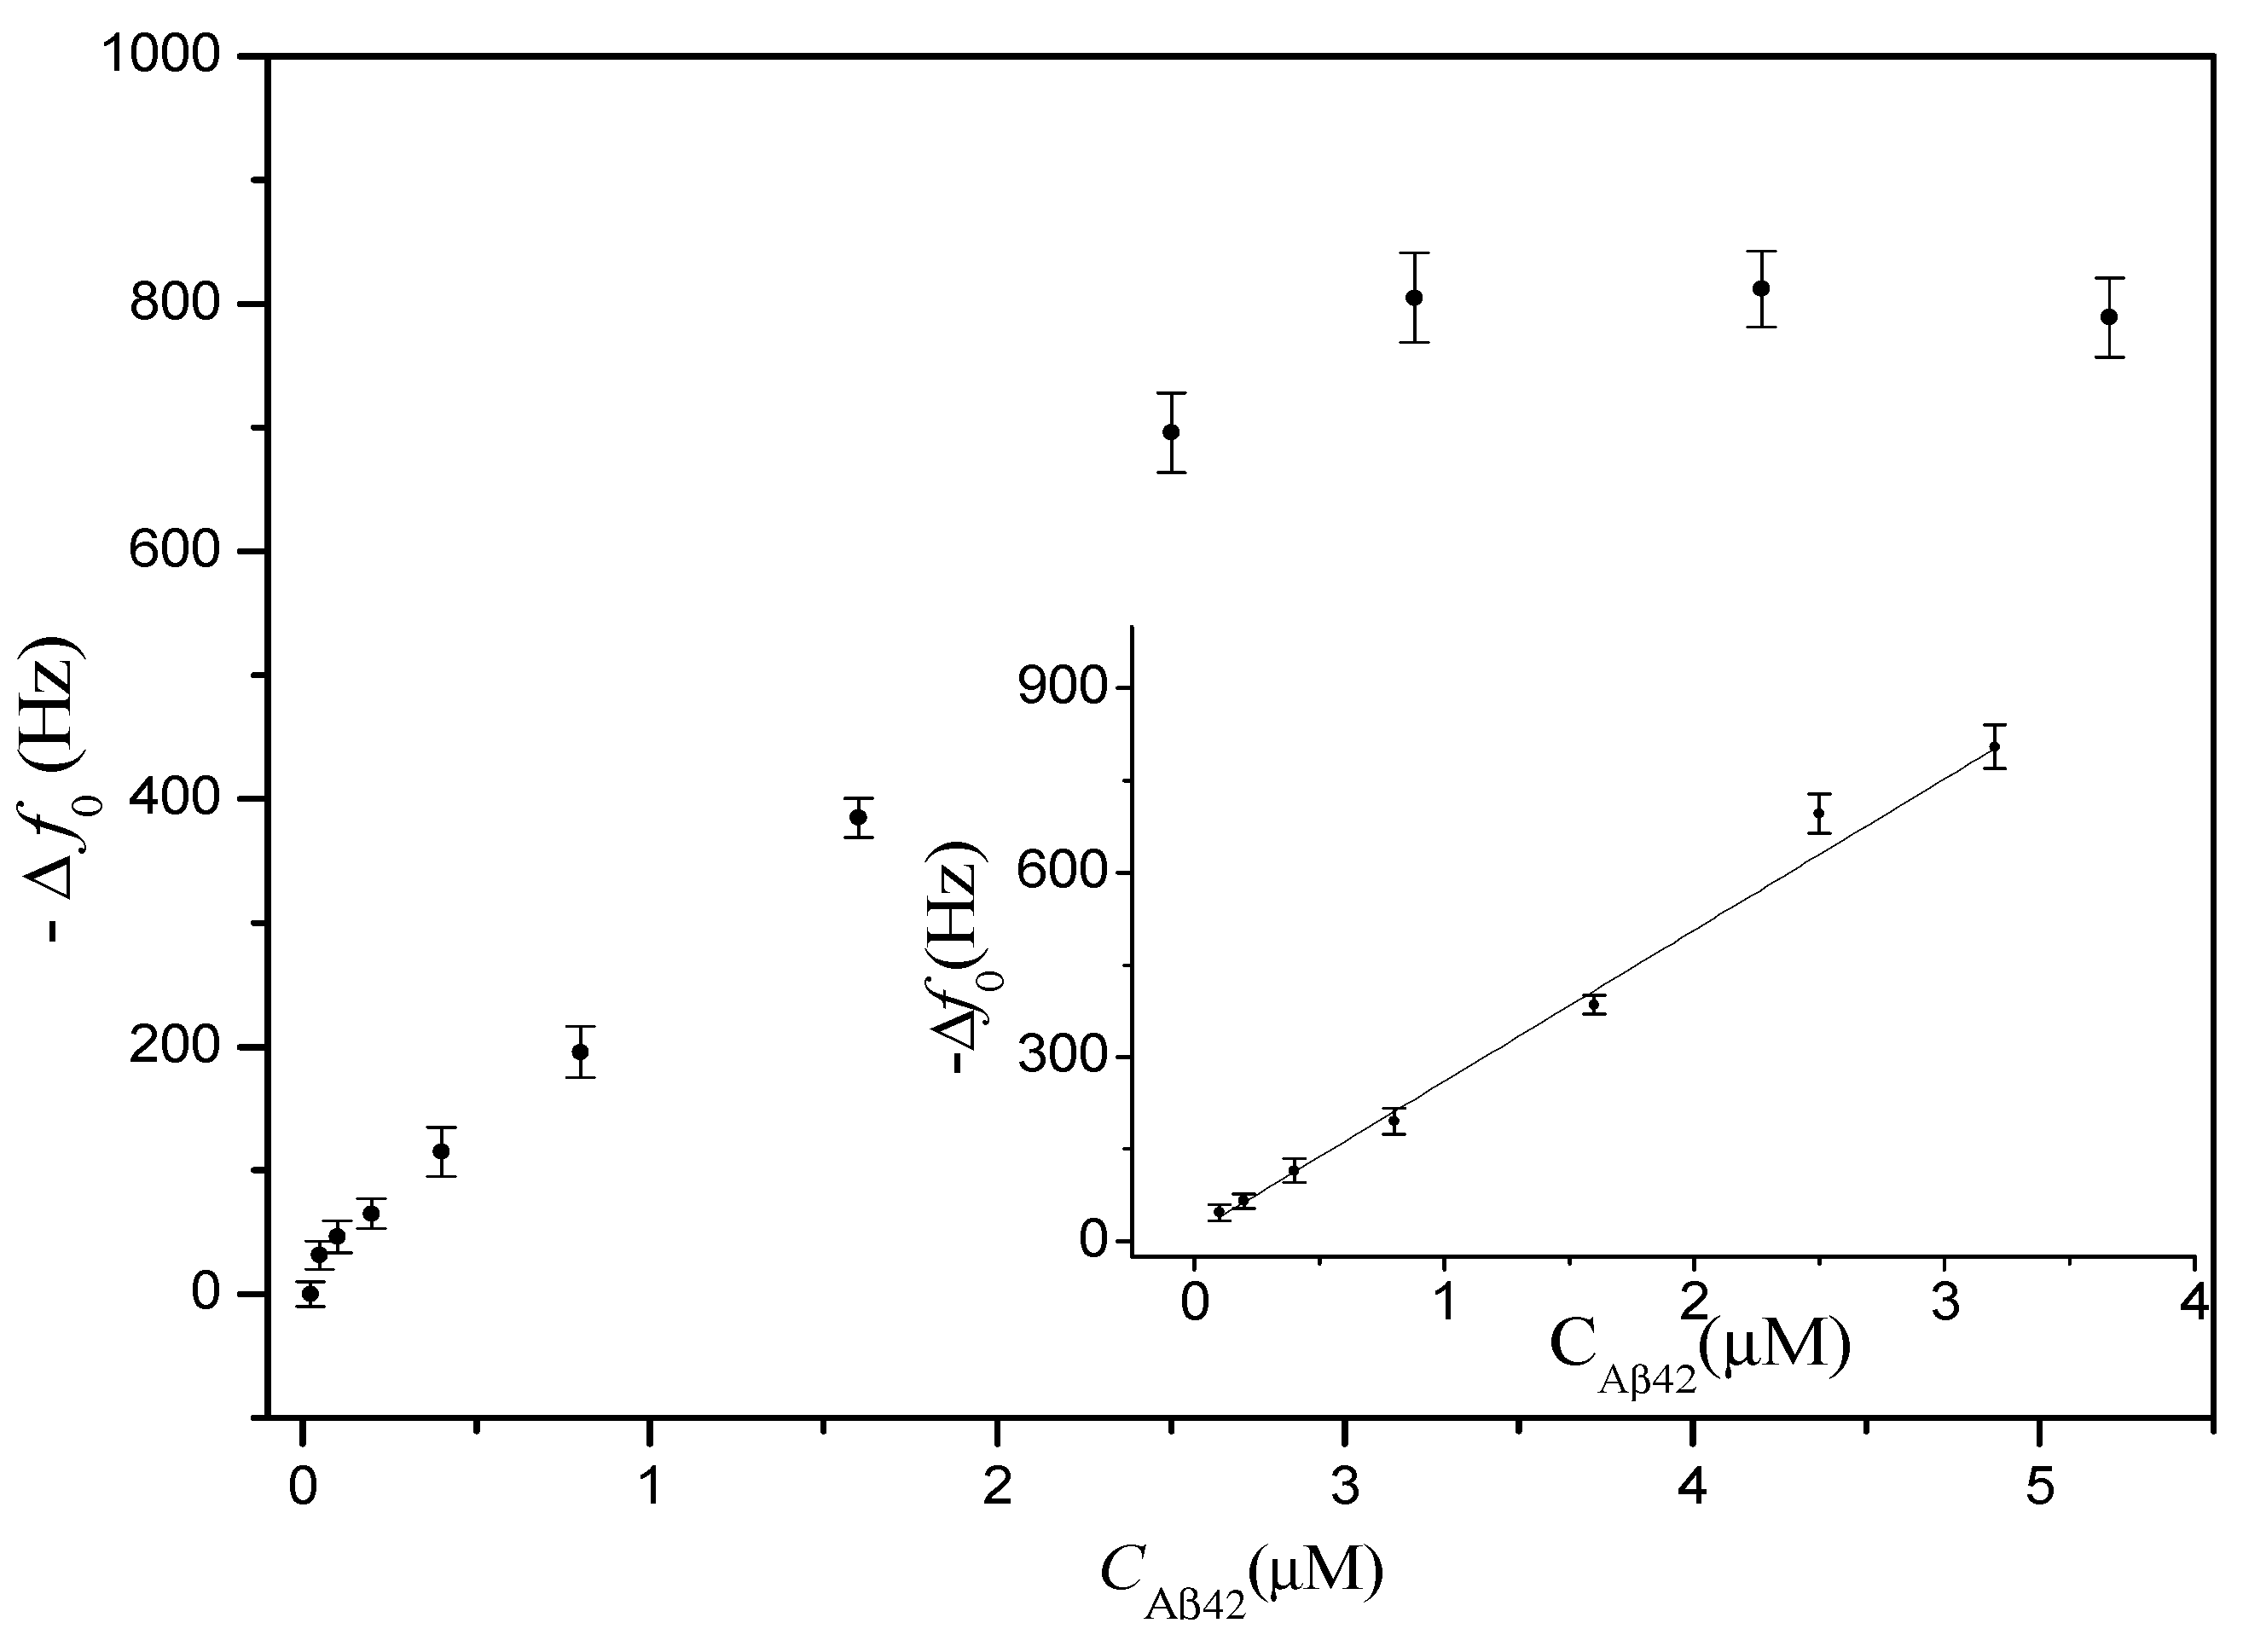
3.2. Calibration Curve

Determination of Aβ42 in PBS with different concentrations from 0.025 µM to 5.2 µM was conducted on the PDMS-mQCM microfluidic device. Results are shown in Figure 5. A linear range from 0.1 µM to 3.2 µM was found. The regression equation was obtained as follows: Δf0(Hz) = −246.15 × CAβ42(nM) − 14.44, with a correlation coefficient of 0.991.
Figure 5. The response frequency shift for on-chip determination of different concentrations of Aβ42 in PBS. Inset figure is a calibration curve of Aβ42.
Sensors 15 25746 g005

3.3. Real Sample Assay

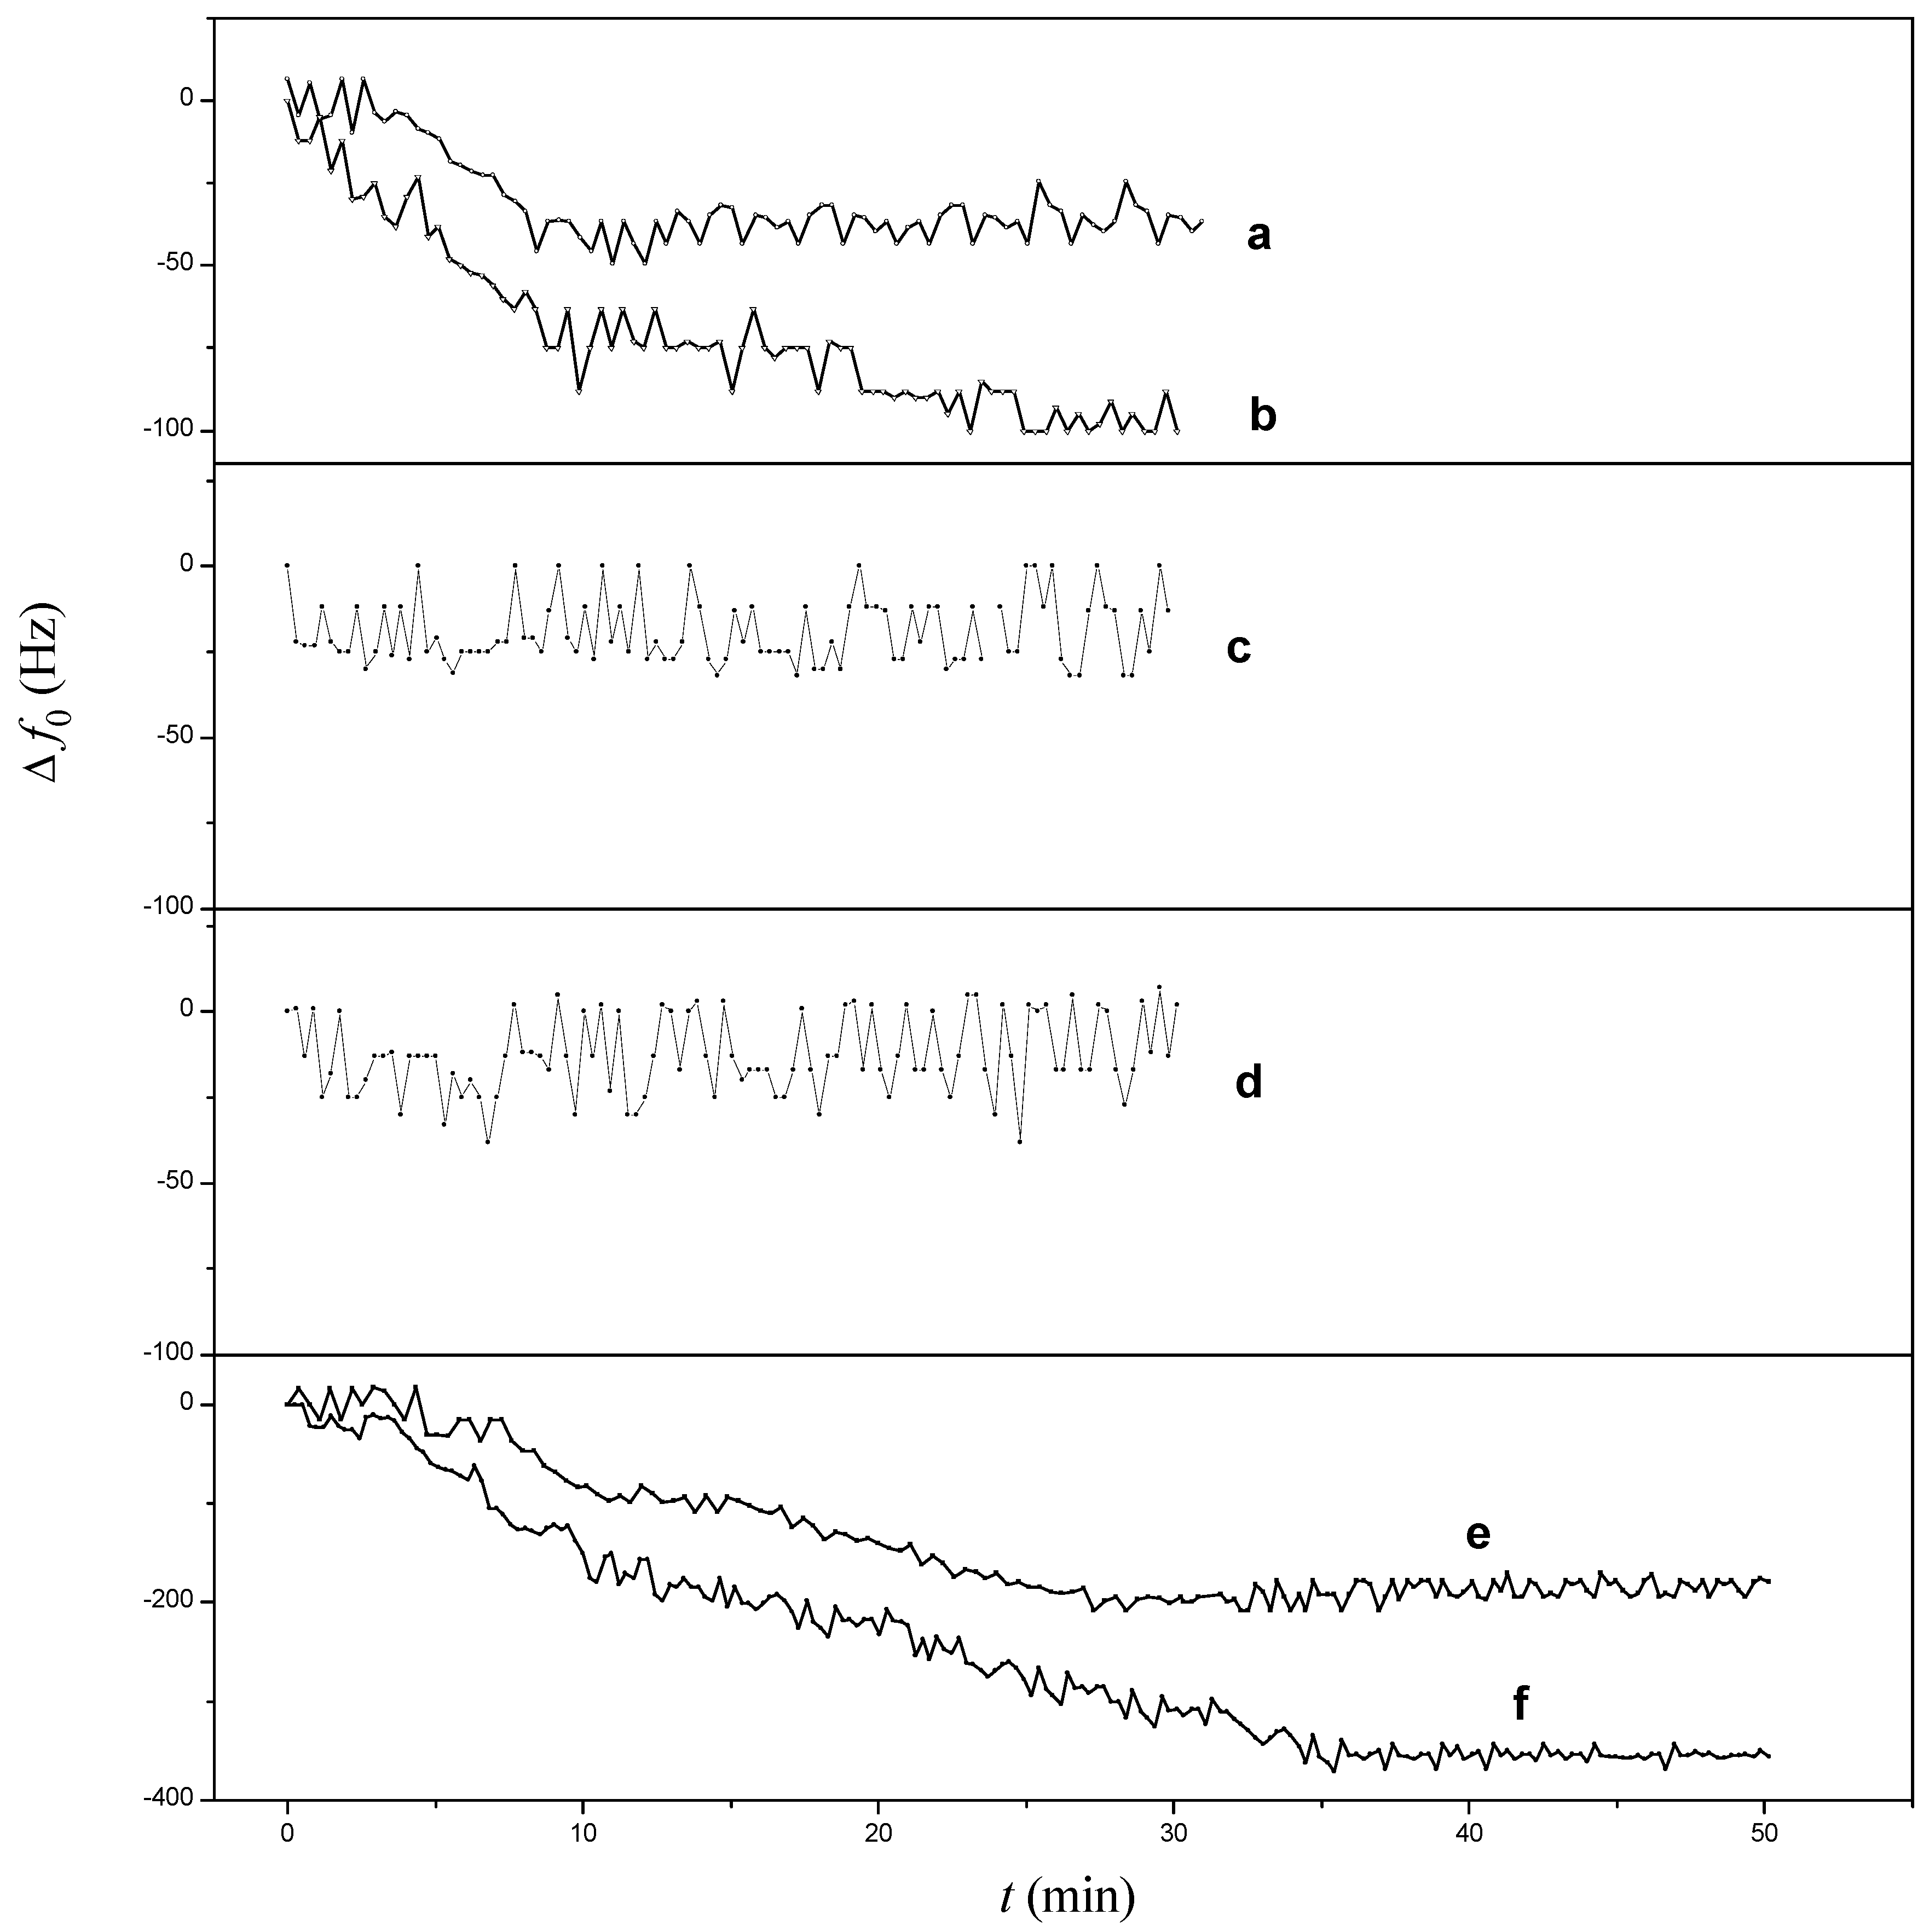
3.3.1. Non-Specific Binding Assay

Detection of biomarkers in real samples is commonly conducted in spiked buffer solutions containing human serum up to 25% (v/v) [28,29], which may be too low for clinically relevant applications. Therefore, to validate this assay in human serum, we selected a buffer solution containing a serum concentration of 75% (v/v) as spiked buffer. Meanwhile, to eliminate the non-specific serum protein binding to the mQCM sensor surface, some desorption reagents were added in PBS. A new PBS matrix buffer containing 200 µg/mL BSA, 0.5 M NaCl, 500 µg/mL dextran and 0.5% Tween 20 was used to dilute the serum. The non-specific binding of serum protein in PBS matrix on the Aβ42 antibody-modified mQCM sensor was evaluated and compared with other conditions. Results are listed in Table 2. Obviously, there are −36.5 Hz and −89.5 Hz responses for 25% serum and 75% serum, respectively, on a bare gold-QCM sensor, while on the Aβ42 antibody-modified mQCM sensor, there are almost no responses for both 25% and 75% serum. A possible reason is as follows: there are various enzymes, peptides and proteins in human serum, such as glutamic-pyruvic transaminase and albumin. Non-specific binding adsorption of enzymes or proteins in human serum occurred on the bare gold-mQCM sensor surface. The adsorption of enzymes or proteins on a bare gold-mQCM surface is similar to that of thiol-alcohol compound on the gold surface due to the formation of Au-S bonds between the Cys34 group in enzymes or proteins and the gold surface [30], while on the Aβ42 antibody-modified mQCM sensor, the gold surface was occupied by the antibody and BSA layer, so Au-S bonds could not formed by enzymes or proteins in the serum.
Table 2. Non-specific binding determination for different assays.
DeviceInjected Sample aΔf0 (Hz)
PDMS-mQCM25% serum−36.5 ± 3.0
PDMS-mQCM75% serum−89.5 ± 7.8
42 antibody-PDMS-mQCM25% serum0
42 antibody-PDMS-mQCM75% serum0
42 antibody-PDMS-mQCM0.8 µM Aβ42 + 75% serum−189.7 ± 8.6
42 antibody-PDMS-mQCM1.6 µM Aβ42 + 75% serum−356.0 ± 9.7
a Injected samples were diluted with PBS with additives: 200 µg/mL BSA, 0.5 M NaCl, 500 µg/mL dextran and 0.5% Tween 20.

3.3.2. Detection of Aβ42 in 75% Human Serum

To validate the analytical reliability of our PDMS-mQCM microfluidic device in real samples, two different concentrations of Aβ42 spiked in 75% (v/v) human serum with PBS-matrix buffer were selected for testing. There is a −189.7 Hz response for 0.8 µM Aβ42 and −356.0 Hz for 1.6 µM Aβ42 (seen in Table 2 and Figure 6). These values are close to the responses in pure PBS (−195.6 Hz and −385.0 Hz, as seen in Figure 5). This proved that desorption reagents may eliminate serum protein non-specific binding to the Aβ42 antibody on the sensor surface. On the other hand, the measured frequency of Aβ42 antibody-PDMS-mQCM with 0.8 μM or 1.6 μM Aβ42 in 75% human serum do not agree with those in pure PBS (according to the regression equation). A reasonable explanation is as follows: antigen-antibody reactions at the solid-liquid interface are diffusion limited due to depletion of reactants close to the surface [31]. The target diffusion rate would be related to the physical properties of the environmental buffer, such as viscosity and conductivity and so on. Therefore, results would be different in different testing environments, even for the same antibody-modified sensor. Additionally, lower serum Aβ42 concentrations (below 50 nM) cannot be detected at present, limited by the system sensitivity and small volume injection. We can detect low serum Aβ42 concentrations through pre-concentration methods in clinic analysis. The aim of this work is to provide an integrated PDMS-mQCM microfluidic device as a primary product for a portable microfluidic sensor. For clinic applications, the E5016B impedance network analyzer could be replaced by a simple chip, such as an AD9854 DDS chip, and hence the PDMS-mQCM microfluidic device could be considered as a fast-response, low-cost and portable sensor for determination of Aβ42.
Figure 6. Continuous monitoring frequency response for different devices in different samples: (a) PDMS-mQCM in 25% serum; (b) PDMS-mQCM in 75% serum; (c) Aβ42 antibody-PDMS-mQCM in 25% serum; (d) Aβ42 antibody-PDMS-mQCM in 75% serum; (e) Aβ42 antibody-PDMS-mQCM in 0.8 µM Aβ42 and 75% serum; (f) Aβ42 antibody-PDMS-mQCM in 1.6 µM Aβ42 and 75% serum.
Sensors 15 25746 g006

3.4. Reusability

The reusability of the PDMS-mQCM microfluidic device is crucial for sensor cost. It was evaluated by measuring the resonance performance of the sensor before and after removing modified layers. A heating method was used for removing modified layers. Chandekar et al. investigated thermal stability of alkanethiol self-assembled monolayer (SAM) film adsorbed on a gold surface [32]. Their results indicated that Au-S bonds started to rupture at 110 °C, whereas physical adsorption of SAM film on the gold surface remained strong. Au-S bonds might form again and SAM film would adsorb on the surface. If a temperature of 150 °C was applied, almost all Au-S bonds would break and physical adsorption would become very weak. The Au-S bond cannot form again at 150 °C. In this work, the used PDMS-mQCM microfluidic system was heated to 150 °C over 60 min, then allowed to cool down to room temperature, and rinsed with ethanol and water prior to measurement. Table 3 shows the effect of high temperature on the conductance of PDMS-mQCM in the liquid phase. After heat treatment, a conspicuous positive frequency shift of 1470.0 Hz and conductance shift of 1.62 mS can be observed for the Aβ42 antibody-modified mQCM. The resonance frequency and conductance increases of the used and modified mQCM were close to those of bare mQCM. This indicated that the MPA-Aβ42 antibody layer had been almost completely removed by the high temperature treatment due to Au-S bond breaking. On the other hand, the resonance frequency was different from that on a bare one. The possible reason could be that AuO was formed on the mQCM surface due to the high temperature treatment. Hence, the high temperature treatment provides a valid method to recover the mQCM surface, and make the proposed PDMS-mQCM microfluidic device reusable.
Table 3. Effect of high temperature on the conductance of the PDMS-mQCM in liquid phase.
Devicef0 (Hz)SD (Hz)Gmax (mS)Δf0 (Hz)ΔGmax (mS)
PDMS-mQCM12.99275 × 10633.90 ± 0.07NANA
42 antibody-PDMS-mQCM a12.992675 × 10653.00 ± 0.0375 ± 30.90 ± 0.01
42 antibody-PDMS-mQCM b12.991205 × 10691.38 ± 0.021470 ± 81.62 ± 0.02
NA: not applicable; a after 150 °C heating treatment; b before heating treatment.

4. Conclusions

In this work, a miniature QCM sensor was successfully integrated with a PDMS microfluidic chip, which was used in on-chip determination of an Alzheimer disease’s biomarker −Aβ42. The linear range was from 0.1 µM to 3.2 µM. By using a matrix elimination buffer containing 200 µg/mL BSA, 0.5 M NaCl, 500 µg/mL dextran and 0.5% Tween 20, Aβ42 could be successfully detected in a high serum concentration of 75%. Meanwhile, high temperature treatment with 150 °C could recover the modified mQCM surface, which makes the PDMS-mQCM microfluidic system reusable. Therefore, the prposed PDMS-mQCM microfluidic device is reusable, has fast-response and small-sample consumption, and is applicable for early Alzheimer disease diagnosis in the clinic.

Acknowledgments

This work was supported by grants from the National Natural Science Foundation of China (Nos. 21405106, 51302172 and 51272161), and the Special Research Foundation of Shenzhen Overseas High-Level Talents for Innovation and Entrepreneurship (No. KQCX20140519103821737), the Research and Development Foundation of Science and Technology of Shenzhen (No. JCYJ20150324141711592), the Natural Science Foundation of SZU (Nos. 00002201 and 201461), Shenzhen Key Laboratory of Special Functional Materials and Shenzhen Engineering Laboratory for Advanced Technology of Ceramics (No. T201409).

Author Contributions

W. Tao and Q. Xie conceived and designed the experiments; W. Tao and H. Wang performed the experiments; S. Ke and P. Lin analyzed the data; W. Tao contributed reagents/materials/analysis tools; W. Tao and X. Zeng wrote the paper.

Conflicts of Interest

The authors declare no conflict of interest.

References

  1. Tickler, A.K.; Wade, J.D.; Separovic, F. The role of Abeta peptides in Alzhermer’s disease. Protein Pept. Lett. 2005, 12, 513–519. [Google Scholar] [CrossRef] [PubMed]
  2. Tomita, T.; Iwatsubo, T. Secretase as a therapeutic target for treatment of Alzhermer’s disease. Curr. Pharm. Des. 2006, 12, 661–670. [Google Scholar] [CrossRef] [PubMed]
  3. Kakano, K.; Endo, S.; Mukaiyama, A.; Chon, H.; Matumura, H.; Koga, Y.; Kanaya, S. Structure of amyloid beta fragments in aqueous environments. FEBS J. 2006, 273, 150–158. [Google Scholar]
  4. Indeykina, M.I.; Popov, I.A.; Kozin, S.A.; Kononikhin, A.S.; Kharybin, O.N.; Tsvetkov, P.O.; Makarov, A.A.; Nikolaev, E.N. Capabilities of MS for analytical quantitative determination of the ratio of γ- and βAsp7 isoforms of the amyloid-β peptide in binary mixtures. Anal. Chem. 2011, 83, 3205–3210. [Google Scholar] [CrossRef] [PubMed]
  5. Portelius, E.; Brinkmalm, A.W.; Zetterberg, H.; Blennow, K. Determination of α-amyloid peptide signatures in cerebrospinal fluid using immunoprecipitation-mass spectrometry. J. Proteom. Res. 2006, 5, 1010–1016. [Google Scholar] [CrossRef] [PubMed]
  6. Rushworth, J.V.; Ahmed, A.; Griffiths, H.H.; Pollock, N.M.; Hooper, N.M.; Millner, P.A. A label-free electrical impedimetric biosensor for the specific detection of Alzheimer’s amyliod-beta oligomers. Biosens. Bioelectron. 2014, 56, 83–90. [Google Scholar] [CrossRef] [PubMed]
  7. Suprun, E.V.; Shumyantseva, V.V.; Archakov, A.I. Protein electrochemistry: Application in medicine. Electrochim. Acta 2014, 140, 72–82. [Google Scholar] [CrossRef]
  8. Liu, L.; He, Q.; Zhao, F.; Xia, N.; Liu, H.; Li, S.; Liu, R.; Zhang, H. Competitive electrochemical immunoassay for detection of β-amyloid (1-42) and total β-amyloid peptides using p-aminophenol redox cycling. Biosens. Bioelectron. 2014, 51, 208–212. [Google Scholar] [CrossRef] [PubMed]
  9. Yu, Y.Y.; Sun, X.; Tang, D.; Li, C.; Zhang, L.; Nie, D.X.; Yin, X.X.; Shi, G.Y. Gelsolin bound β-amyloid peptides(1-40/1-42): Electrochemical evaluation of levels of soluble peptide associated with Alzheimer’s disease. Biosens. Bioelectron. 2015, 68, 115–121. [Google Scholar] [CrossRef]
  10. Clarke, N.J.; Tomlinson, A.J.; Ohyagi, Y.; Younkin, S.; Naylor, S. Detection and quantitation of cellularly derived amyloid L-peptide by immune-precipitation HPLC-MS. FEBS Lett. 1998, 430, 419–423. [Google Scholar] [CrossRef]
  11. Xing, Y.; Xia, N. Biosensors for the determination of Amyloid-beta peptides and their aggregates with application to Alzheimer’s disease. Anal. Lett. 2015, 48, 879–893. [Google Scholar] [CrossRef]
  12. Yu, L.; Zhang, Y.T.; Chen, R.; Zhang, D.H.; Wei, X. H.; Chen, F.; Wang, J.X.; Xu, M.T. A highly sensitive resonance light scattering probe for Alzheimer’s amyloid-β peptide based on Fe3O4@Au composites. Talanta 2015, 131, 475–479. [Google Scholar] [CrossRef] [PubMed]
  13. Weaver, W.; Kittur, H.; Dhara, M.; Carlo, D.D. Research highlights: Microfluidic point-of-care diagnostics. Lab Chip 2014, 14, 1962–1965. [Google Scholar] [CrossRef]
  14. Gervais, L.; Rooij, N.; Delamarche, E. Microfluidic chips for point of care immunodiagnostics. Adv. Mater. 2011, 23, H151–H176. [Google Scholar] [CrossRef] [PubMed]
  15. Nashida, N.; Satoh, W.J.; Suzuki, H. Electrochemical immunoassay on a microfluidic device with sequential injection and flushing functions. Biosens. Bioelectron. 2007, 22, 3167–3173. [Google Scholar] [CrossRef] [PubMed]
  16. Yang, W.; Sun, X.; Wang, H.Y.; Woolley, A.T. Integrated microfluidic device for serum biomarker quantitation using either standard addition or a calibration curve. Anal. Chem. 2009, 81, 8230–8235. [Google Scholar] [CrossRef] [PubMed]
  17. Lee, M.; Lee, K.; Kim, K.H.; Kwang, W.O.; Choo, J. SERS-based immunoassay using a gold array-embedded gradient microfluidic chip. Lab Chip 2012, 12, 3720–3727. [Google Scholar] [CrossRef] [PubMed]
  18. Michalzik, M.; Wendler, J.; Rabe, J.; Büttgenbach, S.; Bilitewski, U. Development and application of a miniaturised quartz crystal microbalance (QCM) as immunosensor for bone morphogenetic protein-2. Sens. Actuators B Chem. 2005, 105, 508–515. [Google Scholar] [CrossRef]
  19. Orelma, H.; Teerinen, T.; Johansson, L.S.; Holappa, S.; Laine, J. CMC-modified cellulose biointerface for antibody conjugation. Biomacromolecules 2012, 13, 1051–1058. [Google Scholar] [CrossRef]
  20. Uludag, Y.; Tothill, I.E. Cancer biomarker detection in serum samples using surface plasmon resonance and quartz crystal microbalance sensors with nanoparticle signal amplification. Anal. Chem. 2012, 84, 5898–5904. [Google Scholar] [CrossRef] [PubMed]
  21. Teller, C.; Halámek, J.; Žeravík, J.; Stöcklein, W.F.; Scheller, F.W. Development of a bifunctional sensor using haptenized acetylcholinesterase and application for the detection of cocaine and organophosphates. Biosens. Bioelectron. 2008, 24, 111–117. [Google Scholar] [CrossRef] [PubMed]
  22. Michalzik, M.; Wilke, R.; Büttgenbach, S. Miniaturized QCM-based flow system for immunosensor application in liquid. Sens. Actuators B Chem. 2005, 111–112, 410–415. [Google Scholar] [CrossRef]
  23. Ohlsson, G.; Axelsson, P.; Henry, J.; Petronis, S.; Svedhem, S.; Kasemo, B. A miniatureized flow reaction chamber for use in combination with QCM-D sensing. Microfluid. Nanofluid. 2010, 9, 705–716. [Google Scholar] [CrossRef]
  24. Martin, S.J.; Granstaff, V.E.; Frye, G.C. Characterization of a quartz crystal microbalance with simultaneous mass and liquid loading. Anal. Chem. 1991, 63, 2272–2281. [Google Scholar] [CrossRef]
  25. Xie, Q.J.; Zhang, Y.Y.; Xu, M.; Li, Z.; Yuan, Y.; Yao, S.Z. Combined quartz crystal impedance and electrochemical impedance measurements during adsorption of bovine serum albumin onto bare and cysteine-or thiophenol-modified gold electrodes. J. Electroanal.Chem. 1999, 478, 1–8. [Google Scholar] [CrossRef]
  26. Xie, Q.J.; Zhang, Y.Y.; Yuan, Y.; Guo, Y.; Wang, X.; Yao, S.Z. An electrochemical quartz crystal impedance study on cystine precipitation onto an Au electrode surface during cysteine oxidation in aqueous solution. J. Electroanal. Chem. 2000, 484, 41–54. [Google Scholar] [CrossRef]
  27. Xie, Q.J.; Wang, J.; Zhou, A.; Zhang, Y.Y.; Liu, H.; Xu, Z. A study of depletion layer effects on equivalent circuit parameters using an electrochemical quartz crystal impedance system. Anal. Chem. 1999, 71, 4649–4656. [Google Scholar] [CrossRef]
  28. Homola, J. Surface plasmon resonance sensors for detection of chemical and biological species. Chem. Rev. 2008, 108, 462–493. [Google Scholar] [CrossRef] [PubMed]
  29. Lai, W.; Tang, D.; Que, X.; Zhuang, J.; Fu, L.; Chen, G. Enzyme-catalyzed silver deposition on irregular-shaped gold nanoparticles for electrochemical immunoassay of alpha-fetoprotein. Anal. Chim. Acta 2012, 755, 62–68. [Google Scholar] [CrossRef] [PubMed]
  30. Sugio, S.; Kashima, A.; Mochizuki, S.; Noda, M.; Kobayashi, K. Crystal structure of human serum albumin at 2.5 Å resolution. Protein Eng. 1999, 12, 439–446. [Google Scholar] [CrossRef]
  31. Stenberg, M.; Nygren, H. Kinetics of antigen-antibody reactions at solid-liquid interfaces. J. Immunol. Methods 1988, 113, 3–15. [Google Scholar] [CrossRef]
  32. Chandekar, A.; Sengupta, S.K.; Whitten, J.E. Thermal stability of thiol and silane monolayers: A comparative study. Appl. Surf. Sci. 2010, 256, 2742–2749. [Google Scholar] [CrossRef]

