
On Time Domain Analysis of Photoplethysmogram Signals for Monitoring Heat Stress

 ,
,  ,
,
Abstract
:1. Introduction and Motivation
1.1. Heat Stress
1.2. PPG Analysis
2. Materials and Methods
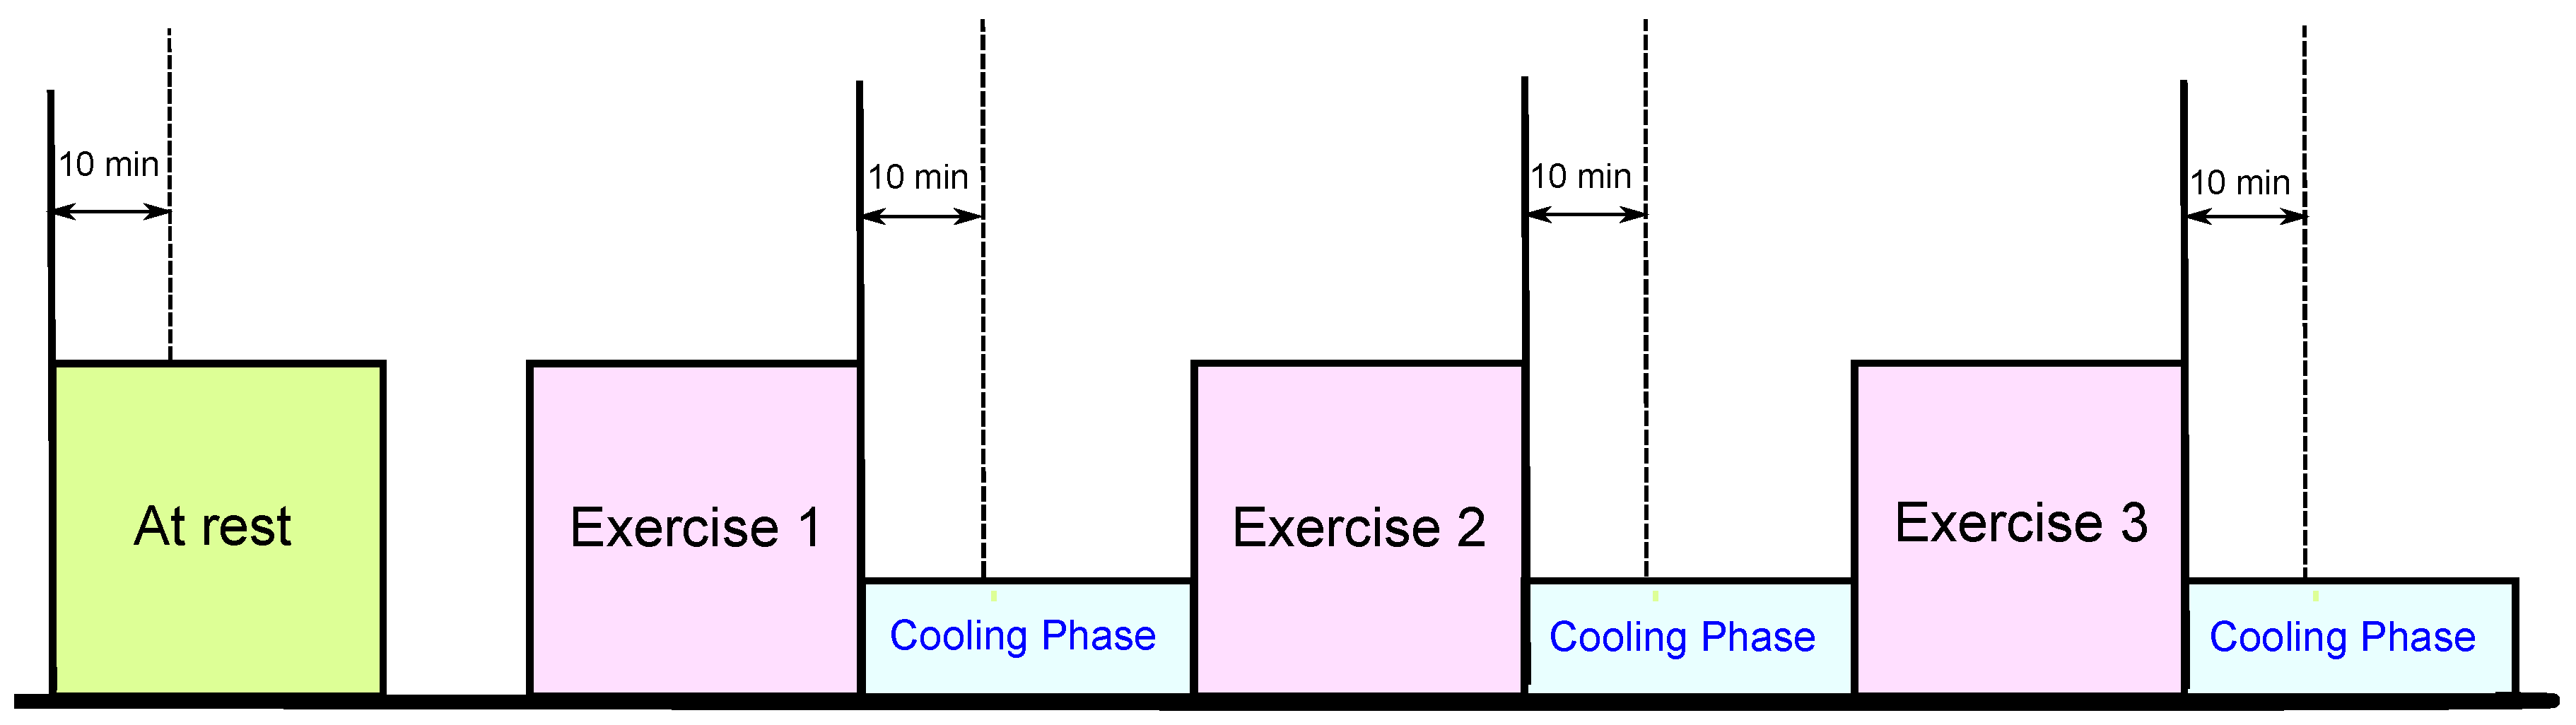
2.1. Data Collection

| Characteristic | Mean | Standard Deviation |
|---|---|---|
| Age (years) | 34.7 | 6.6 |
| Body Mass (kg) | 81.8 | 12.8 |
| Height (cm) | 176.0 | 6.5 |
| Body Mass Index () | 26.3 | 3.6 |
| Resting Systolic Blood Pressure (mmHg) | 129.3 | 13.3 |
| Resting Heart Rate (bpm) | 76.0 | 14.7 |
| Resting Core Temperature (°C) | 37.4 | 0.4 |
| After Exercise 1 Systolic Blood Pressure (mmHg) | 144.4 | 22.4 |
| After Exercise 1 Heart Rate (bpm) | 133.1 | 29.9 |
| After Exercise 1 Core Temperature (°C) | 38.4 | 0.5 |
| After Exercise 2 Systolic Blood Pressure (mmHg) | 144.6 | 20.6 |
| After Exercise 2 Heart Rate (bpm) | 143.9 | 23.6 |
| After Exercise 2 Core Temperature (°C) | 38.0 | 0.9 |
| After Exercise 3 Systolic Blood Pressure (mmHg) | 132.7 | 13.5 |
| After Exercise 3 Heart Rate (bpm) | 138.2 | 25.7 |
| After Exercise 3 Core Temperature (°C) | 37.8 | 0.8 |
2.2. Methodology
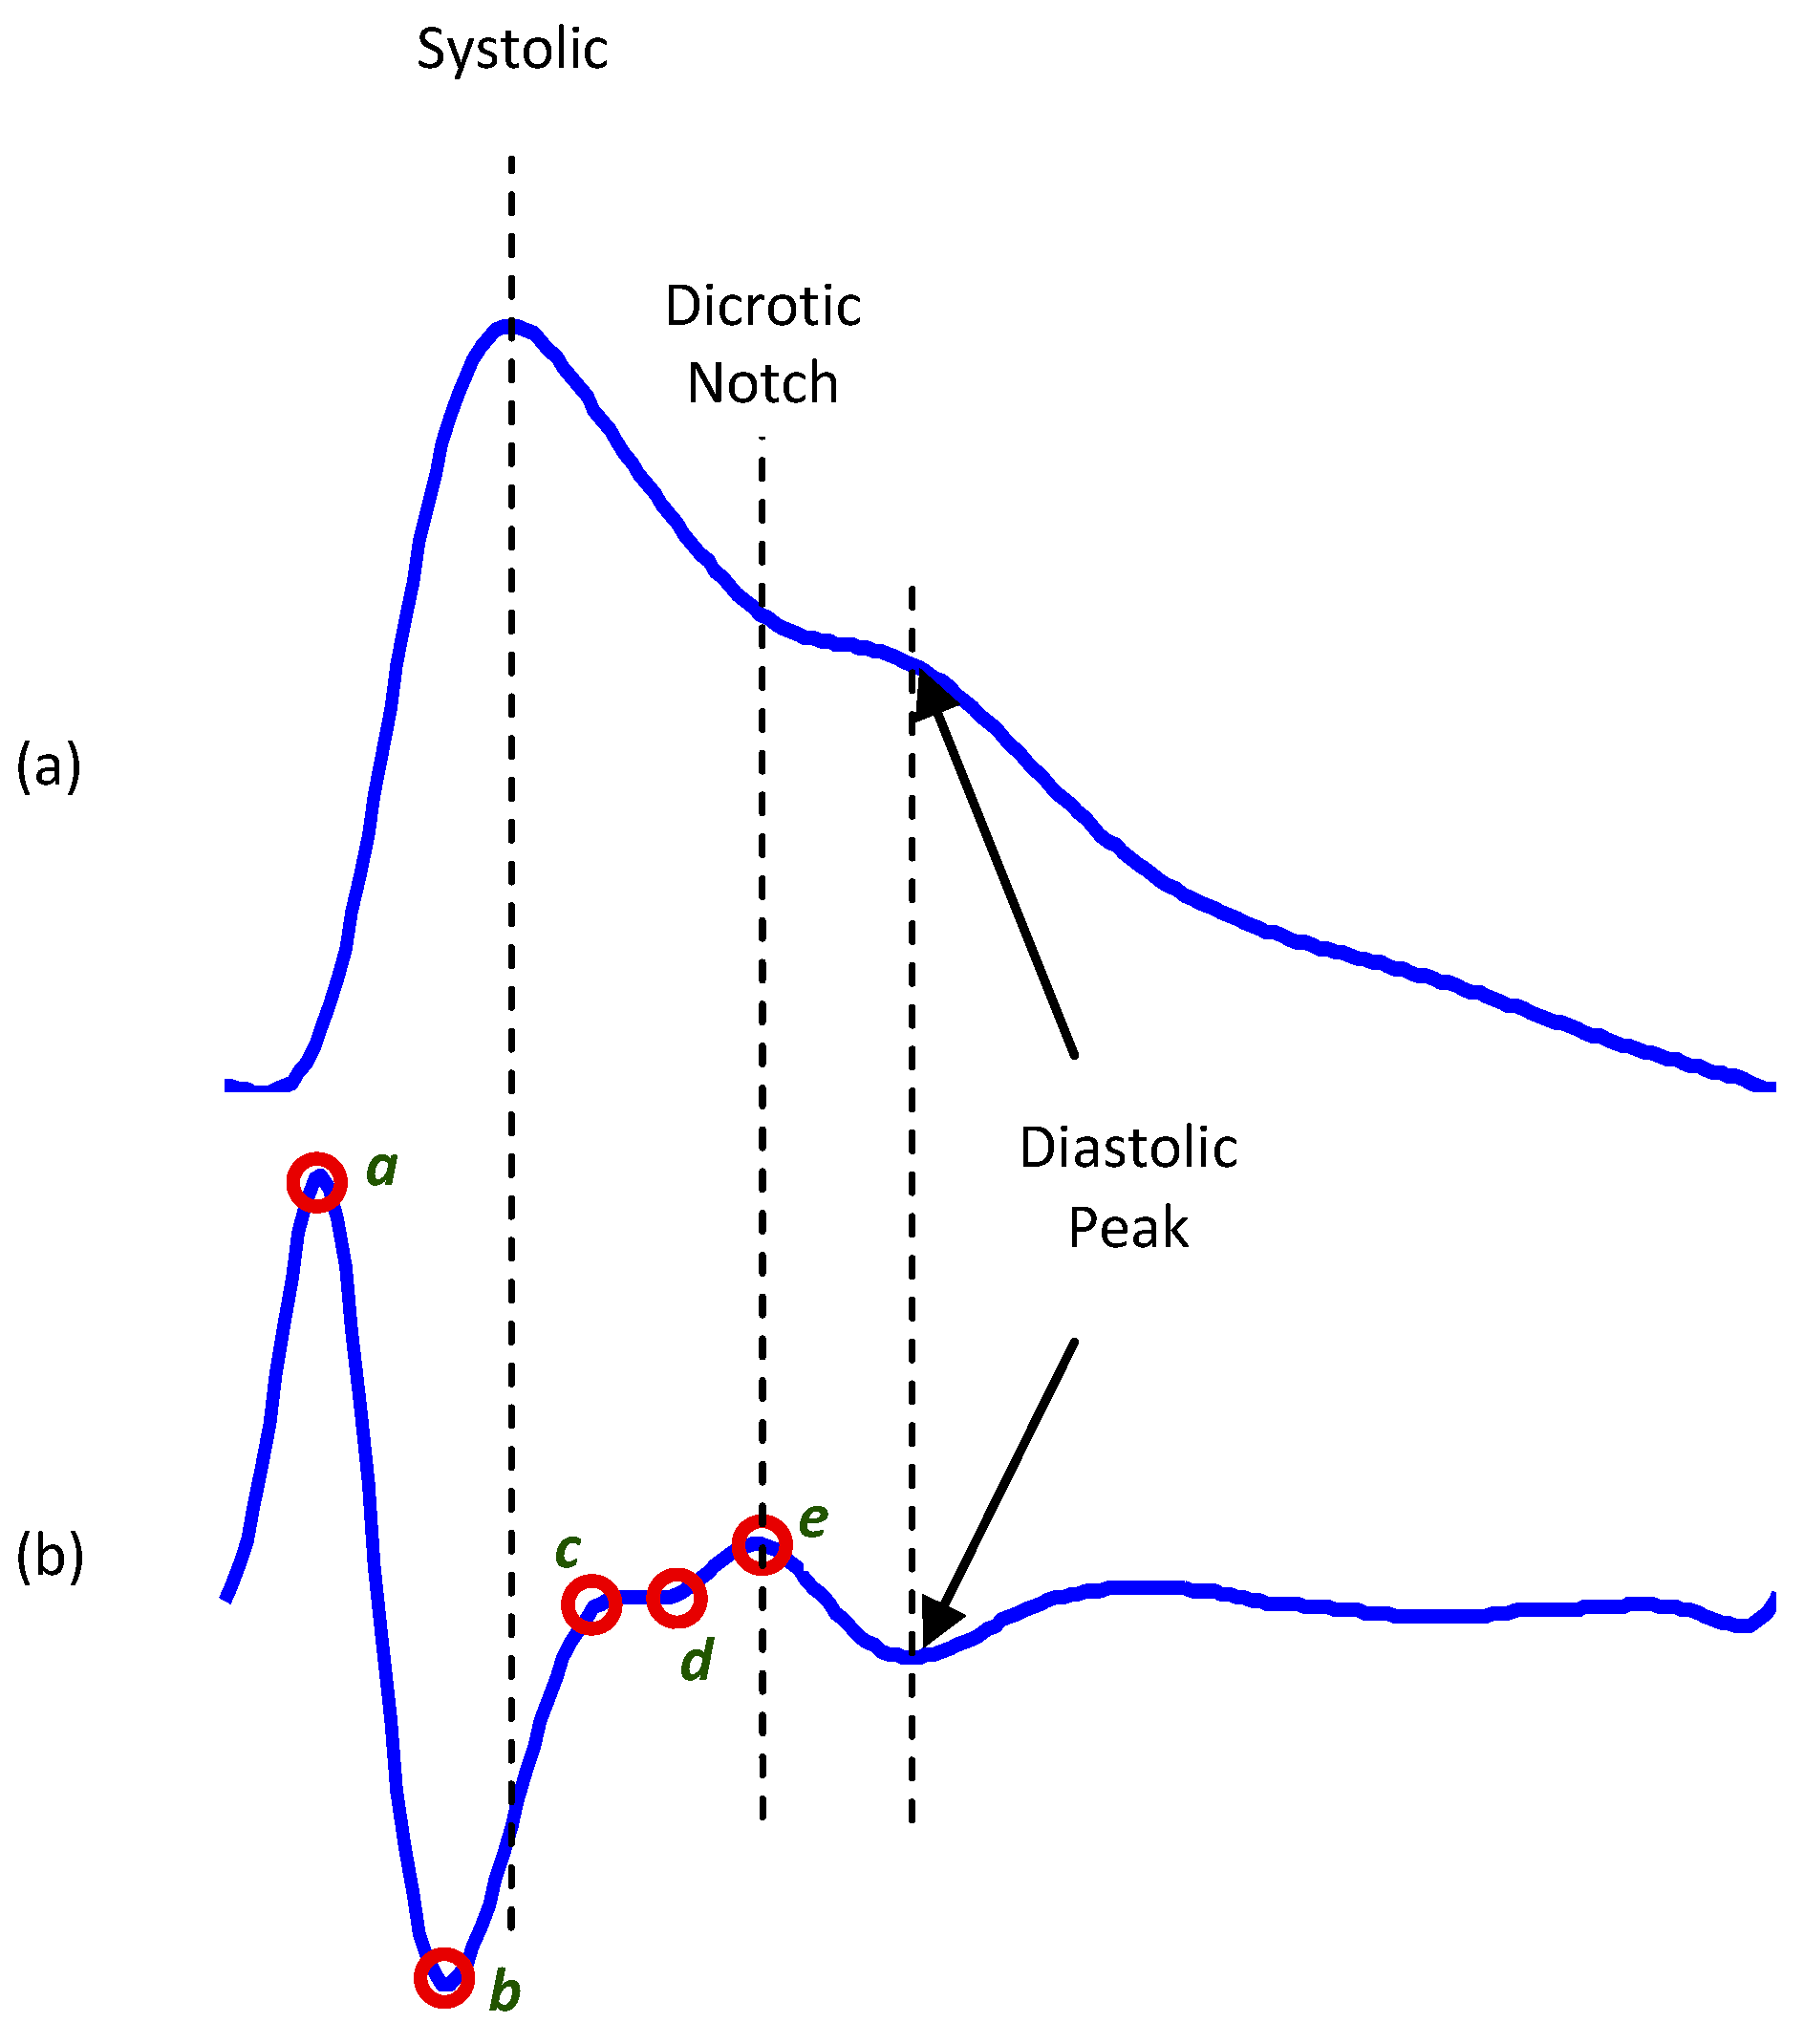
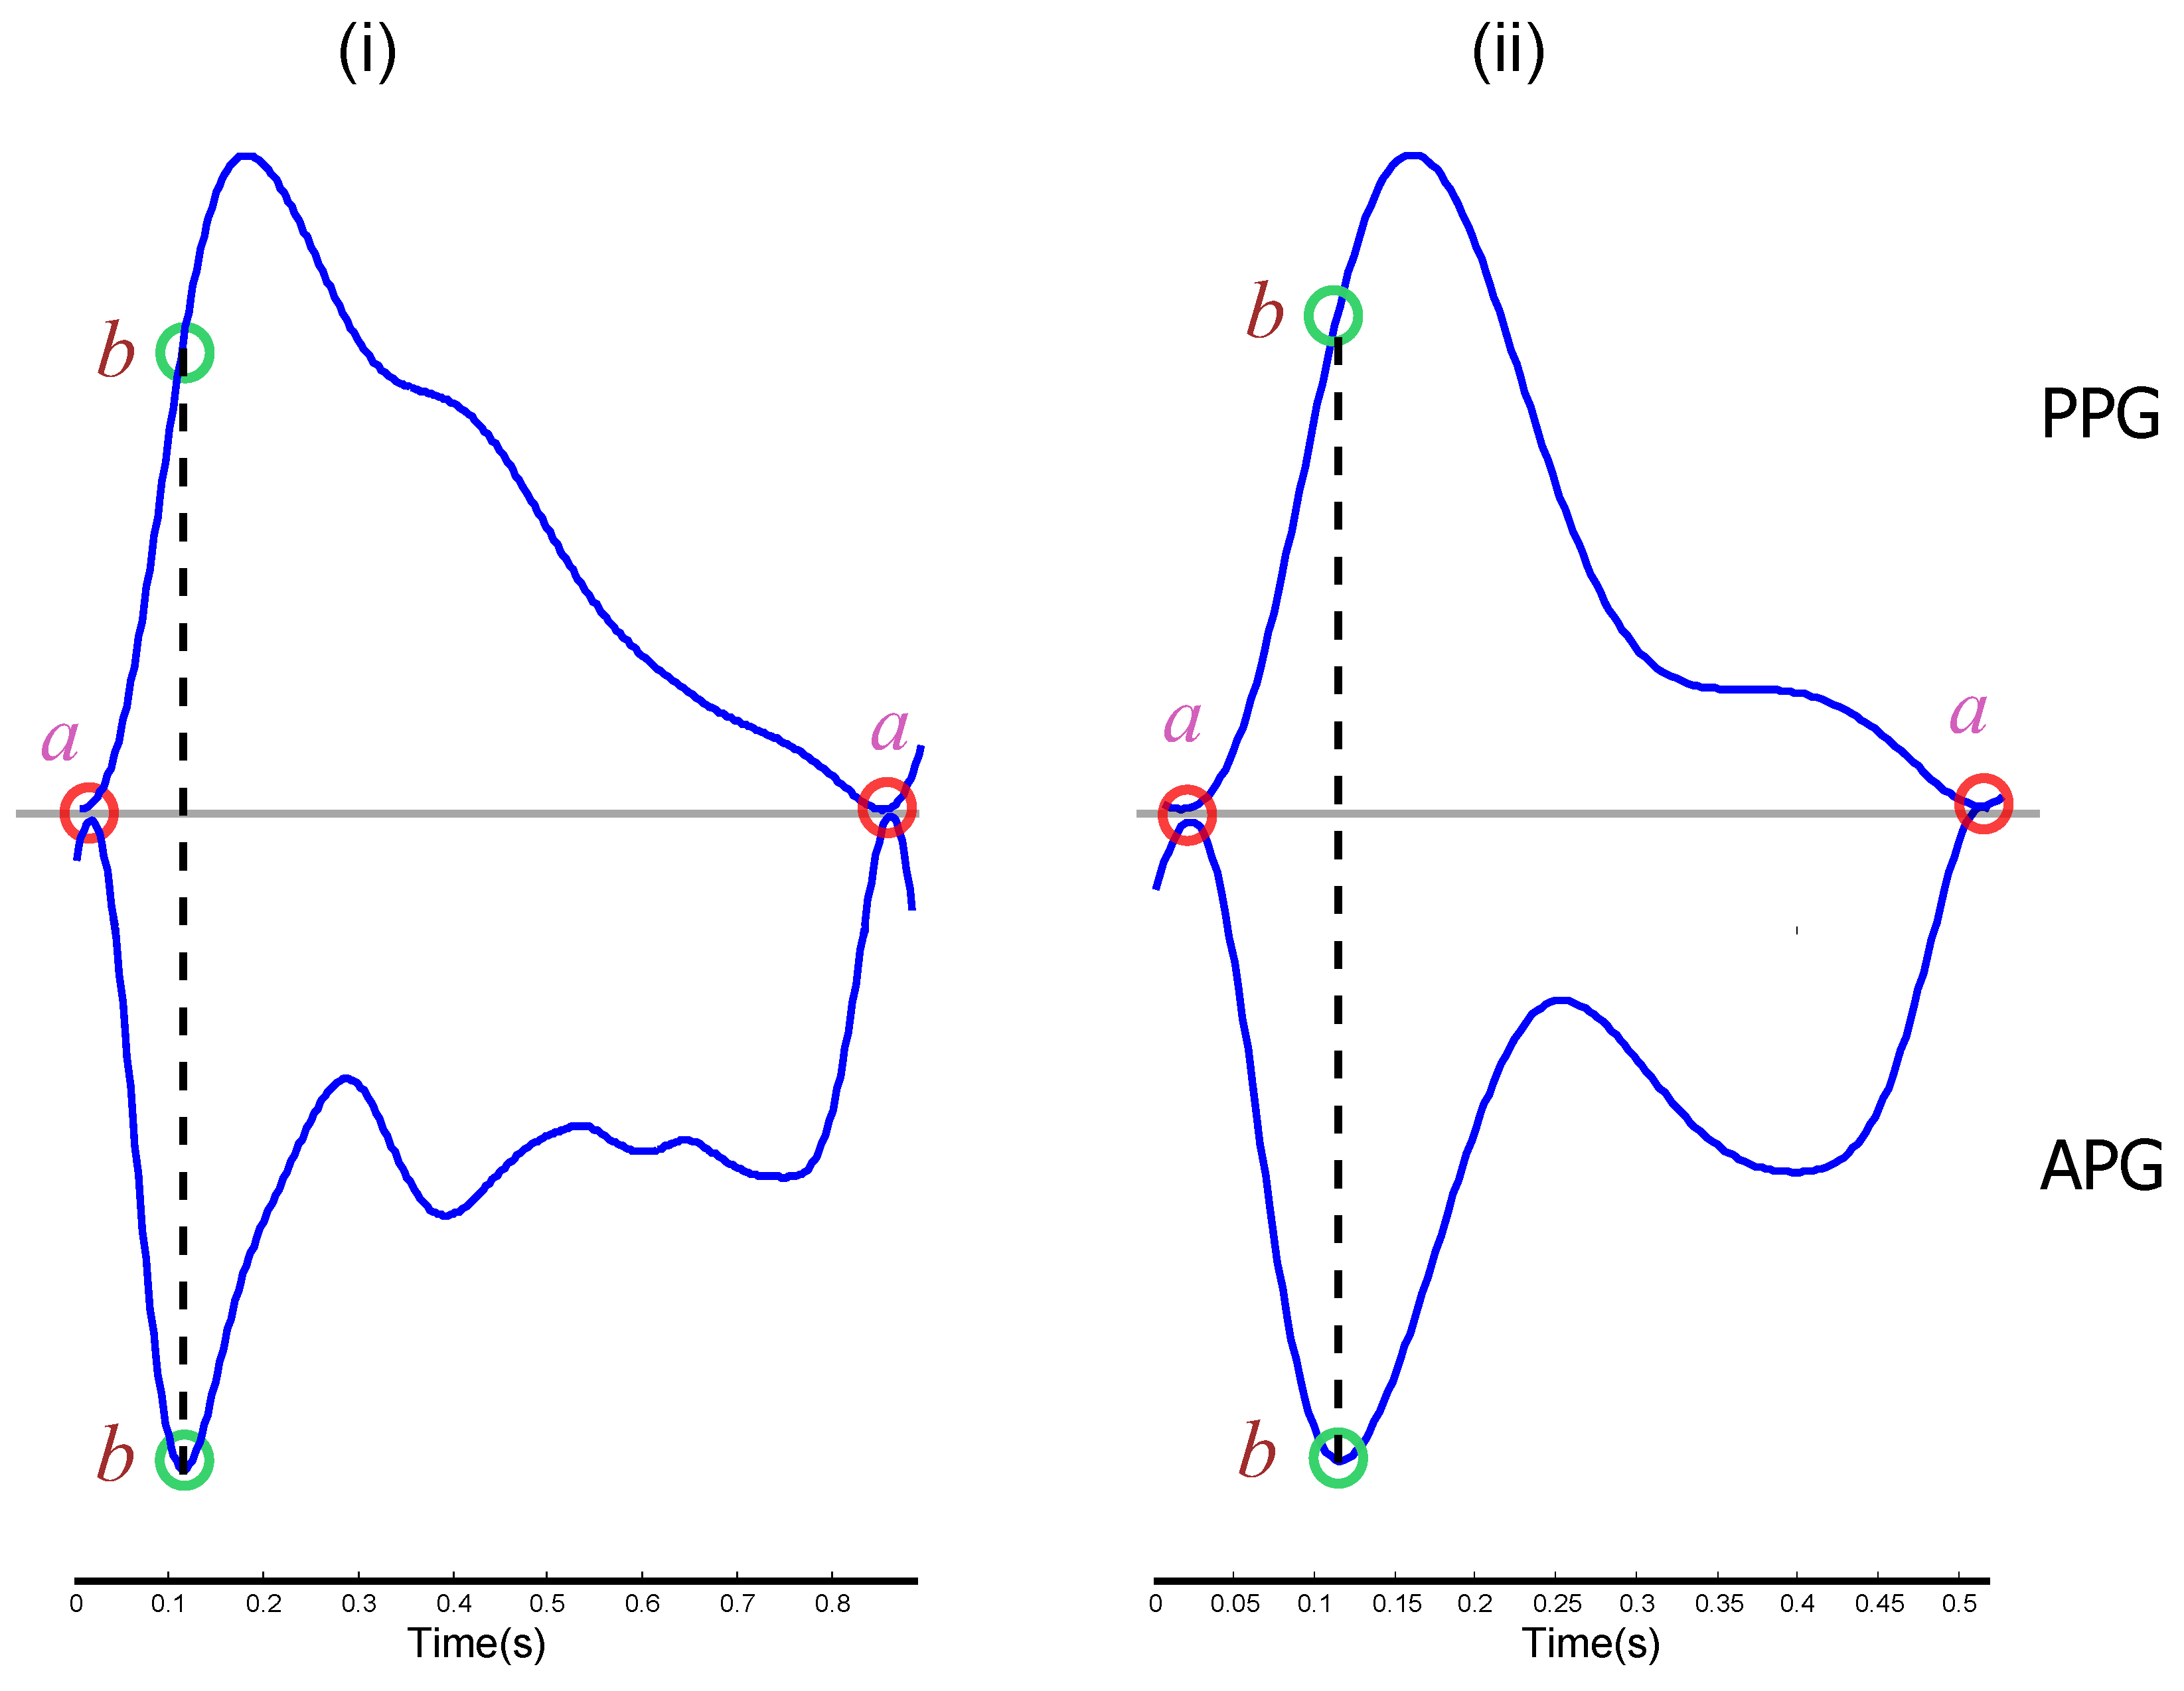
2.2.1. APG Signal
2.2.2. Feature Extraction
2.2.3. Statistical Analysis
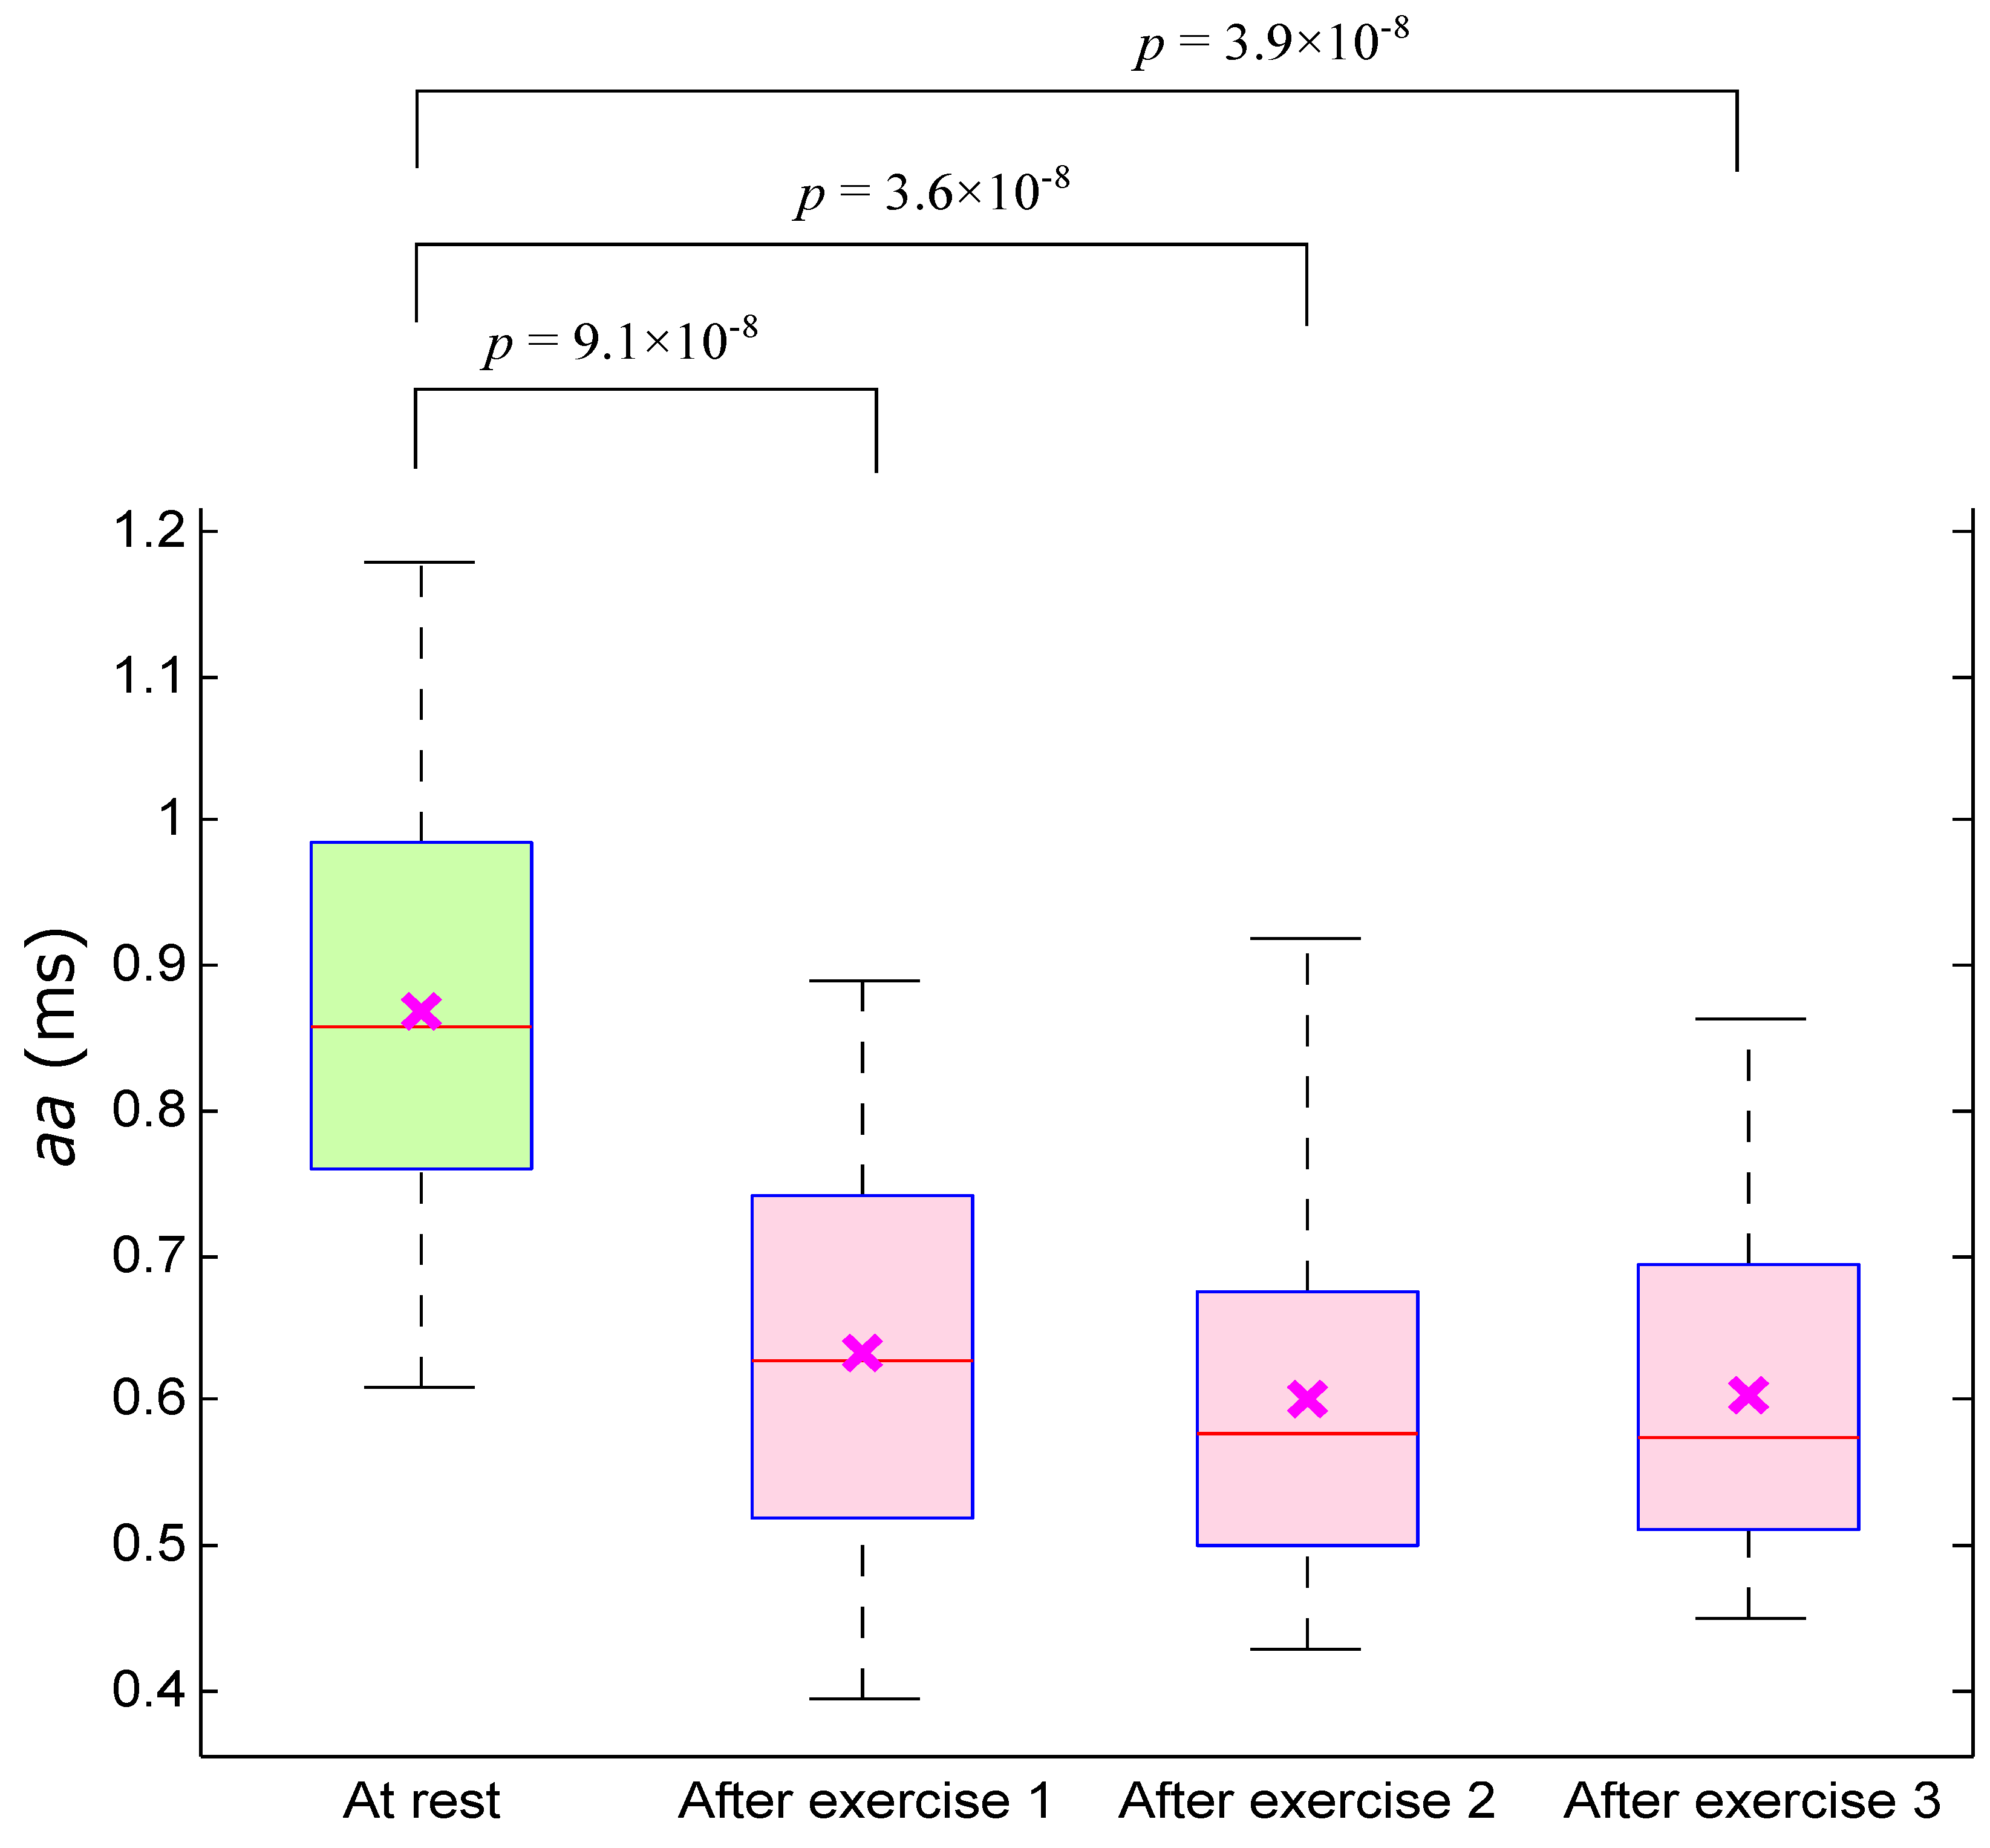
3. Results and Discussion

| Feature | Before Exercise (BE) | After Exercise (E1) | After Exercise (E2) | After Exercise (E3) | p-value | p-value | p-value | |
|---|---|---|---|---|---|---|---|---|
| (BE vs. E1) | (BE vs. E2) | (BE vs. E3) | ||||||
| (Energy ) | 95.516 ± 9.998 | 96.302 ± 10.000 | 101.245 ± 8.792 | 89.148 ± 8.822 | 0.648 | 0.221 | ||
| (Energy ) | 7.9 ± 1.3 | 5.8 ± 1.2 | 5.6 ± 1.2 | 5.6 ± 91 | 1.4 | 4.4 | 3.7 | 4.8 |
| (Energy ) | 7.0 ± 1.3 | 4.9 ± 1.2 | 4.6 ± 1.2 | 4.7 ± 93 | 1.2 | 3.0 | 1.3 | 4.1 |
| (Ampb) | −1.259 ± 0.222 | −1.216 ± 0.198 | −1.115 ± 0.260 | −1.194 ± 0.202 | 0.264 | 0.140 | 0.138 | |
| (Amp a) | −1.793 ± 0.167 | −1.860 ± 0.184 | −1.912 ± 0.202 | −1.884 ± 0.169 | 0.097 | 0.040 | ||
| (Ratio ) | 0.718 ± 0.176 | 0.669 ± 0.163 | 0.602 ± 0.196 | 0.647 ± 0.168 | 0.173 | 0.077 | 0.086 | |
| (Slope ) | 0.014 ± 0.010 | 0.019 ± 0.012 | 0.023 ± 0.014 | 0.021 ± 0.012 | 0.056 | 0.022 | ||
| (Energy ) | 3.6 ± 4.7 | 6.4 ± 6.6 | 1.1 ± 1.2 | 6.2 ± 5.4 | 8.9 | 1.5 | ||
| (Energy ) | 8.0 ± 1.1 | 1.6 ± 1.7 | 2.5 ± 2.7 | 1.7 ± 1.5 | 1.1 | 3.4 | 5.9 | |
| (Energy ) | 4.6 ± 6.2 | 9.7 ± 1.1 | 1.4 ± 1.6 | 1.2 ± 1.1 | 1.1 | 1.5 | 3.0 | |
| (Amp b) | −106.723 ± 78.852 | −161.405 ± 100.373 | −197.465 ± 128.413 | −166.542 ± 94.505 | 7.2 | 5.5 | 5.4 | |
| (Amp a) | 103.586 ± 74.426 | 154.279 ± 98.926 | 193.623 ± 125.186 | 164.371 ± 94.626 | 6.9 | 3.5 | 5.9 | |
| (Ratio ) | −1.015 ± 0.156 | −1.057 ± 0.140 | −1.023 ± 0.088 | −1.026 ± 0.094 | 0.12 | 0.641 | 0.634 | 0.465 |
| (Slope ) | −5.763 ± 4.231 | −9.469 ± 6.472 | −11.165 ± 7.785 | −10.370 ± 6.219 | 5.8 | 9.5 | 2.2 |
| Feature | Before Exercise vs. After Exercise 1 | Before Exercise vs. After Exercise 2 | Before Exercise vs. After Exercise 3 | OA | |||||||||
|---|---|---|---|---|---|---|---|---|---|---|---|---|---|
| Mahalanobis | LDA | QDA | SVM | Mahalanobis | LDA | QDA | SVM | Mahalanobis | LDA | QDA | SVM | (%) | |
| (Energy ) | 50.00 | 55.00 | 40.96 | 59.79 | 60.24 | 60.98 | 61.33 | 62.16 | 64.86 | 63.01 | 61.97 | 63.01 | 58.61 |
| (Energy ) | 72.73 | 72.73 | 72.73 | 75.00 | 83.54 | 78.95 | 78.95 | 82.93 | 82.93 | 82.67 | 84.62 | 85.00 | 79.40 |
| (Energy ) | 71.79 | 71.79 | 71.79 | 78.05 | 82.05 | 80.52 | 80.52 | 84.34 | 80.49 | 76.32 | 77.92 | 79.01 | 77.88 |
| (Amp b) | 53.93 | 57.14 | 46.58 | 58.14 | 65.12 | 65.12 | 64.44 | 65.17 | 61.73 | 61.73 | 57.14 | 62.79 | 59.92 |
| (Amp a) | 61.36 | 61.36 | 63.04 | 63.04 | 67.44 | 67.44 | 63.74 | 67.44 | 67.47 | 67.47 | 65.88 | 65.85 | 65.13 |
| (Ratio ) | 59.52 | 60.24 | 49.35 | 59.52 | 65.85 | 65.85 | 67.42 | 65.85 | 64.20 | 64.20 | 60.76 | 62.50 | 62.11 |
| (Slope ) | 62.07 | 63.64 | 62.50 | 62.50 | 66.67 | 68.18 | 67.39 | 66.67 | 69.05 | 69.05 | 68.97 | 69.05 | 66.31 |
| (Energy ) | 61.05 | 61.05 | 69.31 | 69.31 | 67.42 | 71.58 | 70.59 | 69.57 | 65.91 | 65.91 | 65.22 | 68.04 | 67.08 |
| (Energy ) | 63.16 | 62.50 | 70.59 | 69.90 | 66.67 | 72.34 | 70.59 | 72.34 | 68.18 | 67.42 | 72.92 | 68.82 | 68.78 |
| (Energy ) | 63.83 | 63.92 | 70.59 | 70.59 | 68.13 | 72.92 | 69.90 | 73.47 | 70.45 | 71.11 | 74.23 | 71.74 | 70.07 |
| (Amp b) | 64.37 | 63.64 | 63.16 | 63.16 | 68.29 | 70.59 | 71.58 | 68.97 | 67.47 | 67.47 | 68.97 | 69.05 | 67.22 |
| (Amp a) | 62.92 | 64.44 | 62.50 | 63.16 | 72.29 | 68.97 | 70.83 | 68.18 | 67.44 | 67.44 | 68.18 | 68.97 | 67.11 |
| (Ratio ) | 54.12 | 54.76 | 53.73 | 50.70 | 67.24 | 53.01 | 35.09 | 54.35 | 69.09 | 53.66 | 32.79 | 51.28 | 52.49 |
| (Slope ) | 65.91 | 65.93 | 69.31 | 68.00 | 73.17 | 70.33 | 73.47 | 71.11 | 69.77 | 71.26 | 75.27 | 72.73 | 70.52 |


4. Limitations of the Study and Future Work
5. Conclusions
Acknowledgments
Author Contributions
Conflicts of Interest
References
- McMichael, A.; Kovats, S.; Edwards, S.; Wilkinson, P.; Wilson, T. Comparative Quantification of Health Risks: Global and Regional Burden of Disease due to Selected Major Risk Factors; Technical Report; Ezzati, M., Lopez, A., Rodgers, A., Murray, C.J.L., Eds.; World Health Organization: Geneva, Switzerland, 2004. [Google Scholar]
- Binkley, H.M.; Beckett, J.; Casa, D.J.; Kleiner, D.M.; Plummer, P.E. National Athletic Trainers’ Association position statement: Exertional heat illnesses. J. Athl. Train. 2002, 37, 329–343. [Google Scholar] [PubMed]
- Casa, D.J.; Becker, S.M.; Ganio, M.S.; Brown, C.M.; Yeargin, S.W.; Roti, M.W.; Siegler, J.; Blowers, J.A.; Glaviano, N.R.; Huggins, R.A.; et al. Validity of devices that assess body temperature during outdoor exercise in the heat. J. Athl. Train. 2007, 42, 333–342. [Google Scholar] [PubMed]
- Bruce-Low, S.S.; Cotterrell, D.; Jones, G.E. Heart rate variability during high ambient heat exposure. Aviat. Space Environ. Med. 2006, 77, 915–920. [Google Scholar] [PubMed]
- Shibasaki, M.; Wilson, T.E.; Crandall, C.G. Neural control and mechanisms of eccrine sweating during heat stress and exercise. J. Appl. Physiol. 2006, 100, 1692–1701. [Google Scholar] [CrossRef]
- Rowell, L.B.; Marx, H.J.; Bruce, R.A.; Conn, R.D.; Kusumi, F. Reductions in cardiac output, central blood volume, and stroke volume with thermal stress in normal men during exercise. J. Clin. Investig. 1966, 45, 1801–1816. [Google Scholar] [CrossRef] [PubMed]
- Elgendi, M.; Norton, I.; Brearley, M.; Abbott, D.; Schuurmans, D. Systolic peak detection in acceleration photoplethysmograms measured from emergency responders in tropical conditions. PLoS ONE 2013, 8. [Google Scholar] [CrossRef] [Green Version]
- Tamura, T.; Maeda, Y.; Sekine, M.; Yoshida, M. Wearable photoplethysmographic sensors—Past and present. Electronics 2014, 3, 282–302. [Google Scholar] [CrossRef]
- Seki, H. Classification of wave contour by first and second derivative of plethysmogram. (in Japanese). Pulse Wave 1977, 7, 42–50. [Google Scholar]
- Elgendi, M. standard terminologies for photoplethysmogram signals. Curr. Cardiol. Rev. 2012, 8, 215–219. [Google Scholar] [PubMed]
- Takazawa, K.; Fujita, M.; Kiyoshi, Y.; Sakai, T.; Kobayashi, T.; Maeda, K.; Yamashita, Y.; Hase, M.; Ibukiyama, C. Clinical usefulness of the second derivative of a plethysmogram (acceleration plethysmogram). Cardiology 1993, 23, 207–217. [Google Scholar]
- Elgendi, M. On the analysis of fingertip photoplethysmogram signals. Curr. Cardiol. Rev. 2012, 8, 14–25. [Google Scholar] [CrossRef] [PubMed]
- Imanaga, I.; Hara, H.; Koyanagi, S.; Tanaka, K. Correlation between wave components of the second derivative of plethysmogram and arterial distensibility. Jpn. Heart J. 1998, 39, 775–784. [Google Scholar] [CrossRef] [PubMed]
- Takazawa, K.; Tanaka, N.; Fujita, M.; Matsuoka, O.; Saiki, T.; Aikawa, M.; Tamura, S.; Ibukiyama, C. Assessment of vasoactive agents and vascular aging by the second derivative of photoplethysmogram waveform. Hypertension 1998, 32, 365–370. [Google Scholar] [CrossRef] [PubMed]
- Taniguchi, K.; Nishikawa, A.; Nakagoe, H.; Sugino, T.; Sekimoto, M.; Okada, K.; Takiguchi, S.; Monden, M.; Miyazaki, F. Evaluating the surgeon’s stress when using surgical assistant robots. In Proceedings of the 16th IEEE International Symposium on Robot and Human interactive Communication (RO-MAN 2007), Jeju Island, Korea, 26–29 August 2007; pp. 888–893.
- Elgendi, M.; Jonkman, M.; de Boer, F. Measurement of a-a intervals at rest in the second derivative plethysmogram. In Proceedings of the IEEE 2009 International Symposium on Bioelectronics and Bioinformatics, RMIT University, Melbourne, Australia, 9–11 December 2009; pp. 75–79.
- Elgendi, M.; Jonkman, M.; de Boer, F. Applying the APG to measure heart rate variability. In Proceedings of the 2nd International Conference on Computer and Automation Engineering, Singapore, 26–28 February 2010; pp. 100–104.
- Elgendi, M.; Jonkman, M.; de Boer, F. Heart rate variability measurement using the second derivative photoplethysmogram. In Proceedings of the 3rd International Conference on Bio-inspired Systems and Signal Processing (BIOSIGNALS2010), Valencia, Spain, 20–23 January 2010; pp. 82–87.
- Elgendi, M.; Jonkman, M.; de Boer, F. Heart rate variability and acceleration plethysmogram measured at rest. In Biomedical Engineering Systems and Technologies; Communications in Computer and Information Science; Fred, A., Filipe, J., Gamboa, H., Eds.; Springer: Berlin, Germany, 2011; pp. 266–277. [Google Scholar]
- Matsuyama, A. ECG and APG Signal Analysis during Exercise in a Hot Environment. Ph.D. Thesis, Charles Darwin University, Darwin, Australia, 2009. [Google Scholar]
- Elgendi, M. Detection of c, d, and e waves in the acceleration photoplethysmogram. Comput. Methods Programs Biomed. 2014, 117, 125–136. [Google Scholar] [CrossRef] [PubMed]
- Elgendi, M.; Norton, I.; Brearley, M.; Abbott, D.; Schuurmans, D. Detection of a and b waves in the acceleration photoplethysmogram. BioMed. Eng. Online 2014, 13. [Google Scholar] [CrossRef]
- Brearley, M.B.; Heaney, M.F.; Norton, I.N. Physiological responses of medical team members to a simulated emergency in tropical field conditions. Prehosp. Disaster Med. 2013, 28, 139–144. [Google Scholar] [CrossRef] [PubMed]
- Bonferroni, C. Teoria statistica delle classi e calcolo delle probabilità. Pubbl. Ist. Super. Sci. Econ. Commer. Firenze 1936, 8, 3–62. [Google Scholar]
- Holm, S. A simple sequentially rejective multiple test procedure. Scand. J. Stat. 1979, 6, 65–70. [Google Scholar]
- Chen, C.; Liaw, A.; Breiman, L. Using Random Forest to Learn Imbalanced Data; Technical Report; University of California: Berkeley, CA, USA, 2004. [Google Scholar]
- O’Brien, C.; Hoyt, R.W.; Buller, M.J.; Castellani, J.W.; Young, A.J. Telemetry pill measurement of core temperature in humans during active heating and cooling. Med. Sci. Sports Exerc. 1998, 30, 468–472. [Google Scholar] [CrossRef] [PubMed]
- Casa, D.J.; Becker, S.M.; Ganio, M.S.; Brown, C.M.; Yeargin, S.W.; Roti, M.W.; Siegler, J.; Blowers, J.A.; laviano, N.R.; Huggins, R.A.; et al. Validity of devices that assess body temperature during outdoor exercise in the heat. J. Athl. Train. 2007, 42, 333–342. [Google Scholar] [PubMed]
© 2015 by the authors; licensee MDPI, Basel, Switzerland. This article is an open access article distributed under the terms and conditions of the Creative Commons Attribution license (http://creativecommons.org/licenses/by/4.0/).
Share and Cite
Elgendi, M.; Fletcher, R.; Norton, I.; Brearley, M.; Abbott, D.; Lovell, N.H.; Schuurmans, D. On Time Domain Analysis of Photoplethysmogram Signals for Monitoring Heat Stress. Sensors 2015, 15, 24716-24734. https://doi.org/10.3390/s151024716
Elgendi M, Fletcher R, Norton I, Brearley M, Abbott D, Lovell NH, Schuurmans D. On Time Domain Analysis of Photoplethysmogram Signals for Monitoring Heat Stress. Sensors. 2015; 15(10):24716-24734. https://doi.org/10.3390/s151024716
Chicago/Turabian StyleElgendi, Mohamed, Rich Fletcher, Ian Norton, Matt Brearley, Derek Abbott, Nigel H. Lovell, and Dale Schuurmans. 2015. "On Time Domain Analysis of Photoplethysmogram Signals for Monitoring Heat Stress" Sensors 15, no. 10: 24716-24734. https://doi.org/10.3390/s151024716