Fabrication of a SnO2-Based Acetone Gas Sensor Enhanced by Molecular Imprinting

Abstract
: This work presents a new route to design a highly sensitive SnO2–based sensor for acetone gas enhanced by the molecular imprinting technique. Unassisted and acetone-assisted thermal synthesis methods are used to synthesis SnO2 nanomaterials. The prepared SnO2 nanomaterials have been characterized by X-ray powder diffraction, scanning electron microscopy and N2 adsorption−desorption. Four types of SnO2 films were obtained by mixing pure deionized water and liquid acetone with the two types of as-prepared powders, respectively. The acetone gas sensing properties of sensors coated by these films were evaluated. Testing results reveal that the sensor coated by the film fabricated by mixing liquid acetone with the SnO2 nanomaterial synthesized by the acetone-assisted thermal method exhibits the best acetone gas sensing performance. The sensor is optimized for the smooth adsorption and desorption of acetone gas thanks to the participation of acetone both in the procedure of synthesis of the SnO2 nanomaterial and the device fabrication, which results in a distinct response–recovery behavior.1. Introduction
Metal oxides have attracted the attention of many users and scientists interested in gas sensing under atmospheric conditions [1,2]. As an n-type semiconductor with a stable wide-band gap, SnO2 has received considerable attention in many application areas, such as gas sensors [3,4], solar cells [5], and lithium-ion batteries [6–8]. Nanostructured SnO2 films and electrospun granular hollow SnO2 nanofibers exhibit good sensitivity to hydrogen [9,10] at low temperatures. Wide investigation shows that nanostructures of SnO2 show high sensitivity to acetone gas, with short response times and fast recovery speeds [11–13]. Many methods have been focused on the synthesis of SnO2 nanostructure materials with different morphologies to improve the sensor performance. However, the method of producing the sensing film can change the porosity of the SnO2 nanomaterials, which influences the performance of sensors [14].
Molecular imprinting technology is considered to have considerable potential for use in recognition in various sensor applications [15–17]. Template molecules connect functional monomers and then these monomer-template adducts are polymerized. After the removal of the template from the polymer, the complementary binding sites are capable of template molecule recognition [18–20].
Herein, we designed highly sensitive SnO2-based acetone gas sensors enhanced by molecular imprinting technology. Acetone solutions were introduced during the synthesis of nanomaterials or/and device fabrication to produce appropriate structures which are more suitable for the adsorption and desorption of acetone gas. The as-synthesized SnO2 sensors were exposed to acetone gas with various concentrations ranging from 50 ppb to 100 ppm. The sensor produced by incorporating acetone both during the nanomaterial synthesis and device fabrication exhibits the best performance in terms of high sensitivity, fast response recovery and excellent repeatability.
2. Experimental Section
2.1. Synthesis of SnO2 Nanomaterials
2.1.1. Synthesis of Unassisted SnO2 Nanomaterial W
Tin (II) chloride (SnCl2•2H2O, 1.5 g) was dissolved in 70 mL of water. Next 0.5 mL of hydrochloric acid (38%) was dropped into the mixture. The mixture was stirred for about 2 h at room temperature. The mixture solution was transferred into Teflon-lined stainless steel autoclaves, sealed tightly, heated and maintained at 90 °C for 20 h. The product was centrifuged, washed with water, and dried at 60 °C. Finally, SnO2 nanomaterial was obtained by annealing the product at 350 °C for 2 h.
2.1.2. Synthesis of Acetone-Assisted SnO2 Nanomaterial A
Tin (II) chloride (SnCl2•2H2O, 1.5 g), 0.5 mL of hydrochloric acid (38%) and 10 mL acetone were dissolved in 60 mL of water. Then, the mixture was stirred for about 2 h at room temperature. After that, the mixture solution was transferred into Teflon-lined stainless steel autoclaves, sealed tightly, heated and maintained at 90 °C for 20 h. The product was centrifuged, washed with water, and dried at 60 °C. Finally, SnO2 nanomaterial was obtained by annealing the product at 350 °C for 2 h.
2.2. Device Fabrication
The as-prepared SnO2 powder was mixed with water/acetone to form a paste, then the paste was coated onto a ceramic tube (axial length 4 mm and basal diameter 1.5 mm) to form a thick film which has the thickness of about 100 μm. The ceramic tube was equipped with two pairs of Au electrodes and a Ni–Cr heater through the tube to control the experimental temperature. Table 1 shows that the four-type samples of films (WW, WA, AW and AA) were fabricated by mixing different as-prepared SnO2 nanomaterials with water/acetone. For example, AA was acquired by mixing SnO2 powder A with acetone and the gas sensor SAA was fabricated by coating AA onto a ceramic tube.
2.3. Characterization and Measurement of Gas-Sensing Properties
The products were characterized by scanning electron microscopy (SEM, JSM-6700F; 5 kV, JEOL, Tokyo, Japan). X-ray power diffraction (XRD, D8 Avance, Brucker, Karlsruhe, Germany, λ = 1.5418) analysis was conducted to characterize the products in the range of 20°–80°. The porous structure has been further confirmed by the Nitrogen adsorption–desorption analysis (Belsorp Mini, Ankersmid, The Netherland). 17O-NMR (Nuclear Magnetic Resonance) was introduced to analysis the mechanism (AVANCE III 600, Bruker, Karlsuhe, Germany)
A calculated amount of acetone gas is introduced into a 10 L chamber by a syringe. A fan was fixed in the chamber to homogenize the acetone gas. The gas sensing properties were detected by a computer-controlled Navigation 4000-NMDOG gas-sensing measurement system (Zhongke nano IOT, Beijing, China). The gas response of the sensor was defined as Ra/Rg, where Ra and Rg are the resistance of gas sensors in air and acetone gas, respectively.
3. Results and Discussion
3.1. Structures of W/A and Films
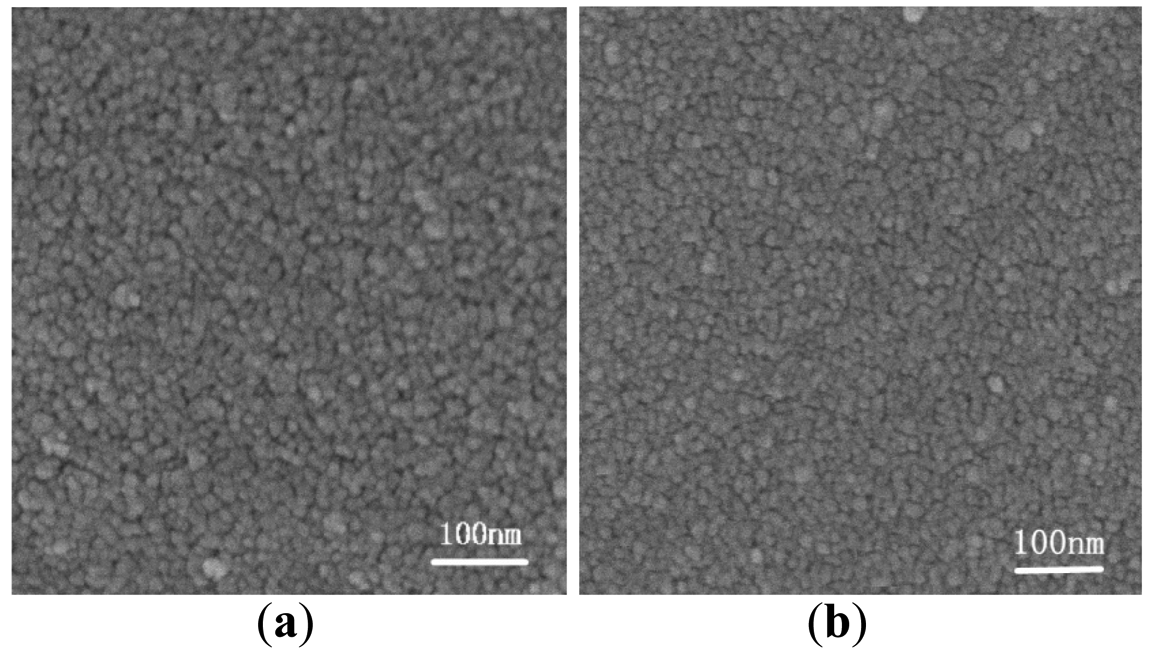
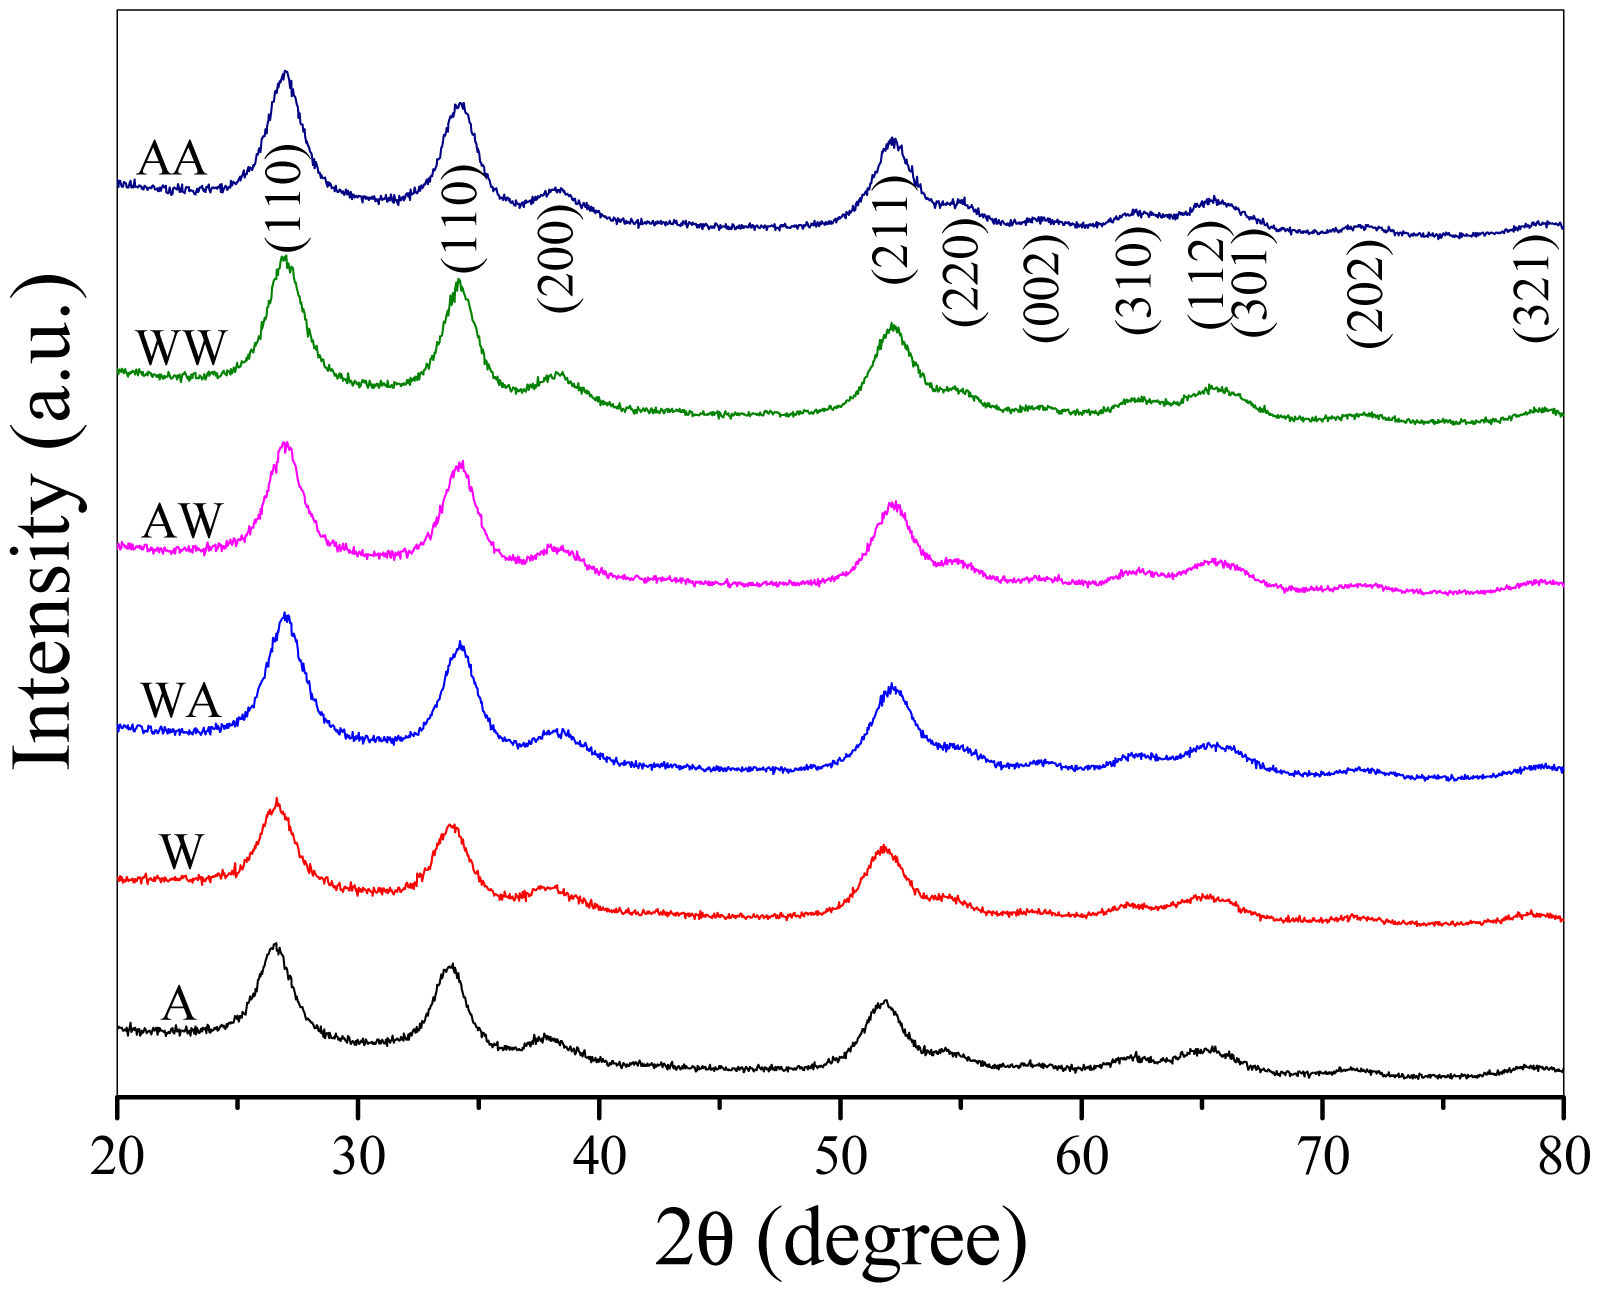
The as-prepared SnO2 nonamaterials and the four-type films were examined by XRD. Figure 1 shows all the distinguishable peaks were well indexed to the tetragonal rutile structure of cassiterite SnO2 (JCPDS file No. 41-1445) [21]. There were no characteristic peaks of any other impurities. Figure 2 shows the uniform particle size of W and A. It can be found that A is characterized by more elaborate particle structure.
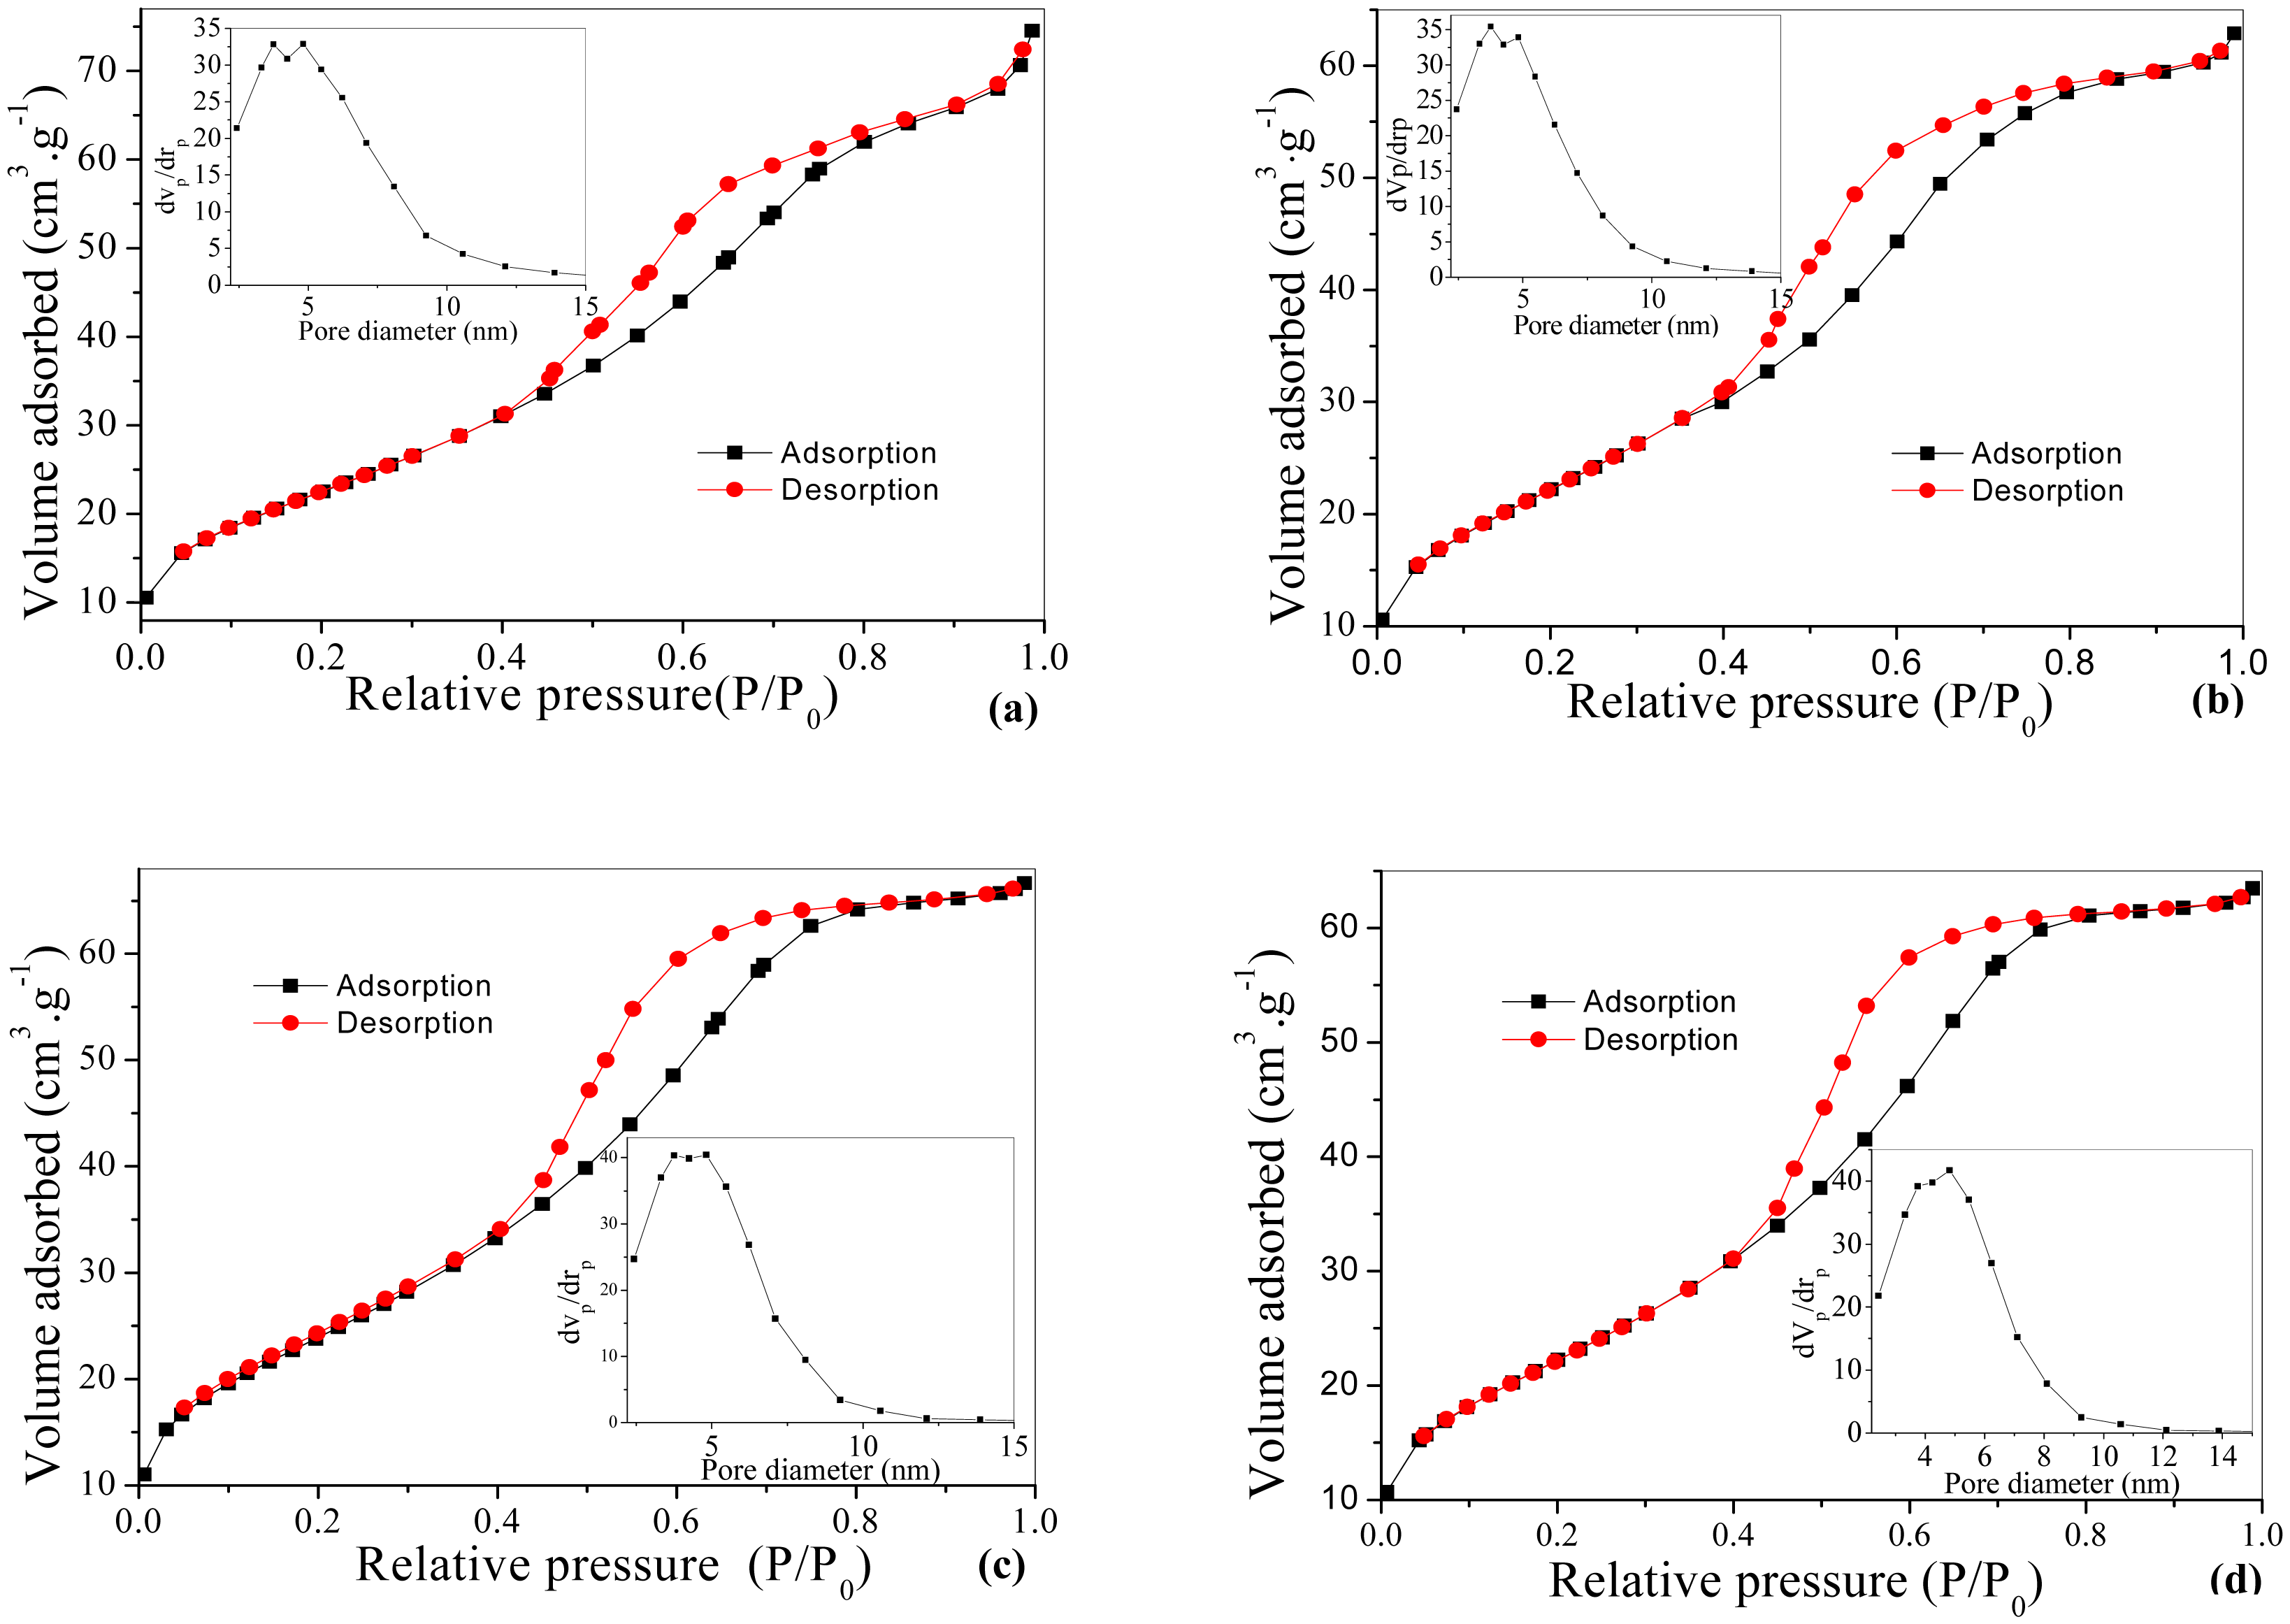
The porosities of nanoparticles are distinctly confirmed by N2 adsorption–desorption analysis [22]. Figure 3a,b show that W and A have the adsorption-desorption isotherm shape of IV with the type H1 hysteresis loop, which is usually attributed to the thermodynamic or/and network effects. Figure 3c,d show that the productions of pastes WW and AA exhibit pure type IV and the hysteresis loops transform form H1 to H2. The presence of the hysteresis loops is indicative of the pores in a 3D intersection network [23,24]. Insets of Figure 3a,b show the Barrett-Joyner-Halenda (BJH) pore size distributions of as-prepared materials W and A with the average pore size of about 5.53 and 4.68 nm (see Table 2) respectively. Table 1 lists the average pore size of WW, WA, AW and AA about 4.61, 4.33, 4.79 and 4.72 nm. We see that the change of hysteresis loops, pore size distributions and Brunauer-Emmett-Teller surface areas (see Tables 1 and 2) means the procedure of device fabrication has effect on the structure of as-prepared materials, which result in the change of sensing performance of sensors.
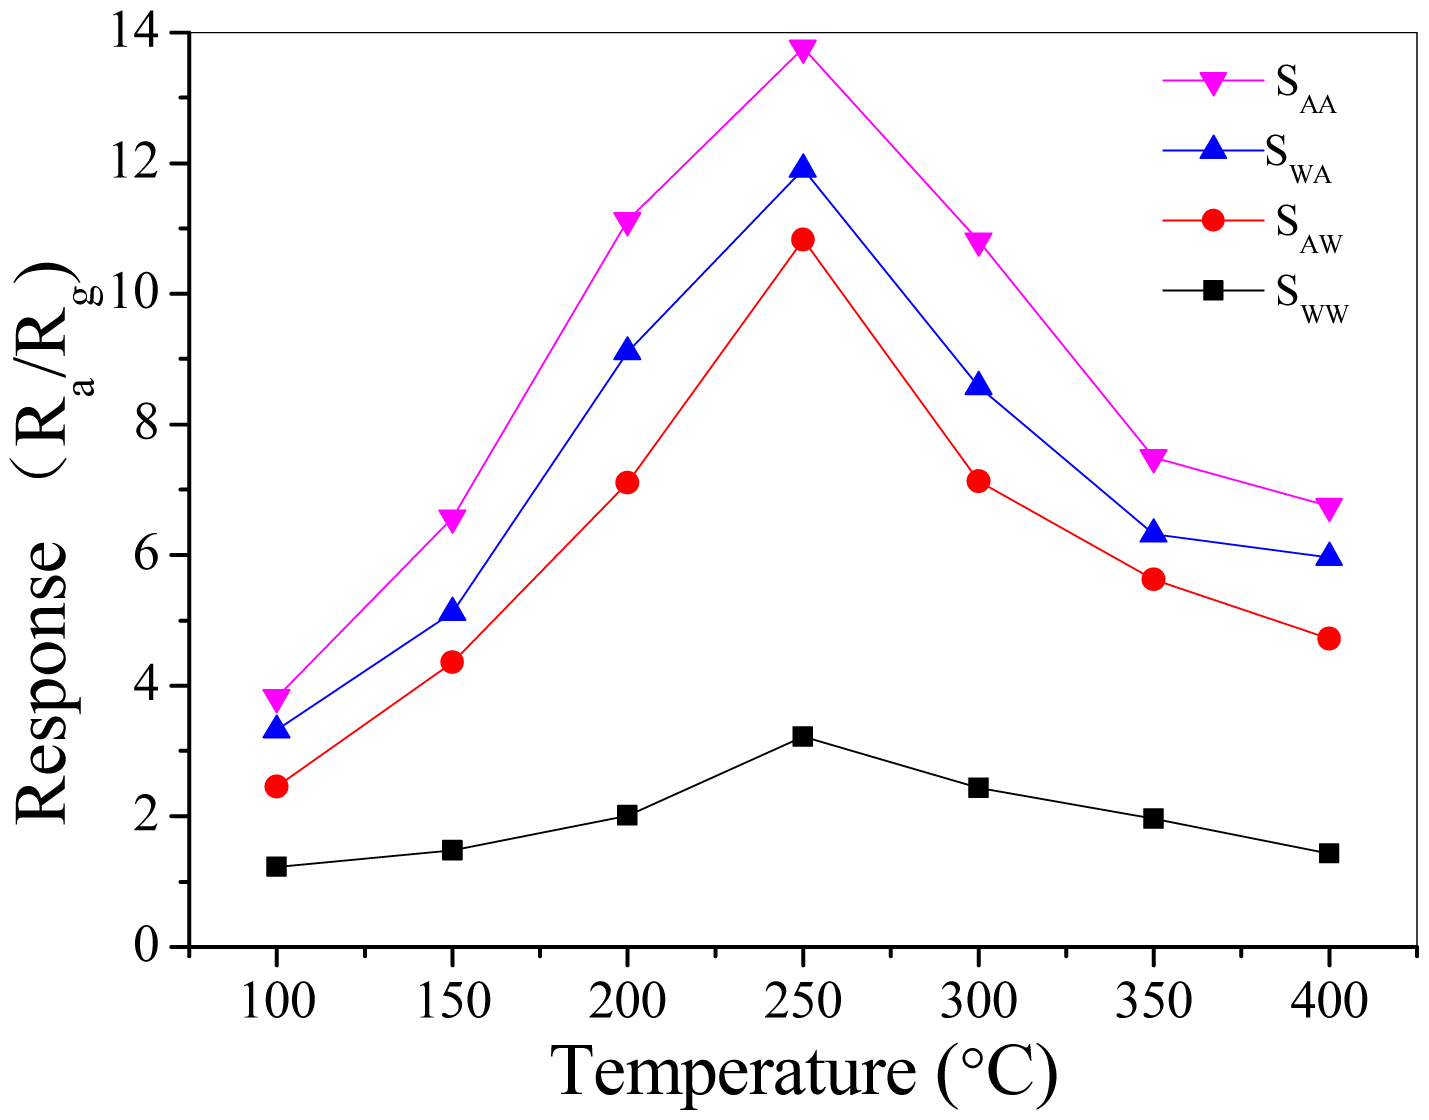
The response measurements to 50 ppm acetone gas for the different sensors were performed from 100 °C to 400 °C. Figure 4 shows all the gas sensors possess the best response performance at the operating temperature of 250 °C. Thus, 250 °C is chosen as the optimized operating temperature for acetone gas sensing study [25,26].
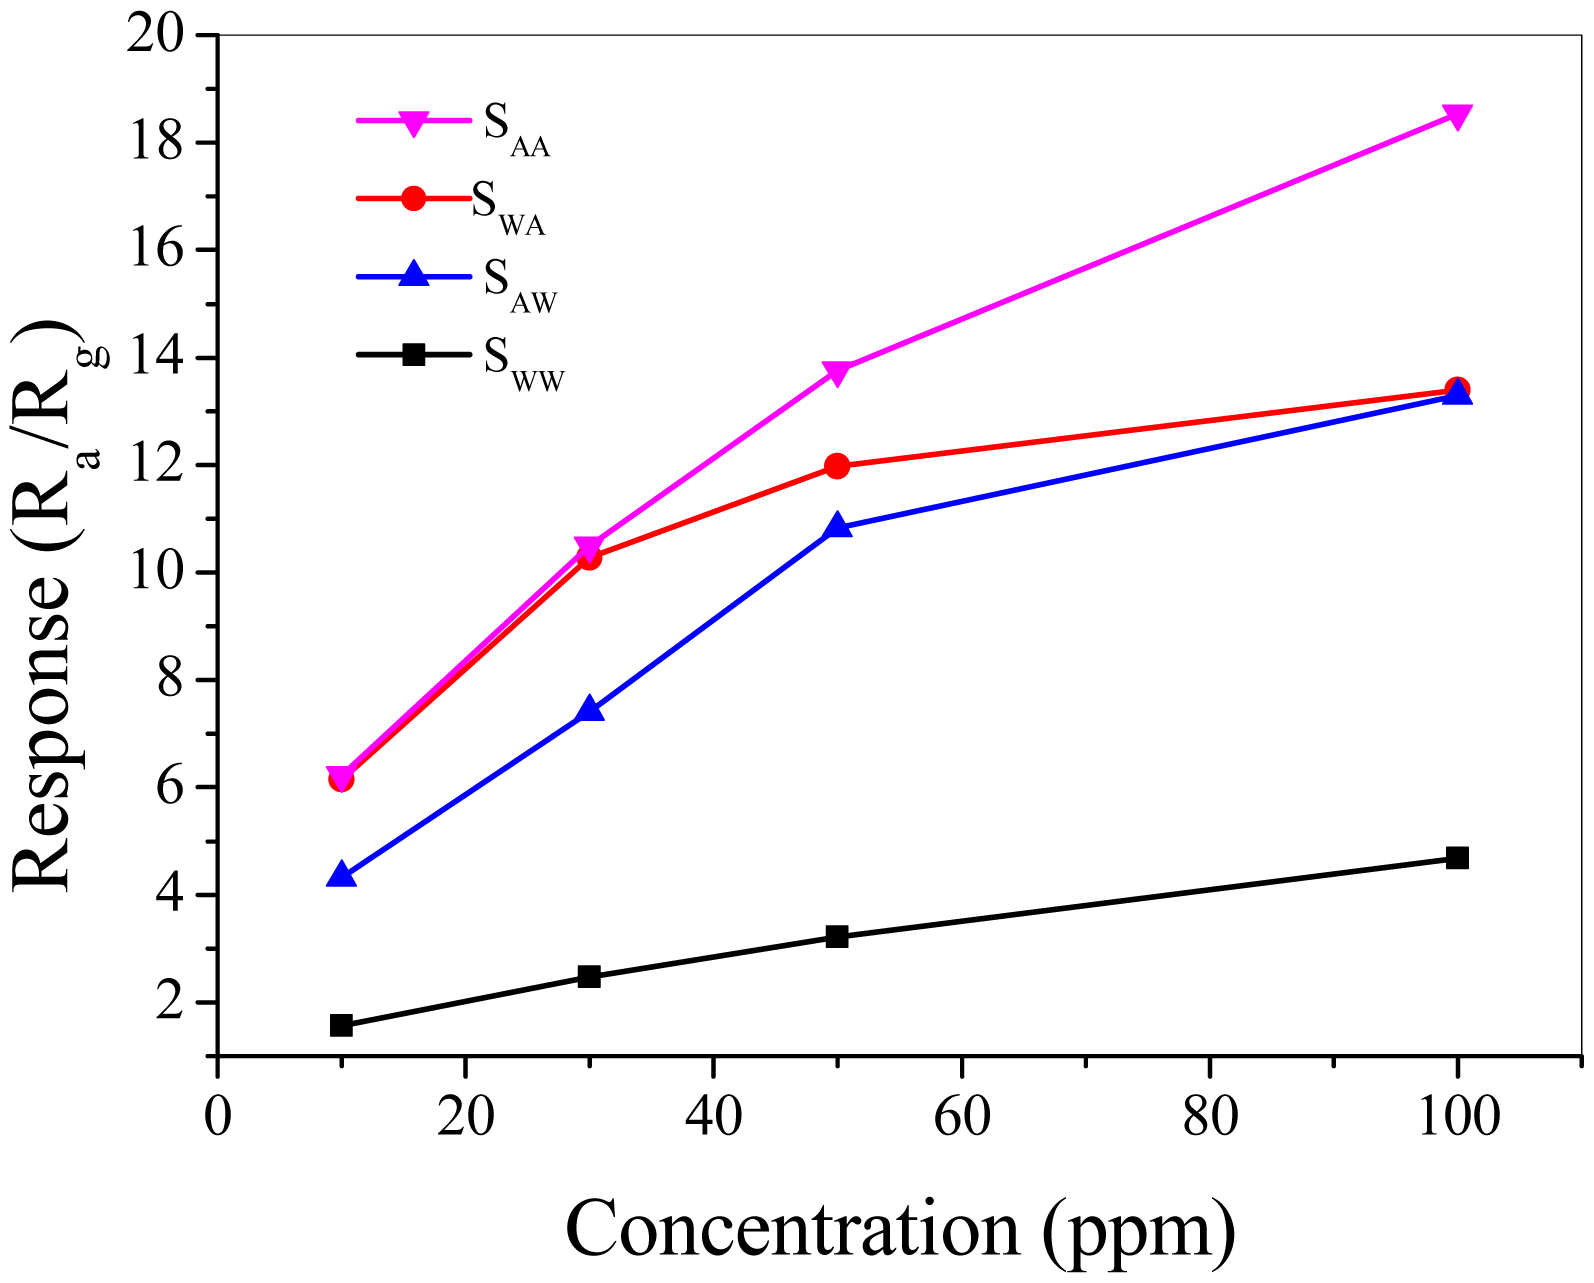
From Figure 5 we see that the response of sensors increased with the increase of the acetone concentration at 250 °C. The response descended in the order of SAA, SWA, SAW and SWW. The response of sensor SAA was about 18.5 to 100 ppm acetone. When the concentration of acetone was low, SAA and SWA exhibit higher response compared with SAW and SWW. When the acetone concentrations reach higher levels, the response of SWA is close to that of SAW. The response of SWW, SAW and SWA gradually tended to saturation compared with SAA with the increase of acetone concentrations.
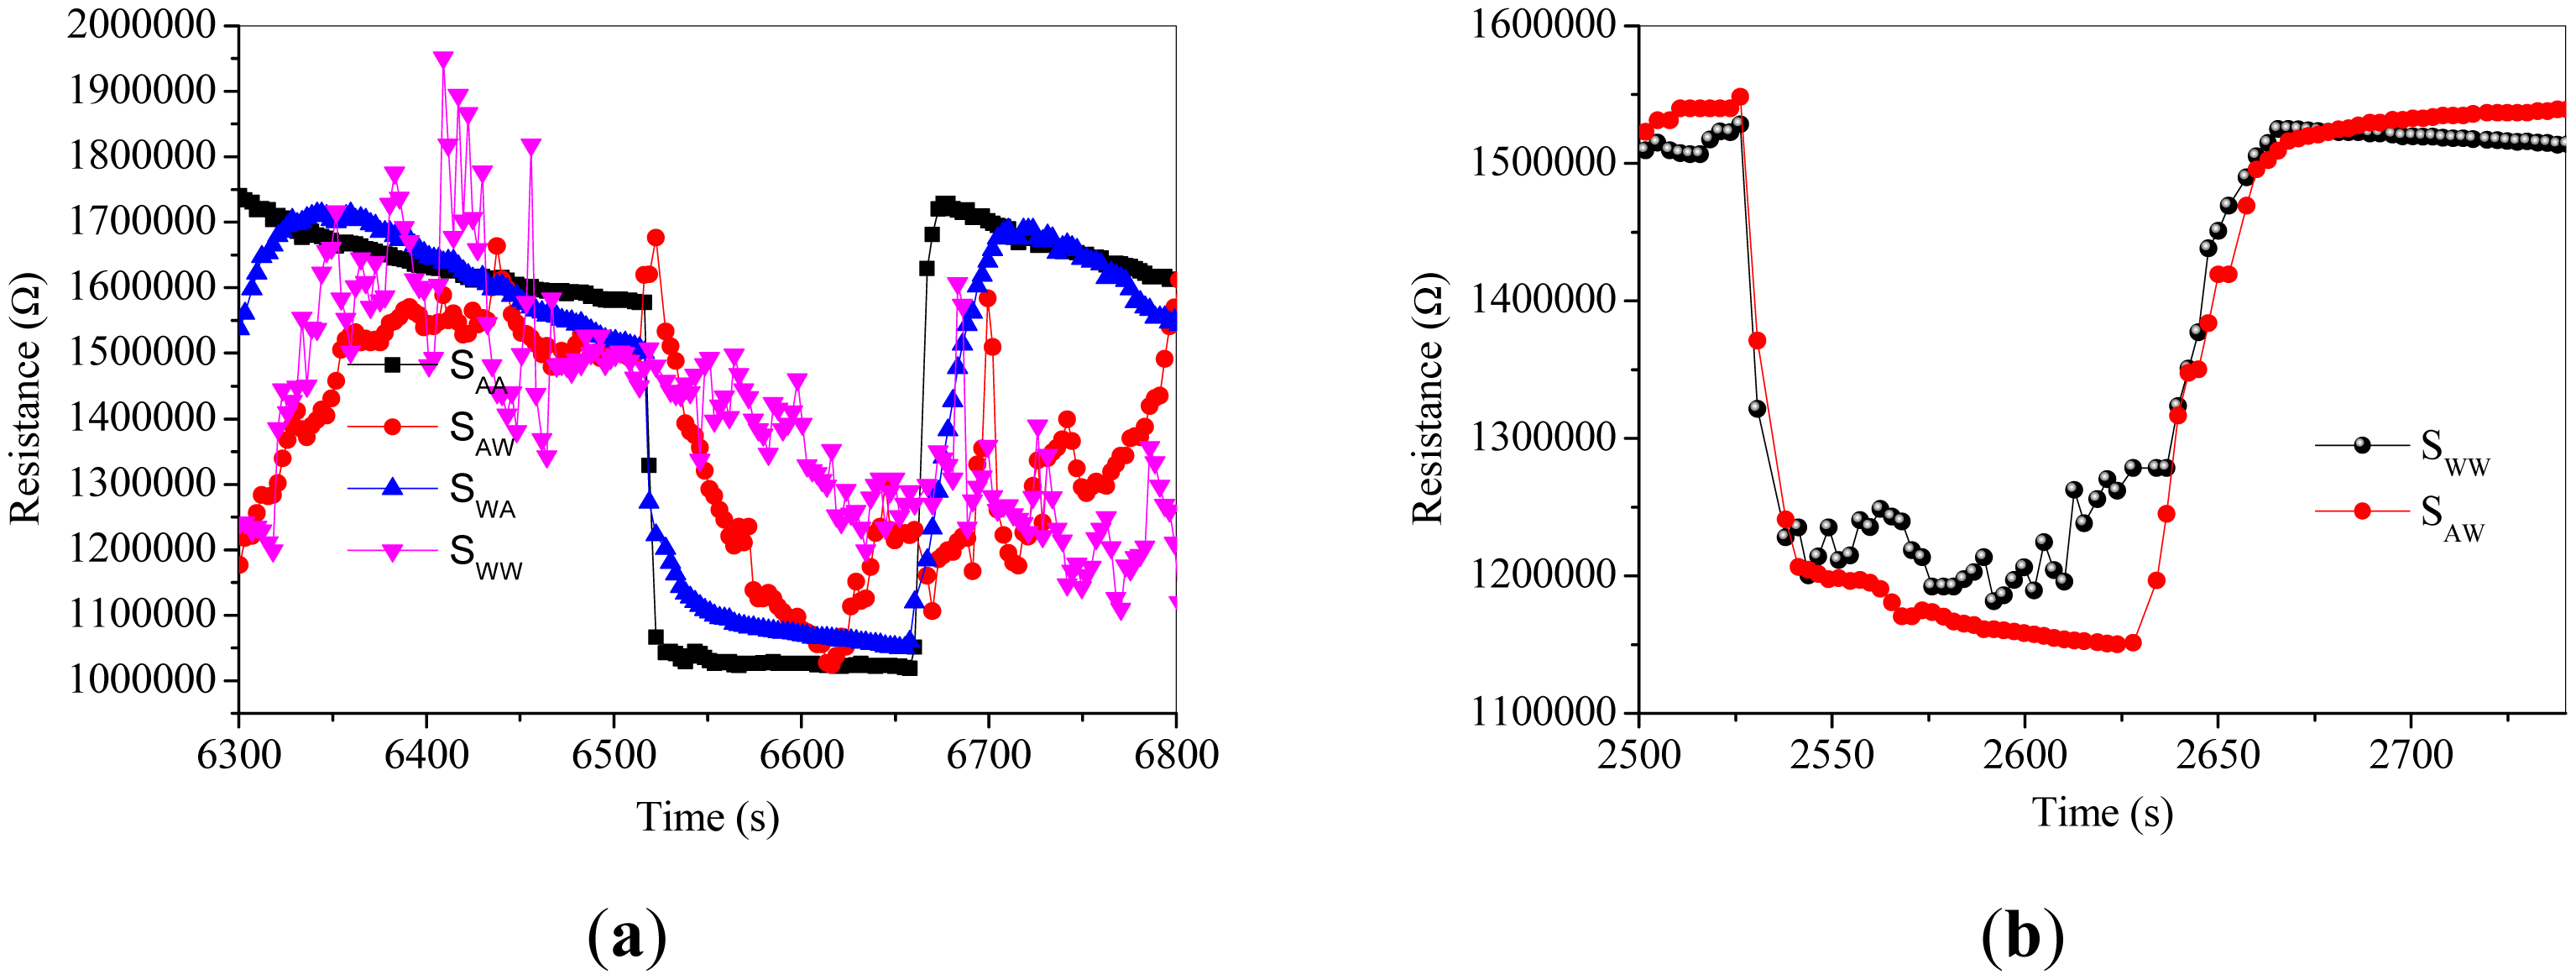
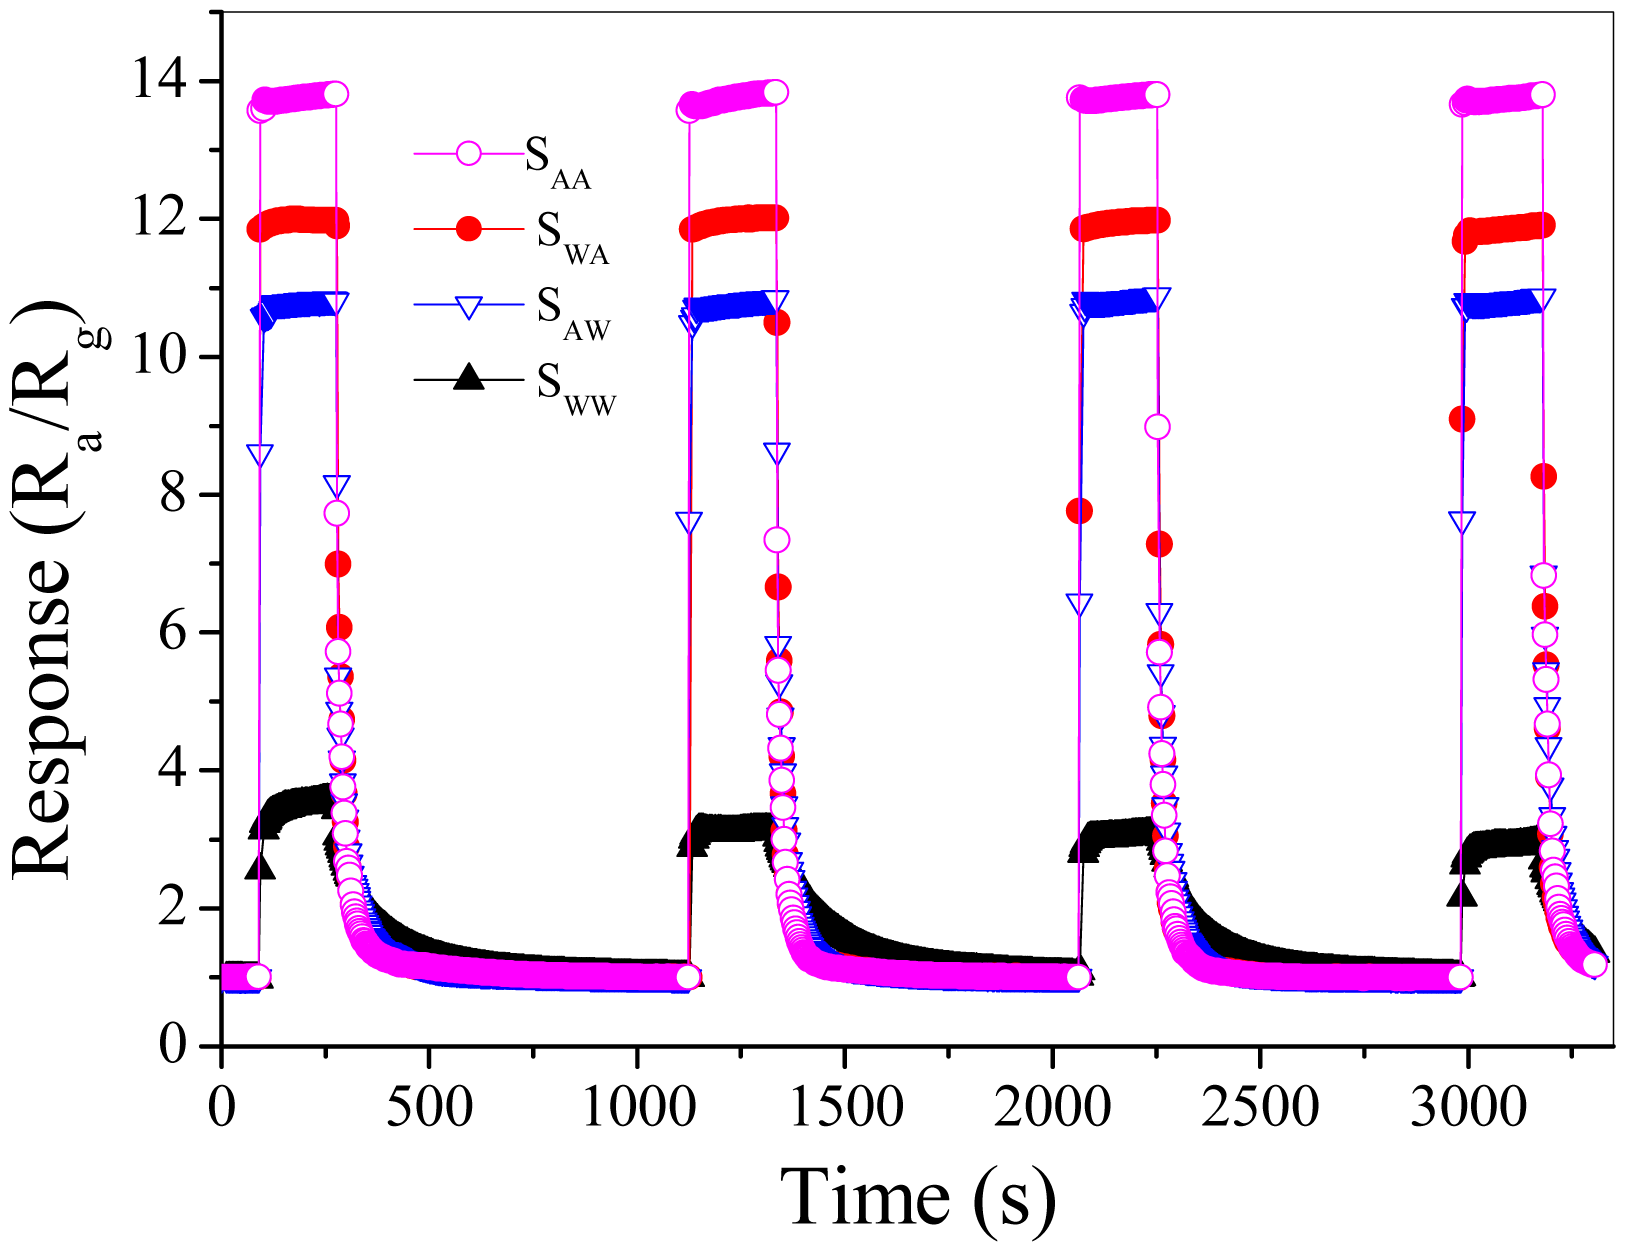
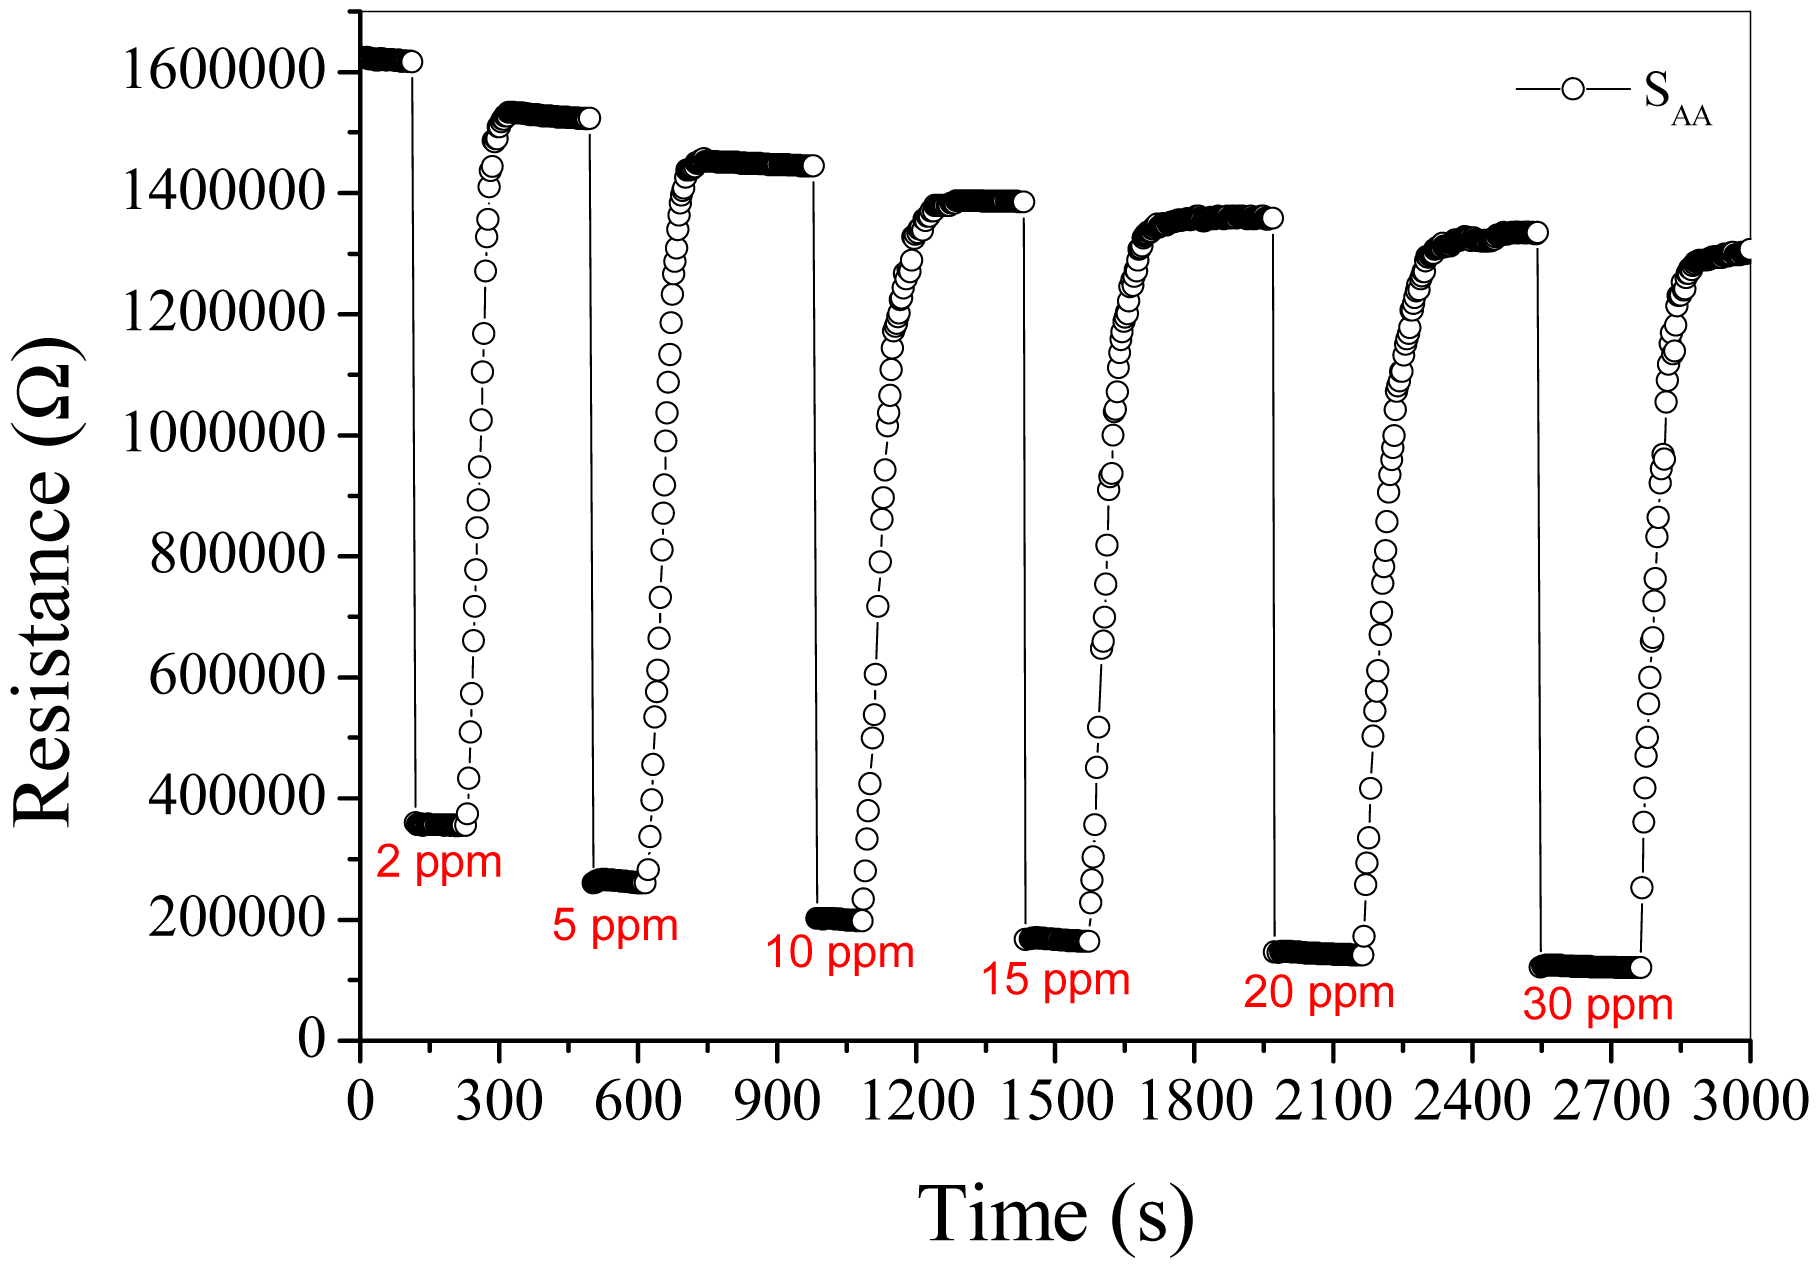
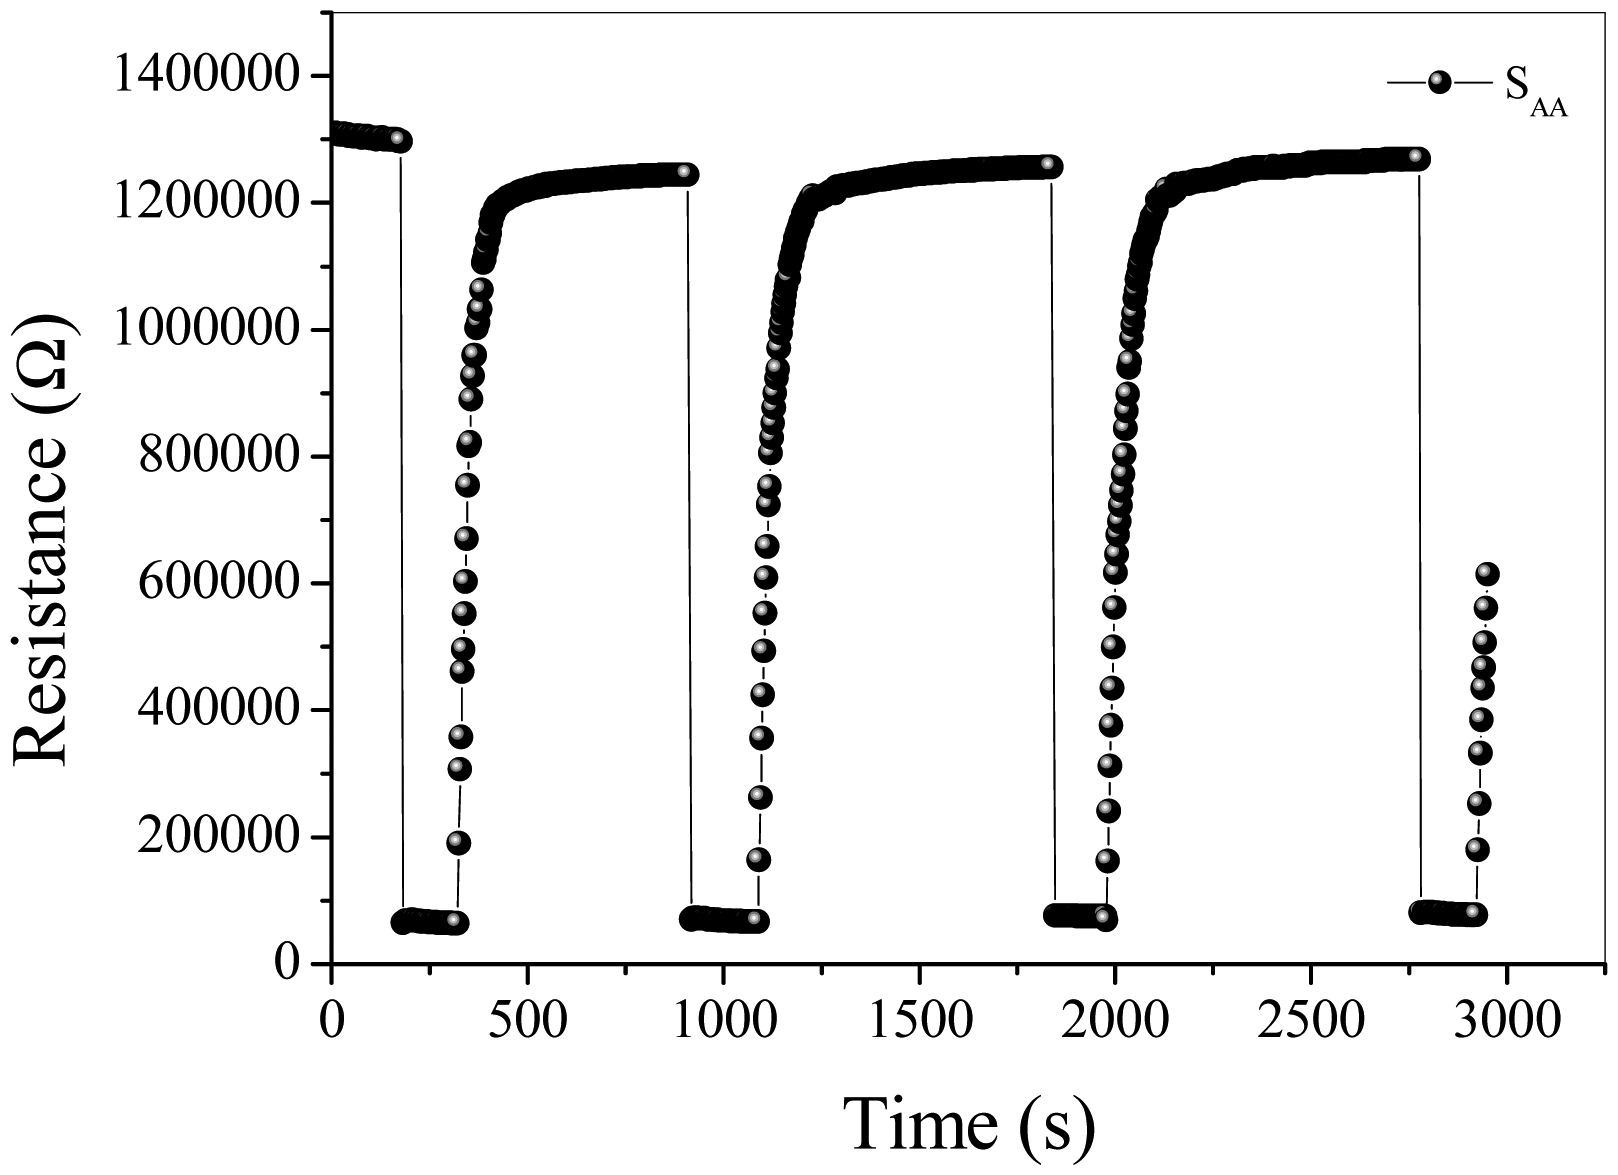
Figure 6 shows the dynamic response of sensors to 50 ppm acetone at the operating temperature of 250 °C. It is obvious that the response of SAA, SWA, SAW and SWW to 50 ppm acetone is about 13.8, 11.9, 10.8 and 3.2, respectively, and the response/recovery speed descends in the order of SAA, SWA, SAW and SWW. Figure 7 shows the baseline drift [14,27,28] when SAA is orderly exposed to different low concentrations of acetone at 250 °C. It should be noticed that Ra of SAA does not decrease sharply when the acetone concentrations are above 15 ppm. As shown in Figure 8, the reversible cycles of the response and recovery curve for SAA indicate the stable and repeatable characteristic when the surrounding environment is cycled between clean air and 100 ppm acetone. Figures 7 and 8 tell us that the baseline drift is merely relevant to gas concentrations. Figure 9 shows different sensing behaviors of the four-type sensors to low concentrations of acetone gas. Figure 9a shows the detection limits [29,30] of SAA and SWA are is low as 50 ppb and from Figure 9b we can see that SAW and SWW have detection limits of about 300 ppb.
Table 3 shows the response time of SWW, SAW, SWA and SAA about 9.2–22.1 s, 8.2–17.3 s, 7.1–13.8 s and 4.3–6.7 s (defined as the time needed to reach 90% of total signal change) at various acetone gas concentrations, respectively. It is obviously recovery times descend in order of SWW, SAW, SWA and SAA.
3.2. Analysis of Gas Sensing Mechanism
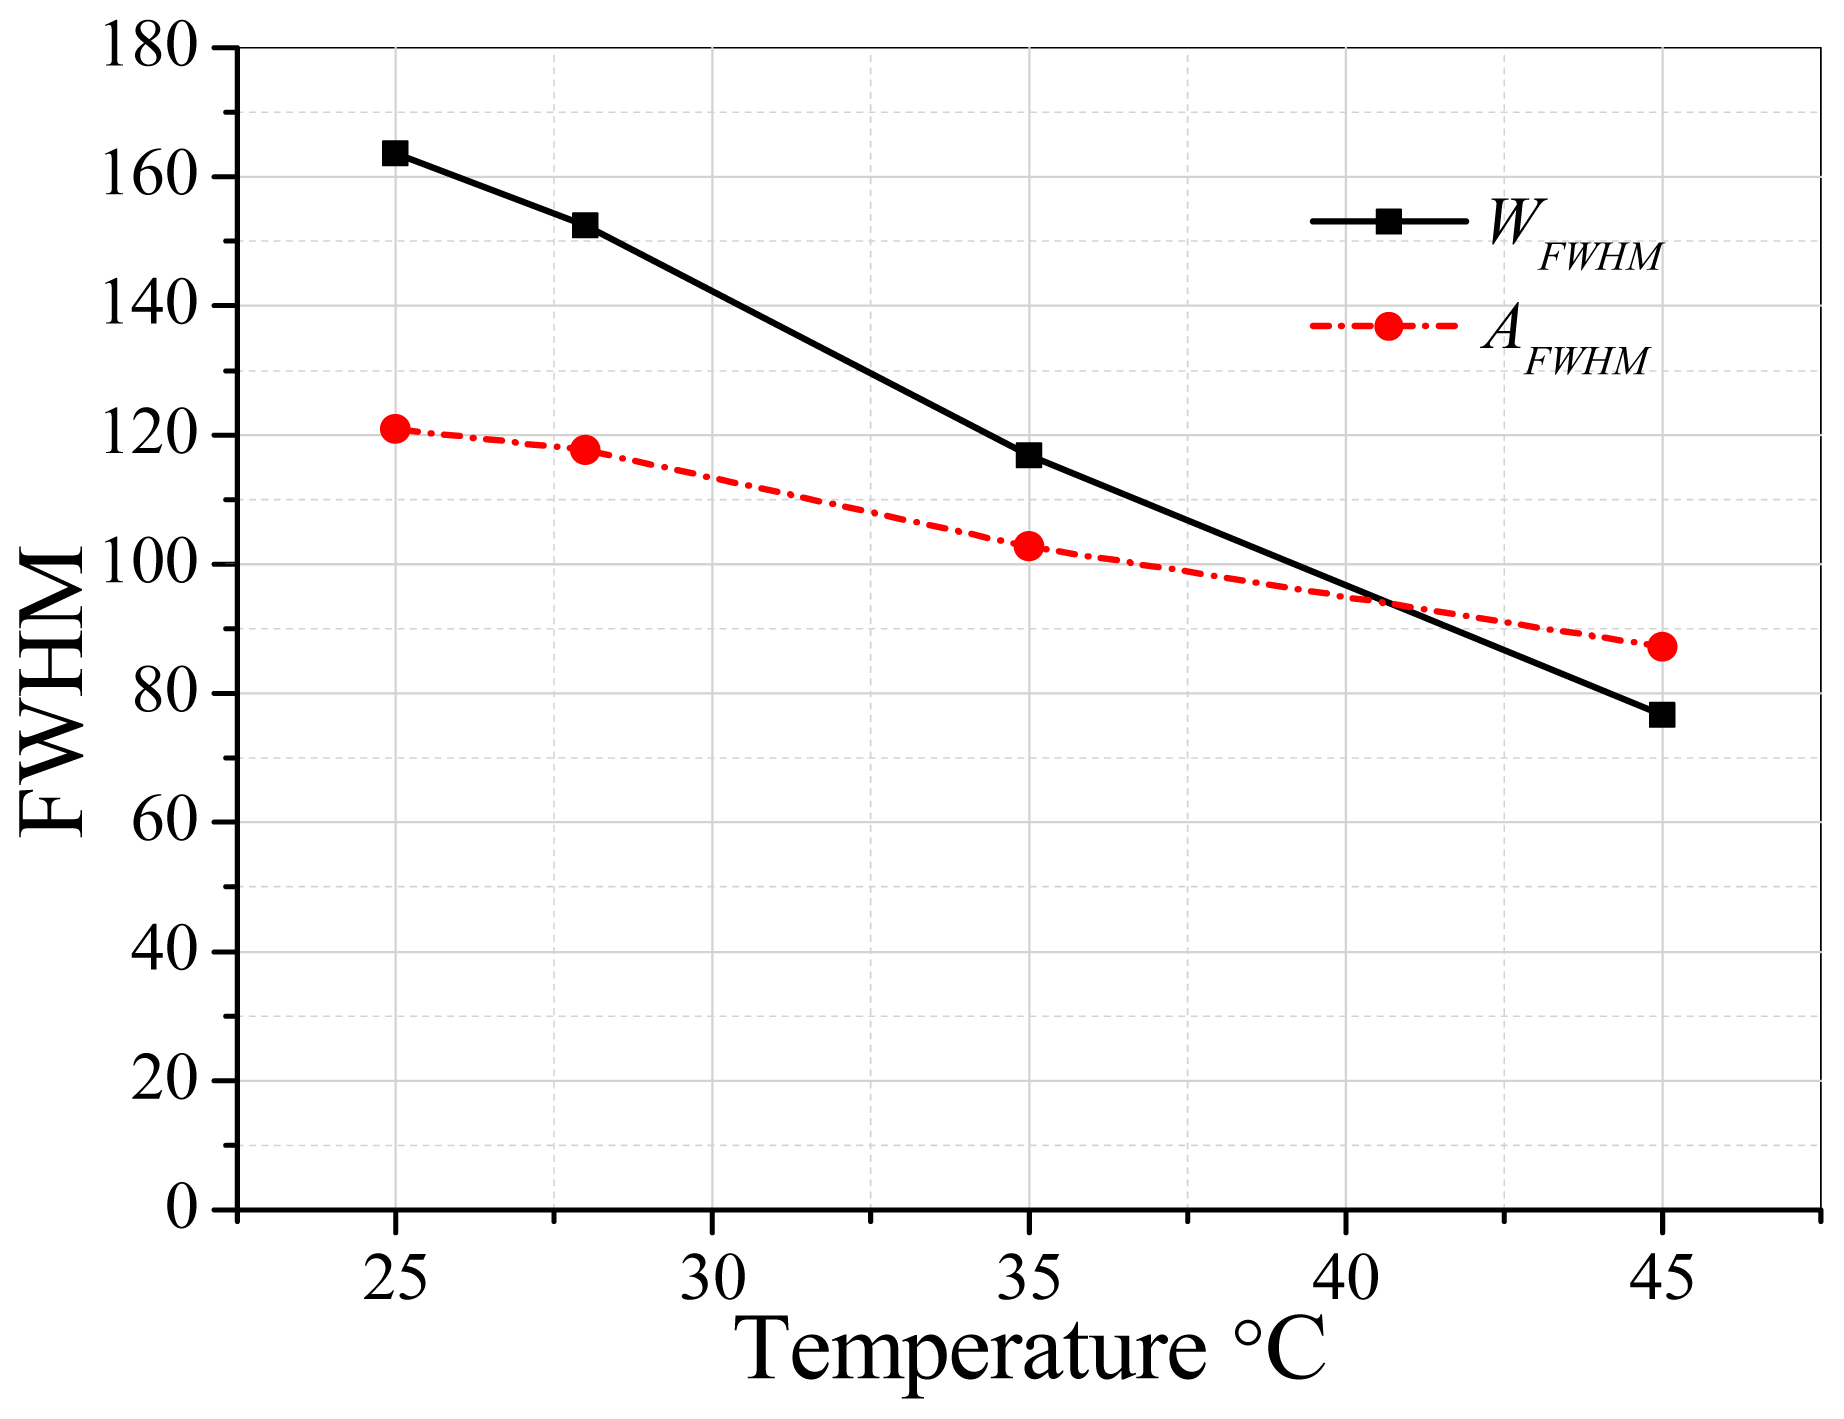
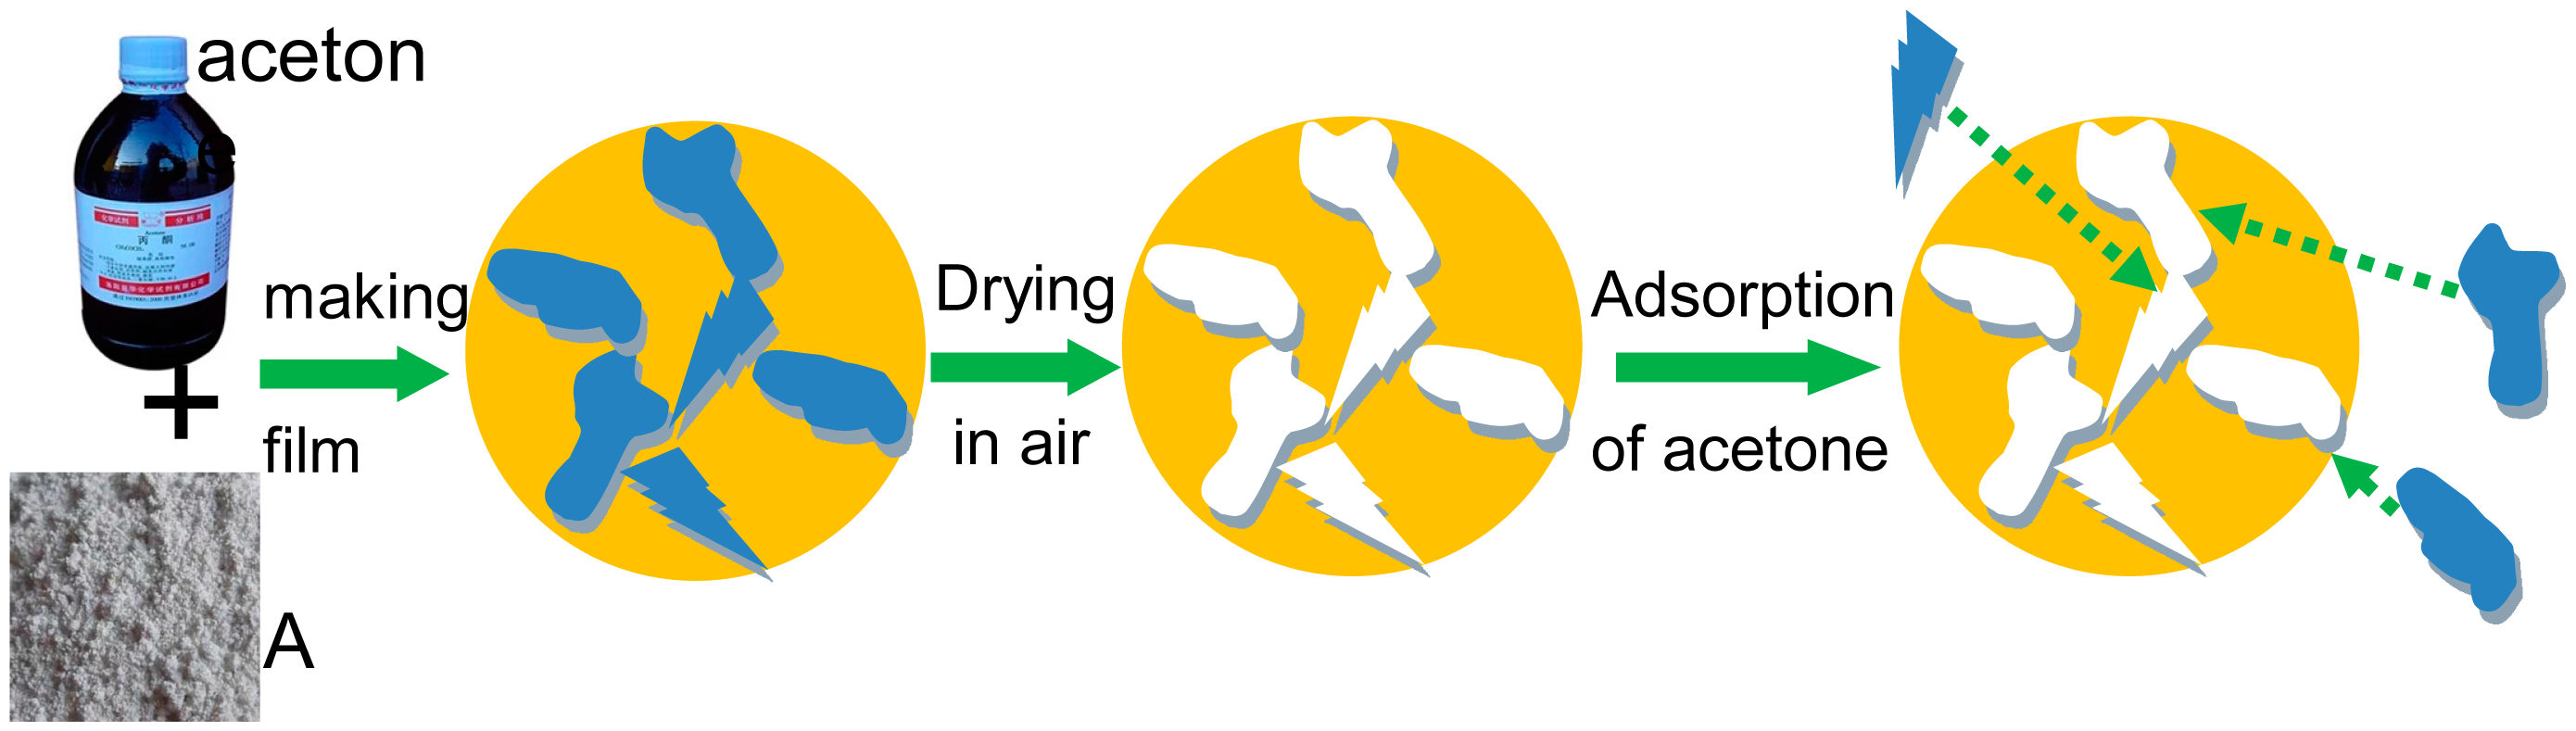
SAA displaying good gas-sensing performance can be due to two possible mechanisms. First, the liquid of target gas (acetone) is introduced during the procedure of SnO2 nanomaterial synthesis to optimize the structure of SnO2 nanomaterial for the smooth adsorption and desorption of acetone gas. We noticed that SAW exhibits a higher response compared with SWW and SAA has excellent performance in contrast to SAW, which means that acetone-assisted nanomaterial A has an excellent structure for acetone gas sensing in contrast to W. Table 1 shows that the nanomaterial A has the average pore size of about 4.68 nm which is lower than that of W (about 5.53 nm), which may be the key factor for improving the sensors' performance. The relatively low BJH of A can be due to the small acetone clusters [31] in contrast to water clusters [32,33]. Water has more chance to be in larger size clusters thanks to its abundant hydrogen bonds. Figure 10 shows the 17O-NMR spectra [34] of water and acetone at 25, 35 and 45 °C based on a Bruker AVANCE III 600 instrument. Figure 11 shows that the 17O-NMR spectroscopy full width at half maximum intensity (FWHM) of water almost has a linear decrease trend and it reduces much faster than that of acetone with the rise of temperature. It further confirms that water has abundant hydrogen bonds, which can result in large sized clusters of water in contrast to acetone. For the second possible mechanisms, the method of device fabrication plays very import role in enhancing the response of gas sensors. The representative schematic mechanism for the device fabrication can be illustrated as in Figure 12. Acetone-assisted SnO2 is mixed with acetone solution to form a paste, and then this is coated onto a tube to form a film where acetone clusters can interact with SnO2. After drying in air, the acetone-assisted SnO2 nanomaterial is imprinted by acetone clusters. The memorized structure is suitable for the adsorption and rapid diffusion of acetone clusters when SAA was exposed to acetone gas and clear air alternatively during the tests to finally improve the sensing capability.
4. Conclusions
In conclusion, we have developed a novel method for designing highly sensitive acetone gas sensors enhanced by molecular imprinting. In this work, we not only have focused on the synthesis of SnO2 nanomaterials, but also emphasized the device fabrication method. Thanks to the introduction of acetone both in the synthesis and device fabrication phases, the sensor SAA exhibits the best sensitivity with the highest response and fastest response/recovery speed. Compared with SAW and SWW, the sensing performance of SAA and SWA exhibited improved responses to acetone. It reveals that the procedure of device fabrication plays an essential role in the design of sensors. Our design method proved to be a new route to devise ultra-sensitive acetone sensors, which may be instructive for the design of special high sensitivity gas sensors.
Acknowledgments
This work is financially supported by self-determined research funds of CCNU from the Colleges' Basic Research and Operation of MOE (No. CCNU14A05045), the National Natural Science Foundation of China (No. 51172085) and “863” National Project of China (No. 2013AA031903). The authors are grateful to Wuhan Institute of Physics and Mathematics, Chinese Academy of Sciences for the 17O-NMR experiments.
Author Contributions
Xintang Huang supervised the research work. Xiaofan Ruan and Qiuxiang Yu supplied help for experiments. Zetai Yu supplied help for data analysis. Wenhu Tan conceived the method, performed the design, fabrication and testing of the device , analyzed the data and wrote the paper.
Conflicts of Interest
The authors declare no conflict of interest.
References
- Barsan, N.; Koziej, D.; Weimar, U. Metal oxide-based gas sensor research: How to? Sens. Actuators B Chem. 2007, 121, 18–35. [Google Scholar]
- Barsan, N.; Weimar, U. Conduction Model of Metal Oxide Gas Sensors. J. Electroceram. B 2001, 7, 143–167. [Google Scholar]
- Guan, Y.; Wang, D.W.; Zhou, X.; Sun, P.; Wang, H.Y.; Ma, J.; Lu, G.Y. Hydrothermal Preparation and Gas Sensing Properties of Zn-doped SnO2 Hierarchical Architectures. Sens. Actuators B Chem. 2014, 191, 45–52. [Google Scholar]
- Feng, X.Y.; Jiang, J.; Ding, H.; Ding, R.M.; Luo, D.; Zhu, J.H.; Feng, Y.M.; Huang, X.T. Carbon-assisted Synthesis of Mesoporous SnO2 Nanomaterial as Highly Sensitive Ethanol Gas Sensor. Sens. Actuators B Chem. 2013, 183, 526–534. [Google Scholar]
- Gubbala, S.; Chakrapani, V.; Kumar, V.; Sunkara, M.K. Band-edge Engineered Hybrid Structures Dye-sensitized Solar Cells Based on SnO2 Banowires. Adv. Funct. Mater. 2008, 18, 2411–2418. [Google Scholar]
- Zhou, W.W.; Cheng, C.W.; Liu, J.P.; Tay, Y.Y.; Jiang, J.; Jia, X.T.; Zhang, J.X.; Gong, H.; Hng, H.H.; Yu, T.; et al. Epitaxial growth of branched a-Fe2O3/SnO2 nanoheterostructures with improved lithium-ion battery performance. Adv. Funct. Mater. 2011, 21, 2439–2445. [Google Scholar]
- Lin, Y.S.; Duh, J.G.; Huang, M.H. Shell-by-shell Synthesis and Applications of Carbon-coated SnO2 Hollow Nanospheres in Lithium-ion Battery. J. Phys. Chem. B 2010, 114, 13136–13141. [Google Scholar]
- Niu, M.T.; Huang, F.; Cui, L.F.; Huang, P.; Yu, Y.L.; Wang, Y.S. Hydrothermal Synthesis, Structural Characteristics, and Enhanced Photocatalysis of SnO2/a-Fe2O3 semiconductor nanoheterostructures. ACS Nano 2010, 4, 681–688. [Google Scholar]
- Kadir, R.A.; Li, Z.Y.; Gao, S.; Sadek, A.Z.; Rani, R.A.; Zoolfakar, A.S.; Field, M.R.; Ou, J.Z.; Chrimes, A.F.; Kourosh, K.Z. Electrospun Granular Hollow SnO2 Nanofibers Hydrogen Gas Sensors Operating at Low Temperatures. J. Phys. Chem. B 2014, 118, 3129–3139. [Google Scholar]
- Partridge, J.G.; Field, M.R.; Peng, J.L.; Sadek, A.Z.; Kourosh, K.Z.; Plessis, J.D.; McCulloch, D.G. Nanostructured SnO2 films prepared from evaporated Sn and their application as gas sensors. Nanotech 2008, 19. [Google Scholar] [CrossRef]
- Patil, S.B.; Patil, P.P.; More, M.A. Acetone Vapour Sensing Characteristics of Cobalt-doped SnO2 Thin Films. Sens. Actuators B Chem. 2007, 125, 126–130. [Google Scholar]
- Sun, Y.F.; Huang, X.J.; Meng, F. L; Liu, J.H. Study of Influencing Factors of Dynamic Measurements Based on SnO2 Gas Sensor. Sensors 2004, 4, 95–104. [Google Scholar]
- Zhao, J.; Huo, L.H.; Gao, S.; Zhao, H.; Zhao, J.G. Alcohols and Acetone Sensing Properties of SnO2 Thin Films Deposited by Dip-coating. Sens. Actuators B Chem. 2006, 115, 460–464. [Google Scholar]
- Kida, T.; Doi, T.; Shimanoe, K. Synthesis of Monodispersed SnO2 Nanocrystals and Their Remarkably High Sensitivity to Volatile Organic Compounds. Chem. Mater. 2010, 22, 2662–2667. [Google Scholar]
- Riskin, M.; Tel-Vered, R.; Willner, I. The Imprint of Electropolymerized Polyphenol Films on Electrodes by Donor-acceptor Interactions: Selective Electrochemical Sensing of N,N′-Dimethyl-4, 4′-Bipyridinium (Methyl Viologen). Adv. Func. Mater. 2007, 17, 3858–3863. [Google Scholar]
- Lakshmi, D.; Bossi, A.; Whitcombe, M.J.; Chianella, I.; Fowler, S.A.; Subrahmanyam, S.; Piletska, E.V.; Piletsky, S.A. Electrochemical Sensor for Catechol and Dopamine Based on A Catalytic Molecularly Imprinted Polymer-conducting Polymer Hybrid Recognition Element. Anal. Chem. 2009, 81, 3576–3584. [Google Scholar]
- Panasyuk, T.L.; Mirsky, V.M.; Piletsky, S.A.; Wolfbeis, O.S. Electropolymerized Molecularly Imprinted Polymers as Receptor Layers in Capacitive Chemical Sensors. Anal. Chem. 1999, 71, 4609–4613. [Google Scholar]
- Cai, D.; Ren, L.; Zhao, H.Z.; Xu, C.J.; Zhang, L.; Yu, Y.; Wang, H.Z.; Lan, Y.C.; Roberts, M.F.; Chuang, J.H.; et al. A Molecular-imprint Nanosensor for Ultrasensitive Detection of Proteins. Nat. Nanotech. 2010, 5, 597–601. [Google Scholar]
- Alexander, C.; Andersson, H.S.; Andersson, L.I.; Ansell, R.J.; Kirsch, N.; Nicholls, I.A.; O'Mahony, J.; Whitcombe, M.J. Molecular Imprinting Science and Technology: A Survey of the Literature for The Years Up to And Including 2003. J. Mol. Recognit. 2006, 19, 106–180. [Google Scholar]
- Komiyama, M.; Takeuchi, T.; Mukawa, T.; Asanuma, H. Molecular Imprinting: From Fundamentals to Applications; Wiley-VCH: Berlin, Germany, 2003; pp. 9–20. [Google Scholar]
- Chen, J.S.; Cheah, Y.L.; Chen, Y.T.; Jayaprakash, N.; Madhavi, S.; Yang, Y.H.; Lou, X.W. SnO2 Nanoparticles with Controlled Carbon Nanocoating as High-capacity Anode Materials for Lithium-ion Batteries. J. Phys. Chem. C 2009, 113, 20504–20508. [Google Scholar]
- Sing, K.S. W.; Everett, D.H.; Haul, R.A. W.; Moscou, L.; Pierotti, R.A.; Rouquérol, J.; Siemieniewska, T. Reporting Physisorption Data for Gas/Solid System. Pure. Appl. Chem. 1985, 57, 603–619. [Google Scholar]
- Kruk, M.; Jaroniec, M. Gas Adsorption Characterization of Ordered Organic-inorganic Nanocomposite Materials. Chem. Mater. 2001, 13, 3169–3183. [Google Scholar]
- Li, L.L.; Zhang, W.M.; Yuan, Q.; Li, Z.X.; Fang, C.J.; Sun, L.D.; Wan, L.J.; Yan, C.H. Room Temperature Ionic Liquids Assisted Green Synthesis of Nanocrystalline Porous SnO2 and Their Gas Sensor Behaviors. Cryst. Growth Des. 2008, 8, 4165–4172. [Google Scholar]
- Shinde, V.R.; Gujar, T.P.; Lokhande, C.D. Enhanced Response of Porous ZnO Nanobeads towards LPG: Effect of Pd Sensitization. Sens. Actuators B Chem. 2007, 123, 701–706. [Google Scholar]
- Cao, Z.; Stetter, J.R. A Selective Solid-state Gas Sensor for Halogenated Hydrocarbons. Sens. Actuators B Chem. 1991, 5, 109–113. [Google Scholar]
- Chiu, H.C.; Yeh, C.S. Hydrothermal Synthesis of SnO2 Nanoparticles and Their Gas-sensing of Alcohol. J. Phys. Chem. C 2007, 111, 7256–7259. [Google Scholar]
- Han, Z.J.; Mehdipour, H.; Li, X.G.; Shen, J.; Randeniya, L.; Yang, H.Y.; Ostrikov, K. SWCNT Networks on Nanoporous Silica Catalyst Support: Morphological and Connectivity Control for Nanoelectronic, Gas-sensing, and Biosensing Devices. ACS Nano 2012, 6, 5809–5819. [Google Scholar]
- Umar, A.; Akhtar, M.S.; Dar, G.N.; Abaker, M.; Al-Hajry, A.; Baskoutas, S. Visible-light-driven photocatalytic and chemical sensing properties of SnS2 nanoflakes. Talanta 2013, 114, 183–190. [Google Scholar]
- Dar, G.N.; Umar, A.; Zaidi, S.A.; Ibrahim, A.A.; Abaker, M.; Baskoutas, S.; Al-Assiri, S.S. Ce-doped ZnO nanorods for the detection of hazardous chemical. Sens. Actuators B Chem. 2012, 173, 72–78. [Google Scholar]
- Farmanara, P.; Stert, V.; Radloff, W. Ultrafast Photodissociation Dynamics of Acetone Excited by Femtosecond 155 nm Laser Pluses. Chem. Phys. Lett. 2000, 320, 697–702. [Google Scholar]
- Han, G.Z.; Ding, Y.L.; Qian, P.; Zhang, C.; Song, W. Theoretical Investigation of Gas Phase Ethanol–(Water)n (n = 1–5) Clusters and Comparison with Gas Phase Pure Water Clusters (Water)n (n = 2–6). Int. J. Quantum Chem. 2013, 113, 1511–1521. [Google Scholar]
- Yang, P.G.; Ye, Z.L.; Jiang, G.Y.; Li, Z.; Ding, C.F.; Hou, H.Q. Water Cluster Distribution under Ambient Conditions and Dissociation of H+(H2O)n (n = 4–16) Using Mass Spectrometry in Atmosphere. Acta Chim. Sinica 2009, 67, 2031–2037. [Google Scholar]
- Ludwig, R. NMR Relaxation Studies in Water-alcohol Mixtures: the Water-rich Region. Chem. Phys. 1995, 195, 329–337. [Google Scholar]


| Sensors | Film | Materials | Liquid | Average Pore Size (nm) | BET (m2 g−1) |
|---|---|---|---|---|---|
| SWW | WW | W | water | 4.6125 | 89.351 |
| SWA | WA | W | acetone | 4.3275 | 92.703 |
| SAW | AW | A | water | 4.7853 | 80.901 |
| SAA | AA | A | acetone | 4.7227 | 83.079 |
| Materials | Acetone:Water | Average Pore Size (nm) | BET Surface Area (m2 g−1) |
|---|---|---|---|
| W | 0:70 | 5.5312 | 83.35 |
| A | 10:60 | 4.6811 | 83.05 |
| Concentration of Gas (ppm) | Response Time (s) | Recovery Time (s) | ||||||
|---|---|---|---|---|---|---|---|---|
| SWW | SAW | SWA | SAA | SWW | SAW | SWA | SAA | |
| 10 | 22.1 | 17.3 | 13.8 | 6.7 | SWW | 142.1 | 69.2 | 68.5 |
| 30 | 13.3 | 9.8 | 8.7 | 5.3 | 292.6 | 156.3 | 85.9 | 78.1 |
| 50 | 9.7 | 8.7 | 7.7 | 5.0 | 456.2 | 144.6 | 133.4 | 119.8 |
| 100 | 9.2 | 8.2 | 7.1 | 4.3 | 463.5 | 231.1 | 212.3 | 156.3 |
© 2015 by the authors; licensee MDPI, Basel, Switzerland. This article is an open access article distributed under the terms and conditions of the Creative Commons Attribution license ( http://creativecommons.org/licenses/by/4.0/).
Share and Cite
Tan, W.; Ruan, X.; Yu, Q.; Yu, Z.; Huang, X. Fabrication of a SnO2-Based Acetone Gas Sensor Enhanced by Molecular Imprinting. Sensors 2015, 15, 352-364. https://doi.org/10.3390/s150100352
Tan W, Ruan X, Yu Q, Yu Z, Huang X. Fabrication of a SnO2-Based Acetone Gas Sensor Enhanced by Molecular Imprinting. Sensors. 2015; 15(1):352-364. https://doi.org/10.3390/s150100352
Chicago/Turabian StyleTan, Wenhu, Xiaofan Ruan, Qiuxiang Yu, Zetai Yu, and Xintang Huang. 2015. "Fabrication of a SnO2-Based Acetone Gas Sensor Enhanced by Molecular Imprinting" Sensors 15, no. 1: 352-364. https://doi.org/10.3390/s150100352
APA StyleTan, W., Ruan, X., Yu, Q., Yu, Z., & Huang, X. (2015). Fabrication of a SnO2-Based Acetone Gas Sensor Enhanced by Molecular Imprinting. Sensors, 15(1), 352-364. https://doi.org/10.3390/s150100352