Microencapsulated Aliivibrio fischeri in Alginate Microspheres for Monitoring Heavy Metal Toxicity in Environmental Waters

Abstract
: In this article a luminescence fiber optic biosensor for the microdetection of heavy metal toxicity in waters based on the marine bacterium Aliivibrio fischeri (A. fischeri) encapsulated in alginate microspheres is described. Cu(II), Cd(II), Pb(II), Zn(II), Cr(VI), Co(II), Ni(II), Ag(I) and Fe(II) were selected as sample toxic heavy metal ions for evaluation of the performance of this toxicity microbiosensor. The loss of bioluminescence response from immobilized A. fischeri bacterial cells corresponds to changes in the toxicity levels. The inhibition of the luminescent biosensor response collected at excitation and emission wavelengths of 287 ± 2 nm and 487 ± 2 nm, respectively, was found to be reproducible and repeatable within the relative standard deviation (RSD) range of 2.4–5.7% (n = 8). The toxicity biosensor based on alginate micropsheres exhibited a lower limit of detection (LOD) for Cu(II) (6.40 μg/L), Cd(II) (1.56 μg/L), Pb(II) (47 μg/L), Ag(I) (18 μg/L) than Zn(II) (320 μg/L), Cr(VI) (1,000 μg/L), Co(II) (1700 μg/L), Ni(II) (2800 μg/L), and Fe(III) (3100 μg/L). Such LOD values are lower when compared with other previous reported whole cell toxicity biosensors using agar gel, agarose gel and cellulose membrane biomatrices used for the immobilization of bacterial cells. The A. fischeri bacteria microencapsulated in alginate biopolymer could maintain their metabolic activity for a prolonged period of up to six weeks without any noticeable changes in the bioluminescence response. The bioluminescent biosensor could also be used for the determination of antagonistic toxicity levels for toxicant mixtures. A comparison of the results obtained by atomic absorption spectroscopy (AAS) and using the proposed luminescent A. fischeri-based biosensor suggests that the optical toxicity biosensor can be used for quantitative microdetermination of heavy metal toxicity in environmental water samples.1. Introduction
Industrial and domestic wastewaters are being continuously released into the natural aquatic system every day. These wastewaters usually contain various heavy metal complexes. Zerovalent heavy metals are chemically inert, whilst metals with other oxidation states have strong biological activity and can induce genotoxic damage in living organisms [1–4]. The genotoxic metals cause damage to the genetic material in the cells via interaction with DNA sequences and structures or via breaking of dsDNA strands, resulting in mutagenic events such as chromosomal aberrations, changes in the structure and function of the reproductive system, reduction in growth rates and abnormal development in the embryo and adult stages of living organisms [3,5]. Furthermore, the negative impacts of heavy metals on human health have been suspected of causing cardiovascular diseases, reduction in intelligence, liver damage, etc. Therefore, there is a clear demand for sensitive and reliable assessment tools for heavy metal toxicity determination.
Toxicity bioassays using a commercial Microtox® reagent containing freeze-dried culture of luminescent A. fischeri bacteria for heavy metal toxicity assay of contaminated water, soil and sediment, and measured with a laboratory-based or a portable photometer have been reported [6–9]. The Microtox® bioassay is generally effective for detection of heavy metals in water samples, whereby it is able to distinguish between chemicals that are potentially hazardous and non-hazardous to microorganisms. However, the Microtox® method possesses several drawbacks, e.g., low sensitivity, long response times (15 min to hours), high EC50 (50% effective concentration) values of >1 ppm and non-reproducible responses. Likewise, Tsiridis et al. [9] have carried out toxicity assays for Cu(II), Zn(II) and Pb(II) using a A. fischeri-Microtox® reagent that exhibited long response times of up to 4 h. In addition, the luminescence response was observed to be unstable due to the free bacterial cells that were used, as the physically unsecured A. fischeri cells were susceptible to interference and gave erratic luminescence responses.
Other microbial heavy metal toxicity assays based on fluorescent or luminescent free bacterial cells using green fluorescent protein (GFP)-engineered E. coli [10,11], E. coli Alux gene [12] and P. fluorescence have been reported [13]. However, toxicity assays based on free bacterial cells in culture media could not determine heavy metal toxicity at low levels (<160 ppb) [13,14], and the incubation times are normally >2 h [10,12] before any changes to the luminescence signals are obtained [10].
To improve the bioassay performance for monitoring heavy metal toxicity, a biosensor would be an alternative method, whereby microbial cells are entrapped on a transducer to obviate any interference with enzyme activity, and offer assays that are highly sensitive, easy-to-use, with rapid exposure time and adaptable to online monitoring [15,16]. Microbial biosensors for heavy metal toxicity have been developed by using A. eutrophos Alux gene immobilized in alginate beads [17], A. torulosa alge entrapped in poly(2-hydroxyethyl methacrylate) hydrogels [18] and E. coli Alux gene immobilized in alginate beads [19]. However, these developed microbial biosensors had low sensitivity, high detection limits at the ppm level and long response times (15 min to 1.5 h).
In this work, we report the first compact sized biosensor for heavy metal toxicity investigation based on A. fischeri immobilized in alginate microspheres via microencapsulation and supported with a cellulose nitrate membrane. Alginate microspheres are commonly used as an enzyme immobilization matrix for designing biosensors such as glucose oxidase-based glucose biosensors [20], cholesterol oxidase for monitoring of cholesterol [21] and urease for examination of urea [22]. The proposed alginate microsphere-based biosensor detects heavy metal toxicity levels based on the electronic excitation of the bacterial bioluminescent reaction of the immobilized A. fischeri bacterial cells. A. fischeri is a naturally luminous bacterium that contains flavin reductase and luciferase biological catalysts. When the flavin reductase enzyme catalyzes the oxidation of reduced nicotinamide adenine dinucleotide phosphate [NAD(P)H] to NAD(P), flavin mononucleotide (FMN) is reduced (Equation (1)). The luciferase enzyme then further catalyzes the oxidation of reduced FMN (FMNH2), molecular oxygen and long-chain aldehyde to produce the corresponding FMN, water, long-chain carboxylic acid and a light quantum (Equation (2)), which is emitted at a wavelength of 490 nm [23,24].
As the microbial cells are exposed to toxic conditions caused by heavy metals, the cell metabolism is inhibited and and they give out a lower luminescence intensity, which can be registered instantaneously by a fiber optic spectrofluorimeter. Because a microsized alginate biomatrix was used to immobilize the biological component, the biosensor demonstrates rapid incubation times, high sensitivity, low LOD, good reproducibility and high stability.
2. Materials and Methods
2.1. Materials
All chemicals used were of analytical grade quality and dionized water was utilized for solution preparation. Stock solutions of 500 mg/L cadmium(II) chloride, zinc(II) chloride, copper(II) chloride, potassium dichromate (Sigma, St. Louis, MI, USA) were prepared by dissolving appropriate amounts of the respective salts in deionized water. Co2+, Ag+, Ni2+ and Fe3+ ion stock solutions at 700 mg/L were prepared by dissolving their nitrate salts (BDH, Radnor, PA, USA) in deionized water. Acid alginate (Sigma) stock solution in deionized water (6% w/v) was stored at 4 °C and can be used for over a month. Stock solutions of both 28 g/L nutrient agar (Scharlau, Bercelona, Spain) and 13 g/L nutrient broth (Oxoid, Hampshire, UK) containing 3% sodium chloride (Sigma) were prepared in deionized water and autoclaved at 121 °C for 20 min. All glassware used was cleaned by immersion in 15% nitric acid for 24 h to remove trace elements, followed by sterilization by autoclaving at 121 °C for 20 min. A. fischeri bacteria stock culture in 15% glycerol was obtained from the Microbiology Laboratory, Faculty of Science and Technology (National University of Malaysia, Malaysia) and kept at −80 °C.
2.2. Culture of A. Fischeri Bacteria
About 20 mL of A. fischeri bacteria stock culture in 15% glycerol was grown in 20 mL of nutrient agar medium at room temperature for 16 h. Single colonies of this bacterium were then isolated from the nutrient agar and grown in 4 mL of nutrient broth medium containing NaCl under shaking in a rotary thermo shaker at 250 rpm for 16 h at room temperature. Some 0.5 mL of this pre-cultured medium was then further grown in 50 mL of fresh NaCl-containing nutrient broth for 6 h under the similar condition. Then, the bacterial cells were harvested by centrifugation at 1000 rpm for 10 min followed by washing the A. fischeri cells with 3% NaCl for three times, and resuspended in 10 mL of 3% NaCl.
2.3. Fabrication of Microbial Toxicity Biosensors
To fabricate the alginate microsphere-based microbial biosensors, alginate microspheres were prepared via an emulsification technique. A mixture of alginate solution (1.5 mL, 2% w/v), liquid paraffin (4.5 mL, Sigma) and 2–3 drops of Tween 80 was mixed by strring on a magnetic stirrer at 900 rpm for 20 min to obtain an emulsion. About 1.5 mL of A. fischeri bacteria suspension in 3% NaCl was then added to the emulsion and uniformly mixed on a magnetic stirrer at 250 rpm for 10 min. Subsequently, by using a micropipette, the bacterial emulsion mixture was added dropwise into 0.15 M CaCl2-paraffin (2:1 v/v) under gentle stirring at <100 rpm. The A. fischeri encapsulated in alginate microspheres were collected by centrifugation at 1000 rpm for 10 min and washed thrice with sterile deionized water. The A. fischeri microencapsulated in alginate microspeheres was later filtered on a cellulose nitrate membrane (Whatman, 0.45 μm pore size and 5 cm diameter) using a Millipore vacuum pump, and left overnight at 4 °C in a refrigerator. The cellulose nitrate membrane with immobilized A. fischeri-encapsulated alginate microspheres was finally punched into a circular biosensing area of 19.63 mm2 by using an ordinary stationery paper punch. The bioluminescence response of the bacterial cell biosensor was measured with a Perkin Elmer fiber optic spectrofluorometer (Waltham, MA, USA) at excitation and emission wavelengths of 287 ± 2 nm and 487 ± 2 nm, respectively.
2.4. Effect of Cell Loading on the Bioluminescence Response
Different A. fischeri bacteria concentrations were prepared by culturing the cells in 50 mL of nutrient broth containing NaCl from 1–12 h. The concentrations of bacterial cells were measured using a SpectronicR 20 Genesys™ UV-Vis spectrophotometer (Waltham, MA, USA) at the wavelength of 600 nm. The A. fischeri concentrations with optical densities (OD600) from 0.15 to 1.22 were then immobilized separately in alginate microspheres, and their bioluminescence responses were recorded at excitation and emission wavelengths of 287 ± 2 nm and 487 ± 2 nm, respectively.
2.5. pH Effect on the Whole Cell Biosensor Response
Toxicant solutions, e.g., Cu(II), Zn(II) and Pb(II) at various concentrations ranging from 0.01–500 mg/L were prepared in different pHs from pH 5.5–9.0 adjusted by utilizing 2 M NaOH and HCl. The A. fischeri bacterial cell concentration used was 28.8 mg/100 mL or 4.2 × 10⁹ CFU/mL (OD600 = 0.78−0.80). The luminescence response was recorded at room temperature 6 min after the initiation of the biochemical reaction.
2.6. Repeatability, Reproducibility and Stability Studies
Toxicity biosensors of A. fischeri-immobilized alginate microspheres made from alginate solution (2 % w/v), CaCl2 (0.15 M) and A. fischeri (4.2 × 10⁹ CFU/mL) were prepared, and their repeatability and reproducibility were determined using 20–1000 μg/L Cu(II), Cd(II), Pb(II) and Zn(II) in eight replicate measurements. For long term stability study, about 30 identical bacterial cell biosensors were prepared and kept at 4 °C. The stability of the biosensors was determined by measuring the luminescence intensity of the biosensors once a week for a period of ten weeks.
2.7. Effect of Individual Toxicant and Their Mixtures on the Biosensor Response
Prior to heavy metal toxicity exposure, the microbial biosensors were prehydrated with 20 μL of deionized water and incubated for 2 min for activation of the bacterial cells. Then, the activated biosensors was exposed to 30 μL of single toxicants [Cu(II), Cd(II), Pb(II), Zn(II) Cr(VI), Co(II), Ni(II), Ag(I) and Fe(III)] or toxicant mixtures [Cu(II), Cd(II), Pb(II) and Zn(II)] and allowed to react for 6 min. For the control experiment, 30 μL of deionized water was added instead. The biosensor response was investigated before and after exposure of the biosensor to the heavy metal toxicity. Each experiment was done in triplicate under the same experimental conditions. The relative luminescence unit percentage (% RLU) was calculated based on Equation (3) for single toxicants, whilst for toxicity mixtures, toxicity units (TU) were determined by using Equation (4), where A and B are two different heavy metals that coexist in the toxicant mixture, and EC50 is the effective concentration of a heavy metal at 50% of its relative luminescence intensity. When ΣTU = 1, it implies zero interaction additive effect between toxicants in a mixture. For ΣTU > 1, its additive index (AI) is estimated by AI = [ΣTU(−1) + 1], and this toxicity mixture is at an antagonistic level. ΣTU < 1, denotes a synergistic effect in the toxicant mixture, and its AI value can be calculated with AI = [(1/ΣTU) – 1] [25].
2.8. Validation of the Biosensors for Monitoring River Water Toxicity
Four water samples were collected from the Langat River in Kajang, Malaysia and leachate was collected from the Jeram landfill in Mukim Jeram, Kuala Selangor, Malaysia using polyvinyl bottles. Then, the water samples were filtered using a cellulose nitrate membrane (0.45 μm pore size) and stored at 4 °C in a refrigerator. The microbial biosensor was then applied to determine heavy metal toxicity in the river water samples spiked with 20–100 μg/L Cu(II), 200–1000 μg/L Cd(II), 60–500 μg/L Pb(II) and 50–200 μg/L Zn(II), respectively, and validated by atomic absorption spectrometry (AAS, Perkin Elmer).
3. Results and Discussion
3.1. Characteristics of the Biosensor Luminescence Response
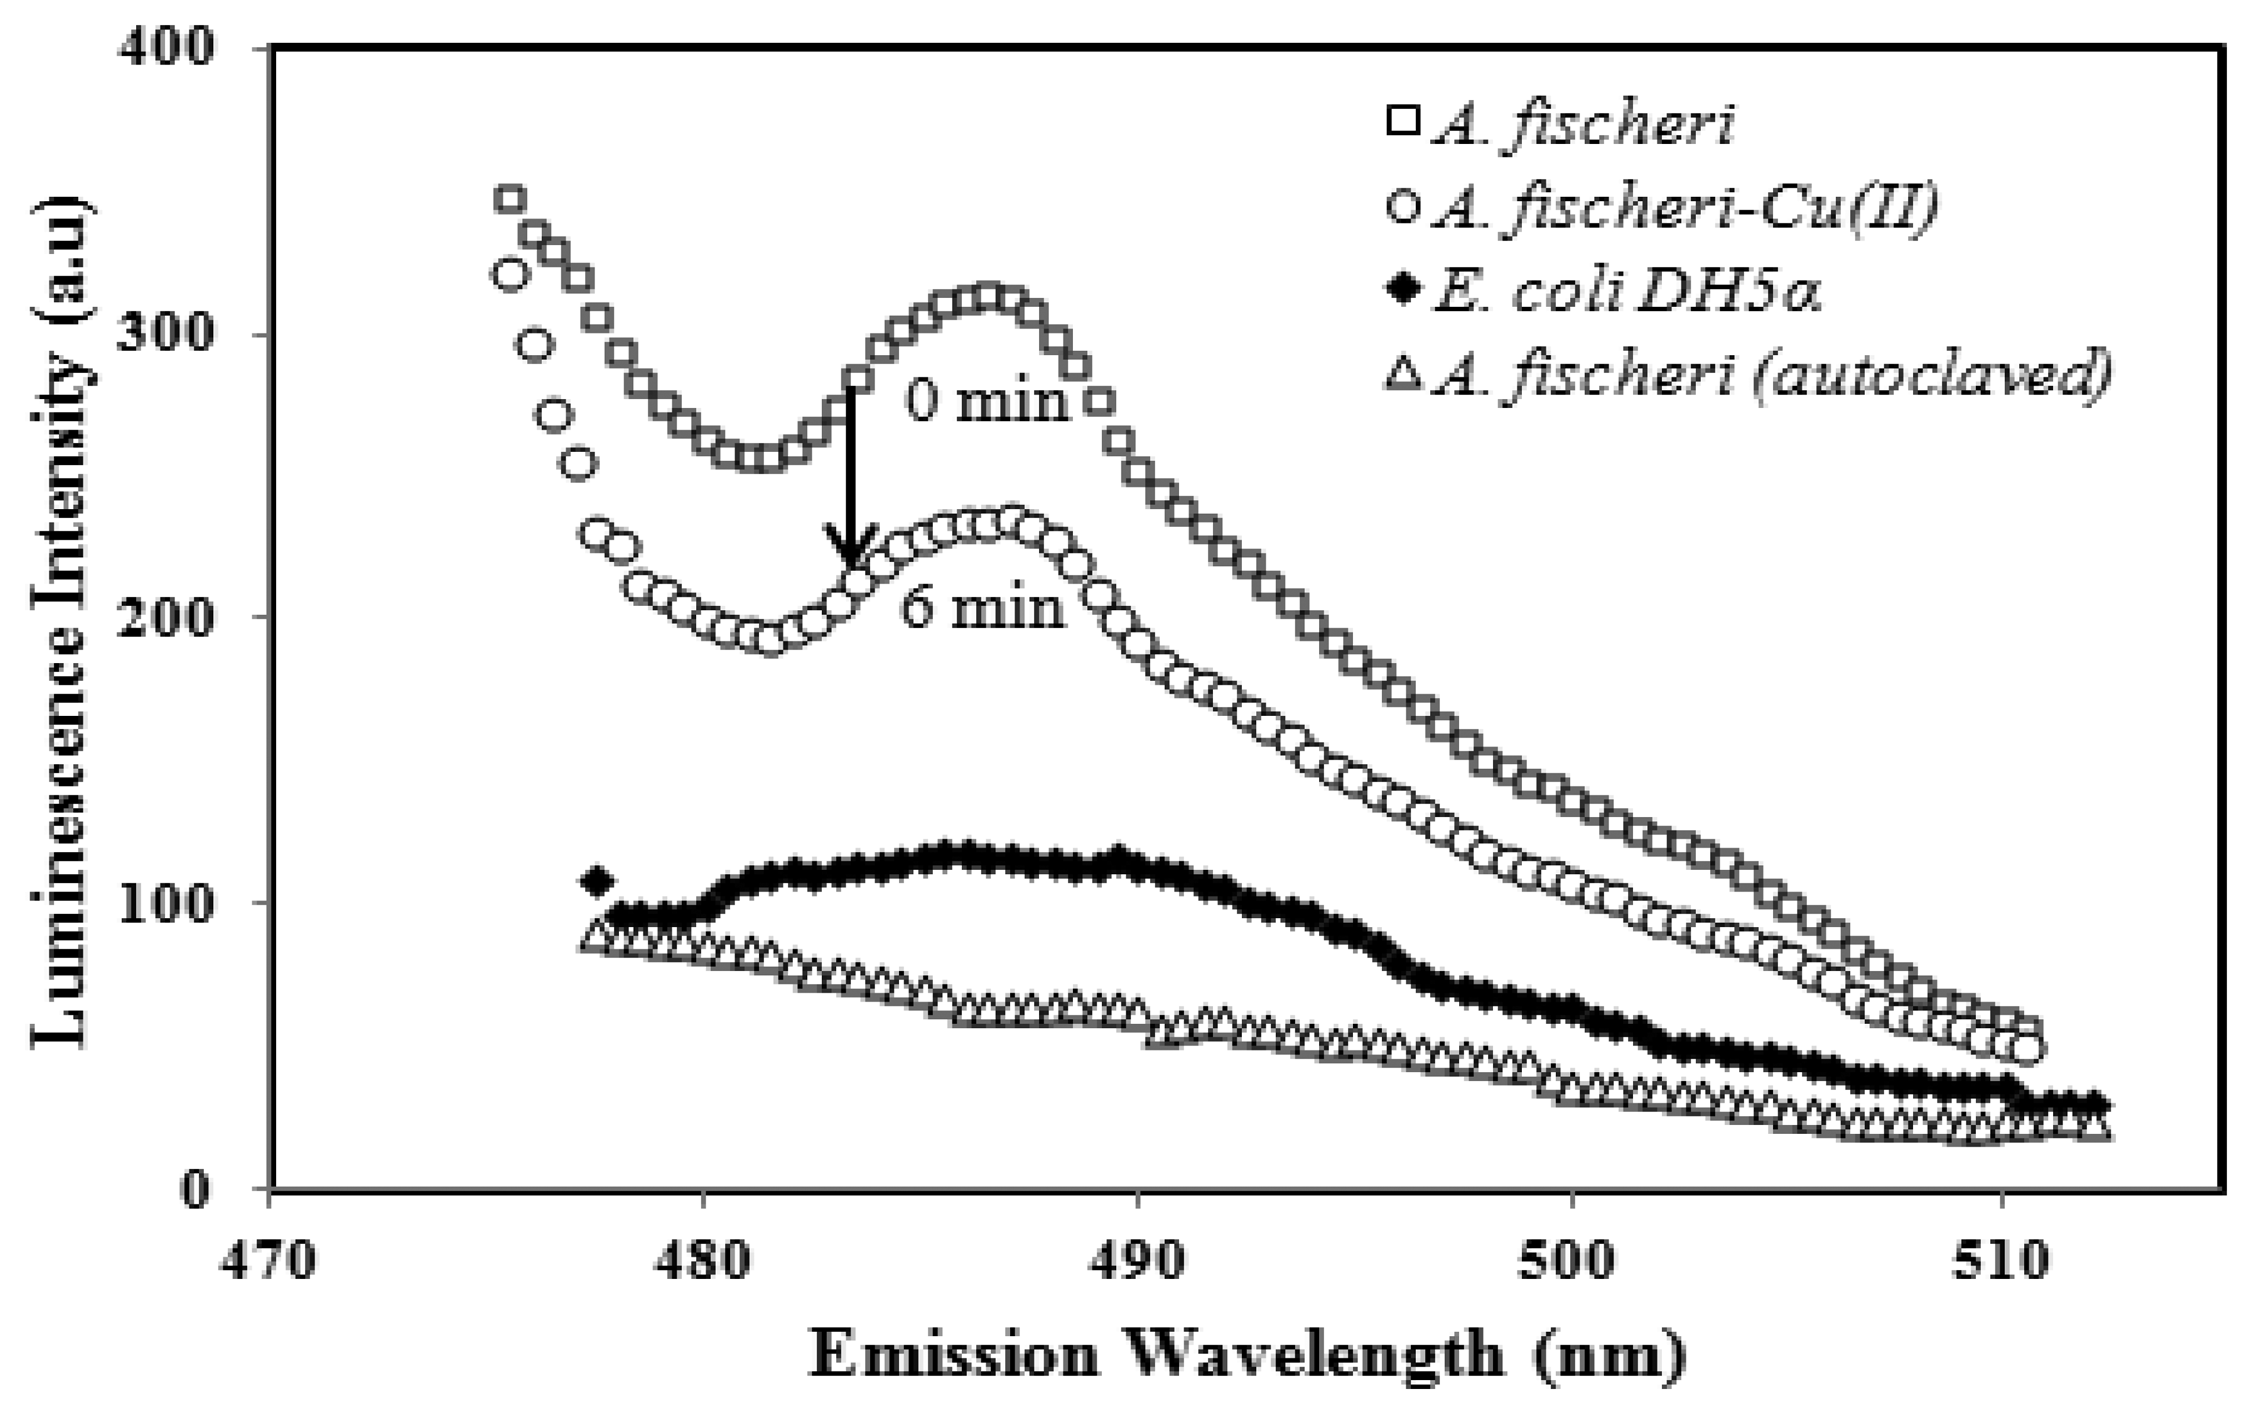
The characteristics of the luminescent A. fischeri based-biosensor response before and after exposure to heavy metal toxicants and an emission spectra comparison with E. coli DH5α and autoclaved A. fischeri are illustrated in Figure 1.
In the absent of toxicants, the immobilized A. fischeri was found to give the highest lumimescence intensity at 487 ± 2 nm. The biosensor response at 487 ± 2 nm declined after incubation with 0.1 mg/L Cu(II) ion for 6 min, which was ascribed to the reaction of Cu(II) ion with the carboxylic acid functional groups of the bacterial cell, thereby inhibiting the cell metabolism. No luminescence responses were expected for either the non-fluorescent E. coli DH5α species and autoclaved A. fischeri, as the A. fischeri cells would have undergone sterilization, and were entirely destroyed.
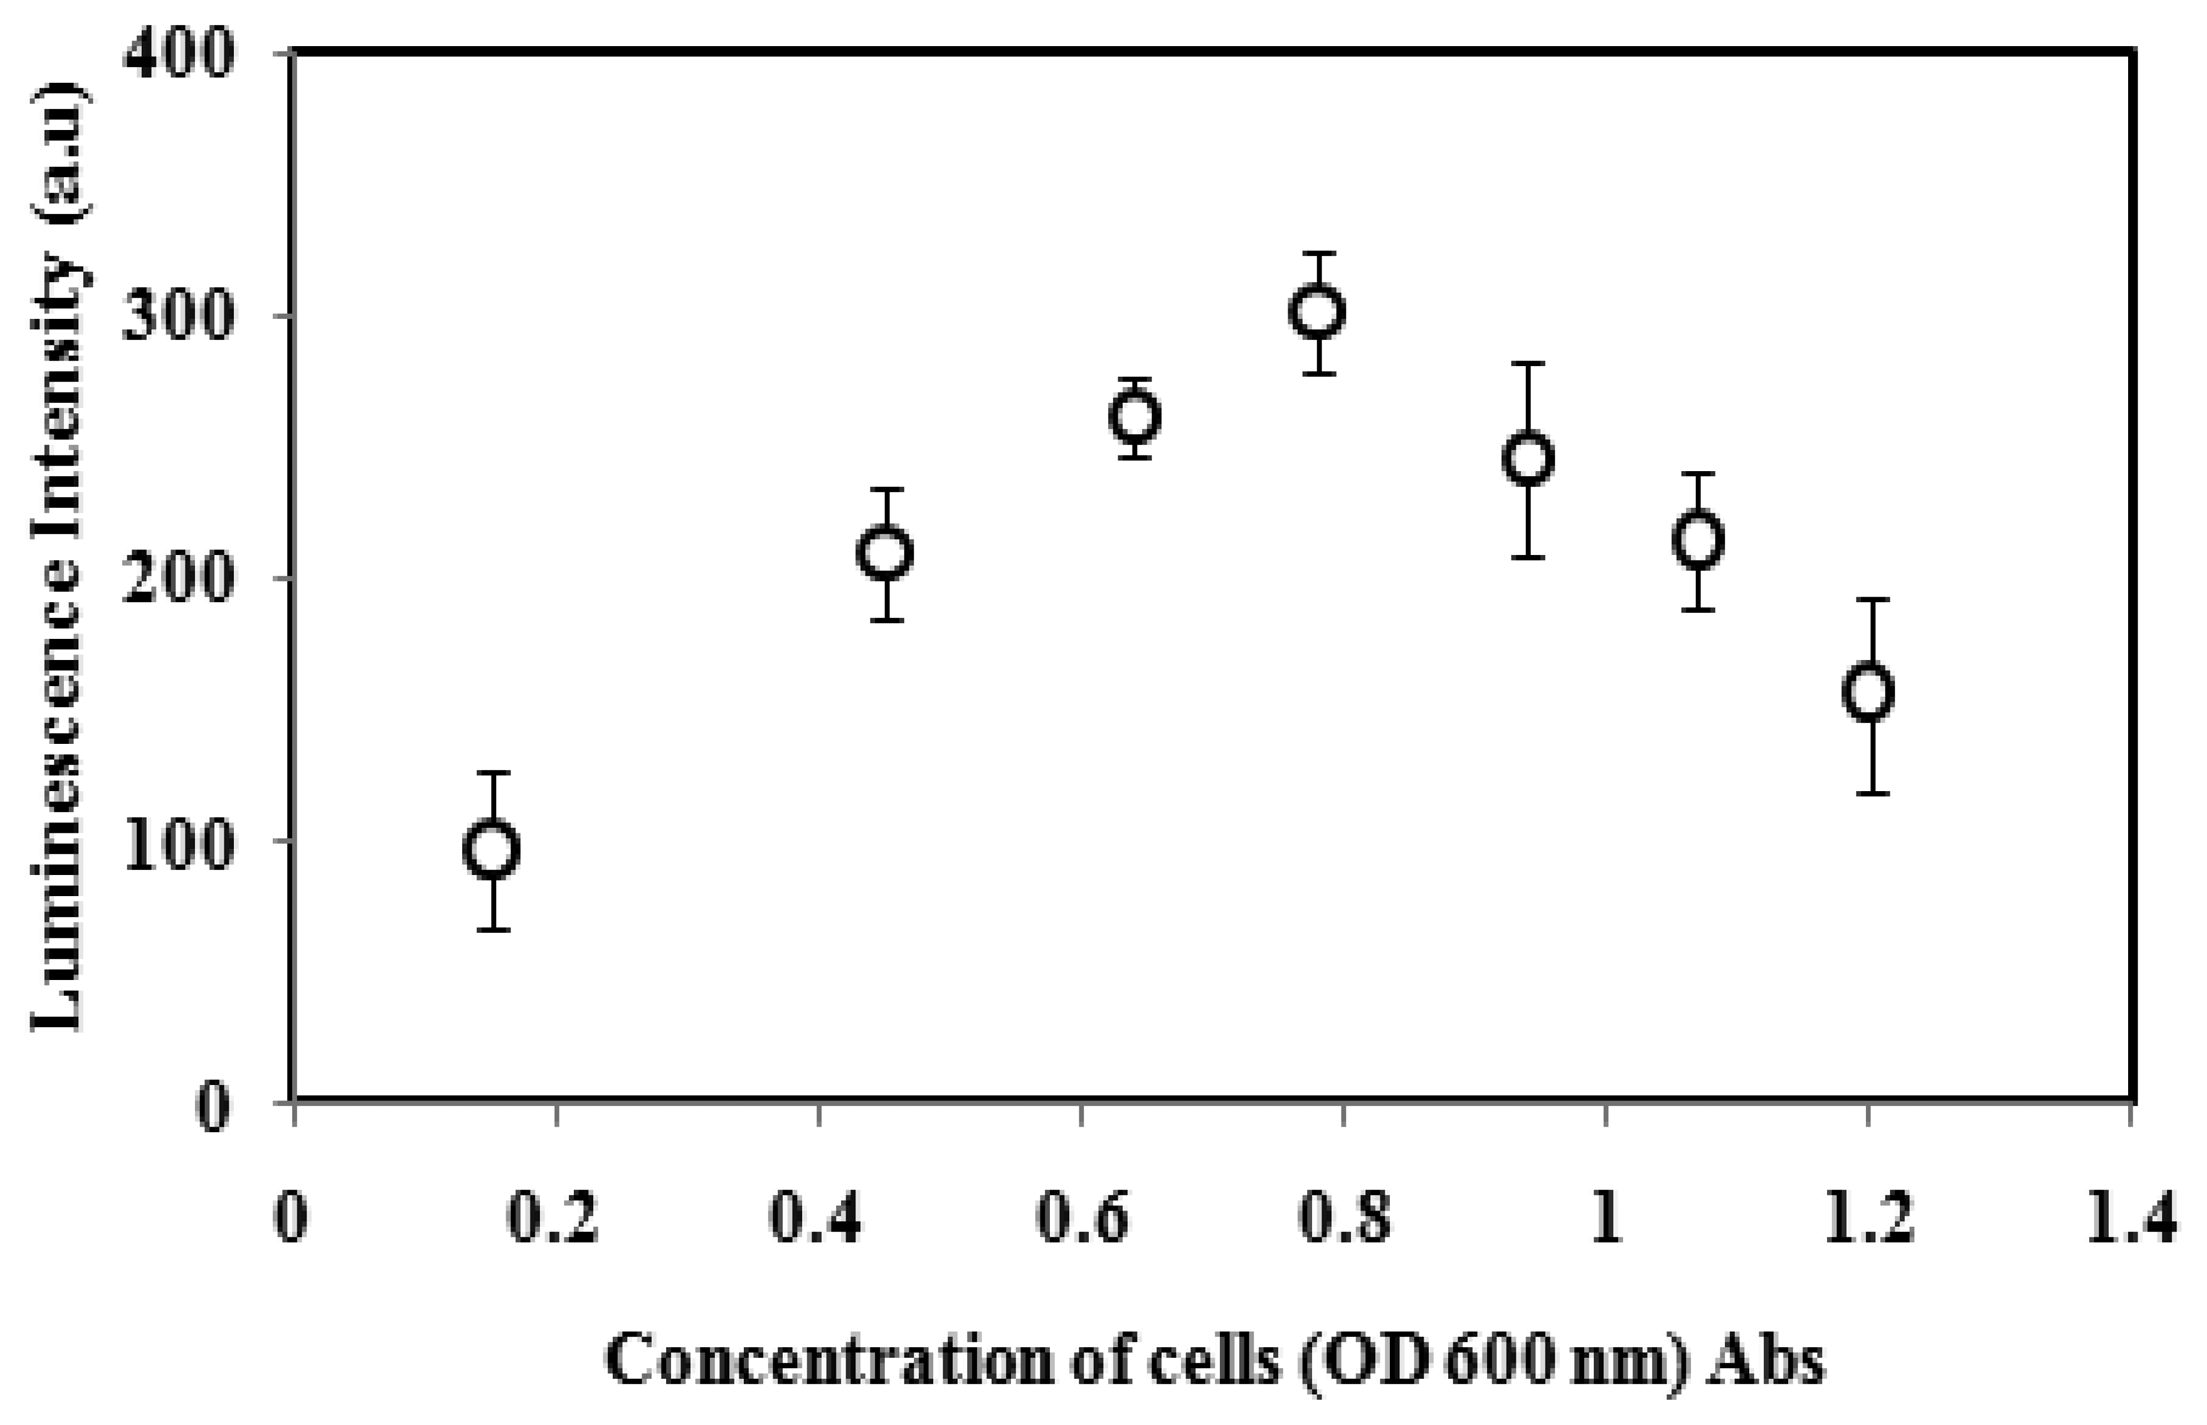
3.2. Effect of the A. fischeri Cell Concentration
Optimization of bacterial cell loading in the alginate microspheres has been carried out in order to obtain the maximum luminescence intensity of the biosensor. As Figure 2 implies, the luminescence response of immobilized A. fischeri gradually increased with cell concentration from 0.15 to 0.78 OD at 600 nm due to the high rates of the enzymatic chemiluminescent rections. With further increases in the A. fischeri cell concentration from 0.94 to 1.22 OD, the luminescence response of the biosensor decreased because of the limited diffusion of oxygen into the high cell population alginate microspheres, which affected the metabolic activity of the bacterial cell for the normal production of DNA, RNA and enzymes [26,27]. Luminescence quenching of the microbial biosensor may also occur when too many bacterial cells are loaded into the alginate microspheres causing luminescence absorption by neighbouring A. fischeri cells and less energy to be emitted as a light quantum [27,28]. Therefore, the optimum cell concentration at OD of 0.78 to 0.80 (600 nm) was used for further experiments.
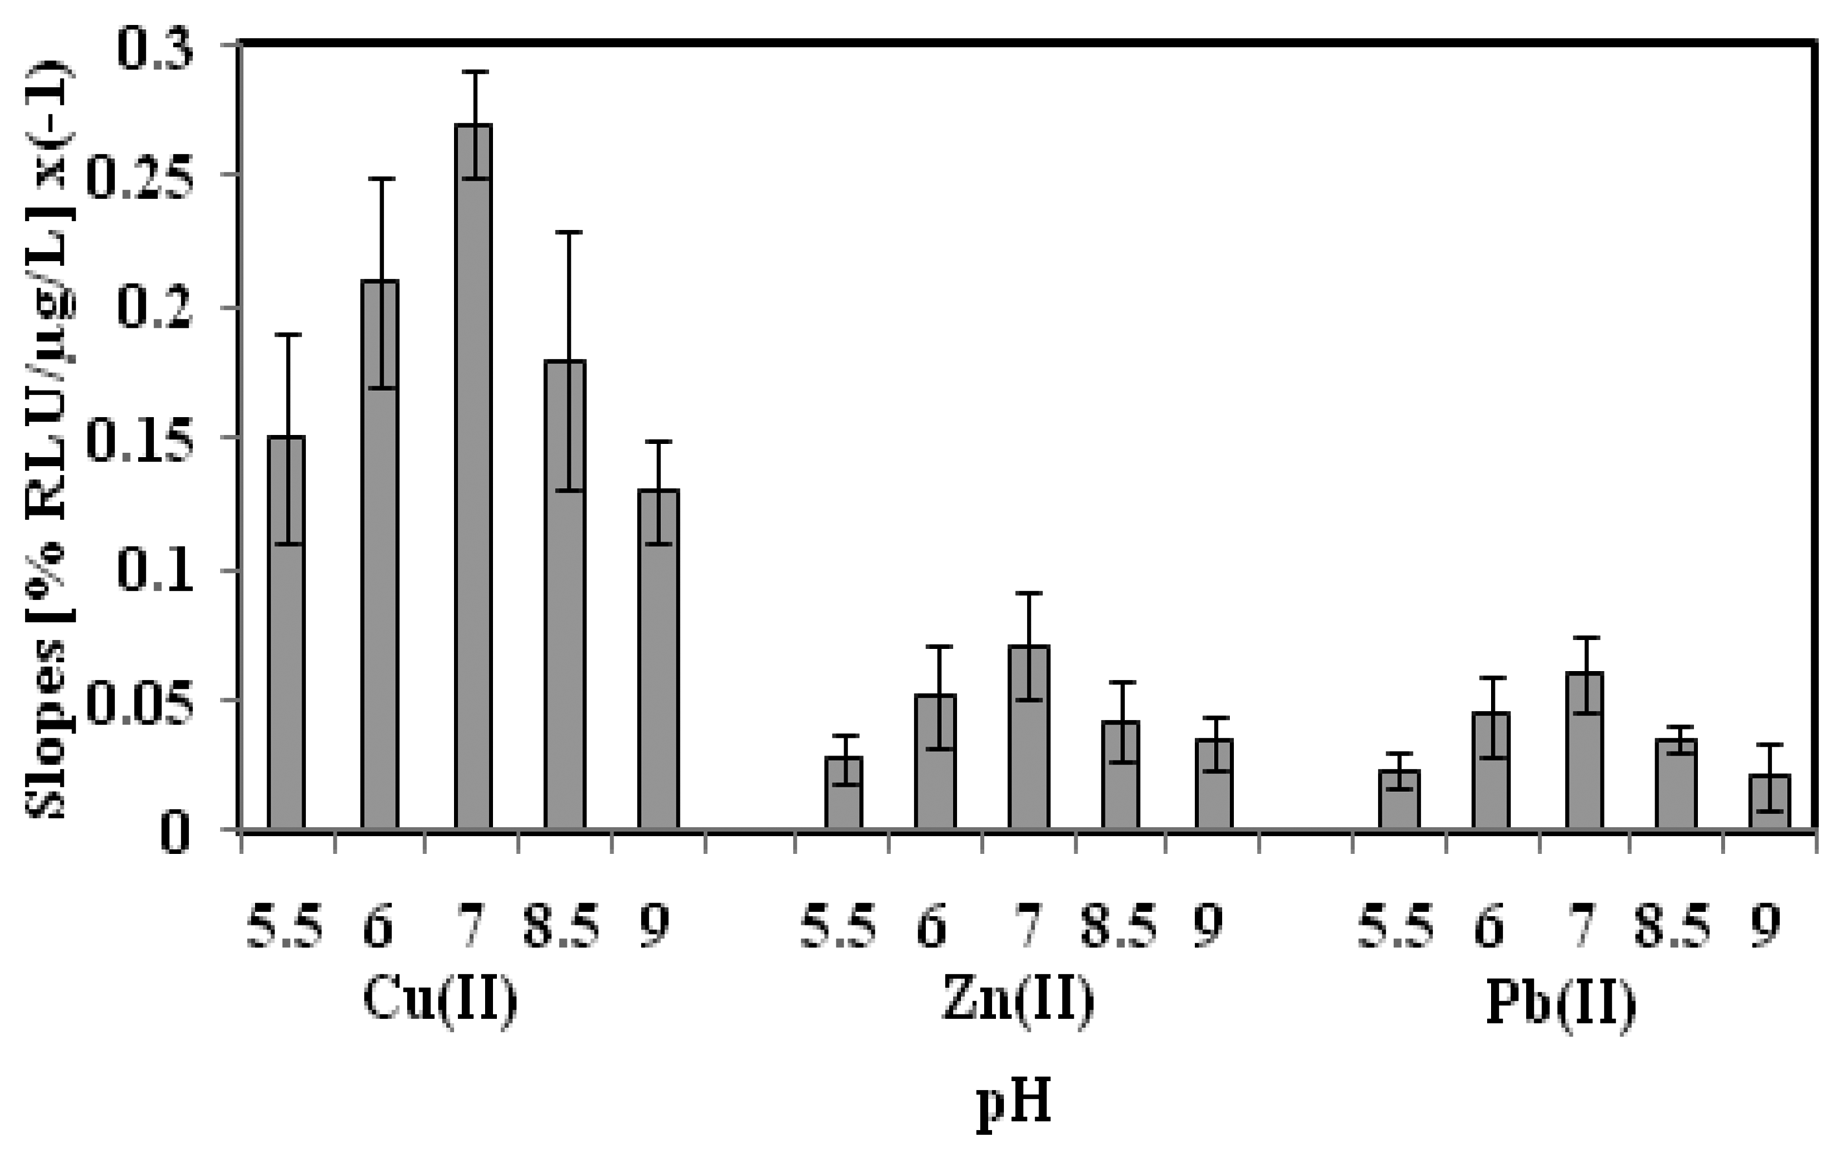
3.3. Effect of Toxicant Solution pH on the Biosensor Sensitivity
The pH effect on the microbial biosensor sensitivity was investigated using Cu(II), Zn(II) and Pb(II) toxicant solutions at different pHs from pH 5.5 to pH 9.0 (Figure 3). The highest biosensor sensitivity was achieved at pH 7.0, whilst relatively low biosensor sensitivity was observed in slightly acidic and alkaline toxicant solutions. At lower pH conditions, i.e., <pH 7.0, the chromophores of A. fischeri cells were protonated, whereby the carboxylic acid functional groups reacted with the abundant cationic metal ions and this interfered with the enzymatic chemiluminescent rections, thereby influencing the biosensor sensitivity [29,30]. At basic pH values, deprotonation of the chromophore resulted in amino acid chain disorder in the cells, and the bacterial cells were deactivated [31,32]. Thus, the toxicant solution pH was maintained at pH 7.0 for subsequent toxicity biosensing of heavy metals.
3.4. Repeatability, Reproducibility and Stability Characterizations
The response of the optical biosensor fabricated from A. fischeri encapsulated in alginate microspheres for monitoring of heavy metal toxicities was found to be repeatable and reproducible based on the promising relative standard deviations (RSDs) of <6% obtained (Table 1). This is due to the fact that the preparation technique via emulsification is able to produce uniform-sized alginate microspheres. The low repeatability and reproduciblity RDSs also suggest that the biosensor fabrication procedure is highly reproducible, and the biosensor can be reused for repetitive heavy metal toxicity assays (n = 8).
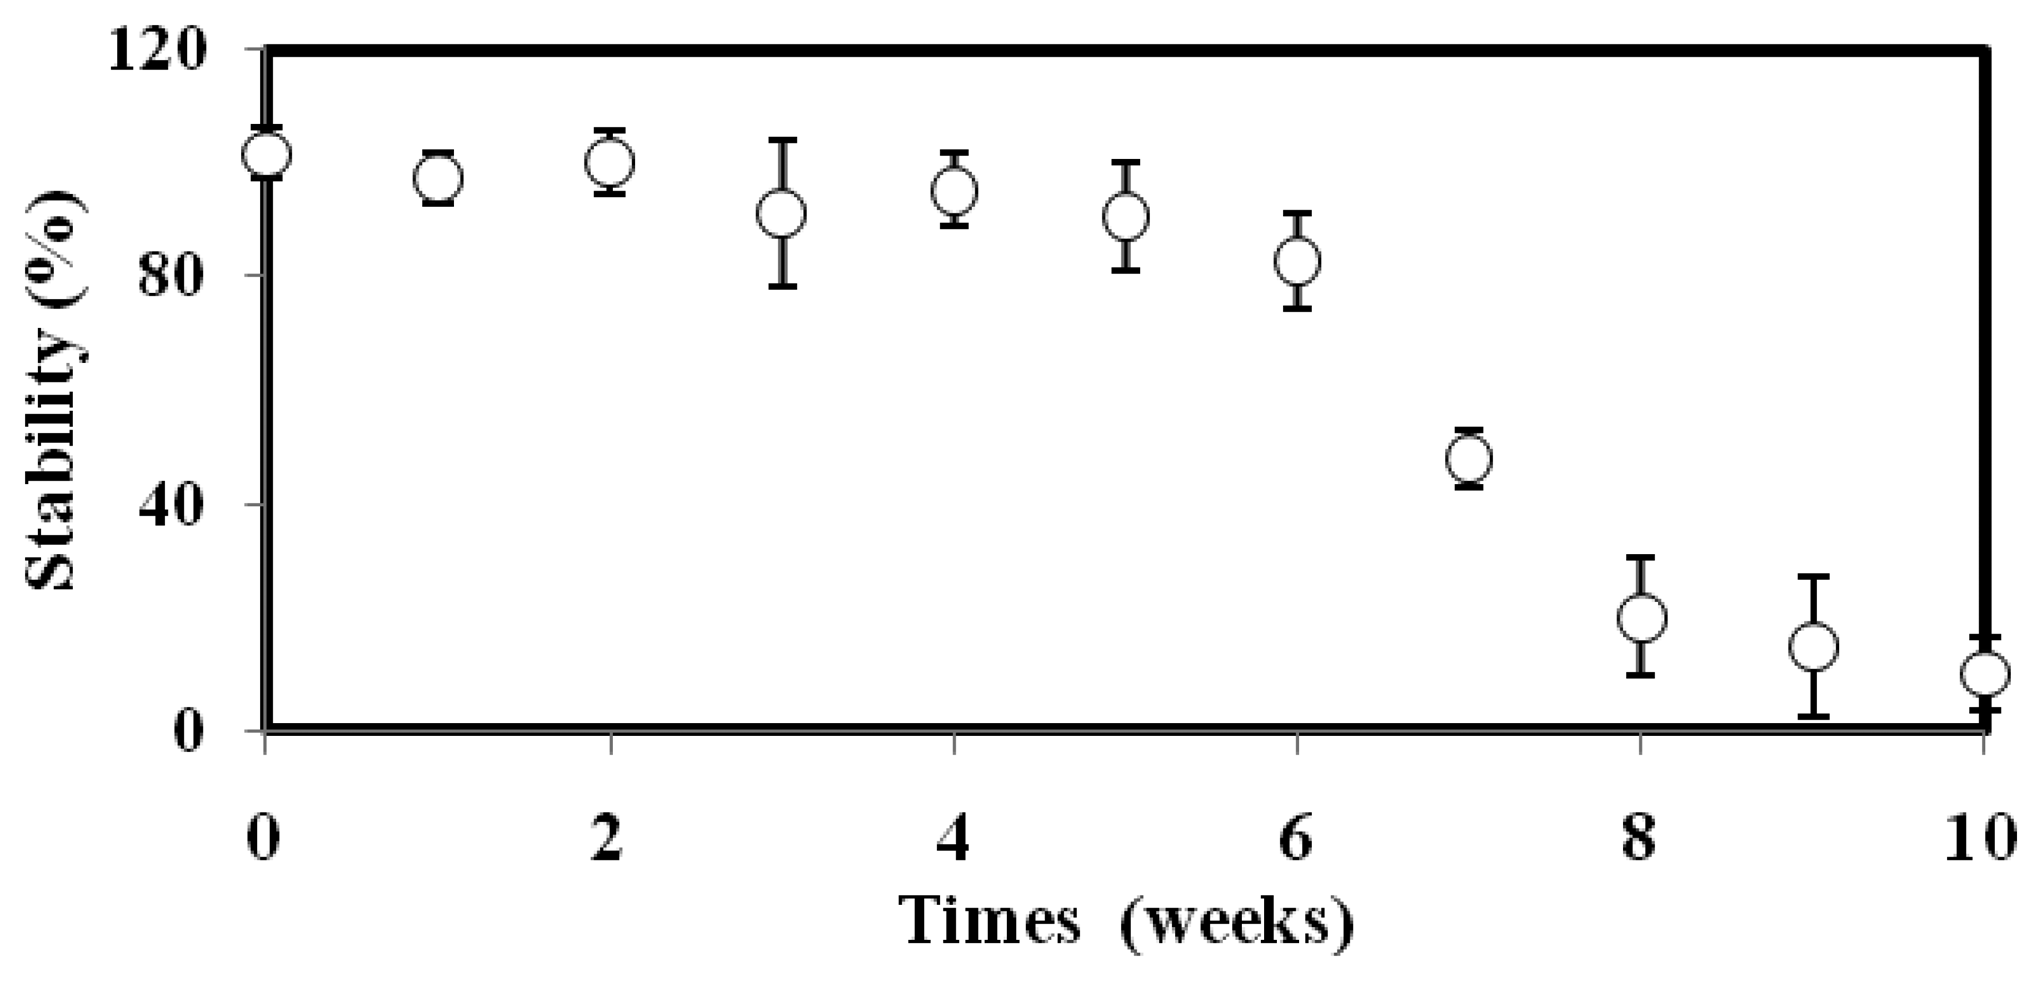
The stability of the microbial biosensor as a function of time is portrayed in Figure 4. The biosensor maintained its 100% luminescence response for the first 5 weeks, and still managed to retain almost 90% of its original response in week 6. After that, the biosensor response was slowly reduced until the tenth week, when only a 10% bioluminescence response could be captured. This observation can be explained by the fact that the available nutrient sources for survival of the bacteria were getting reduced, and the enzyme was losing its chemiluminescent reaction activity. The toxicity biosensor based on A. fischeri encapsulated in alginate microspheres demonstrated higher stability compared to Falvobacterium sp. immobilized on glass fiber, where <80% of the biosensor stability was retained after 4 weeks of operation [33]. The high stability featured by the proposed A. fischeri-based biosensor was attributed to the alginate protection layer that rendered the bacterial cells less vulnerable to extreme temperatures and pH values.
3.5. Biosensor Response against Individual Heavy Metal Toxicity
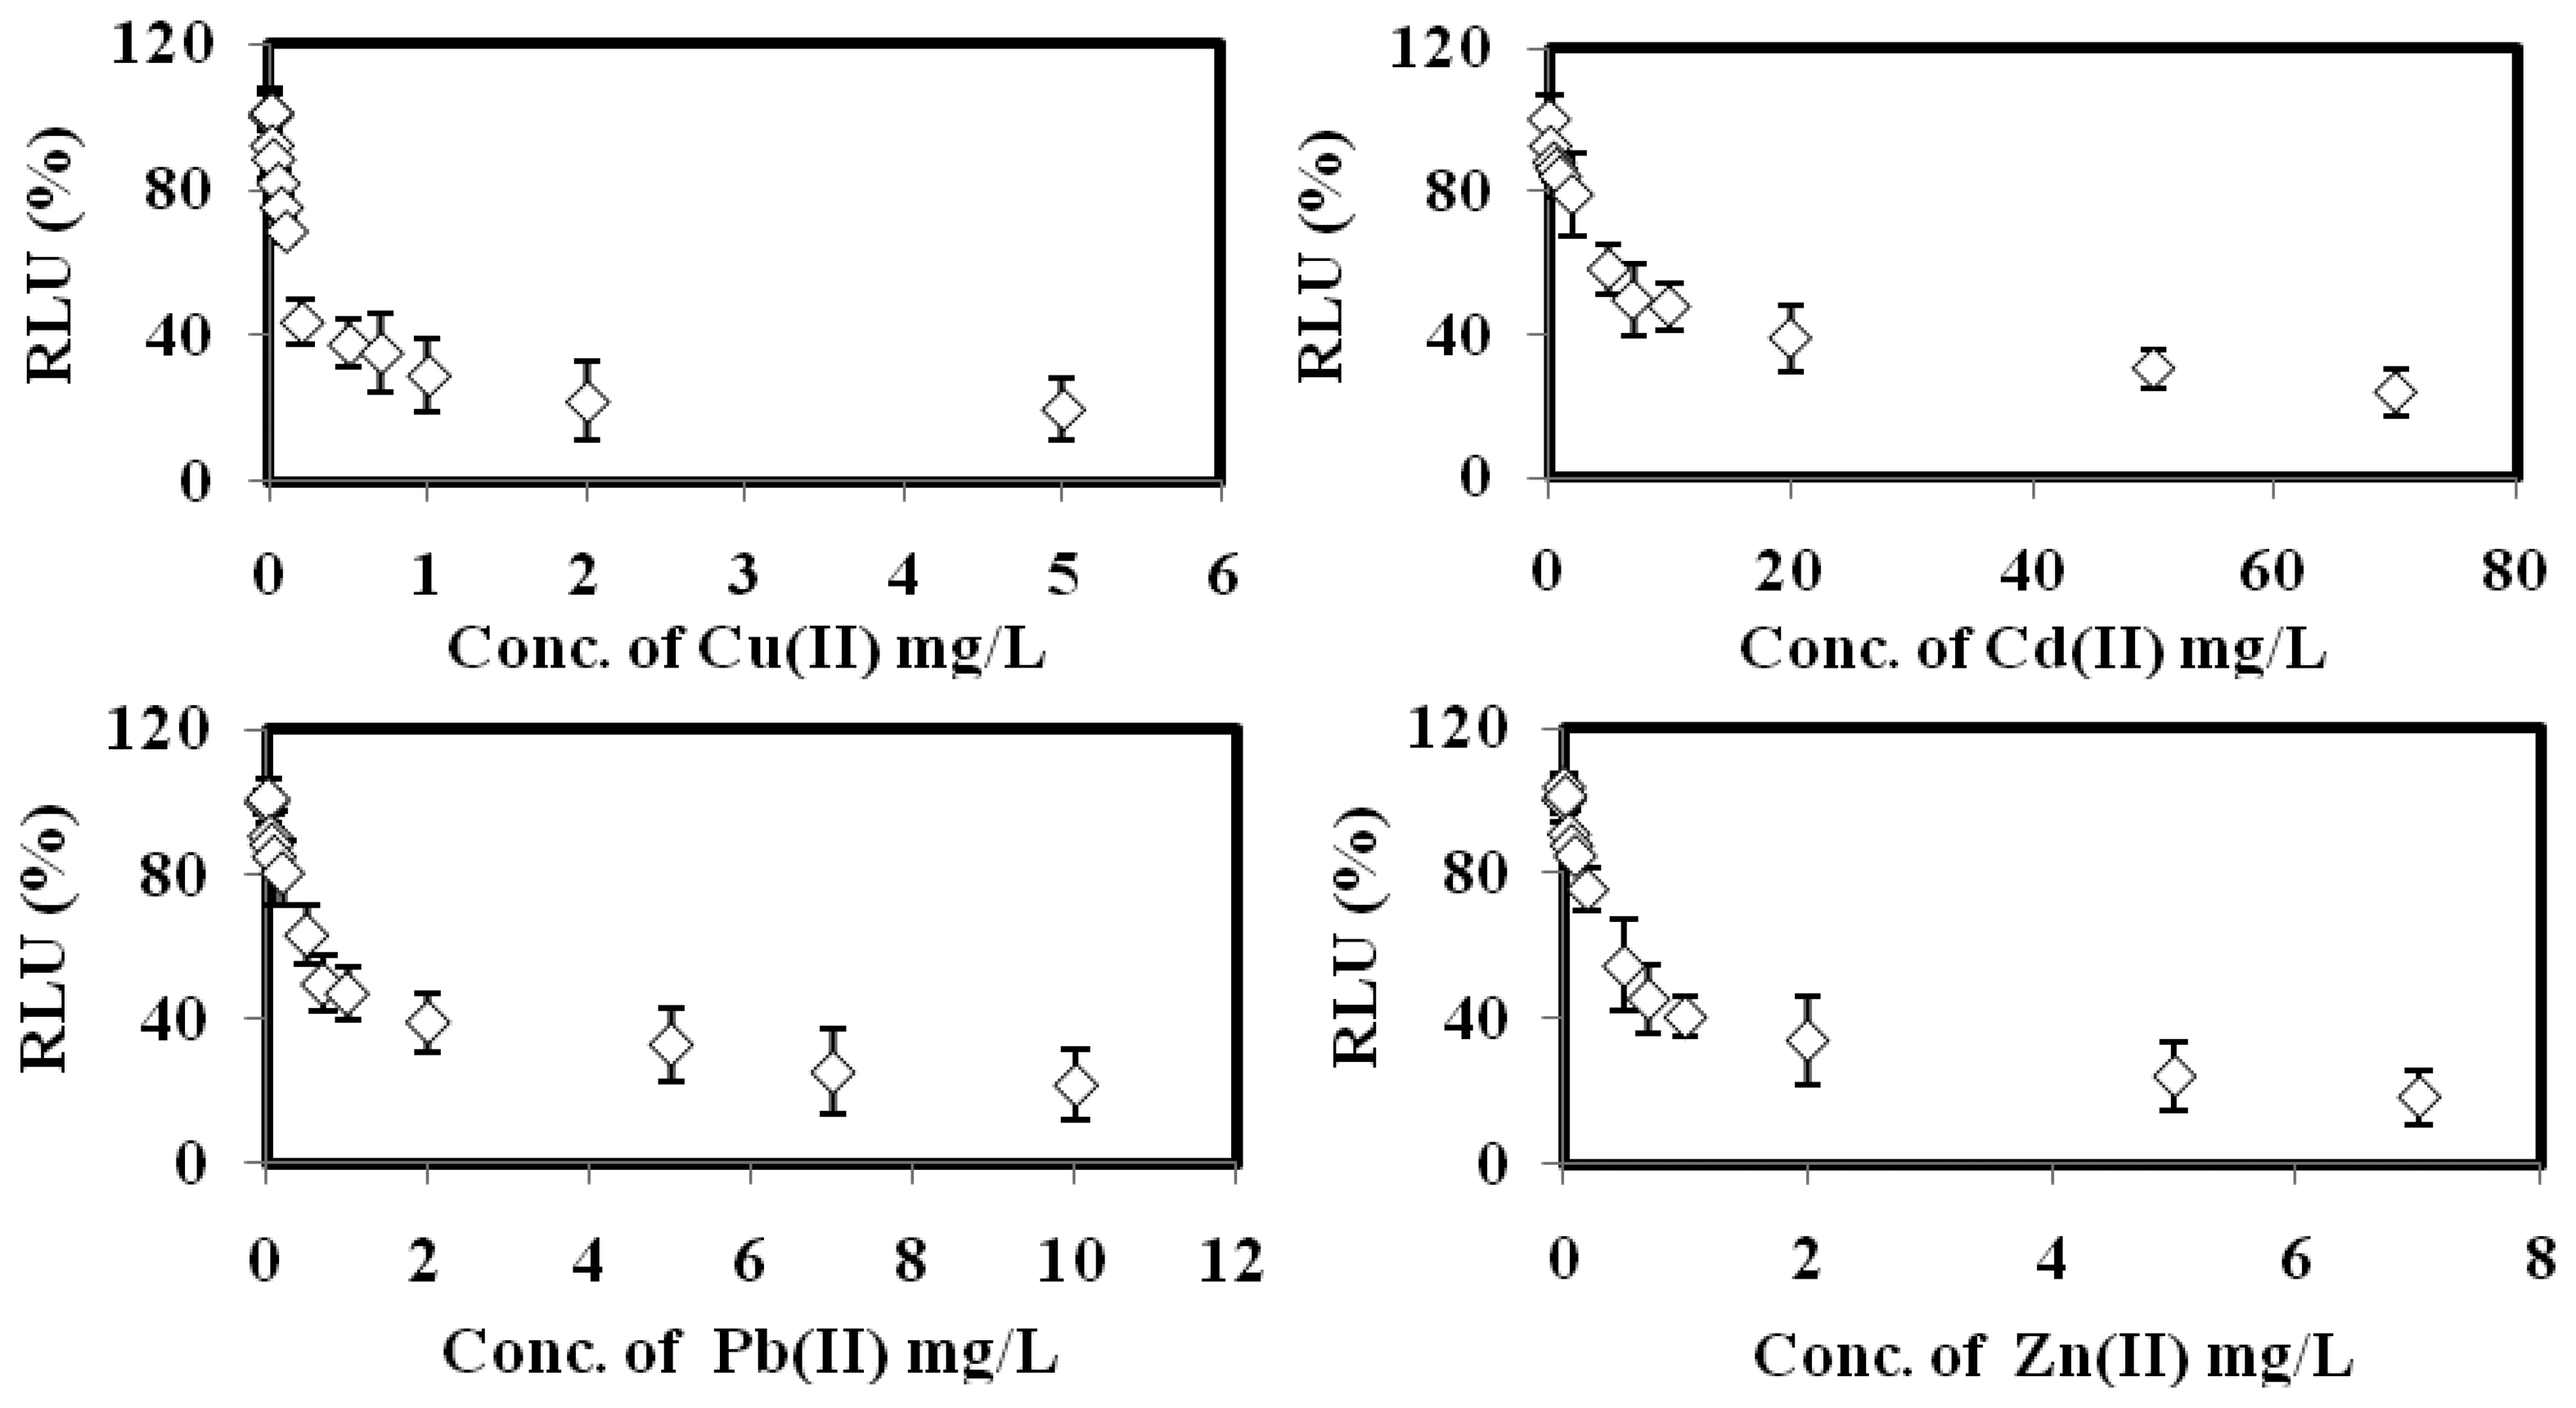
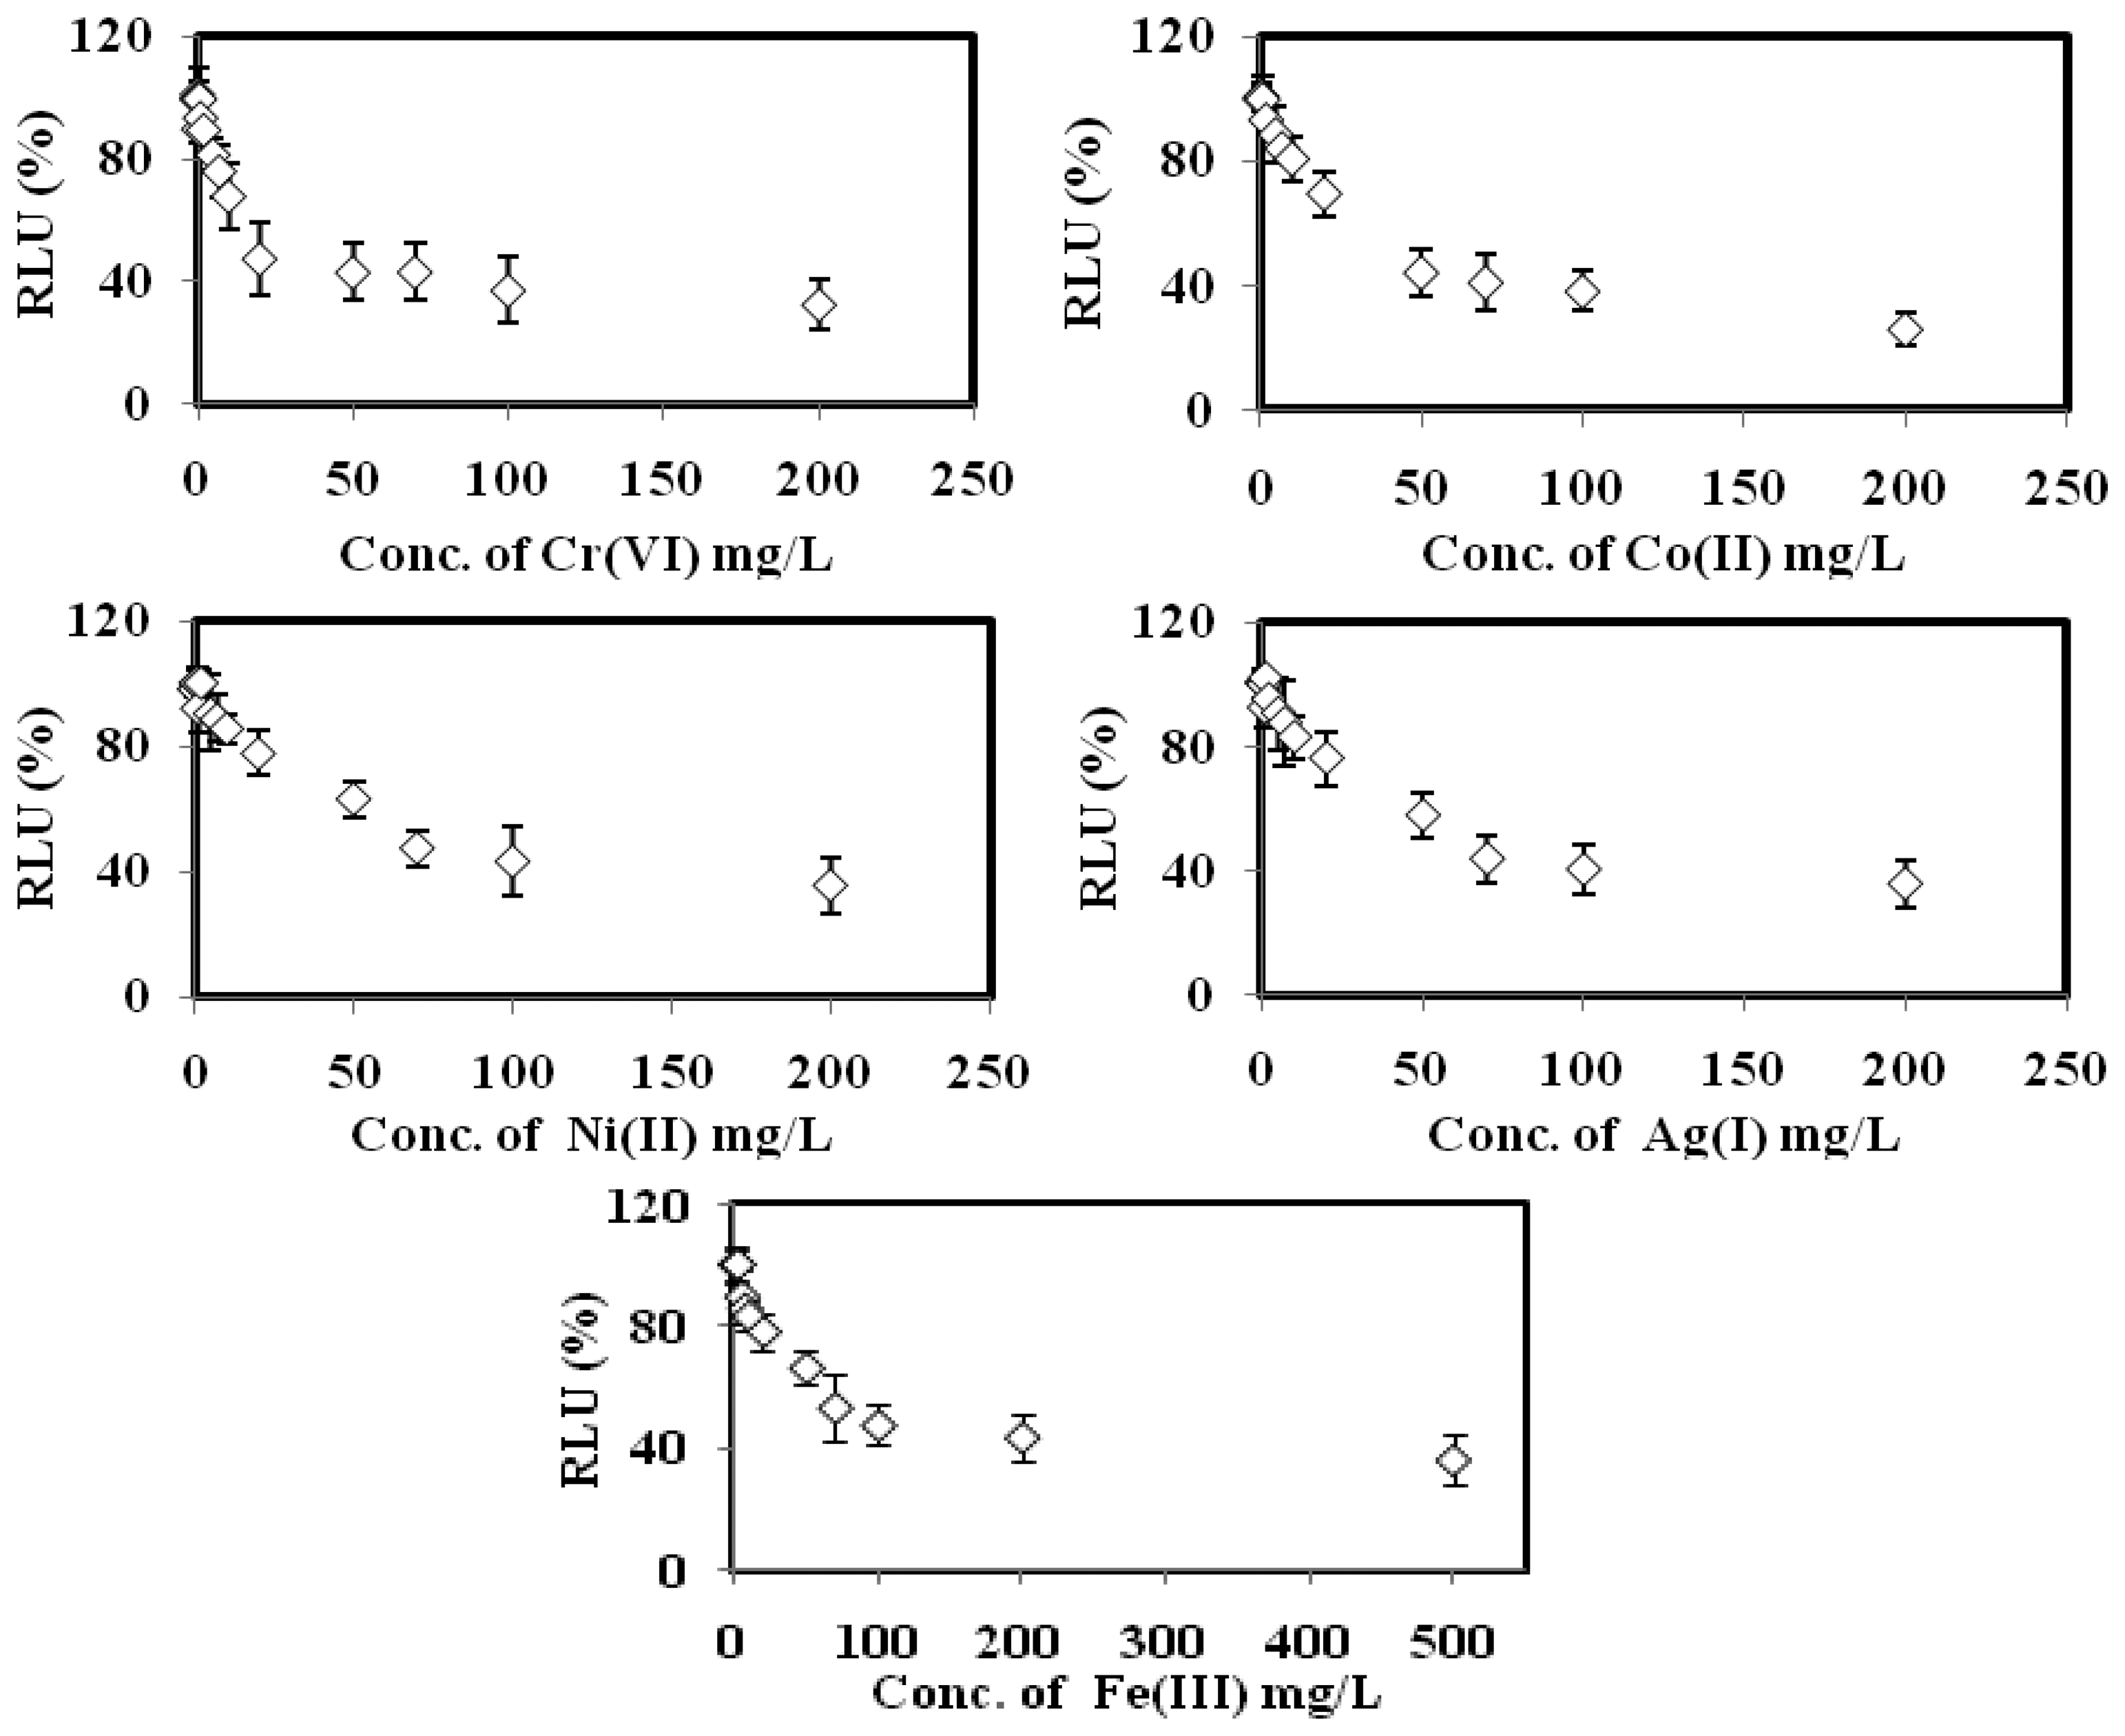
The bioluminescent sensor response towards the toxicities of Cu(II), Cd(II), Pb(II), Zn(II) Cr(VI), Co(II), Ni(II), Ag(I) and Fe(III), respectively, are displayed in Figure 5. The biosensor gave 100% RLU when it was free of toxicant. When the microbial toxicity biosensor exposed to the various concentrations of the respective heavy metals, the bacterial bioluminescent reaction was disrupted, and hence the bioluminescence signal was reduced with the increasing individual toxicant concentration [24,25].
Based on the data listed in Table 2, the toxicity optode based on A. fischeri demonstrated higher sensitivity towards Cu(II), Cd(II), Pb(II) and Zn(II) ions with 10–700 mg/L calibration range and limit of detection (LOD) below 0.32 mg/L. The relatively low EC50 values obtained for these heavy metal ions between 0.17 mg/L and 6.3 mg/L indicate that a small amout of these toxicants is sufficient to inhibit the microbial biosensor. The biosensor sensitivity sequence for heavy metal toxicity was found to be: Cu(II) > Zn(II) > Pb(II) > Cd(II) > Cr(IV) > Co(II) > Ag(I) > Ni(II) > Fe(III). Similar observations were obtained by Hoffman et al. [34] and Salizzato et al. [35], whereby the toxicity assay based on free A. fischeri cells demonstrated the highest sensitivity towards Cu(II) ion in environmental water samples after an incubation period of 30 min.
The toxicity biosensor made from A. fischeri encapsulated in alginate microspheres for fiber optical transduction of bioluminescent events shows better performance in terms of LOD, linear response range and response time when compared to amperometry [36], microplate reader luminometry [19] luminometry [37] and quartz cuvette spectroflourimetry [14,38] transducers using various types of unimmobilized recombinant microorganisms (Table 3).
Likewise for the toxicity assays using immobilized and unimmobilized A. fischeri cells coupled with microplate luminometry [37,40,41], amperometry [39,42], potentiometry [43] and spectrofluorimetry [44] transducers as well as a flow-through fluorescent sensor [45], as most of the previously reported toxicity assays involved long response times [37,40,41,44] and high microbial cell concentrations [45]. The EC50 values obtained for each heavy metal ion tested in this study using A. fischeri-immobilized alginate microspheres are compared with the reported EC50 values in Table 4. The EC50 values for Cu(II), Cd(II), Pb(II), Zn(II), Cr(VI) and Ni(II) ions from this study based on immobilized A. fischeri are found to be lower compared to the reported EC50 values for the respective metal ion toxicities based on unimmobilized A. fischeri bacteria [7], P. viridis mussel [46], I. galbana and Synechococcus sp algae [47] and P. fluorescence bacteria [48]. On the other hand, the reported EC50 values for Cu(II), Cd(II), Pb(II) and Zn(II) toxicities obtained by using P. viridis mussel [46], I. galbana and Synechococcus sp. algae [47], P. fluorescence bacteria [48], D. magna water flea [49], A. fischeri bacteria [50], A. fischeri and J. lividum (pUTluxAB) bacteria [6], C. reinhardtii and P. subcapitata algae [51], P aeruginosa bacteria [52], A. tonsa animalia [53], Synechocystis sp bacteria [54], A. cepa plant [55] and L. quadridentata algae [56] are appeared to be better then the EC50 values for the equivalent heavy metal toxicities using the proposed luminescent microbiosensor based on immobilized A. fischeri. However, the reported biotoxicity assays are very much dependent on free bacterial cells, long incubation times, high consumption of chemicals and the sensors are non-regenerable.
3.6. Effect of Toxicant Mixture on the Whole Cell Biosensor Response
For toxicity study using toxicant mixtures of Cu(II), Cd(II), Pb(II) and Zn(II) at various combinations and concentration ratios, the luminescent A. fischeri microoptode showed 100% antagonistic results (Table 5), which indicates antagonistic reactions occurred between toxic mixtures and the microbial cells. The different metal ions undergo intra-interactions before acting as Lewis acids to interact with the active sites of the bacterial cells (Lewis bases), and inhibit the cell metabolism reactions [7,57,58]. Consequently, lower toxicity levels are imparted to the bacteria cell.
As the bacterial cells experienced lower toxicity levels from the toxicant cocktails, a decrease in the the inhibition effect to immobilized A. fischeri cell resulted in a decrease of the EC50 values for the toxicant mixtures as compared to the EC50 values of the respective individual toxicants. Schmitz et al. [59] also reported about 90% antagonistic interactions in their toxicity assay using Pseudmonas putida dan V fischeri for Cd(II), Hg(II) and Pb(II) toxicity mixture detection. Levidium sativum and Spirodela polyrrhiza have also been used for antagonistic determination of Ni(II), Cr(VI) and Cu(II) toxic cocktails at 94% antagonistic level [60].
3.7. Biosensor Use for River Water Toxicity Evaluation
Tables 6 and 7 show the data for accordance between the results for Cu(II), Cd(II), Pb(II) and Zn(II) ions spiked into Langat River water and Jeram landfill leachate water samples by both the developed A. fischeri-based biosensor and the AAS method. The accordance values for the toxicity biosensor in the range of 82.7%–111.5% were found to be consistent with those of the AAS method (85%–108%). A statistical t-test based on the Miller and Miller method has been applied to compare the concentrations of Cu(II), Cd(II), Pb(II) and Zn(II) ions spiked in the Langat River water and Jeram landfill leachate obtained by using the optical toxicity biosensor and the conventional AAS method [61]. Based on the calculated t values (Tables 6 and 7), there were no significant differences between the metal ion concentrations determined by both methods. The results of the microbial biosensor based on A. fischeri was also in good agreement with AAS standard method for the determination of Cu(II), Cd(II), Pb(II) and Zn(II) ions in environmental water samples based on the satisfactory correlation coefficient (R2) values obtained in the range of 0.9956–0.9998 between the developed toxicity biosensor and AAS method (calibration slopes = 0.955–1.028).
However, further work is needed to improve the LOD values for Pb(II) and Cd(II) ions since the biosensor is intended to be applied for evaluation of environmental waters. This is because the limits for Pb(II) and Cd(II) ions' concentrations in drinking water advocated by the World Helth Organization (WHO) are 10 μg/L and 3 μg/L, respectively [62].
4. Conclusions
A toxicity biosensor based on A. fischeri immobilized in alginate microspheres has been successfully developed to detect heavy metal toxicity in environmental water samples. The bioluminescent toxicity biosensor is sensitive to heavy metal toxicity. It can be reused for toxicity evaluation at least 8 times and gives reproducible results. The microbial biosensor is highly stable and could be used to detect of heavy metals in environmental waters after short incubation times compared to common toxicity bioassay methods. The analytical performance of the biosensor is comparable with the conventional ASS method for heavy metal detection, therefore, the proposed toxicity biosensor based on A. fischeri has good potential to detect heavy metals in environmental water samples.
Acknowledgments
We gratefully acknowledge financial support from the Malaysian Ministry of Sciences, Technology and Innovation (MOSTI) through research grants 04-01-02-SF0418 and UKM via research grants DIP-2012-11 and DPP-2014-060. Encouragement from the Malaysia-Japan AsiaCore Programme in this research is very much appreciated.
Author Contributions
All the authors contributed partially towards this research in terms of conducting experiments, data analysis and interpretation of the results.
Conflicts of Interest
The authors declare no conflict of interest.
References
- Duffus, J. Heavy metals—A meaningless term; chemistry and human health division clinical chemistry section commission on toxicology. Pure Appl. Chem. 2002, 74, 793–807. [Google Scholar]
- Barbosa, J.S.; Cabral, T.M.; Ferreira, D.N.; Agnez-Lima, L.F.; de Medeiros, S.R.B. Genotoxicity assessment in aquatic environment impacted by the presence of heavy metals. Ecotox. Environ. Saf. 2009, 73, 320–325. [Google Scholar]
- Demirak, A.; Yilmaz, F.; Tuna, A.L.; Ozdemir, N. Heavy metals in water, sediment and tissues of Leuciscus cephalus from a stream in southwestern Turkey. Chemosphere 2006, 63, 1451–1458. [Google Scholar]
- Harikumar, P.S; Nasir, U.P. Ecotoxicological impact assessment of heavy metals in core sediments of a tropical estuary. Ecotox. Environ. Saf. 2010, 73, 1742–1747. [Google Scholar]
- Nadella, S.R.; Fitzpatrick, J.L.; Franklin, N.; Bucking, C.; Smith, S.; Wood, C.M. Toxicity of dissolved Cu, Zn, Ni and Cd to developing embryos of the blue mussel (Mytilus trossolus) and the protective effect of dissolved organic carbon. Comparat. Biochem. Physio. Part C 2009, 149, 340–348. [Google Scholar]
- Cho, J.-C.; Park, K.-J.; Ihm, H.-S.; Park, J.-E.; Kim, S.-Y.; Kang, I.; Lee, K.-H.; Jahng, D.; Lee, D.-H.; Kim, S.-J. A novel continuous toxicity test system using a luminously modified freshwater bacterium. Biosens. Bioelectron. 2004, 20, 338–344. [Google Scholar]
- Fulladosa, E.; Murat, J.-C.; Villaescusa, I. Study on the toxicity of binary equitoxic mixtures of metals using the luminescent bacteria Vibrio fischeri as a biological target. Chemosphere 2005, 58, 551–557. [Google Scholar]
- Macken, A.; Giltrap, W.; Ryall, K.; Foley, B.; McGovern, E.; McHugh, B.; Davoren, M. A test battery approach to the ecotoxicological evaluation of cadmium and copper employing a battery of marine bioassays. Ecotoxicology 2009, 18, 470–480. [Google Scholar]
- Tsiridis, V.; Petala, M.; Samaras, P.; Hadjispyrou, S.; Sakellaropoulos, G.; Kungolos, A. Interactive toxic effects of heavy metals and humic acids on Vibrio fischeri. Ecotox. Environ. Saf. 2006, 63, 158–167. [Google Scholar]
- Liao, V.; Chien, M.; Tseng, Y.; Ou, T. Assessment of heavy metal bioavailability in contaminated sediments and soils using green fluorescence protein-based bacterial biosensors. Environ. Pollut. 2006, 142, 17–23. [Google Scholar]
- Arias-Barreiro, C.R.; Okazaki, K.; Koutsaftis, A.; Inayat-Hussain, S.H.; Tani, A.; Katsuhara, M.; Kimbara, K.; Mori, I.C. A bacterial biosensor for oxidative stress using the constitutively expressed redox-sensitive protein roGFP2. Sensors 2010, 10, 6290–6306. [Google Scholar]
- Riether, K.B.; Dollard, M.A.; Billard, P. Assessment of heavy metal bioavailability using Escherichia coli zntAp::lux and copAp::lux-based biosensors. Appl. Microbiol. Biotech. 2001, 57, 712–716. [Google Scholar]
- Lajoie, C.A.; Lin, S-C.; Nguyen, H.; Kelly, C.J. A toxicity testing protocol using a bioluminescent reporter bacterium from activated sludge. J. Microb. Meth. 2002, 50, 273–282. [Google Scholar]
- Chakraborty, T.; Babu, P.G.; Alam, A.; Chaudhari, A. GFP expressing bacterial biosensor to measure lead contamination in aquatic environmental. Curr. Sci. 2008, 94, 800–805. [Google Scholar]
- Harms, H. Biosensing of heavy metals. Microbiol. Monogr. 2007, 6, 143–157. [Google Scholar]
- Roger, K.R. Biosensor for environmental applications. Biosen. Bioelectron. 1995, 10, 533–541. [Google Scholar]
- Leth, S.; Maltoni, S.; Simkus, R.; Mattiasson, B.; Corbisier, P.; Klimant, I.; Wolfbeis, O.S.; Csregi, E. Engineered bacteria based biosensors for monitoring bioavailable heavy metals. Electroanalysis 2002, 14, 35–42. [Google Scholar]
- Shing, W.L.; Surif, S.; Heng, L.Y. Toxicity biosensor for the evaluation of cadmium toxicity based on photosynthetic behaviour of cyanobacteria Anabeana torulosa. Asian J. Biochem. 2008, 3, 162–168. [Google Scholar]
- Corbisier, P.; van der Lelie, D.; Borremans, B.; Provoost, A.; de Lorenzo, V.; Brown, N.L.; Lloyd, J.R.; Hobman, J.L.; Csoregi, E.; Johansson, G.; et al. Whole cell- and protein-based biosensors for the detection of bioavailable heavy metals in environmental samples. Anal. Chim. Acta 1999, 387, 235–244. [Google Scholar]
- Chaudhary, A.; Raina, M.; Srivastava, R. Fluorescent Dissolved-Core Alginate Microsphere Glucose Biosensors, XVII International Conference on Bioencapsulation, Groningen, The Netherlands; 2009.
- Prasad, J.; Joshi, A.; Jayant, R.D.; Srivastava, R. Cholesterol biosensors based on oxygen sensing alginate-silica microspheres. Biotech. Bioeng. 2001, 108, 2011–2021. [Google Scholar]
- Swati, M.; Srivastava, R. Polyelectrolyte coated alginate microspheres for optical urea sensing. Proceedings of the 9th Nanotechnology Conference, Genoa, Italy, 26–30 July 2009.
- Parvez, S.; Venkataraman, C.; Mukherji, S. A review on advantages of implementing luminescence inhibition test (Vibrio fischeri) for acute toxicity prediction of chemical. Environ. Internat. 2006, 32, 265–268. [Google Scholar]
- Girotti, S.; Ferri, E.N.; Fumo, M.G.; Maiolini, E. Monitoring of environmental pollutants by bioluminescent bacteria. Anal. Chim. Acta 2008, 608, 2–29. [Google Scholar]
- Hao, W.; Li, Q.; Zhang, J.; Jiang, Y.; Liang, W. Utility of nematode Acrobeloides nanus for assessing subacute toxicity of heavy metals. Environ. Monit. Assess. 2009, 164, 273–278. [Google Scholar]
- Kim, B.C.; Gu, M.B. A bioluminescent sensor for high throughput toxicity classification. Biosen. Bioelectron. 2003, 18, 1015–1021. [Google Scholar]
- Gill, G.C.; Mitchell, R.J.; Chang, S.T.; Gu, M.B. A biosensor for the detection of gas toxicity using a recombinant bioluminescent bacterium. Biosen. Bioelectron. 2000, 15, 23–30. [Google Scholar]
- Sumner, J.; Westberg, N.M.; Stoddard, A.K.; Hurst, T.K.; Cremer, M.; Thompson, R.B.; Fierke, C.A.; Kopelman, R. DsRed a highly sensitive, selective and reversible fluorescence-based biosensor for both Cu+ and Cu2+ ions. Biosens. Bioelectron. 2006, 21, 1302–1308. [Google Scholar]
- Southward, G.M.; Klein, D. Effects of pH on Prymnesium parvum cell viability and toxicity. In Management of Prymnesium Parvum at Texas State Fish Hatcheries; Texas Parks and Wildlife: Dallas, TX, USA, 2005; Chapter 6. [Google Scholar]
- Campbell, T.N.; Choy, F.Y.M. The effect of pH on green fluorescent protein: A brief review. Mol. Biol. Tod. 2001, 1, 1–4. [Google Scholar]
- Sinclair, G.M.; Paton, G.I.; Meharg, A.A.; Killham, K. Lux-biosensor assessment of pH effects on microbial sorption and toxicity of chlorophenols. FEMS Microbiol. Lett. 1999, 174, 273–278. [Google Scholar]
- Shu, X.; Kallio, K.; Shi, X.; Abbyad, P.; Kanchanawong, P.; Childs, W.; Boxer, S.G.; Remington, S.J. Ultrafast excited-state in the green fluorescent protein variant S65T/H148D. 1. Mutagenesis and structural studies. Biochemistry 2007, 46, 12005–12013. [Google Scholar]
- Kumar, J.; Jha, S.K.; D'Souza, S.F. Optical microbial biosensor for detection of methyl parathion pesticide using Flavobacterium sp. Whole cell adsorbed on glass fiber filters as disposable biocomponent. Biosen. Bioelectron. 2006, 21, 2100–2105. [Google Scholar]
- Hoffman, C.; Sales, D.; Christofi, N. Combination ecotoxicity and testing of common chemical discharges to sewer using the Vibrio fischeri luminescence bioassay. Internat. Microbiol. 2003, 6, 41–47. [Google Scholar]
- Salizzato, M.; Pavoni, B.; Ghirardini, A.V.; Ghetti, P.F. Sediment toxicity measured using Vibrio fischeri as related to the concentrations of organic (PCBs, PAHs) and inorganic (metals, sulphur) pollutants. Chemosphere 1998, 36, 2949–2968. [Google Scholar]
- Campanella, L.; Favero, G.; Tomassetti, G.F.M. Immobilised yeast cells biosensor for total toxicity testing. Sci. Total Environ. 1995, 171, 227–234. [Google Scholar]
- Ivask, A.; Francois, M.; Kahru, A.; Dubourguier, H.-C.; Virta, M.; Douay, F. Recombinant luminescent bacterial sensors for the measurement of bioavailability of cadmium and lead in soil polluted by metal smelters. Chemosphere 2004, 55, 147–156. [Google Scholar]
- Bondarenko, O.; Rolova, T.; Kahru, A.; Ivask, A. Bioavailability of Cd, Zn, and Hg in soil to nine recombinant luminescent metal sensor bacteria. Sensors 2008, 8, 6899–6923. [Google Scholar]
- Alpat, S.K.; Alpat, S.; Kutlu, B.; Ozbayrak, O.; Buyukisik, H.B. Development of biosorption-based algal biosensor for Cu(II) using Tetraselmis chuii. Sens. Actuators B Chem. 2007, 128, 273–278. [Google Scholar]
- Ivask, A.; Virta, M.; Kahru, A. Construction and use of specific luminescent recombinant bacterial sensor for the assessment of bioavailable fraction of cadmium, zinc, mercury and chromium in the soil. Soil Biol. Biochem. 2002, 32, 1439–1447. [Google Scholar]
- Zlatev, R.; Magnin, J.-P.; Ozil, P.; Stoytcheva, M. Bacterial sensors based on Acidithiobacillus ferrooxidans Part I. Fe2+ and S2O32− determination. Biosen. and Bioelectron. 2006, 21, 1493–1500. [Google Scholar]
- Tibazarwa, C.; Corbisier, P.; Mench, M.; Bossus, A.; Solda, P.; Mergeay, M.; Wyns, Y.; Lelie, D.V.D. A microbial biosensor to predict bioavailable nickel in soil and its transfer to plants. Environ. Pollut. 2001, 113, 19–26. [Google Scholar]
- Verma, N.; Singh, M. A Bacillus sphaericus based biosensor for monitoring nickel ions in industrial effluents and foods. J. Autom. Methods Manag. Chem. 2006, 2006, 1–4. [Google Scholar]
- Stoyanov, J.V.; Magnani, D.; Solioz, M. Measurement of sytoplasmic copper, silver, and gold a lux biosensor shows copper and silver, but no gold, efflux by the Cop A ATPase of Escherichia coli. FEBS Lett. 2003, 254, 391–394. [Google Scholar]
- Pulido-Tofino, P.; Barrero-Moreno, J.M.; Perez-Conde, M.C. A flow-through fluorescent sensor to determine Fe(III) and total inorganic iron. Talanta 2000, 51, 537–545. [Google Scholar]
- Yap, C.K.; Ismail, A.; Omar, H.; Tan, S.G. Toxicities and tolerances of Cd, Cu, Pb and Zn in a primary producer (Isochrysis galbana) and in a primary consumer (Perna viridis). Environ. Internat. 2004, 29, 1097–1104. [Google Scholar]
- Satoh, A.; Vudikaria, L.Q.; Kurano, N.; Miyachi, S. Evaluation of the sensitivity of marine microalgal strains to the heavy metals, Cu, As, Sb, Pb and Cd. Environ. Internat. 2005, 31, 713–722. [Google Scholar]
- Dawson, J.J.C.; Campbell, C.D.; Towers, W.; Cameron, C.M.; Paton, G.I. Linking biosensor responses to Cd, Cu, and Zn partitioning in soils. Environ. Pollut. 2006, 142, 493–500. [Google Scholar]
- Yim, J.H.; Kim, K.W.; Kim, S.D. Effect of hardness on acute toxicity of metal mixtures using Daphnia magna: Prediction of acid mine drainage toxicity. J. Hazard. Mater. B 2006, 138, 16–21. [Google Scholar]
- Hsieh, C.-H.; Tsaib, M.-H.; Ryan, D.K.; Pancorbo, O.C. Toxicity of the 13 priority pollutant metals to Vibrio fisheri in the Microtox chronic toxicity test. Sci. Total Environ. 2004, 320, 37–50. [Google Scholar]
- Lee, D.-Y.; Fortin, C.; Campbell, P.G.C. Contrasting effects of chloride on the toxicity of silver to two green algae, Pseudokirchneriella subcapitata and Chlamydomonas reinhardtii. Aquat. Toxicol. 2005, 75, 127–135. [Google Scholar]
- Chen, B.-Y.; Wu, C.-H.; Chang, J.-S. An assessment of the toxicity of metals to Pseudomonas aeruginosa PU21 (Rip64). Bioresour. Technol. 2006, 97, 1880–1886. [Google Scholar]
- Pedrosa, M.S.; Pinho, G.L.L.; Rodrigues, S.C.; Bianchini, A. Mechanism of acute silver toxicity in the euryhaline copepod Acartia tonsa. Aquat. Toxicol. 2007, 82, 173–180. [Google Scholar]
- Demirel, S.; Ustun, B.; Aslim, B.; Suludere, Z. Toxicity and uptake of Iron ions by Synechocystis sp. E35 isolated from Kucukcekmece Lagoon, Istanbul. J. Hazard. Mater. 2009, 171, 710–716. [Google Scholar]
- Yıldız, M.; Cigerci, I.H.; Konuk, M.; Fidan, A.F.; Terzi, H. Determination of genotoxic effects of copper sulphate and cobalt chloride in Allium cepa root cells by chromosome aberration and comet assays. Chemosphere 2009.
- Guzman, F.T.; Gonzalez, F.J.A.; Martınez, R.R. Implementing Lecane quadridentata acute toxicity tests to assess the toxic effects of selected metals (Al, Fe and Zn). Ecotoxicol. Environ. Saf. 2010, 73, 287–295. [Google Scholar]
- Fernández-Alba, A.R.; Hernando, M.D.; Piedra, L.; Chisti, Y. Toxicity evaluation of single and mixed antifouling biocides measured with acute toxicity bioassays. Anal. Chim. Acta 2002, 456, 303–312. [Google Scholar]
- Tomasik, P.; Magadza, C.M.; Mhinz, A.S.; Chirume, A.; Zaranyika, M.F.; Muchiriri, S. The metal-metal interaction in biological systems. Part IV. Freshwater snail Bulinus globosus. Water Air Soil Pollut. 1995, 83, 123–127. [Google Scholar]
- Schmitz, R.P.H.; Eisentrager, A.; Dott, W. Agonistic and antagonistic toxic effect observed with miniaturized growth and luminescence inhibition assays. Chemosphere 1999, 38, 79–95. [Google Scholar]
- Montvydienė, D.; Marčiulionienė, D. Assessment of Toxic Interaction of Metals in Binary Mixtures Using Lepidium sativum and Spirodela Polyrrhiza. Pol. J. Environ. Stud. 2007, 16, 777–783. [Google Scholar]
- Miller, J.N.; Miller, J.C. Statistics and Chemometrics for Analytical Chemistry, 5th ed.; Pearson Prentice Hall: London, UK, 2005. [Google Scholar]
- World Health Organization (WHO). Guidelines for Drinking Water Quality Second Addendum to Third Edition; World Health Organization: Geneva, Switzerland, 2008; Chapter 8. [Google Scholar]


| Heavy Metals | Concentrations (μg/L) | Repeatability n = 8, RSD (%) | Reproducibility n = 8, RSD (%) |
|---|---|---|---|
| Cu(II) | 20 | 2.4 | 5.6 |
| 70 | 4.5 | 4.4 | |
| Cd(II) | 500 | 5.7 | 4.7 |
| 1000 | 5.4 | 5.3 | |
| Pb(II) | 70 | 3.7 | 3.3 |
| 200 | 3.2 | 2.8 | |
| Zn(II) | 70 | 5.3 | 3.6 |
| 200 | 5.5 | 4.9 | |
| Heavy Metal Ion | Dynamic Range (μg/L) | LOD (μg/L) | Slope(% RLU/μg/L) | EC50 (μg/L) | R2 |
|---|---|---|---|---|---|
| Cu(II) | (0.1 − 2) × 102 | 6.40 | −0.2512 | 1.7 × 10² | 0.999 |
| Cd(II) | (0.2 − 5) × 103 | 1.56 × 10² | −0.0072 | 6.3 × 10³ | 0.998 |
| Pb(II) | (0.5 − 7) × 102 | 0.47 × 10² | −0.0601 | 7.0 × 10² | 0.996 |
| Zn(II) | (0.5 − 7) × 102 | 0.32 × 10³ | −0.0700 | 6.0 × 10² | 0.996 |
| Cr(VI) | (0.1 − 2) × 104 | 0.10 × 10⁴ | −0.0024 | 1.8 × 10⁴ | 0.992 |
| Co(II) | (0.2 − 5) × 104 | 0.17 × 10⁴ | −0.0010 | 3.2 × 10⁴ | 0.939 |
| Ni(II) | (0.5 − 7) × 104 | 0.28 × 10⁴ | −0.0006 | 6.6 × 10⁴ | 0.988 |
| Ag(I) | (0.2 − 7) × 104 | 0.18 × 10⁴ | −0.0007 | 6.0 × 10⁴ | 0.986 |
| Fe(III) | (0.5 − 7) × 104 | 0.31 × 10⁴ | −0.0005 | 7.0 × 10⁴ | 0.984 |
| Heavy Metal | Biological Component | Immobilization Matrix | Dynamic Range (μg/L) | LOD (μg/L) | Time (min) | Reference |
|---|---|---|---|---|---|---|
| Cu(II) | A. fischeri | Alginate microsphere | (10.0 − 200.0) | 6.4 | 6 | This work |
| S. cereviceae | Agar gel Agarose | (3.4 − 26.9) × 104 | 1.3 × 10⁴ | 8 | [36] | |
| E. coli (Alux) | Carbon paste | (0.1 − 1.3) × 103 | 0.1 × 10³ | 90 | [19] | |
| Circinella sp. | electrode | (6.7 − 134.0) | 0.1 | 30 | [39] | |
| Cd(II) | A. fischeri | Alginate microsphere | (0.2 − 5.0) × 103 | 156 | 6 | This work |
| S. cereviceae | Agar gel | (4.6 − 45.8) × 103 | 1.8 x 10³ | 8 | [36] | |
| E. coli (Alux) | Free culture | (0.1 − 1.0) × 102 | 12 | 120 | [37] | |
| Pb(II) | A. fischeri | Alginate microsphere | (0.5 − 70.0) × 102 | 47 | 6 | This work |
| S. cereviceae | Agarose | (6.9 − 417.0) × 103 | 2.8 × 10³ | 8 | [36] | |
| E. coli (Alux) | Free culture | (1.0 − 8.0) × 102 | 12 | 30 | [37] | |
| E. coli GFP | Free culture | (0.2 − 82.8) × 103 | 0.2 × 10³ | 720 | [14] | |
| Zn(II) | A. fischeri | Alginate microsphere | (0.5 − 7.0) × 102 | 32 | 8 | This work |
| E. coli (Alux) | Free culture | (0.03 − 8.0) × 105 | 2.6 × 10³ | 120 | [37] | |
| E. coli (Alux) | Free culture | (0.4 − 2.5) × 103 | 0.4 × 10³ | 120 | [38] | |
| Cr(VI) | A. fischeri | Alginate microsphere | (0.1 − 2.0) × 104 | 1.0 × 10³ | 6 | This work |
| S. cerevisiae | Agarose | (26 − 104) × 103 | 10.4 × 10³ | 5 | [36] | |
| E. coli (luxAB) | Free culture | - | 2.0 | 15 | [40] | |
| A ferrooxidans | Cellulose membrane | (0.02 − 118) × 103 | 18.0 | 1 | [41] | |
| Co(II) | A. fischeri | Alginate microsphere | (2.0 − 50.0) × 103 | 1.7 × 10³ | 6 | This work |
| R. eutropha | Free culture | (0.5 − 23.6) × 103 | 0.5 × 10³ | 30 | [42] | |
| Ni(II) | A. fischeri | Alginate microsphere | (5.0 − 70.0) × 103 | 2.8 × 10³ | 6 | This work |
| R. eutropha | Free culture | (0.2 − 17.5) × 102 | 29.0 | 30 | [42] | |
| B. Sphaericus | Whatman membrane | 2.0 − 40.0 | 0.02 | 1.5 | [43] | |
| Ag(I) | A. fischeri | Alginate microsphere | (0.2 − 7.0) × 104 | 1.8 × 10³ | 6 | This work |
| E. coli (lux) | Free culture | - | 17 | 120 | [44] | |
| Fe(III) | A. fischeri | Alginate microsphere | (5.0 − 70.0) × 103 | 3.1 × 10³ | 6 | This work |
| P fluorescence | Control pore glass | 3.0 − 200.0 | 3.0 | 5 | [45] | |
| A ferrooxidans | Cellulose membrane | (0.22 − 6050) × 102 | 22.0 | 1 | [41] | |
| EC50 Value (μg/L) | Time (min) | Reference | ||||||||
|---|---|---|---|---|---|---|---|---|---|---|
| Cu(II) | Cd(II) | Pb(II) | Zn(II) | Cr(VI) | Co(II) | Ni(II) | Ag(I) | Fe(III) | ||
| 0.17 ×10³ | 0.63 × 10⁴ | 0.70 × 10³ | 0.60 × 10³ | 1.8 × 10⁴ | 6.6 × 10⁴ | 6.6 × 10⁴ | 6.0 × 10⁴ | 7.0 × 10⁴ | 6 | This work |
| 0.25 × 10³ | 0.74 × 10³ | 1.40 × 10³ | - | - | - | - | - | - | 1440 | [47] |
| - | 1.10 × 10⁴ | - | 0.86 × 10³ | - | - | - | - | - | 4320 | [7] |
| 4.20 × 10³ | 2.90 × 10³ | 4.20 × 10³ | - | - | - | - | - | - | 2880 | [47] |
| 4.40 × 10⁴ | 1.20 × 10⁴ | - | 0.65 × 10² | - | - | - | - | - | 15 | [48] |
| - | - | 0.95 × 10² | 0.30 × 10³ | - | - | - | - | - | 2880 | [49] |
| - | - | - | - | 1.2 × 10⁴ | - | 9.3 × 10⁴ | 7.9 | - | 15 | [50] |
| - | - | - | - | 7.5 × 10³ | 1.6 × 10⁴ | 2.7 × 10² | - | 9.2 × 10³ | 15 | [6] |
| - | - | - | - | - | - | - | 2.0 | - | 360 | [51] |
| - | - | - | - | - | 1.5 × 10² | - | - | - | 2880 | [52] |
| - | - | - | - | - | - | 0.3 × 10² | 1.7 × 10² | - | 2880 | [53] |
| - | - | - | - | - | - | - | - | 5.4 × 10³ | 5760 | [54] |
| - | - | - | - | - | 5.5 × 10³ | - | - | - | 5760 | [55] |
| - | - | - | - | - | - | - | - | 7.5 × 10² | 2880 | [56] |
| Toxicant Mixture | AI | Toxicity Rate |
|---|---|---|
| (1:1 w/w) | ||
| Pb(II) + Zn(II) | −2.716 | Antagonistic |
| Cu(II) + Zn(II) | −0.892 | Antagonistic |
| Cu(II) + Pb(II) | −0.867 | Antagonistic |
| Cd(II) +Zn(II) | −0.397 | Antagonistic |
| Cd(II) + Pb(II) | −0.906 | Antagonistic |
| Cd(II) + Cu(II) | −0.271 | Antagonistic |
| (2:1 w/w) | ||
| Pb(II) + Zn(II) | −2.168 | Antagonistic |
| Cu(II) + Zn(II) | −0.346 | Antagonistic |
| Cu(II) + Pb(II) | −0.324 | Antagonistic |
| Cd(II) +Zn(II) | −1.556 | Antagonistic |
| Cd(II) + Pb(II) | −2.755 | Antagonistic |
| Cd(II) + Cu(II) | −0.261 | Antagonistic |
| (1:2 w/w) | ||
| Pb(II) + Zn(II) | −1.499 | Antagonistic |
| Cu(II) + Zn(II) | −1.032 | Antagonistic |
| Cu(II) + Pb(II) | −0.795 | Antagonistic |
| Cd(II) +Zn(II) | −0.782 | Antagonistic |
| Cd(II) + Pb(II) | −0.517 | Antagonistic |
| Cd(II) + Cu(II) | −2.450 | Antagonistic |
| (1:1:1 to 1:1:1:1 w/w) | ||
| Cu(II) + Cd(II) + Pb(II) | −2.811 | Antagonistic |
| Cu(II) + Cd(II) + Zn(II) | −2.894 | Antagonistic |
| Cd(II) + Pb(II) + Zn(II) | −1.285 | Antagonistic |
| Cu(II) + Cd(II) + Pb(II) + Zn(II) | −5.447 | Antagonistic |
| Heavy Metal | Added (μg/L) | Biosensor (n = 3) | AAS (n = 3) | Calculated t-test | ||
|---|---|---|---|---|---|---|
| Found (μg/L) | Accordance (%) | Found (μg/L) | Accordance (%) | |||
| Cu(II) | 0 | 17.71 ± 1.24 | - | 18.14 ± 1.32 | - | 0.317 |
| 20 | 36.69 ± 3.20 | 94.90 | 37.58 ± 2.54 | 97.20 | 0.201 | |
| 50 | 59.04 ± 10.69 | 82.66 | 61.58 ± 4.14 | 86.88 | 0.509 | |
| 70 | 80.22 ± 10.47 | 89.30 | 83.28 ± 5.08 | 93.06 | 0.842 | |
| 90 | 103.85 ± 16.26 | 95.71 | 106.92 ± 8.06 | 98.64 | 0.416 | |
| 100 | 123.16 ± 22.51 | 105.45 | 120.68 ± 9.40 | 102.68 | 0.354 | |
| Cd(II) | 0 | 303.86 ± 11.75 | - | 297.09 ± 1.58 | - | 0.959 |
| 200 | 515.91 ± 20.20 | 106.03 | 503.83 ± 13.90 | 103.37 | 0.307 | |
| 500 | 785.30 ± 55.77 | 96.29 | 791.20 ± 36.77 | 98.82 | 0.238 | |
| 700 | 911.89 ± 90.78 | 86.86 | 946.72 ± 51.38 | 92.80 | 0.902 | |
| 900 | 1133.98 ± 112.11 | 92.23 | 1094.93 ± 68.28 | 88.65 | 1.249 | |
| 1000 | 1189.62 ± 116.51 | 88.58 | 1192.56 ± 81.68 | 89.54 | 0.366 | |
| Pb(II) | 0 | 60.27 ± 1.51 | - | 61.63 ± 2.55 | - | 0.595 |
| 60 | 112.38 ± 7.34 | 86.85 | 115.20 ± 4.66 | 89.28 | 0.770 | |
| 70 | 120.11 ± 18.57 | 85.49 | 126.37 ± 5.11 | 92.48 | 0.447 | |
| 100 | 158.67 ± 23.12 | 98.40 | 158.80 ± 9.30 | 97.17 | 0.114 | |
| 200 | 274.75 ± 41.61 | 107.24 | 271.48 ± 18.52 | 104.92 | 0.152 | |
| 500 | 578.98 ± 55.56 | 103.74 | 567.13 ± 35.48 | 101.10 | 1.035 | |
| Zn(II) | 0 | 55.53 ± 1.75 | - | 54.71 ± 2.02 | - | 0.376 |
| 50 | 103.93 ± 5.92 | 96.80 | 100.58 ± 4.31 | 91.74 | 1.100 | |
| 70 | 114.57 ± 12.39 | 84.34 | 116.08 ± 5.56 | 87.67 | 0.345 | |
| 90 | 152.73 ± 15.04 | 108.00 | 149.62 ± 8.68 | 105.46 | 0.249 | |
| 100 | 167.00 ± 21.09 | 111.47 | 161.85 ± 11.01 | 107.14 | 0.454 | |
| 200 | 265.94 ± 32.11 | 105.21 | 261.24 ± 15.83 | 103.26 | 0.142 | |
Notes: The critical value, t4 = 2.78 (P = 0.05, 95%). The linear equation of [Cu(II)]biosensor versus [Cu(II)AAS, [Cd(II)]biosensor versus Cd(II)AAS, [Pb(II)]biosensor versus [Pb(II)]AAS and [Zn(II)]biosensor versus [Zn(II)]AAS were [Cu]biosensor = 0.9723[Cu]AAS – 2.805, [Cd]biosensor = 1.0282[Cd]AAS − 8.683, [Pb]biosensor = 0.989[Pb]AAS − 0.068 and [Zn]biosensor = 0.9768[Zn]AAS – 0.0541 respectively. the R2 values for Cu(II), Cd(II), Pb(II) and Zn(II) were 0.9968, 0.9956, 0.9993 and 0.9986, respectively. The linear equation used to determine of Cu(II), Cd(II), Pb(II) and Zn(II) concentration were (Y = −0.2604 + 95.063), (Y = −0.0066x + 93.751), (Y = −0.0610x + 92.174) and (Y = −0.0706x + 92.72), respectively.
| Heavy Metal | Added (μg/L) | Biosensor (n = 3) | AAS (n = 3) | Calculated t-test | ||
|---|---|---|---|---|---|---|
| Found (μg/L) | Accordance (%) | Found (μg/L) | Accordance (%) | |||
| Cu(II) | 0 | 11.59 ± 1.16 | - | 11.96 ± 0.96 | - | 0.307 |
| 20 | 29.32 ± 2.73 | 88.65 | 30.43 ± 2.47 | 92.35 | 0.776 | |
| 30 | 36.76 ± 7.64 | 83.90 | 37.98 ± 2.61 | 86.73 | 0.280 | |
| 50 | 63.16 ± 6.19 | 103.08 | 61.83 ± 4.88 | 99.74 | 0.468 | |
| 70 | 85.50 ± 9.95 | 105.59 | 84.45 ± 6.11 | 103.56 | 0.328 | |
| 90 | 99.45 ± 13.03 | 97.62 | 97.03 ± 7.96 | 94.52 | 0.937 | |
| 100 | 108.39 ± 15.24 | 96.80 | 106.85 ± 8.04 | 94.89 | 0.452 | |
| Cd(II) | 0 | 214.21 ± 3.30 | - | 215.103 ± 3.55 | - | 0.241 |
| 200 | 411.35 ± 24.25 | 98.86 | 409.50 ± 14.45 | 97.20 | 0.388 | |
| 300 | 488.97 ± 33.28 | 91.57 | 484.47 ± 23.46 | 89.57 | 0.921 | |
| 500 | 641.49 ± 51.47 | 85.45 | 650.94 ± 42.52 | 87.17 | 0.238 | |
| 700 | 888.01 ± 68.54 | 96.26 | 879.60 ± 47.84 | 94.93 | 0.741 | |
| 900 | 1077.01 ± 95.22 | 95.86 | 1080.03 ± 47.89 | 96.10 | 0.023 | |
| 1000 | 1266.27± 129.12 | 105.21 | 1259.91 ± 83.81 | 104.58 | 0.069 | |
| Pb(II) | 0 | 54.72 ± 1.44 | - | 55.19 ± 1.36 | - | 0.535 |
| 60 | 104.89 ± 11.21 | 83.60 | 106.36 ± 4.41 | 85.28 | 0.217 | |
| 70 | 116.82 ± 13.37 | 88.71 | 118.22 ± 5.87 | 90.04 | 0.175 | |
| 80 | 138.22 ± 17.15 | 104.36 | 137.03 ± 6.51 | 102.30 | 0.137 | |
| 100 | 166.12 ± 21.95 | 111.39 | 163.48 ± 9.58 | 108.28 | 0.349 | |
| 200 | 251.55 ± 23.39 | 98.41 | 247.69 ± 16.52 | 96.25 | 0.262 | |
| 500 | 474.67 ± 67.12 | 94.93 | 532.43 ± 35.91 | 95.45 | 0.066 | |
| Zn(II) | 0 | 64.28 ± 1.43 | - | 63.71 ± 0.87 | - | 0.479 |
| 50 | 110.42 ± 6.71 | 92.28 | 110.72 ± 4.27 | 94.02 | 0.283 | |
| 70 | 131.78 ± 10.26 | 96.41 | 132.44 ± 5.51 | 98.18 | 0.262 | |
| 80 | 132.73 ± 13.65 | 85.56 | 133.45 ± 6.17 | 87.17 | 0.183 | |
| 90 | 142.02 ± 15.37 | 86.37 | 143.32 ± 7.15 | 88.45 | 0.192 | |
| 100 | 155.43 ± 18.25 | 91.15 | 157.62 ± 8.83 | 93.90 | 0.499 | |
| 200 | 274.13 ± 26.29 | 104.92 | 267.60 ±17.03 | 101.95 | 1.077 | |
Notes: The critical value, t4 = 2.78 (P = 0.05, 95%). The linear equation of [Cu(II)]biosensor versus [Cu(II)AAS, [Cd(II)]biosensor versus Cd(II)AAS, [Pb(II)]biosensor versus [Pb(II)]AAS and [Zn(II)]biosensor versus [Zn(II)]AAS were [Cu] biosensor = 0.9589[Cu]AAS − 1.3885, [Cd]biosensor = 0.9965[Cd]AAS − 0.1318, [Pb]biosensor = 1.0057[Pb]AAS − 1.937 and [Zn]biosensor = 0.9546[Zn]AAS − 4.4235, respectively. The R2 values for Cu(II), Cd(II), Pb(II) and Zn(II) were 0.9996, 0.9996, 0.9998 and 0.9991, respectively.
© 2014 by the authors; licensee MDPI, Basel, Switzerland. This article is an open access article distributed under the terms and conditions of the Creative Commons Attribution license ( http://creativecommons.org/licenses/by/4.0/).
Share and Cite
Futra, D.; Heng, L.Y.; Surif, S.; Ahmad, A.; Ling, T.L. Microencapsulated Aliivibrio fischeri in Alginate Microspheres for Monitoring Heavy Metal Toxicity in Environmental Waters. Sensors 2014, 14, 23248-23268. https://doi.org/10.3390/s141223248
Futra D, Heng LY, Surif S, Ahmad A, Ling TL. Microencapsulated Aliivibrio fischeri in Alginate Microspheres for Monitoring Heavy Metal Toxicity in Environmental Waters. Sensors. 2014; 14(12):23248-23268. https://doi.org/10.3390/s141223248
Chicago/Turabian StyleFutra, Dedi, Lee Yook Heng, Salmijah Surif, Asmat Ahmad, and Tan Ling Ling. 2014. "Microencapsulated Aliivibrio fischeri in Alginate Microspheres for Monitoring Heavy Metal Toxicity in Environmental Waters" Sensors 14, no. 12: 23248-23268. https://doi.org/10.3390/s141223248
APA StyleFutra, D., Heng, L. Y., Surif, S., Ahmad, A., & Ling, T. L. (2014). Microencapsulated Aliivibrio fischeri in Alginate Microspheres for Monitoring Heavy Metal Toxicity in Environmental Waters. Sensors, 14(12), 23248-23268. https://doi.org/10.3390/s141223248