Estimation of Nitrogen Vertical Distribution by Bi-Directional Canopy Reflectance in Winter Wheat


Abstract
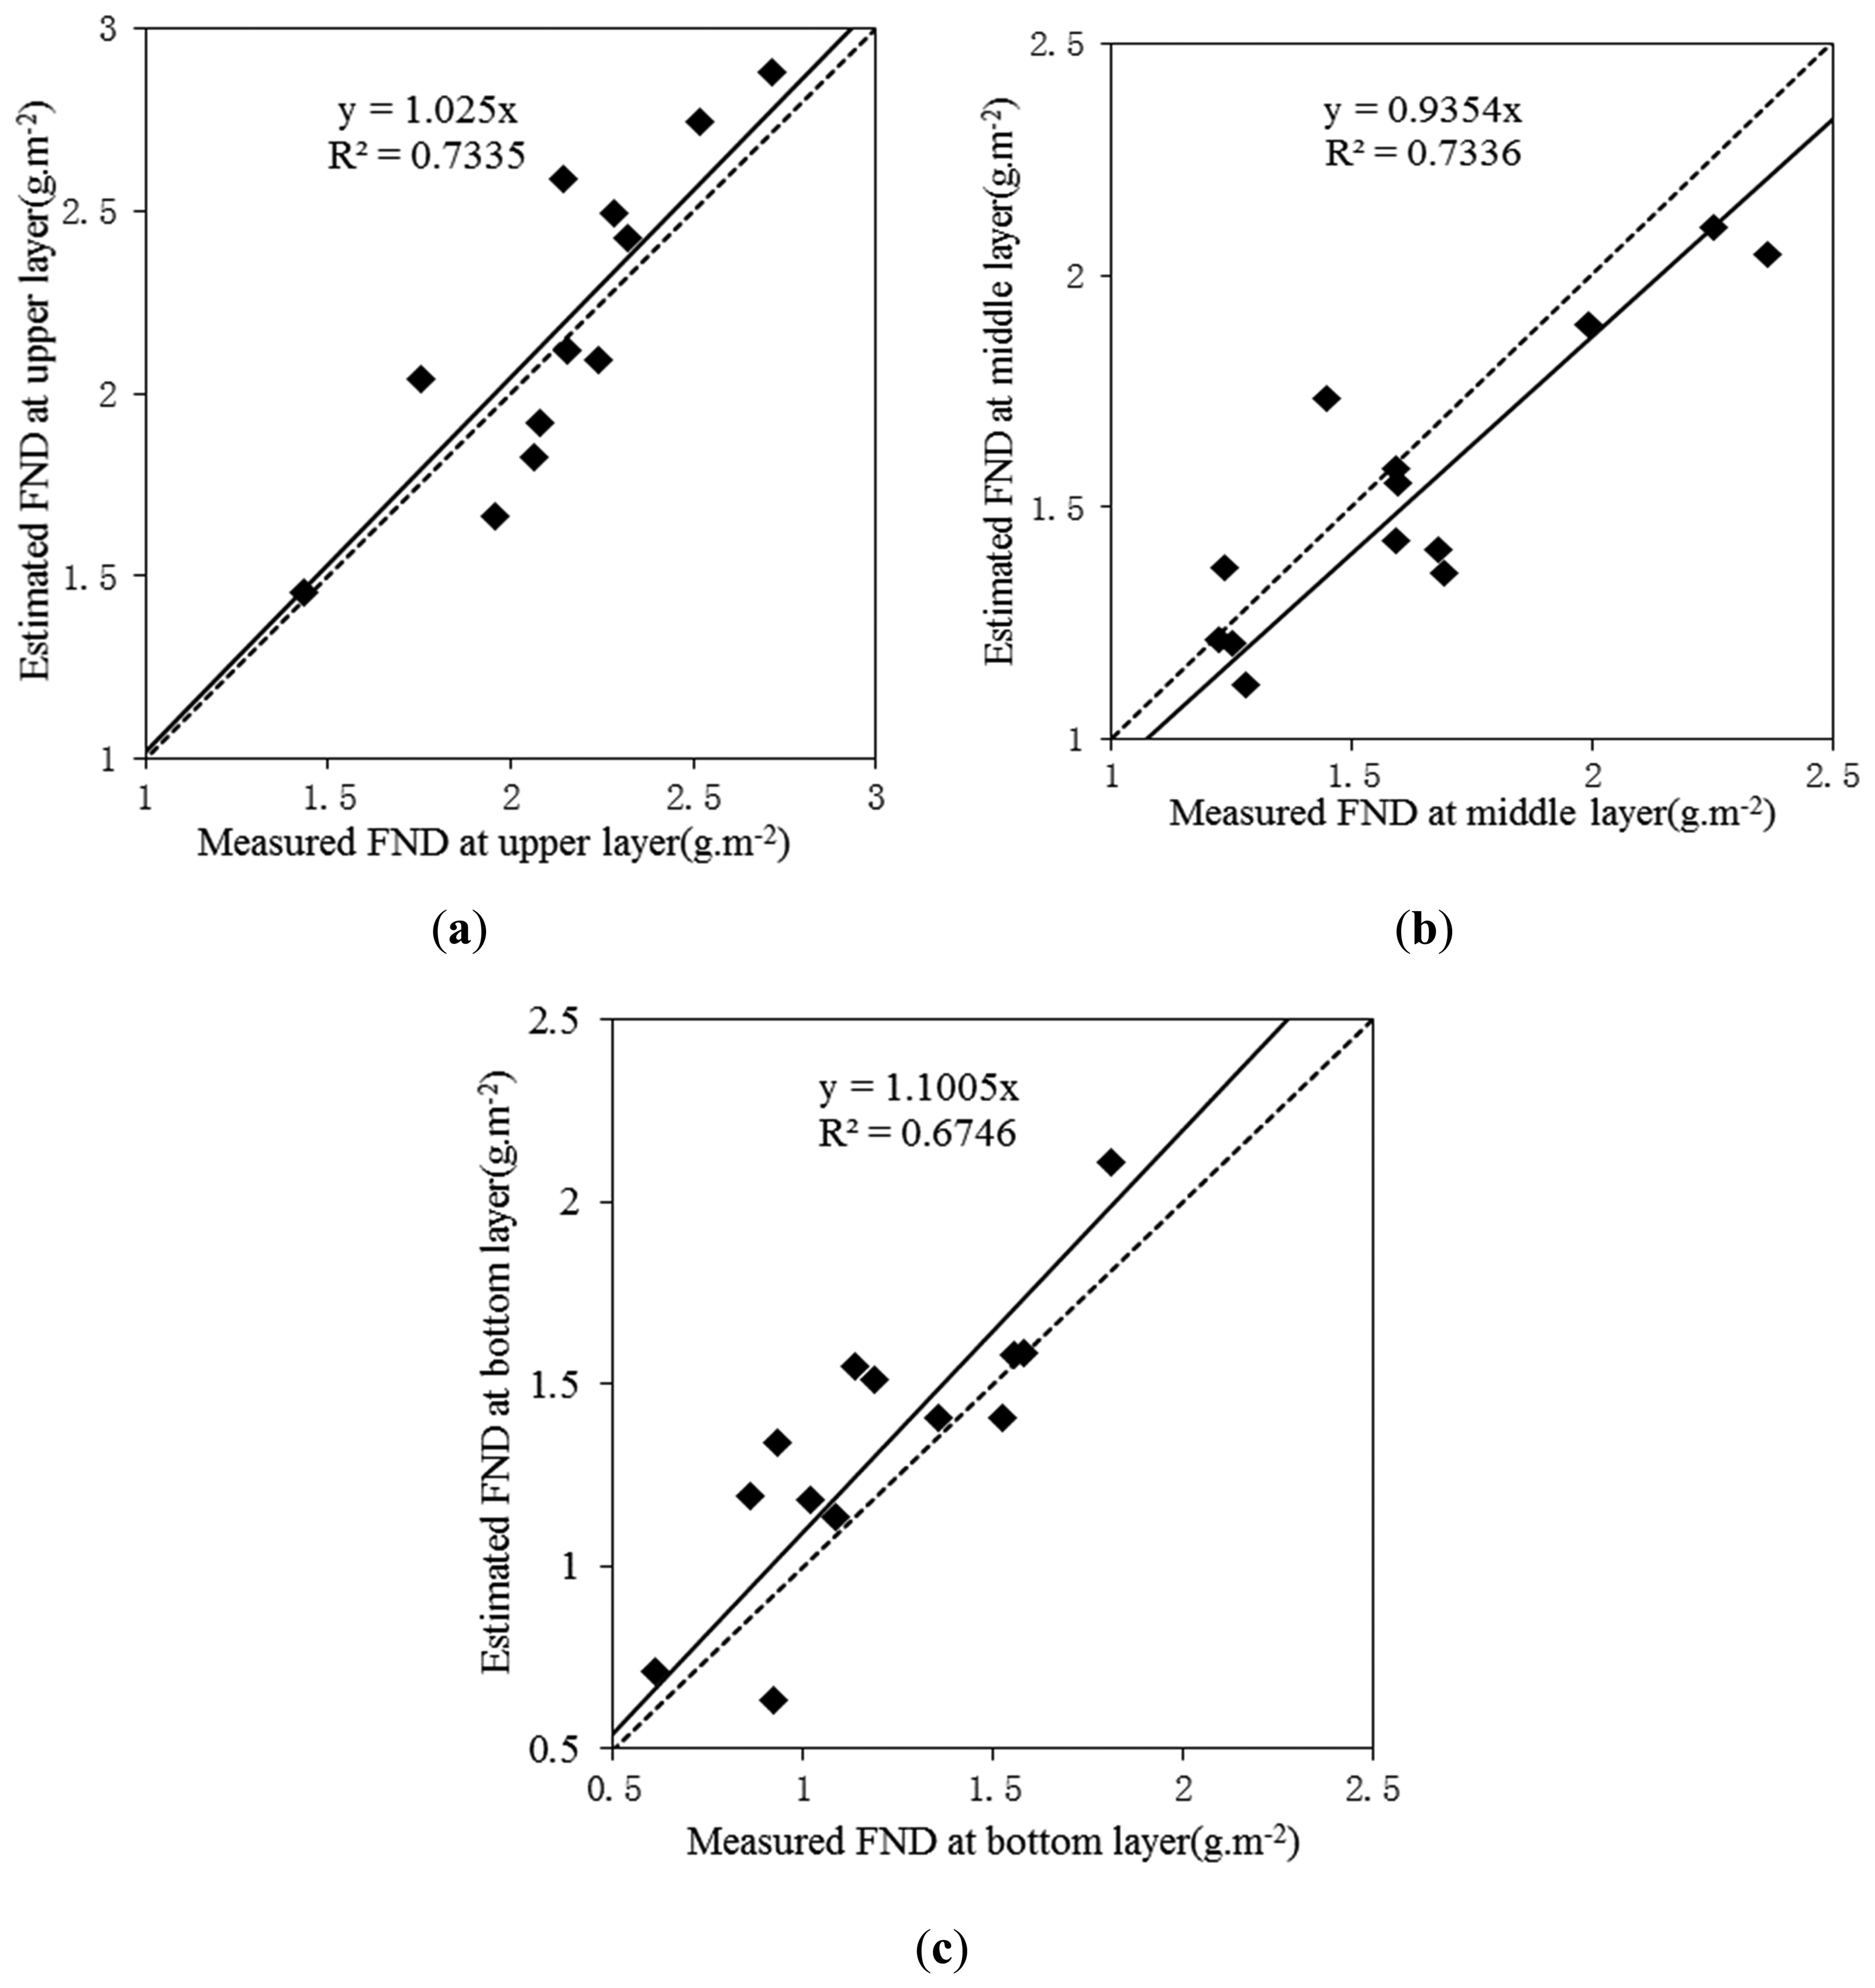
: Timely measurement of vertical foliage nitrogen distribution is critical for increasing crop yield and reducing environmental impact. In this study, a novel method with partial least square regression (PLSR) and vegetation indices was developed to determine optimal models for extracting vertical foliage nitrogen distribution of winter wheat by using bi-directional reflectance distribution function (BRDF) data. The BRDF data were collected from ground-based hyperspectral reflectance measurements recorded at the Xiaotangshan Precision Agriculture Experimental Base in 2003, 2004 and 2007. The view zenith angles (1) at nadir, 40° and 50°; (2) at nadir, 30° and 40°; and (3) at nadir, 20° and 30° were selected as optical view angles to estimate foliage nitrogen density (FND) at an upper, middle and bottom layer, respectively. For each layer, three optimal PLSR analysis models with FND as a dependent variable and two vegetation indices (nitrogen reflectance index (NRI), normalized pigment chlorophyll index (NPCI) or a combination of NRI and NPCI) at corresponding angles as explanatory variables were established. The experimental results from an independent model verification demonstrated that the PLSR analysis models with the combination of NRI and NPCI as the explanatory variables were the most accurate in estimating FND for each layer. The coefficients of determination (R2) of this model between upper layer-, middle layer- and bottom layer-derived and laboratory-measured foliage nitrogen density were 0.7335, 0.7336, 0.6746, respectively.1. Introduction
Nitrogen is a key factor for plant photosynthesis, ecosystem productivity and leaf respiration [1–3]. Determining the optimal amount of nitrogen fertilization to match the demands of crop growth is critical for improving grain yield and reducing environmental impacts [4,5]. Nitrogen stress may affect the light use efficiency and consequently influence long-term changes in vegetation biomass and carbon sequestration [6]. Excessive nitrogen fertilization on farmland can also cause crop lodging, groundwater contamination, atmospheric pollution and other environmental problems [7]. In addition, the transmission of nitrogen in response to nitrogen stress is generally from the bottom-layer to upper-layer in the crop [8]. Nitrogen deficiencies usually exhibit in the bottom layer leaves, while excessive nitrogen will affect the upper layer leaves first. Thus, fertilization should ideally be given according to crop nutrition status as reflected by vertical foliage nitrogen distribution, which is critical for early assessing crop growth status.
Traditional methods of measuring foliage nitrogen, such as the Kjeldahl method are time-consuming and labor intensive [9]. The Soil and Plant Analyzer Development (SPAD) which can obtain chlorophyll meter values is used to measure foliage nitrogen based on the close relationship between foliage chlorophyll and foliage nitrogen concentration [10,11], but the relationship may be nonlinear at high nitrogen levels [12], and consequently the method cannot estimate foliage nitrogen concentration regionally. Remote sensing technology provides an alternative for timely detecting the foliage nitrogen status at large scales.
Many spectral vegetation indices derived from canopy spectra have been used to retrieve foliage and canopy nitrogen status, such as Normalized Difference Vegetation Index (NDVI) and Ratio Vegetation Index (RVI) [13–17]. Bausch et al. [18] showed that plant nitrogen status could be effectively assessed by the Nitrogen Reflectance Index (NRI). Daughtry et al. [12] proposed a vegetation index named Modified Chlorophyll Absorption Ratio Index (MCARI) and applied it for canopy chlorophyll and nitrogen measurements. To reduce the sensitivity to variation in leaf area index (LAI) and soil background, a combined index, the ratio of Modified Chlorophyll Absorption Ratio Index to the second Modified Triangular Vegetation Index (MCARI/MTVI2), is successfully used to assess the foliage nitrogen [19,20]. Chen et al. [20] reported that the Double-peak Canopy Nitrogen Index (DCNI) was a good indicator of nitrogen in winter wheat and corn. Many other indices associated with plant pigments such as Normalized Difference Red Edge index (NDRE) and Red-Edge Chlorophyll Index (RECI) were also used to invert the plant nitrogen. Both Photochemical Reflectance Index (PRI) and Structure Independent Pigment Index (SIPI) were found sensitive to nitrogen treatment [21,22]. Filella et al. [23] confirmed that the Normalized Pigment Chlorophyll Index (NPCI) offered a potential way for measuring nitrogen status of wheat. Most of these studies with those indices focus on assessing canopy nitrogen, which normally cannot be a comprehensive approach to assess the crop nitrogen status. In comparison with a single view from vertical canopy, multi-angular observations can acquire more rich plant information by considering more canopy parameters. They have been used to detect foliage disturbances in forest ecosystems and to retrieve chlorophyll vertical distribution in winter wheat [24,25]. Therefore, in this study, we proposed a method for assessing vertical foliage nitrogen distribution in winter wheat by bi-directional reflectance difference function (BRDF) data.
Winter wheat is a major crop in China. A method that can accurately and timely assess a vertical foliage nitrogen distribution at Zadoks 41, Zadoks 65 and Zadoks 73 would be helpful to improve the economic benefits and reduce environment impact in winter wheat. Therefore our objectives for this analysis are to: (1) determine sensitive vegetation indices and viewing angles to estimate foliage nitrogen density for each layer (bottom, middle and top) of winter wheat and (2) select an optical model from three partial least square regression (PLSR) models for assessing foliage nitrogen density at each layer.
2. Experimental Section
2.1. Experimental Design
Field experiments were conducted in winter at the Xiaotangshan Precision Agriculture Experimental Base in 2003, 2004, and 2007. It is located in Changping district, northeast of Beijing City (40°11′ N, 116°27′ E), China. The soil at the field site is classified as a silt clay loam with a mean annual rainfall of 507.7 mm and a mean annual temperature of 13 °C [26]. The spectral data collected in 2003 were used to develop vegetation indices that were significantly correlated with foliage nitrogen density. The 2007 data were used to establish vertical distribution (for an upper layer, middle layer and bottom layer) nitrogen inversion models, while the data collected from 2004 were used to validate the proposed models. In the experimental base, eight widely cultivated winter wheat varieties with different canopy structures were investigated, including three-erectophile varieties (Jing 411, Laizhou 3279, and I-93), two-planophile varieties (Chaoyou 66, and Jingdong 8), and three-horizontal varieties (Linkang 2, 9428, and Zhouyou 9507).
2.2. Data Acquisition
2.2.1 In Situ Canopy Reflectance Spectra
An ASD FieldSpec Pro spectrometer (Analytical Spectral Devices, Boulder, CO, USA) with a 25° field-of-view fiber optic adaptor was used to measure the canopy reflectance between 10:00 a.m. and 14:00 p.m. (Beijing local time) under clear sky conditions on 8 May 2003 (Flowering, Zadoks 65). All canopy reflectances were measured at a height of 1.3 m above ground, and a BaSO4 calibration panel was used to calibrate radiance and reflectance before and after taking a measurement. From different numbers of fields for each of the eight wheat varieties, a total of 60 spectral measurements were taken. Since the fields of each variety were relatively homogeneous, in situ spectra were measured from a plot of about 1 m×1 m per field. Each spectral measurement from a plot was calculated by averaging 20 scans to represent the spectrum for the plot/field for later analysis.
2.2.2. Canopy BRDF Reflectance Spectra
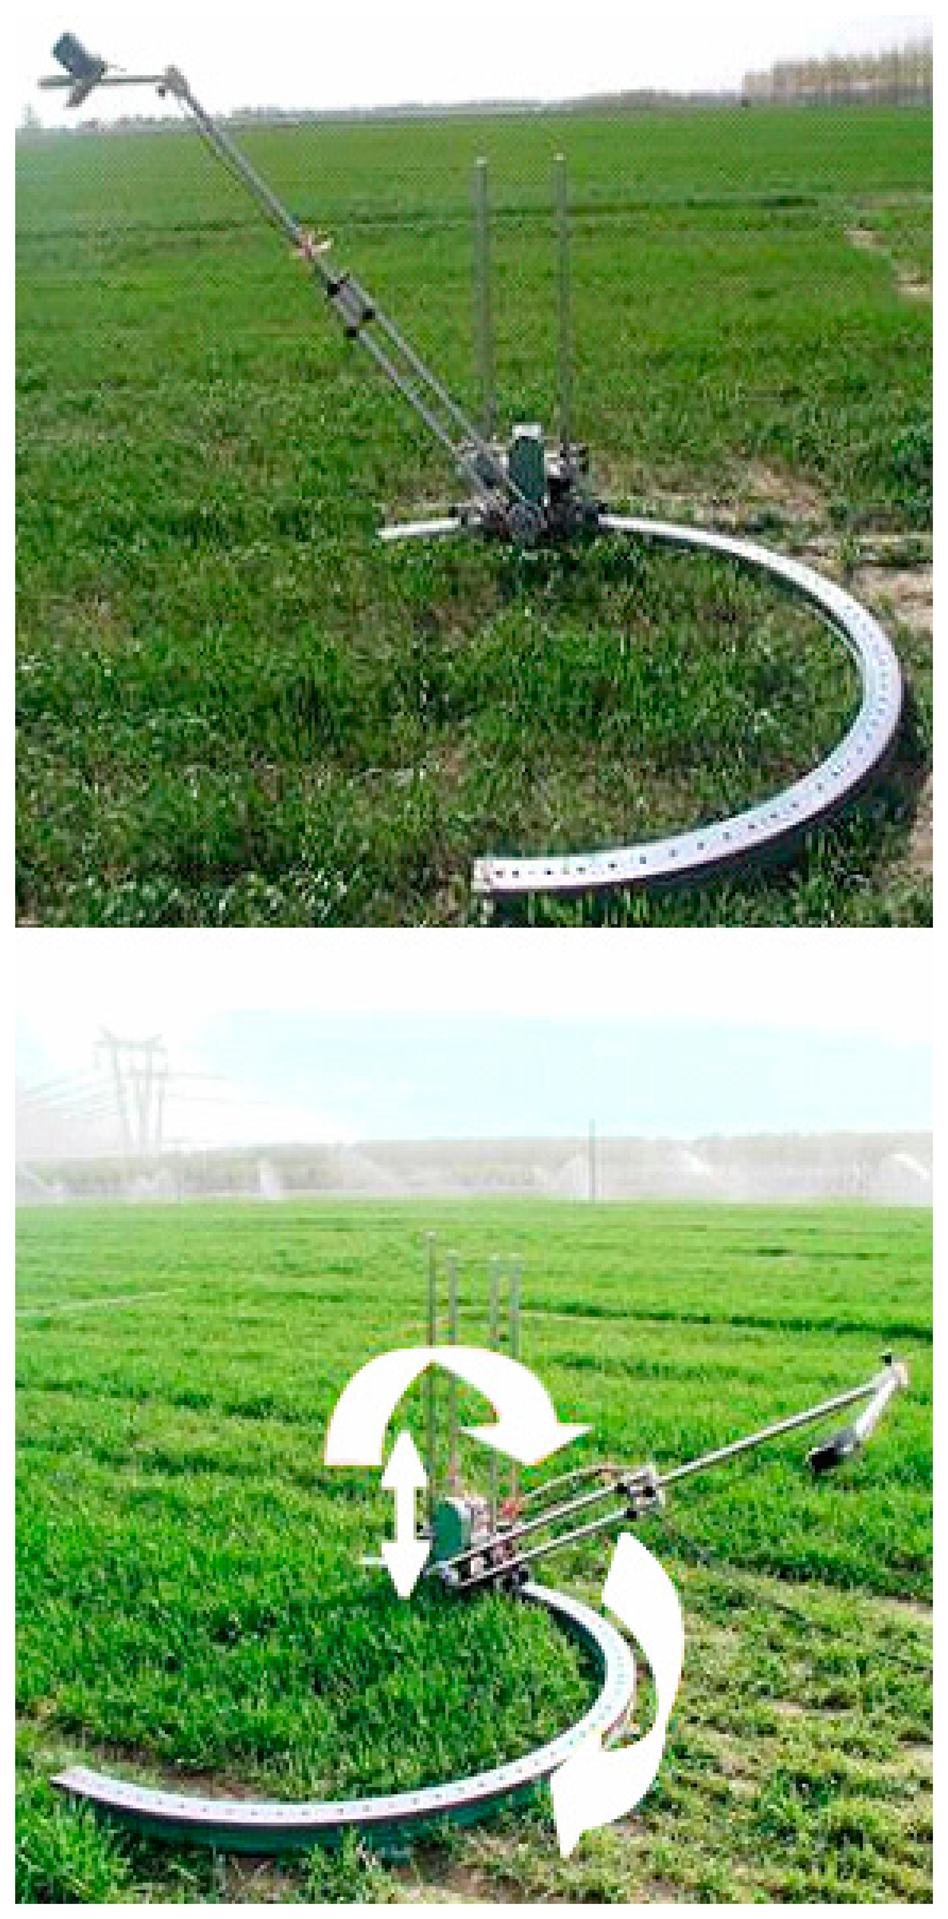
The same spectral instrument used for measuring in situ canopy reflectance spectra was used to take canopy bi-directional reflectance function (BRDF) reflectance spectra under cloud-free conditions between 10:00 a.m. and 14:00 p.m. (Beijing local time) at a principal plane and a cross-principal plane on 28 April (Booting, Zadoks 41), 9 May (Flowering, Zadoks 65), and 16 May (Milk development, Zadoks 73), in 2004. The similar canopy BRDF reflectance spectra were taken on 28 April, 11 May, and 16 May, in 2007. In accordance with the measuring method introduced by Huang et al. [26], a rotating bracket was used to fix the spectral instrument (Figure 1). View zenith angles were from −60° to 60° with 10° intervals. The negative angles represented face-to-the-sun, while the positive angles represented back-to-the-sun. Twenty spectra were taken at each view angle.
2.2.3. Foliar Nitrogen Vertical Distribution and Foliage Nitrogen Density
The vertical foliar nitrogen distribution sampling method used in this study was similar to the vertical foliar chlorophyll distribution sampling method used in Huang et al. [25]. The wheat was collected in the plot where the spectral measurement was taken, placed in black plastic bags, and then transported to nearby laboratory. The wheat leaves were separated into three layers (upper-layer, middle-layer and bottom-layer) and the foliage nitrogen concentration of all layers in 2004 and 2007 were determined using the Kjedahl method. Then the 2007 nitrogen density was calculated by using Equation (1) below. Since the leaf dry weight for each layer of 2004 was not measured and only specific leaf weight SLW (g·m−2) for each layer was measured, the 2004 nitrogen density was calculated using Equation (2) below:
2.3. Data Analysis
A correlation analysis was conducted to examine the sensitivity of vegetation index to foliage nitrogen density. The results were assessed in terms of coefficient of determination (R2) between vegetation index and nitrogen density. Correlation analysis was conducted on a dataset of 60 samples collected on 8 May 2003. Nine VIs were first calculated from measured spectra at different view angles according to equations in Table 1. Note that here both MCARI and MTVI2 were combined into a ratio index. These VIs are related to leaf pigment, light use efficiency, and red edge characteristics as aforementioned. R2 values between foliage total nitrogen density and the nine commonly used VIs were presented in Table 2. The PLSR was performed to develop multivariate models to measure foliage nitrogen density at three layers. As PLSR algorithm has been described in many studies in detail and the good performance on the agricultural remote sensing has been shown [27,28], so we don't repeat it here. For each layer, three PLSR analysis models were established with three types of vegetation indices as explanatory variables (VIs) and foliage nitrogen density (FND) as a dependent variable. R2 and root mean square error (RMSE) were calculated to measure the strength of a relationship between VIs and FND and to assess the accuracy of an estimation of N density.
According to the correlation analysis results of single VIs with FND in Table 2, NDVI showed the best relationship with foliage total nitrogen density (R2 = 0.63), followed by NRI (R2 = 0.61) and NPCI (R2 = 0.60). However, NDVI has been noted to saturate at higher vegetation densities and is insensitive at low densities [13]. We did not consider the three VIs: PPR, DCNI and MCARI/MTVI2 into PLSR modeling analysis due to their R2 too low. Therefore, only the remaining six VIs were considered in PLSR modeling analysis. After examining different PLSR modeling results of FND with the six VIs at each vertical layer, three PLSR analysis models were the best for each layer with FND as a dependent variable and three types of VIs (NRI, NPCI or a combination of NRI and NPCI) at corresponding angles as explanatory variables.
3. Results and Discussion
3.1. Selection of Vegetation Indices (VIs) and View Zenith Angle (VZA)
Based on the results in Table 2 and considering the saturation phenomenon of NDVI, NRI and NPCI might be used to estimate foliage nitrogen density. In order to assess vertical foliage nitrogen distribution, we analyzed the sensitivity of VIs at each view angle to foliage nitrogen density for each layer. We found significant correlations between the FND at the upper layer and NRI at VZAs of 40° and 50°. For the middle layer, there existed significant correlations between FND and NRI at VZAs of 30° and 40°. In addition, the values of NRI at VZAs of 20° and 30° were of linearly significant relation to FND at the bottom layer. Table 3 lists the correlation results of NRI with FND at different view angles at each layer. However, the spectra collected at nadir were the most easily obtained and were used in practice. Therefore, VIs derived (1) at nadir, 40° and 50°; (2) at nadir, 30° and 40°; and (3) at nadir, 20° and 30° view angles were selected to estimate the FND at an upper layer, a middle layer, and a bottom layer, respectively.
3.2. PLSR Prediction Models for FND
According to the previous conclusions, the R2 values of the three optimal PLSR analysis models were listed in Table 4. It could be inferred from Table 4 that models with a combination of NRI and NPCI as explanatory variables performed the best for each layer compared with other two models.
3.3. The Validation of the FND-Prediction Model
To further test which model can provide the best results for each layer, the data collected in 2004 were applied to validate the three optimal models. By comparison, we found that the PLSR analysis models with the combination of NRI and NPCI as the explanatory variables created the highest R2 and lowest RMSE for each layer (Table 5). The best validation results for each layer were shown in Figure 2.
3.4. Discussion
In this study, we confirmed that PLSR is an effective statistical approach with multiple view angle observation data for estimating wheat N density. Many previous studies have proven that PLSR is an effective statistical approach. For example, Liu et al. [35] demonstrated that PLSR was the most effective approach to predict disease severity compared with other statistical methods. Cho et al. [36] reported that PLSR models, based on original, derivative and continuum-removed spectra, produced lower prediction errors compared with NDVI and red-edge position (REP) models. To efficiently utilize spectral information derived from multi-angular remote sensing, in fact, Thomas et al. [37] had used their multi-angular high spectral resolution remote sensing data to study crop canopy disturbance at different stages. The method applied in this study that combined PLSR modeling technique with BRDF observation data has further demonstrated the potential of multi-angular remote sensing for extracting information of the vertical foliage nitrogen distribution in winter wheat.
The result from this study has shown that the model with the combination of NRI and NPCI as the explanatory variables is accurate to assess the foliage nitrogen density (FND) at each vertical layer, and it performed best at an upper layer according to the R2 and the equations for regression lines. Our results indicated that the model was better if taking more spectral variables (VIs in this time) and multi-angular information into consideration, and that the spectral information from an upper layer (some time also considering a middle layer as in this study) was more easily to record, which is consistent with the point of view of Wang et al. [8] mentioned the information from middle layer. The data collected at different view angles contain different layer crop characteristics, and thus multi-angular observations can acquire more rich plant information by viewing relatively full canopy structural characteristics than a single view at a nadir direction. The result from this study is critical for developing a simple method to early assess crop growth status and can also provide a reference for developing multi-angle airborne or space-borne sensors in the future.
However, there were still many shortcomings in this study. Those drawbacks need to be overcome or improved in the future. More experiments should be carried out in different crops by considering different environment factors to further generalize and improve the performance of models. And the effect of crop background (soil, crop residue, etc.) reflectance and LAI on spectral response should be considered. Since this study only used the data of observed cross-principal plane, future studies should consider the application of more observation planes such as a combination of cross-principal plane and principal plane for obtaining more comprehensive spectral information from crops. Principal plane contains more information about the plant than other planes, but there are more directional effects than in a cross-principal plane [38]. Other directional factors such as solar zenith angle, solar azimuth angle and view angles also have effects on spectral response [39], and they have not been considered in this paper. However, their influences on crop spectra should be further investigated in future. In addition, our experimental results need to be further calibrated in different areas. Due to limitations of the experimental condition and time, in this study, we did not fully consider the different types of explanatory variables into PLSR analysis models.
4. Conclusions
Based on analyses of linear relationships between foliage total nitrogen density and vegetation indices (VIs), Nitrogen Reflectance Index (NRI) and Normalized Pigment Chlorophyll Index (NPCI) were found to be suitable for a retrieval of FND. Further analyzing the linear correlation of NRI at each view angle to FND at each layer, the VIs (NRI and NPCI) (1) at nadir, 40° and 50°; (2) at nadir, 30° and 40°; and (3) at nadir, 20° and 30° were selected to estimate FND at an upper layer, a middle layer and a bottom layer, respectively. Three optimal PLSR analysis models with FND as the dependent variable and three types of vegetation indices (NRI, NPCI or the combination of NRI and NPCI) at corresponding angles as the explanatory variables were established for each vertical layer. The result of an independent model verification demonstrated that the PLSR analysis models with the combination of NRI and NPCI at corresponding angles as the explanatory variables were the most accurate in estimating FND for each layer. The coefficients of determination (R2) were 0.73, 0.73 and 0.67, and the root mean square errors (RMSE) were 0.23, 0.19 and 0.24 for the upper layer, middle layer and bottom layer, respectively. This study might provide a basis for using BRDF data and PLSR modeling approach to assess foliage nitrogen vertical distribution over a large area.
Acknowledgments
This work was supported by Special Fund from Chinese Academy of Sciences (KZZD-EW-TZ-18), Hundred Talent Program of the Chinese Academy of Sciences for Wenjiang Huang, National Natural Science Foundation of China (41271412), and State High Technology Research and Development Plan of China (2012AA12A301). The authors are grateful to Weiguo Li, Hong Chang and Zhihong Ma for their assistance in data collection.
Author Contributions
Wenjiang Huang has gathered the experimental data and processed the vertical distribution of the nitrogen data and canopy spectrum data; Qinying Yang wrote the introduction and some of the results part for spectral analysis. Ruiliang Pu edited the English language, grammar and the discussion part; Shaoyuan Yang wrote the conclusion part. All of the authors read and approved the final manuscript.
Conflicts of Interest
The authors declare no conflict of interest.
References
- Johnson, L.F. Nitrogen influence on fresh-leaf NIR spectra. Remote Sens. Environ 2001, 78, 314–320. [Google Scholar]
- Serrano, L.; Peñuelas, J.; Ustin, S.L. Remote sensing of nitrogen and lignin in Mediterranean vegetation from AVIRIS data: Decomposing biochemical from structural signals. Remote Sens. Environ 2002, 81, 355–364. [Google Scholar]
- Martin, M.E.; Plourde, L.C.; Ollinger, S.V.; Smith, M.L.; McNeil, B.E. A generalizable method for remote sensing of canopy nitrogen across a wide range of forest ecosystems. Remote Sens. Environ 2008, 112, 3511–3519. [Google Scholar]
- Feyter, C.; O'connor, M.B.; Addison, B. Effects of rates and times of nitrogen application on the production and composition of dairy pastures in Waikato district, New Zealand. N. Z. J. Exp. Agric 1985, 13, 247–252. [Google Scholar]
- Eitel, J.U.E.; Vierling, L.A.; Long, D.S.; Hunt, E.R. Early season remote sensing of wheat nitrogen status using a green scanning laser. Agric. For. Meteorol 2011, 151, 1338–1345. [Google Scholar]
- Peng, D.L.; Zhang, B.; Liu, L.Y. Comparing spatiotemporal patterns in Eurasian FPAR derived from two NDVI-based methods. Int. J. Digit. Earth 2012, 5, 283–298. [Google Scholar]
- Delgado, J.A.; Shaffer, M.J.; Mckinney, S.P.; Gross, C.M.; Cover, H. Assessment of nitrogen losses to the environment with a nitrogen trading tool. Comput. Electron. Agric 2008, 63, 193–206. [Google Scholar]
- Wang, Z.J.; Wang, J.H.; Liu, L.Y.; Huang, W.J.; Zhao, C.J.; Lu, Y.L. Estimation of Nitrogen Status in Middle and Bottom Layers of Winter Wheat Canopy by Using Ground-Measured Canopy Reflectance. Commun. Soil Sci. Plant Anal 2005, 36, 2289–2302. [Google Scholar]
- Wang, Z.J.; Wang, J.H.; Liu, L.Y.; Huang, W.J.; Zhao, C.J.; Wang, C.Z. Prediction of grain protein content in winter wheat (Triticum aestivum L.) using plant pigment ratio (PPR). Field Crops Res 2004, 90, 311–321. [Google Scholar]
- Bullock, D.G.; Anderson, D.S. Evaluation of the Minolta SPAD-502 Chlorophyll Meter for Nitrogen Management in Corn. J. Plant Nutr 1998, 21, 741–755. [Google Scholar]
- Clevers Jan, G.P.W.; Kooistra, L. Using Hyperspectral Remote Sensing Data for Retrieving Canopy Chlorophyll and Nitrogen Content. IEEE J. Sel. Top. Appl. Earth Observ. Remote Sens 2012, 5, 574–583. [Google Scholar]
- Daughtry, C.S.T.; Walthall, C.L.; Kim, M.S.; Colstoun, E.B.D.; McMurtrey, J.E., III. Estimating Corn Leaf Chlorophyll Concentration from Leaf and Canopy Reflectance. Remote Sens. Environ 2000, 74, 229–239. [Google Scholar]
- Ferwerda, J.G.; Skidmore, A.K.; Mutanga, O. Nitrogen detection with hyperspectral normalized ratio indices across multiple plant species. Int. J. Remote Sens 2005, 26, 4083–4095. [Google Scholar]
- Zhang, J.H.; Wang, K.; Baile, J.S.; Wang, R.C. Predicting Nitrogen Status of Rice Using Multispectral Data at Canopy Scale. Soil Sci. Soc. China 2006, 16, 108–117. [Google Scholar]
- Stroppiana, D.; Boschetti, M.; Brivio, P.A.; Bocchi, S. Estimation of plant nitrogen concentration inpaddy rice from field canopy spectra. Ital. J. Remote Sens 2009, 41, 45–57. [Google Scholar]
- Inoue, Y.; Sakaiya, E.; Zhu, Y.; Takahashi, W. Diagnostic mapping of canopy nitrogen content in rice based on hyperspectral measurements. Remote Sens. Environ 2012, 126, 210–221. [Google Scholar]
- Miphokasap, P.; Honda, K.; Vaiphase, C.; Souris, M.; Nagai, M. Estimating canopy nitrogen concentration in sugarcane using field imaging spectroscopy. Remote Sens 2012, 4, 1651–1670. [Google Scholar]
- Bausch, W.C.; Duke, H.R.; Iremonger, C.J. Assessment of plant nitrogen in irrigated corn. Proceedings of the 3rd International Conference on Precision Agriculture, Minneapolis, MN, USA, 23–26 June 1996; Robert, P.C., Rust, R.H., Larcon, N.E., Eds.; ASA/CSSA/SSSA: Minneapolis, MN, USA, 1996; pp. 23–32. [Google Scholar]
- Eitel, J.U.H.; Long, D.S.; Gessler, P.E.; Smith, A.M.S. Using in-situ measurements to evaluate the new RapidEye™ satellite series for prediction of wheat nitrogen status. Int. J. Remote Sens 2007, 28, 4183–4190. [Google Scholar]
- Chen, P.F.; Haboudane, D.; Tremblay, N.; Wang, J.H.; Vigneault, P.; Li, B.G. New spectral indicator assessing the efficiency of crop nitrogen treatment in corn and wheat. Remote Sens. Environ 2010, 114, 1987–1997. [Google Scholar]
- Gamon, J.A.; Penuelas, J.; Field, C.B. A narrow-waveband spectral index that tracks diurnal changes in photosynthetic efficiency. Remote Sens. Environ 1992, 41, 35–44. [Google Scholar]
- Moran, J.A.; Mitchell, A.K.; Goodmanson, G.; Stockburger, K.A. Differentiation among effects of nitrogen fertilization treatments on conifer seedlings by foliar reflectance: A comparison of methods. Tree Physiol 2000, 20, 1113–1120. [Google Scholar]
- Filella, I.; Serrano, L.; Serra, J.; Peñuelas, J. Evaluating wheat nitrogen status with canopy reflectance indices and discriminant analysis. Crop Sci 1995, 35, 1400–1405. [Google Scholar]
- Hilker, T.; Copes, N.C.; Coggins, S.B.; Wulder, M.A.; Brown, M.; Black, T.A.; Nesic, Z.; Lessard, D. Detection of foliage conditions and disturbance from multi-angular high spectral resolution remote sensing. Remote Sens. Environ 2009, 113, 421–434. [Google Scholar]
- Huang, W.J.; Wang, Z.J.; Huang, L.S.; Lamb, D.W.; Ma, Z.H.; Zhang, J.C.; Wang, J.H.; Zhao, C.J. Estimation of vertical distribution of chlorophyll concentration by bi-directional canopy reflectance spectra in winter wheat. Precis. Agric 2010, 12, 165–178. [Google Scholar]
- Huang, W.J.; Niu, Z.; Wang, J.H.; Liu, L.Y.; Zhao, C.J.; Liu, Q. Identifying Crop Leaf Angle Distribution Based on Two-Temporal and Bidirectional canopy Reflectance. IEEE Trans. Geosci. Remote Sens 2006, 44, 3601–3609. [Google Scholar]
- Ehsani, M.R.; Upadhyaya, S.K.; Slaughter, D.; Shafii, S.; Pelletier, M. A NIR technique for rapid determination of soil mineral nitrogen. Precis. Agric 1999, 1, 217–234. [Google Scholar]
- Pandit, C.M.; Filippelli, G.M.; Li, L. Estimation of heavy metal contamination in soil using reflectance spectroscopy and partial least-squares regression. Int. J. Remote Sens 2010, 31, 4111–4123. [Google Scholar]
- Rouse, J.W.; Haas, R.H.; Deering, D.W.; Schell, J.A. Monitoring the Vernal Advancement and Retrogradation (Green Wave Effect) of Natural Vegetation; Final Rep. RSC 1978-4; Remote Sensing Center, Texas A&M University: College Station, TX, USA, 1974. [Google Scholar]
- Metternicht, G. Vegetation indices derived from high-resolution airborne videography for precision crop management. Int. J. Remote Sens 2003, 24, 2855–2877. [Google Scholar]
- Peñuelas, J.; Filella, I.; Gamon, J.A. Assessment of photosynthetic radiation-use efficiency with spectral reflectance. New Phytol 1995, 131, 291–296. [Google Scholar]
- Peñuelas, J.; Gamon, J.A.; Fredeen, A.L.; Merino, J.; Field, C.B. Reflectance indices associated with physiological changes in nitrogen- and water-limited sunflower leaves. Remote Sens. Environ 1994, 48, 135–146. [Google Scholar]
- Shibayama, M.; Akiyama, T. Seasonal visible, near-infrared and mid-infrared spectra of rice canopies in relation to LAI and above-ground dry phytomass. Remote Sens. Environ 1989, 27, 119–127. [Google Scholar]
- Haboudane, D.; Miller, J.R.; Pattey, E.; Zarco-Tejada, P.J.; Strachan, I.B. Hyperspectral vegetation indices and novel algorithms for predicting green LAI of crop canopies: Modeling and validation in the context of precision agriculture. Remote Sens. Environ 2004, 90, 337–352. [Google Scholar]
- Liu, Z.Y.; Huang, J.F.; Shi, J.J.; Tao, R.X.; Zhou, W.; Zhang, L.L. Characterizing and estimating rice brown spot disease severity using stepwise regression, principle component regression and partial least-square regression. J. Zhejiang Univ. Sci. B 2007, 8, 738–744. [Google Scholar]
- Cho, M.A.; Skidmore, A.; Corsi, F.; Wieren, S.E.V.; Sobhan, I. Estimation of green grass/herb biomass from airborne hyperspectral imagery using spectral indices and partial least squares regression. Int. J. Appl. Earth Observ. Geoinf 2007, 9, 414–424. [Google Scholar]
- Thomas, V.; Treitz, P.; Mccaughey, J.H.; Noland, T.; Rich, L. Canopy chlorophyll concentration estimation using hyperspectral and LiDAR data for a boreal mixed wood forest in northern Ontario, Canada. Int. J. Remote Sens 2008, 29, 1029–1052. [Google Scholar]
- Hautecoeur, O.; Leroy, M.M. Surface Bidirectional Reflectance Distribution Function observed at global scale by POLDER/ADEOS. Geophys. Res. Lett 1998, 25, 4197–4200. [Google Scholar]
- Huang, B.; Zhang, H.K.; Yu, L. Improving Landsat ETM + Urban Area Mapping via Spatial and Augular Fusion with MISR Multi-Angle Observations. IEEE J. Sel. Top. Appl. Earth Observ. Remote Sens 2012, 5, 101–109. [Google Scholar]


| Index | Name | Description | Reference |
|---|---|---|---|
| NDVI | Normalized difference vegetation index | (R800 − R680)/(R800 + R680) | Rouse et al., (1974) [29] |
| NRI | Nitrogen reflectance index | (R570 − R670)/(R570 + R670) | Filella et al., (1995) [23] |
| PPR | Plant pigment ratio | (R550 − R450)/(R550 + R450) | Metternicht et al., (2003) [30] |
| SIPI | Structure insensitive pigment index | (R800 − R445)/(R800 − R680) | Peñuelas et al., (1995) [31] |
| NPCI | Normalized pigment chlorophyll index | (R680 − R430)/(R680 + R430) | Peñuelas et al., (1994) [32] |
| SRPI | Simple ratio pigment index | R430/R680 | Peñuelas et al., (1994) [32] |
| R810/R560 | Ratio vegetation index of 810 nm and 560 nm | R810/R560 | Shibayama and Akiyama (1989) [33] |
| DCNI | Double-peak canopy nitrogen index | ((R720 − R700)/(R700 − R670))/(R720 − R670 + 0.03) | Chen et al., (2010) [20] |
| MCARI | Modified chlorophyll Absorption ratio index | (R700 − R670 − 0.2(R700 − R550))*(R700/R670) | Daughtry et al., (2000) [12] |
| MTVI2 | Modified triangular vegetation index | 1.5(1.2(R800 − R550) − 2.5(R670 − R550))/sqrt((2R800 + 1)2 − (6R800 − 5sqrt(R670)) − 0.5) | Haboudane et al., (2004) [34] |
| MCARI/MTVI2 | Combined index | MCARI/MTVI2 | Eitel et al. (2007) [19] |
| Index | R2 |
|---|---|
| NDVI | 0.627 |
| NRI | 0.610 |
| NPCI | 0.604 |
| SRPI | 0.603 |
| R810/R560 | 0.602 |
| SIPI | 0.592 |
| PPR | 0.0891 |
| DCNI | 0.0120 |
| MCARI/ MTVI2 | 0.0067 |
| Layer | Upper Layer | Middle Layer | Bottom Layer |
|---|---|---|---|
| View Angle (°) | |||
| 20 | 0.515 | 0.484 | 0.308 |
| 30 | 0.577 | 0.566 | 0.334 |
| 40 | 0.595 | 0.536 | 0.260 |
| 50 | 0.581 | 0.497 | 0.277 |
| 60 | 0.519 | 0.411 | 0.174 |
| Layer | Upper Layer | Middle Layer | Bottom Layer |
|---|---|---|---|
| Index | |||
| NPCI | 0.439 | 0.513 | 0.327 |
| NRI | 0.774 | 0.608 | 0.372 |
| NPCI and NRI | 0.818 | 0.642 | 0.617 |
| Layer | Upper Layer | Middle Layer | Bottom Layer | |||
|---|---|---|---|---|---|---|
| Index | R2 | RMSE | R2 | RMSE | R2 | RMSE |
| NPCI | 0.4899 | 0.358 | 0.350 | 0.347 | 0.328 | 0.280 |
| NRI | 0.5366 | 0.345 | 0.627 | 0.231 | 0.532 | 0.265 |
| NPCI and NRI | 0.7335 | 0.225 | 0.734 | 0.192 | 0.675 | 0.245 |
© 2014 by the authors; licensee MDPI, Basel, Switzerland. This article is an open access article distributed under the terms and conditions of the Creative Commons Attribution license ( http://creativecommons.org/licenses/by/3.0/).
Share and Cite
Huang, W.; Yang, Q.; Pu, R.; Yang, S. Estimation of Nitrogen Vertical Distribution by Bi-Directional Canopy Reflectance in Winter Wheat. Sensors 2014, 14, 20347-20359. https://doi.org/10.3390/s141120347
Huang W, Yang Q, Pu R, Yang S. Estimation of Nitrogen Vertical Distribution by Bi-Directional Canopy Reflectance in Winter Wheat. Sensors. 2014; 14(11):20347-20359. https://doi.org/10.3390/s141120347
Chicago/Turabian StyleHuang, Wenjiang, Qinying Yang, Ruiliang Pu, and Shaoyuan Yang. 2014. "Estimation of Nitrogen Vertical Distribution by Bi-Directional Canopy Reflectance in Winter Wheat" Sensors 14, no. 11: 20347-20359. https://doi.org/10.3390/s141120347