A Telemetry System Embedded in Clothes for Indoor Localization and Elderly Health Monitoring

Abstract
: This paper presents a telemetry system used in a combined trilateration method for the precise indoor localization of the elderly who need health monitoring. The system is based on the association of two wireless technologies: ultrasonic and 802.15.4. The use of the 802.15.4 RF signal gives the reference starting time of the ultrasonic emission (time difference of arrival method). A time of flight measurement of the ultrasonic pulses provides the distances between the mobile node and three anchor points. These distance measurements are then used to locate the mobile node using the trilateration method with an accuracy of a few centimetres. The originality of our work lies in embedding the mobile node in clothes. The system is embedded in clothes in two ways: on a shoe in order to form a “smart” shoe and in a hat in order to form a “smart” hat. Both accessories allow movements, gait speed and distance covered to be monitored for health applications. Experiments in a test room are presented to show the effectiveness of our system.1. Introduction
The aging population context in developed countries has highlighted several economic and societal problems over last decades. Recent advances in the fields of information technology, sensor networks and miniaturized devices are offering new technological solutions for taking care of the elderly. The research and development of smart monitoring systems, the purpose of which is to care for the elderly living at home or in institutions, has been the subject of considerable effort in academia and certain industries [1,2]. Some of these systems enable monitoring of activities of daily living (ADLs) [3,4]: life habits, physical activity, gait speed, etc. In order to monitor ADLs, some research teams use sound or video [5,6]. These options have been criticized and described as an intrusion in terms of patients' privacy. Other research teams have used non-intrusive sensors based on motion detection. They generally use sensor networks disseminated in the environment or worn by the person (on clothes, as implants, etc.), infrared sensors [7–9], inertial sensors [10,11], ultrasonic sensors [12,13], or floors equipped with pressure sensors [13,14].
In our work we have chosen to use both non-intrusive sensors worn by the person and disseminated in the environment for monitoring ADLs at home or in hospital wards [15,16]. This relates to one of our previous studies [16] in which we developed a telemetry system in order to measure the distance between two devices with an accuracy of a few centimetres.
This paper is focused on the integration of our prototype into clothes. The main objective is to provide a “smart” garment for monitoring ADLs in institutions or at home. Indeed, by combining this garment with a network of anchor points, it is possible to monitor the movements of a person in his/her indoor environment and in real time. Moreover, a post-processing analysis allows measurement of gait speed and the distance covered by the user. Based on these parameters, many clinical applications are possible. The monitoring of physical activity and walking trajectories allows observing the evolution of Alzheimer's disease in medical institutions [15]. We also plan to use our instrument to follow up on frail subjects during their daily life at home. Frailty [17] is a syndrome determining a higher vulnerability to stressors and responsible for an increased risk of major negative health-related events, including disability. Numerous factors link the concept of frailty to physiological and clinical indicators (e.g., gait speed, physical activity, etc.). Therefore, a specific need is the development of a methodology allowing a dynamic and objective assessment of key parameters to be followed up over time. The measurement of gait speed and its variability, distance covered and daily activities may indeed provide useful indicators to generate different clinical trajectories and allow the design of specifically tailored interventions.
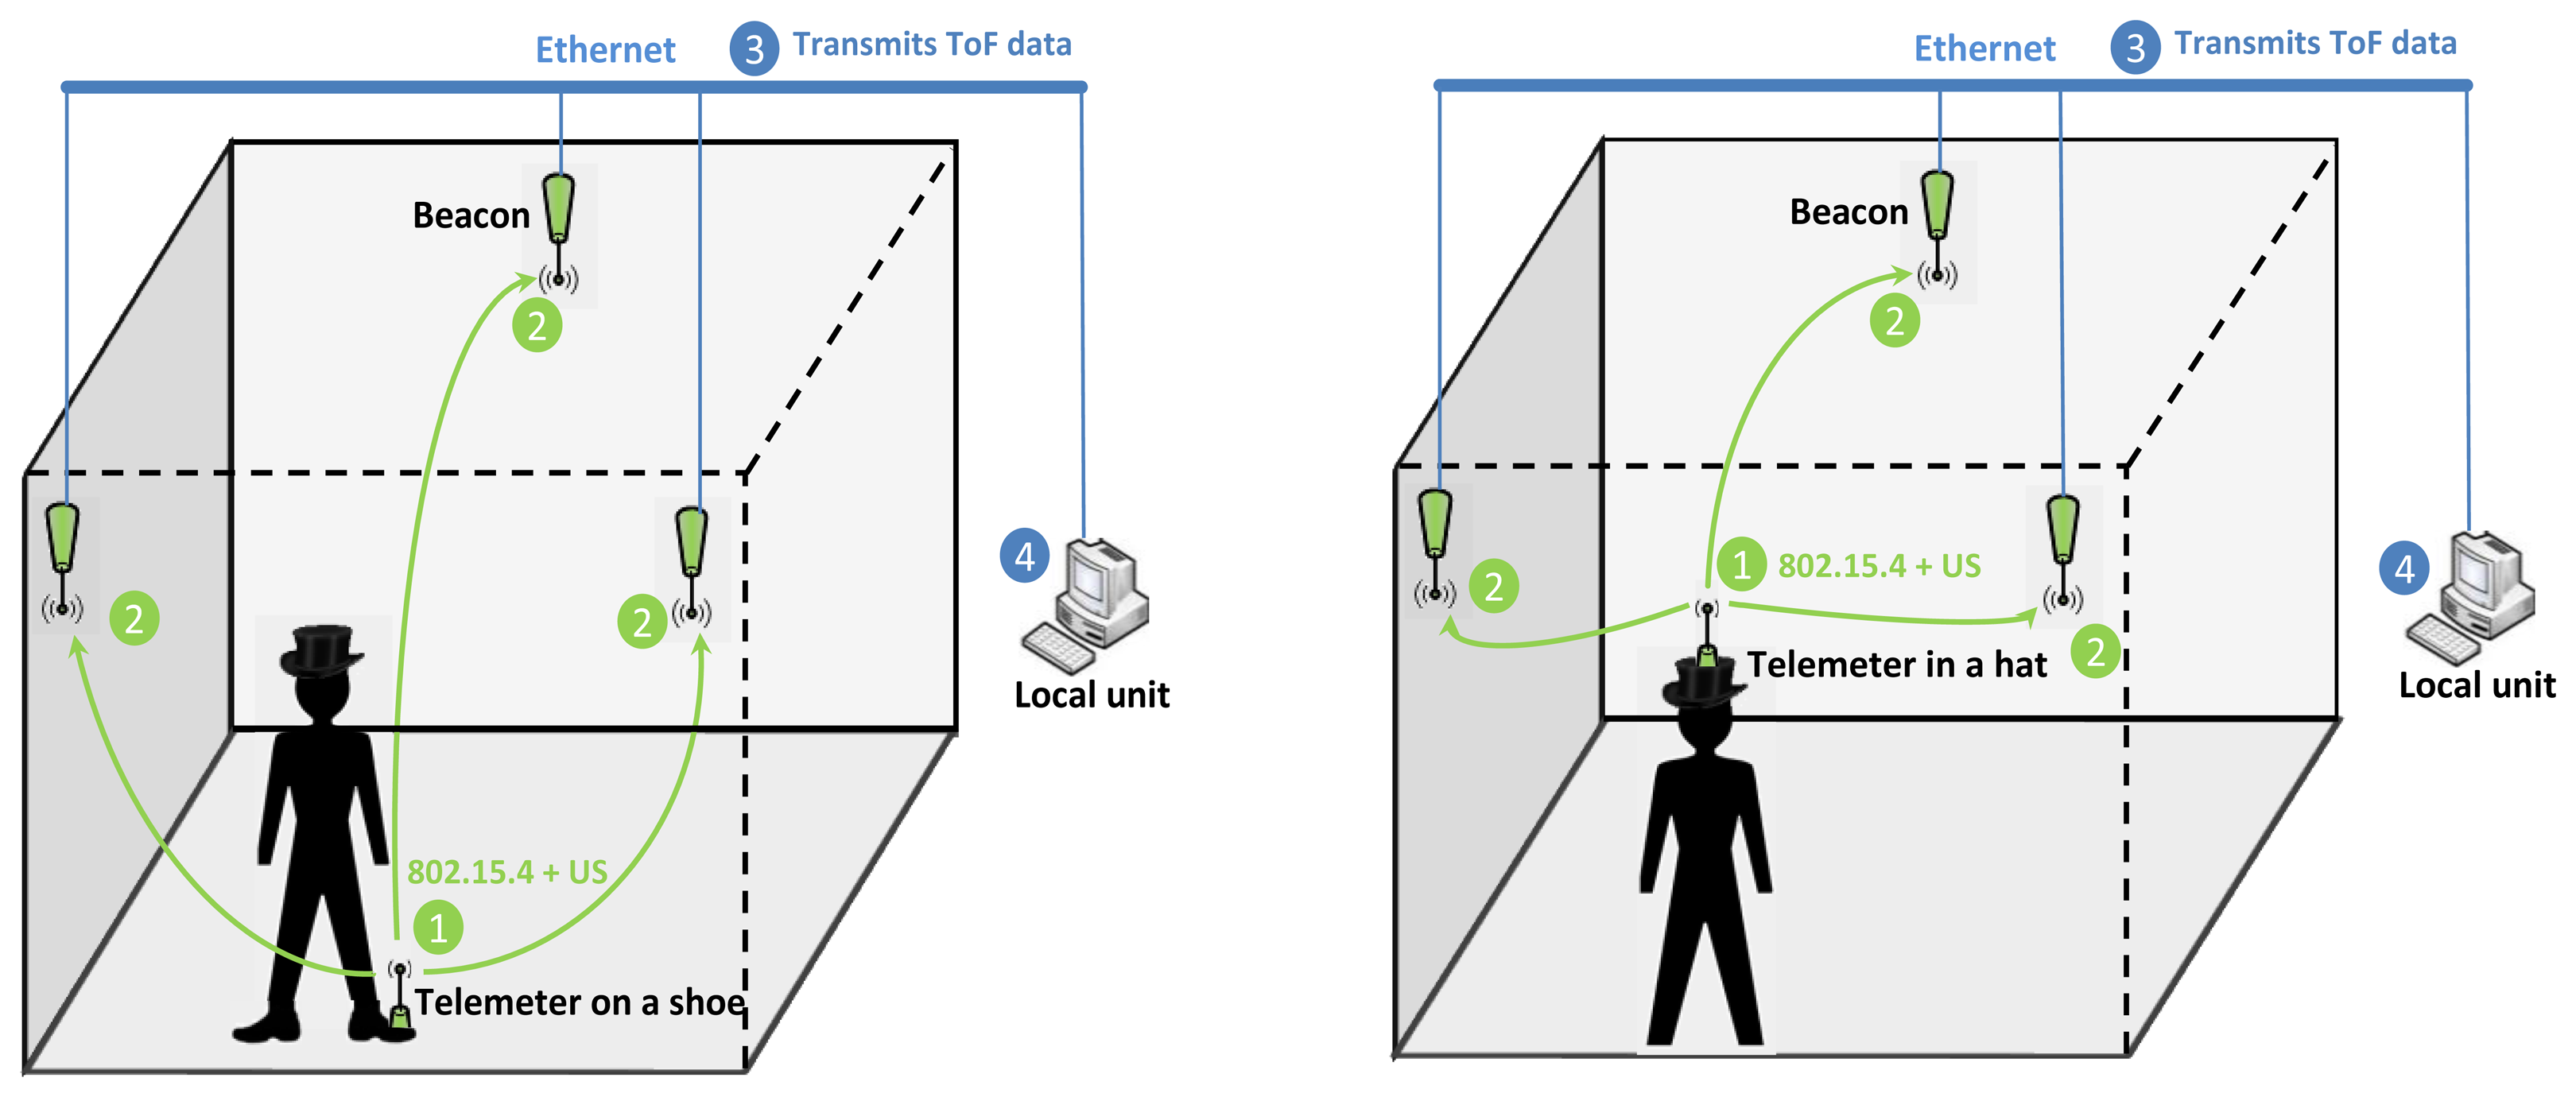
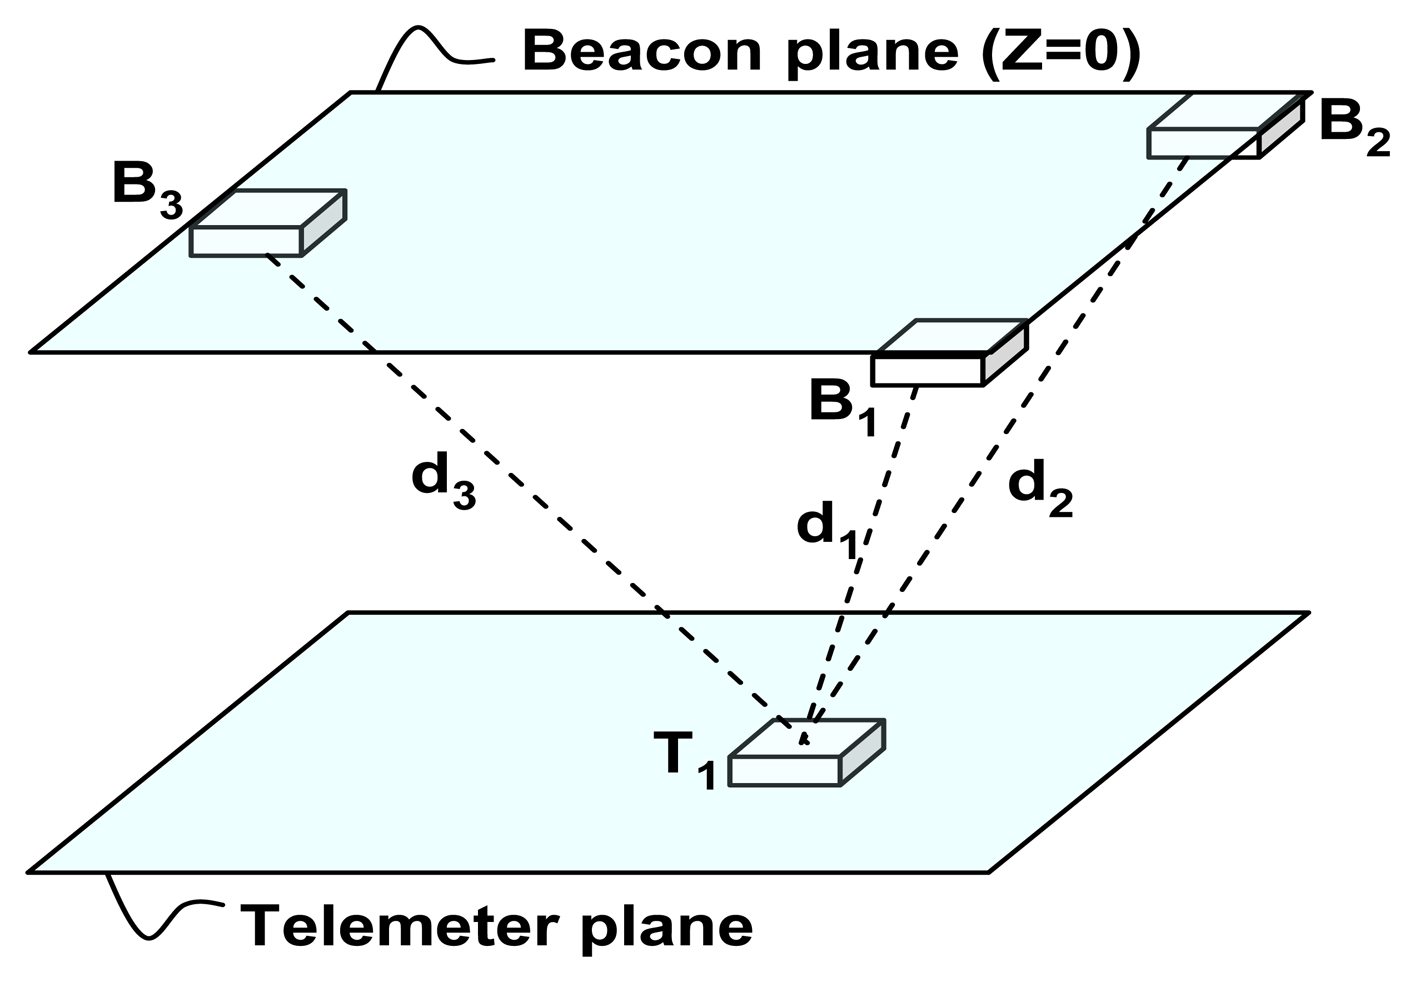
The system presented here is a precise telemetry system composed of four devices: a first node, which is an energy efficient mobile device (called “Telemeter”) and worn by a person on a shoe or in a hat, and three anchor points (called “Beacons”). These Beacons allow the person wearing the device to be located precisely in an indoor environment using a trilateration method. Finally, a local unit enables observation of movements in real time and saves the data in a database. These data are treated in order to compute walking trajectories, the gait speed and the distance covered by the user.
In this paper, we first present the basic principles of the proposed system, then hardware and software development are described. Finally, electrical and localization characterization results are presented.
3. Hardware Presentation
3.1. Prototype Architecture
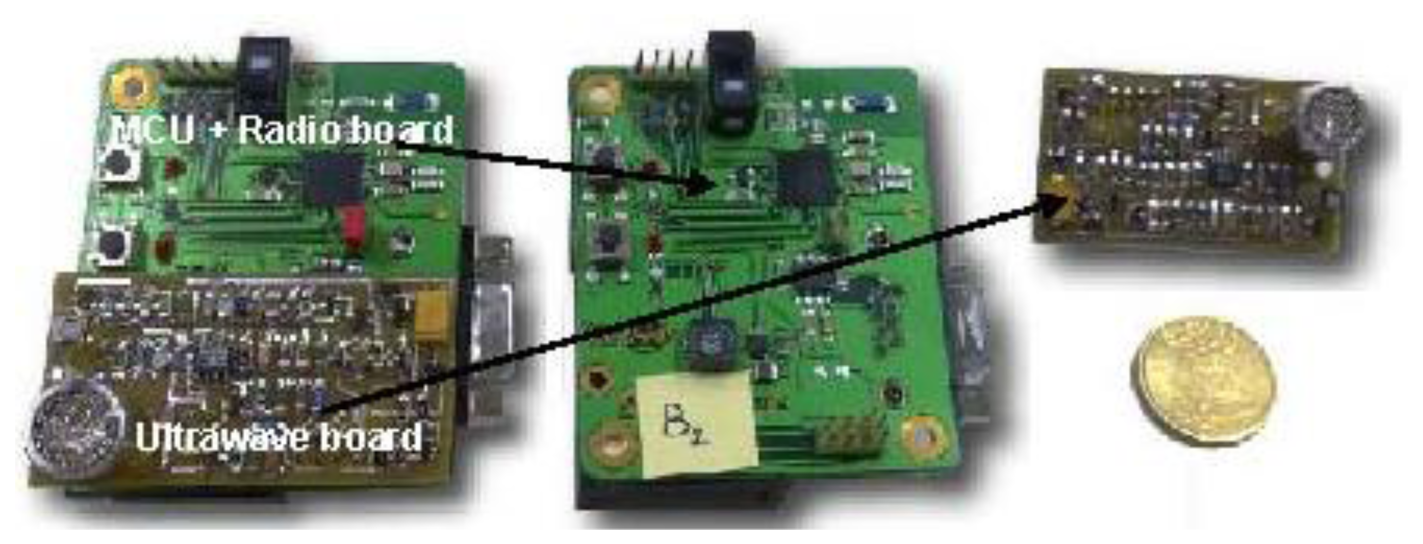
The prototype (Figure 5) comprises two parts separated in two specific boards connected through dedicated Programmable Input/Output (PIO). The first board contains the MicroProcessor Unit (MPU) and a radio modem, while the second board is dedicated to the ultrasonic emission/reception pulses. The details of the hardware architecture and the system block diagram have previously been presented [16].
The system is based on the association of two wireless technologies: ultrasonic and RF 802.15.4. The MPU part aims to handle the 802.15.4 transceiver and command the application. The ultrasonic part aims to compute the ToF of an ultrasonic pulse in the 40 kHz frequency range.
The prototype can be configured in Beacon mode or in Telemeter mode using dedicated programs (see Section 4). In Beacon mode, the system is fixed to a wall and is powered by a 9 V battery or by the electrical grid. In Telemeter mode, the system is worn by the user and is powered by a 9 V battery.
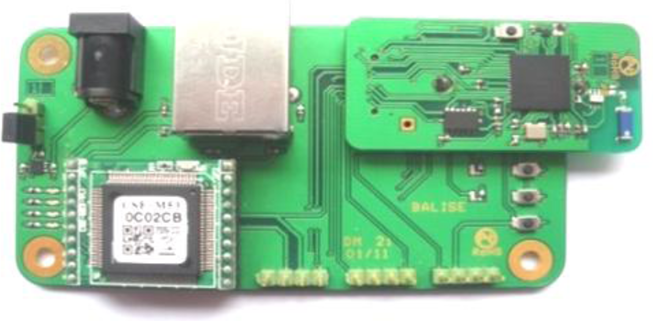
3.2. Ethernet Board
Data received by the Beacon are sent to the local unit via an Ethernet board configured in TCP/IP. This board also has an RF 802.15.4 wireless transceiver. Figure 6 shows the Ethernet board used.
3.3. Telemeter Embedded in Clothes
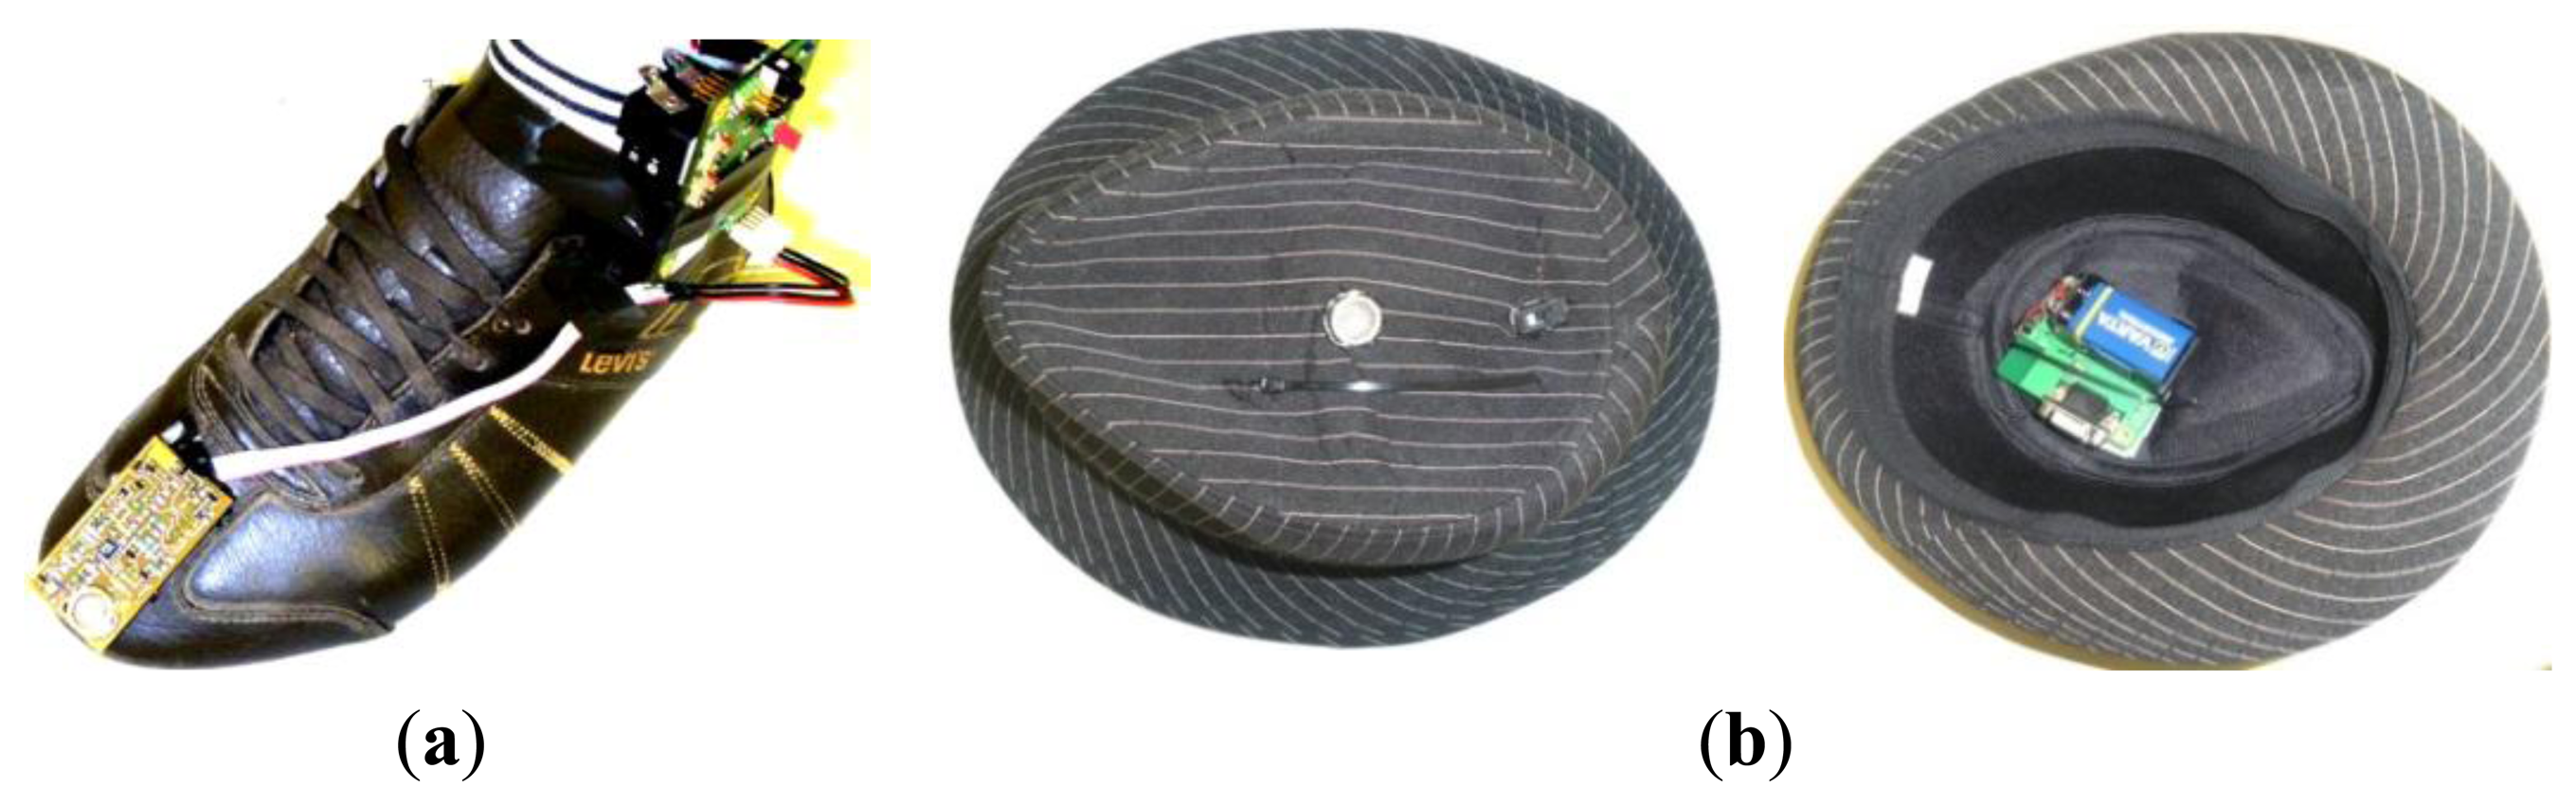
The Telemeter is embedded in clothes in two ways: on a shoe in order to form a “smart” shoe and in a hat in order to form a “smart” hat, as shown in Figure 7.
4. Software Presentation
In order to program the application easily, Freescale offers several software solutions called Code Bases: a basic solution called SMAC, a more complex 802.15.4 compliant stack and a ZigBee compliant stack [31].
For our system, we chose the basic Simple Media Access Controller (SMAC) for several reasons. The most important is that this code base is completely open source and gives access to very low level primitives enabling maximal energy savings. Moreover, this code base is small and easy to implement. The source code is in standard C language and the development environment is Code Warrior [32].
The application software of Telemeter and Beacon were modified on the basis of previous research [16] in order to save energy on the Telemeter application embedded in clothes. The computation of ToF that allows determination of the distance between Beacons and the Telemeter is now performed using fixed Beacons which are connected to the electrical grid. This software is optimized for a single user at home. Interference tests were conducted in previous research [16]. The conclusion of this study is that position errors can occur when more than two telemeters communicate. In a multi-user environment, a synchronization protocol combined with an adapted medium access control algorithm could lower the interference issues from several telemeters.
4.1. Application Software
The application code is integrated in a state machine running on the Beacon and the Telemeter. Localization requests are undertaken periodically (256 ms) using a timer on the Telemeter.
4.1.1. Telemeter software
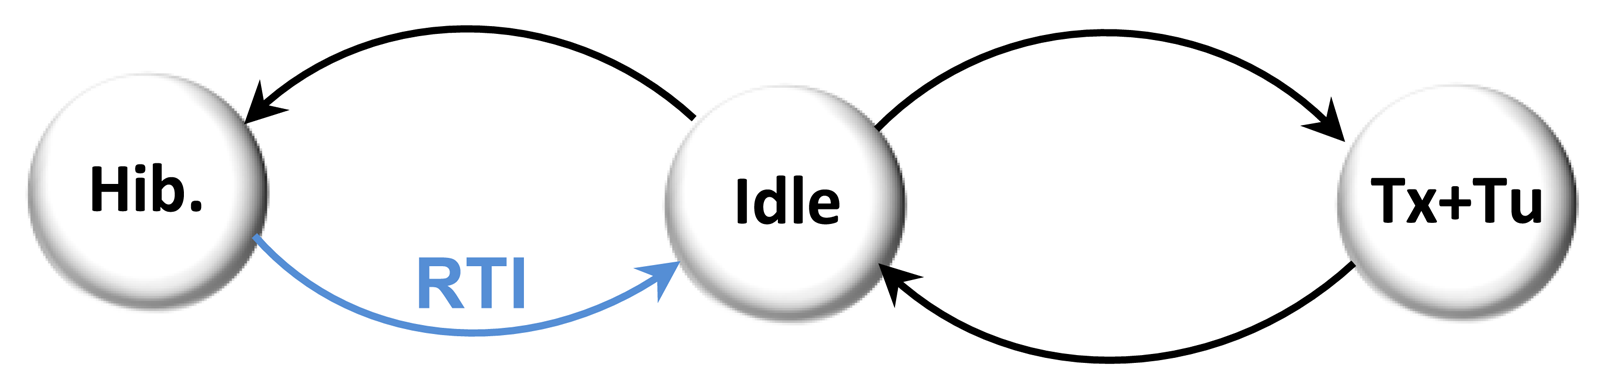
In order to save energy, the system spends most of its time in a deep sleep mode called Hibernate (Hib.). In Hibernate mode, both the transceiver and the processor are powered down. Only a quartz crystal unit is powered, allowing the processor to wake up and then to switch on the radio stage.
The system is woken from the Hibernate state every 256 ms by the real time interrupt (RTI) timer to manage pending commands (Idle). For each wake up, the Telemeter broadcasts an RF localization request (Tx) and generates an ultrasonic pulse (Tu) before returning to the Hibernate state. Each transition of the state machine goes through the Idle state. The state machine is described in Figure 8.
4.1.2. Beacon Software
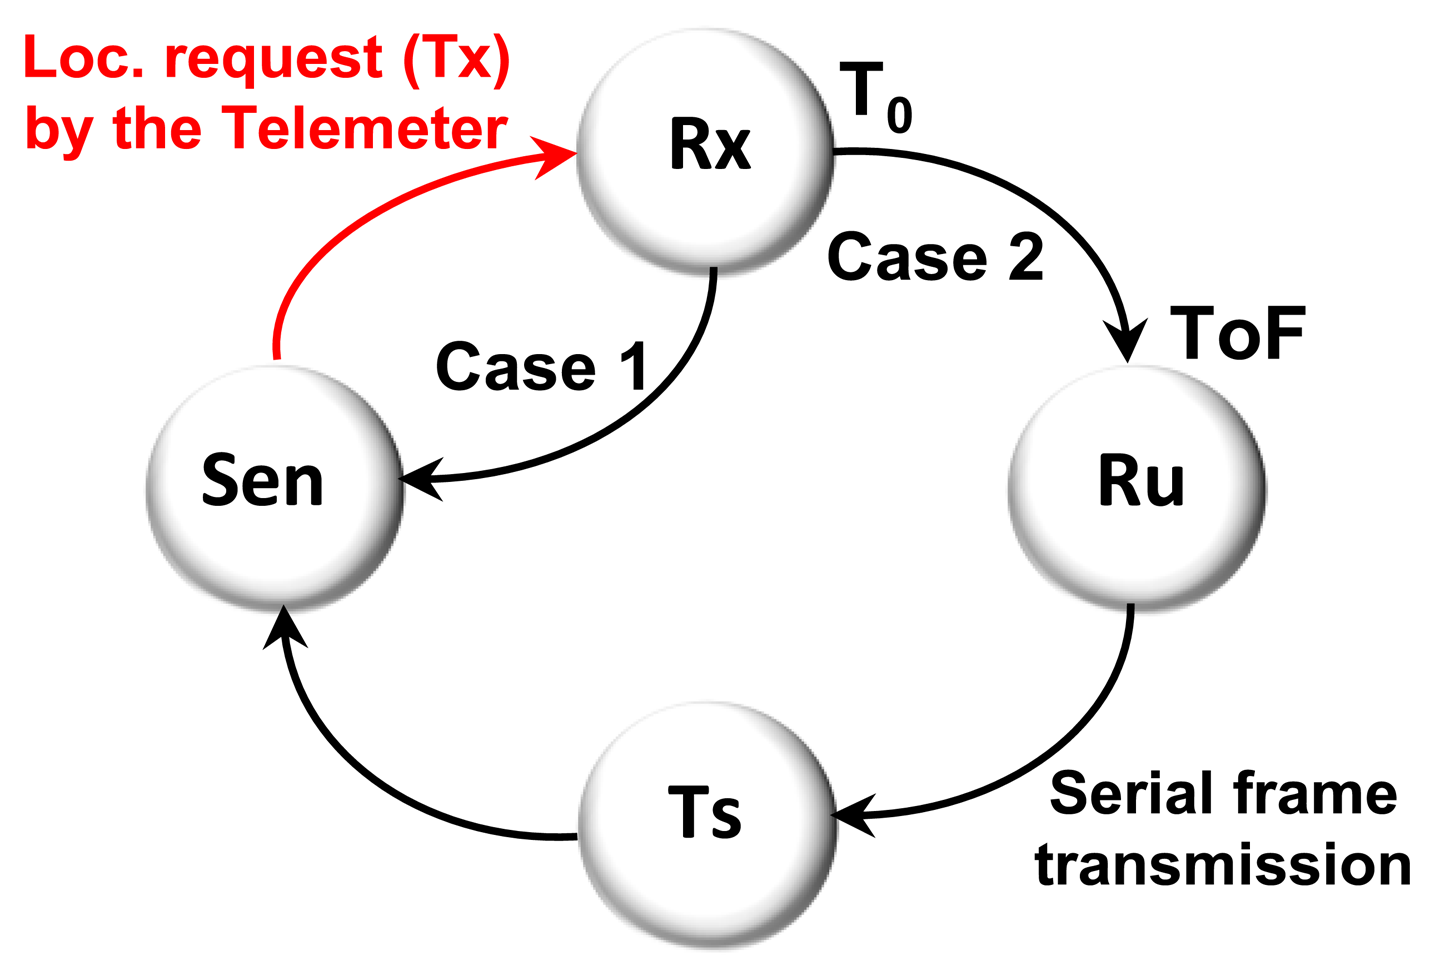
The Beacon node is always in reception mode sensing (Sen) localization requests. As soon as the Beacon node receives (Rx) a localization request (Tx) by the Telemeter, a timer is started (T0). The Beacon waits for an ultrasonic pulse; at this level two cases are possible, as shown in Figure 9:
Case 1: The ultrasonic pulse is not received and the watchdog expires after 60 ms and the system returns to the Sen state.
Case 2: The ultrasonic pulse is received (Ru), so a ToF measurement is performed in order to provide the distance between the Telemeter and the Beacon. The Beacon transmits the serial frame (Ts) to the Ethernet board that contains the ToF and returns to the Sen state.
Each transition of the state machine goes through the Idle state.
4.2. Frame Format
4.2.1. Radio Frames
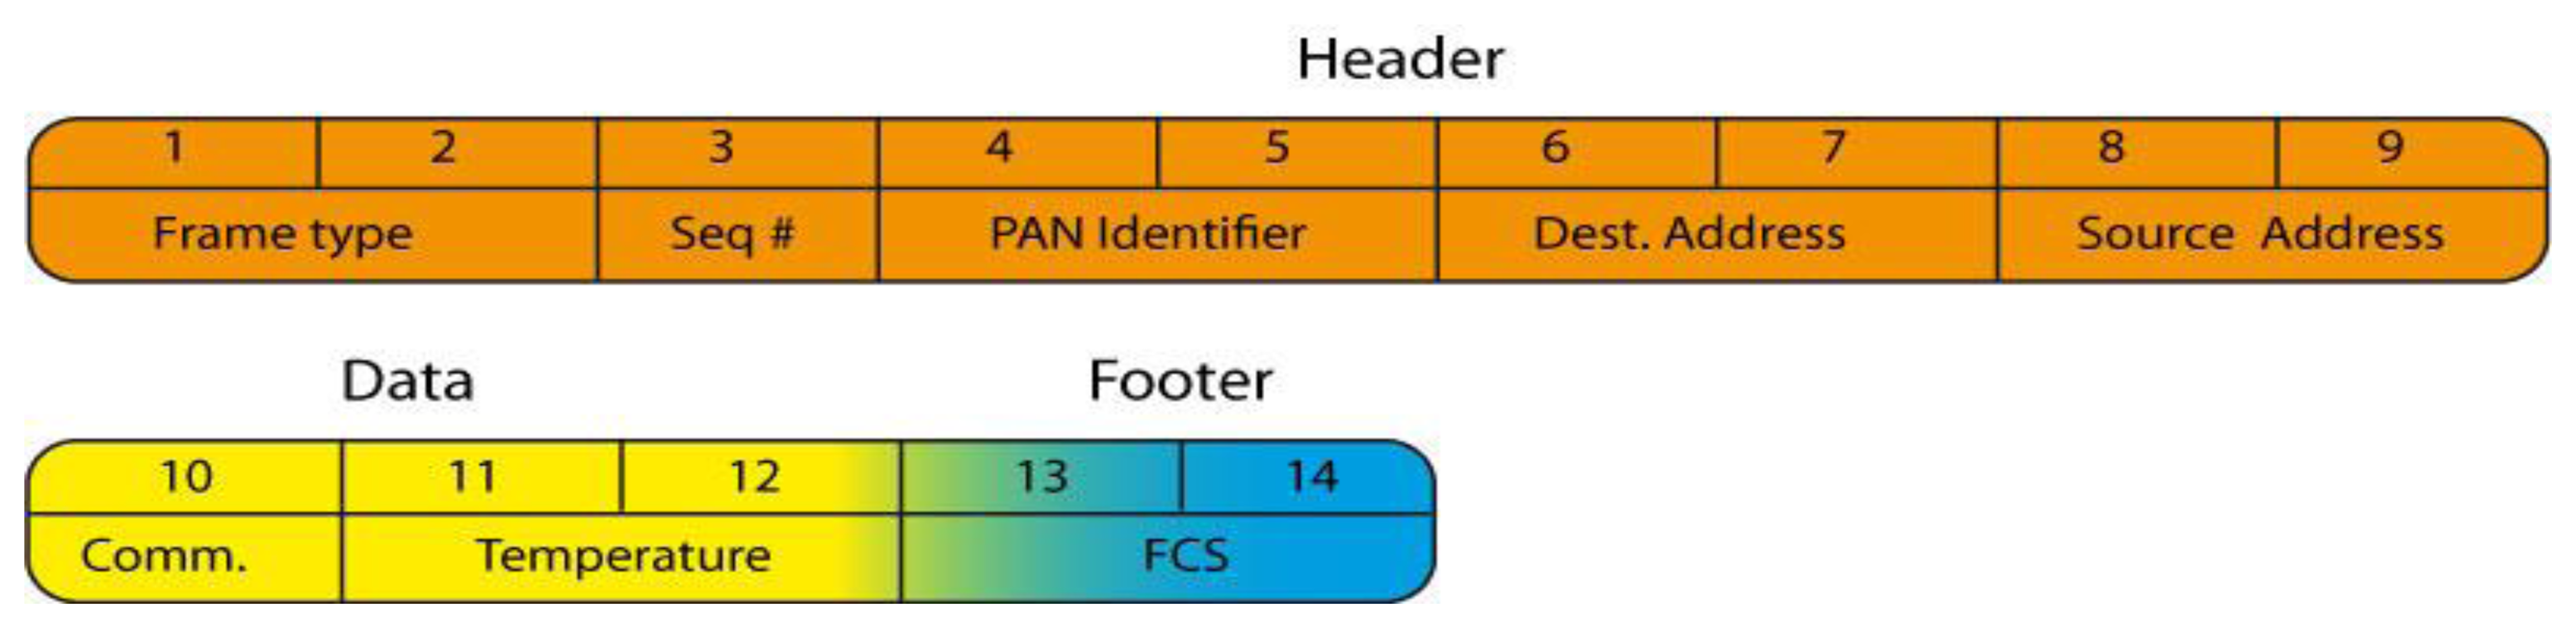
The radio frame format uses the 802.15.4 standard header and adds certain fields. Frames are between 12 and 14 bytes long and are composed of three parts as described in Figure 10.
The frame includes:
The header field: these bytes are specific to the 802.15.4 communication protocol. Details are given in our previous publication [16].
Data field: byte 10 identifies the command type. For this application only one command is implemented, the Localization Request. Bytes 11 and 12 enable the temperature to be sent from the Telemeter to the Beacon node in order to take the US wave propagation speed compensation into account. This field can be used to develop parameters for other non-implemented commands.
The footer field: bytes 13 and 14 are generated automatically by the data transmission primitive implemented in the SMAC code base. The FCS enables frame error detection.
4.2.2. Serial Frames
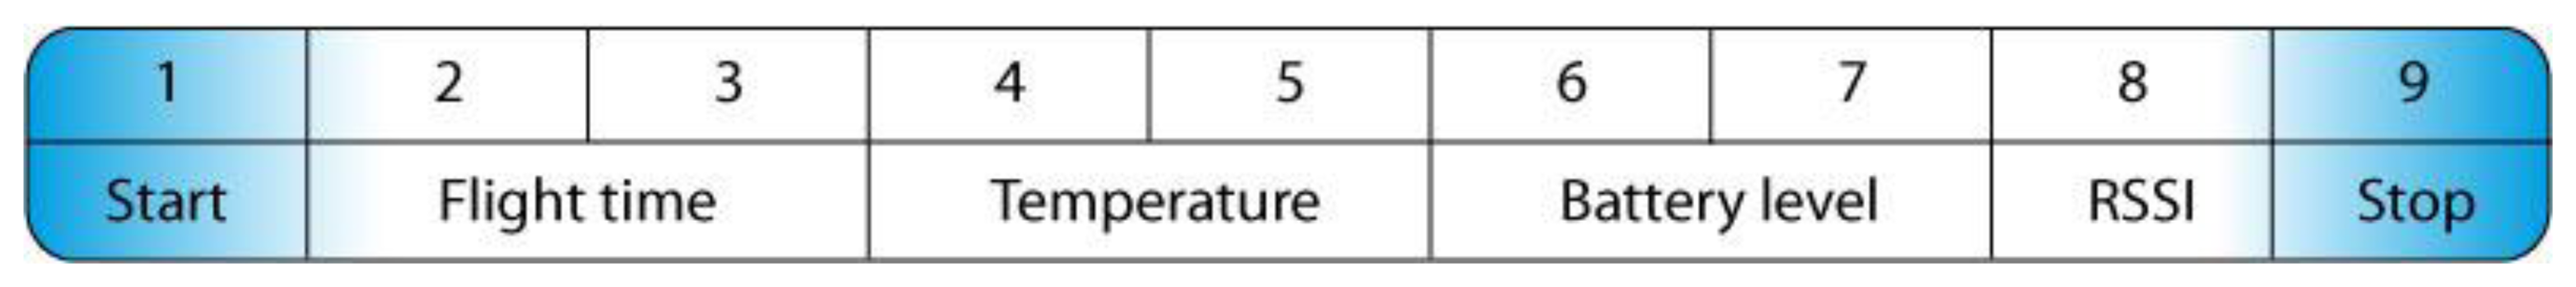
After the Beacon has computed the ToF, a serial data frame is sent to the Ethernet board from the MPU. The format of the frames exchanged between the MPU and the Ethernet board is shown in Figure 11. The three Beacons send a frame allowing the position of the Telemeter to be extracted by the trilateration method.
In this process:
byte 1 is used as a start frame delimiter in order to limit erroneous frames;
bytes 2 and 3 transmit the US wave flight time;
bytes 4 and 5 transmit the Beacon temperature information in order to correct the propagation speed of the ultra-waves;
bytes 6 and 7 transmit the battery level from the integrated battery monitoring system;
byte 8 gives the link quality indicator, which will enable us to compute the receive signal strength indicator (RSSI);
byte 9 is used as a stop frame delimiter in order to limit erroneous frames.
4.3. Real Time Application
The real-time application developed in JAVA uses the ToF computed by the three Beacons in order to locate the Telemeter in our laboratory room using the trilateration method. To perform our measurements, the dimensions of the laboratory room were recorded using 2D Cartesian coordinates. The coordinates of each Beacon were plotted on a virtual map. Reference points have been added in all the meters in order to compare the real and measured positions. The graphical interface presented in Figure 12 displays the Beacon positions, reference points (flags), the current position of the Telemeter (circle point), and the calculation of speed and covered distance at the instant t when the speed is greater than 0.2 m/s.
4.4. Post-Processing Software
The post-processing software developed in JAVA automatically treats the trajectories recorded by the real-time application. The path is filtered and then calculations are made of the total distance covered and the average speed of the path. Figure 13 shows an example of a walking path filtered by the post-processing software. The green flag indicates the start of the path measured, the red flag indicates the stop point, and the blue line is the set point.
5. System Characterization
5.1. Electrical Consumption
In order to characterize electrically the Telemeter and the Beacon, we measured the current going through a serial 50 Ω resistor before the 9 V to 5 V DC/DC converter.
5.1.1. Telemeter
We observe in Figure 14 current peaks (48.8 mA) that correspond to sending simultaneously RF and ultrasonic signals (Tx + Tu) every 256 ms. The rest of the time, the Telemeter is in hibernation mode (Hib.) and consumes very little energy (10 μA).
The average consumption of the Telemeter is estimated in Table 1 functioning as the periodic wake-up timer (RTI).
These measures afford a compromise between the periodic localization request and the autonomy of the Telemeter. We have chosen to fix the RTI at 256 ms in order to increase the resolution of the walking path.
5.1.2. Beacon
Energy consumption has not been optimized for the Beacon because it can be powered by the electrical grid. The average consumption is estimated in Table 2 functioning in terms of the periodic localization request from the Telemeter fixed by its RTI.
5.2. Localization Characterization
5.2.1. Test Environment
The dimensions of the test room were 7 m × 8 m (56 m2), the ground and walls are of mixed reflective surfaces (concrete, plaster, etc.). Figure 15 shows the room configuration with the positions and orientations of the Beacons and the Telemeter.
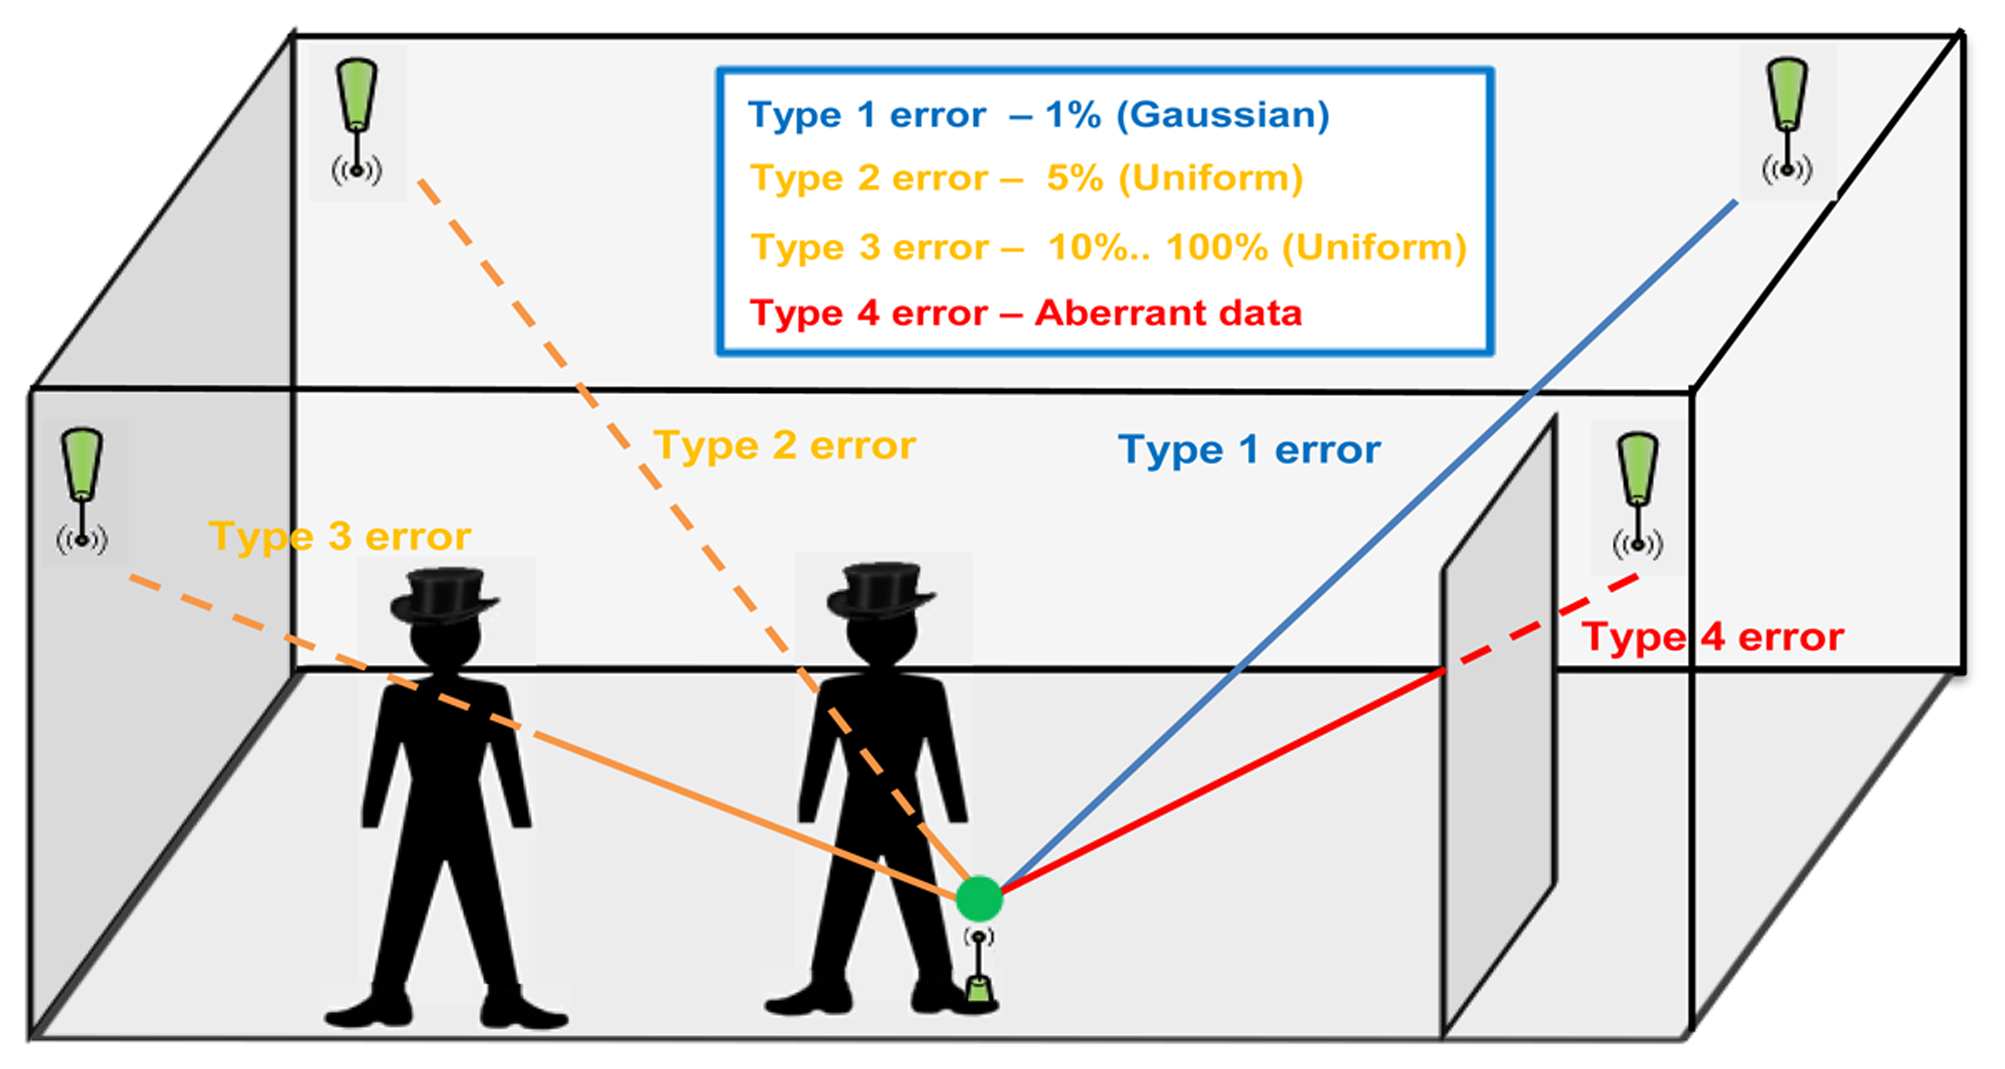
In our experiment, the ultrasonic transmitter of the Telemeter is oriented facing up and the Beacons are inclined to the centre of the laboratory room. In the worst case scenario of this configuration, the misalignment angle between the transmitter and the receiver is around 90°. For a 90° misalignment, the maximum range of the system (Telemeter to Beacon) is 9 m. To remain within the coverage of our system, the monitoring is not undertaken along the walls. The coverage of our system in this configuration is 30 m2. An empty room is the ideal scenario to evaluate the performances of a localization system. In a real environment, the major error sources for an ultrasonic system are related to obstacles (furniture, people, etc.). A study categorizes these error sources into four types [33], as shown in Figure 16.
Type 1 is due to temperature drift, hardware delays, or synchronization misalignment, usually following a Gaussian distribution.
Types 2 and 3 are due to moderate degrees of obstruction of the signal by objects or people around the mobile node. The distribution of obstacles does not follow any particular pattern; these errors can be correctly modeled by a uniform distance-dependent distribution with a maximum value varying from 5% to 100% of the distance.
A Type 4 error means a complete signal blockage, in which case measured data, if any, will be aberrant.
This analysis is very helpful to design the deployment of the beacons. The most important conclusion of this study [33] is that the system must be designed to ensure that sufficient correct data are available to calculate the location of the mobile node accurately, regardless of the environment. Therefore, the best way of ensuring accurate positioning is to collect redundant data and use a good algorithm, such as the least-median-of-squares algorithm [33], that is able to filter out erroneous measurements.
5.2.2. Static Tests
For these tests, we use the real time application in order to record the coordinates of each measurement. For each reference point, we performed 100 static measurements with the Telemeter alone (not embedded in clothes) and placed on the floor. The average distance error (cm) and the standard deviation (cm) between the real and measured positions were computed for each reference point and the global average distance error (cm) was computed overall for the test area.
We report the results of the average position error (cm) and the standard deviations (cm) on the virtual map. Figure 17 shows the results of static tests for each reference position in the test room.
The average position error varies between 2 cm and 28 cm and the standard deviation varies between 0.03 cm and 7 cm depending on the selected position in the test room. The global average position error is 10.8 cm and the global average standard deviation is 2 cm within the coverage of our system 30 m2(5 m × 6 m). We also note that the average position error is larger on the left side of the test room. Indeed, with a single Beacon, the left part of the test room is less well covered and the average position error grows. Thus, positioning a Beacon in each corner of the test room allows the average position error to decrease. The choice of the number of Beacons depends on the application constraints, especially in terms of cost, expected performance and the area to be covered.
5.2.3. Dynamic Tests in Clothes
We assigned 2D Cartesian coordinates on the floor; several tracks are installed on the floor as guidelines. These guidelines are composed of straight lines to facilitate the comparison between the real and estimated paths. These tests are realized with the Telemeter embedded in the clothes of a user. The instruction given to the user was to follow the guidelines at a normal gait speed (∼1 m/s). First, the real time application computes the path using the trilateration method. Then, the post-processing software filters this path and computes the average speed and distance covered. For these tests, we used a chronometer in order to compare the real and estimated measurements of mobility parameters. For each trajectory we measured:
the average position error (cm) with respect to the guidelines;
the maximum position error (cm) with respect to the guidelines;
the average error (%) on the distance covered;
the average error (%) on the gait speed.
We defined several paths to conduct the dynamic tests. The displacements of a person in a living place are generally short, e.g., moving from one room to another, from the sofa to the library, from the table in the dining room to the fridge, etc. Thus, paths 1, 2 and 3 are used to measure the system performances on short paths. Path 4 enables measurement of the system performances on the largest path (closed circuit). Figure 18 shows the tested paths using the smart shoe and smart hat after filtering using post-processing software.
Table 3 shows the measurements with the smart hat on all the defined trajectories.
On short paths (1 to 3) the average position error is less than 5 cm and the maximum position error is 15 cm. The average error on the distance and walking speed in the worst case (path 3) is 7.3% and 9% respectively. Indeed, the condition to detect a movement (fixed at 0.2 m/s) implies a significant error on a short path. However, in long-term monitoring, this error implies less drift on the mobility parameters than position errors in a static position.
On path 4, we note that the average position error decreases with the increasing number of laps. Indeed, when the path is long, the position errors offset each other until they give a minimum average position error (4.5%). The maximum position error recorded logically is greater when the number of measurement points is more important. Finally, the average errors on the mobility parameters decrease with an increasing number of laps. Indeed, the condition to detect a movement has less influence on the calculation of these parameters in the case of a long path. Table 4 shows the measurements for the smart shoe on all the defined trajectories.
The comments for the smart hat remain valid for the smart shoe. However, the performances are lower than those for the smart hat. Indeed, in the case of the smart shoe, the human body can be in opposition between the Telemeter placed on the shoe and the Beacons positioned on the ceiling. The path covered by the ultrasound may be longer in some cases which involve some distorted measuring distances. We note in Figure 17 that the number of measurement points defining the different paths is less important than for the smart hat. Indeed, approximately 25% of positions are filtered by the post-processing software against 10% for the smart hat. Resolution is acceptable with an average of three points per second. The accuracy (>90%) seems acceptable in terms of the long-term monitoring of the elderly at home.
6. Discussion
The choice of the system position in a garment should be considered in relation to the position of the beacons in the environment. In the case of Beacons positioned on the ceiling, the performance of the localization system is better if the Telemeter is positioned on the head. However, this position is not practical for use in real situations because it requires the user to wear a hat in the home. A Telemeter positioned on the shoe seems more interesting from practical perspective. However, the localization system performances could be lower because the number of obstacles at floor level is larger. Thus, the upper body could be more interesting because there are fewer obstacles. The shoulder is an interesting position in terms of performance and integration in a garment (shirt, sweater, etc.). All these issues are currently being studied and a decision will be taken when the final system size is known.
7. Future Works
Currently, we are developing a miniature Telemeter in order to embed it easily into a garment. The radio board has been miniaturized, especially by the replacement of the 9 V battery by a lithium-polymer battery rechargeable (3.7 V, 300 mAh). An accelerometer also has been added in order to measure ADL more precisely. The ultrasonic board is being of miniaturization. The prototype V2 is shown in Figure 19.
In this new configuration, the telemeter can be worn at several locations (e.g., waist, shoulder, shirt pocket, etc.). Home tests must be conducted to select the most appropriate location. It is also planned to perform tests in few volunteer homes. To solve the issues related to obstruction of the signal, it seems essential to use more than three Beacons in the main rooms. In order to have a maximum coverage, it seems that a Beacon positioned in each corner of the ceiling and one Beacon positioned in the middle of the ceiling is a good configuration [33]. Thus, Least-median-of-squares algorithm [33], enables to choose the best combination of three Beacons, in order to localize the mobile node correctly.
Finally, in the perspective of system deployment in a multi-user environment, a synchronization protocol combined with an adapted medium access control algorithm would solve interference issues.
8. Conclusion
The main objective of this work is to provide a “smart” garment for monitoring the ADLs of the elderly in institutions or at home. This tool is a Telemeter system embedded in clothes measuring certain mobility parameters and allowing precise localization in an indoor environment. Indeed, by combining this garment with a network of anchor points, a local unit allows the displacements of a person to be monitored in an indoor environment and in real time. The Telemeter uses an RF 802.15.4 signal to start the ToF measurement of an ultrasonic emission in order to compute the distances between the device worn by the user and three Beacons fixed in the environment. The localization is computed from these distances using the trilateration method. The coverage of the localization system is 30 m2. The characterization of static performances shows:
good reliability: the standard deviation is 2 cm;
good accuracy: the average position error is 10.8 cm.
The mobility parameters are computed using a post processing application to filter measurement points inconsistent with the displacement recorded. Tests were performed with the system embedded on a shoe and in a hat. The characterization of mobility performance shows:
good accuracy on distance covered (92.3% in the worst case);
good accuracy on gait speed (90.5% in the worst case).
The accuracy in terms of the mobility parameters is acceptable in the context of the monitoring of the elderly at home. Indeed, the goal is to provide certain mobility indicators to health professionals so that they can assess development over the long term. In the case of frail elderly people living at home, these indicators allow earlier intervention in the case of abnormal mobility loss and potentially prevention of further mobility loss.
The Telemeter system shows good energy efficiency: the 802.15.4 low power modes have a capacity of up to one month with standard alkaline batteries (for a measurement every 256 ms). At present, the Telemeter system is in the miniaturization process in order to facilitate easier integration in a garment. Home tests must be conducted to define the location of the devices embedded in the environment and worn by the user. In order to deploy the system in a real environment, algorithms must be implemented to correct the issues from interferences and obstruction of the signal.
Acknowledgments
This work was funded by the ANR-Telecom French program.
Conflicts of Interest
The authors declare no conflict of interest.
References
- Chan, M.; Estève, D.; Escriba, C.; Campo, E. A review of smart homes—Present state and future challenges. Comput. Meth. Prog. Biomed. 2008, 91, 55–81. [Google Scholar]
- Gentry, T. Smart homes for people with neurological disability: State of the art. NeuroRehabilitation 2009, 25, 209–217. [Google Scholar]
- Fleury, A.; Vacher, M.; Noury, N. SVM-based multimodal classification of activities of daily living in health smart homes: Sensors, algorithms, and first experimental results. IEEE Trans. Inf. Technol. Biomed. 2010, 14, 274–283. [Google Scholar]
- Cerny, M. Movement Activity Monitoring of Elderly People. Proceedings of the Second International Conference on Computer Engineering and Applications, (ICCEA' 10), Bali Island, Indonesia, 19–21 March 2010; pp. 454–455.
- Krumm, J.; Harris, S.; Meyers, B.; Brumitt, B.; Hale, M.; Shafer, S. Multi-Camera Multi-Person Tracking for EasyLiving. Proceedings of the Third IEEE International Workshop on Visual Surveillance, Dublin, Ireland, 1 July 2000; pp. 3–10.
- Riedel, D.E.; Venkatesh, S.; Liu, W. Spatial Activity Recognition in a Smart Home Environment Using a Chemotactic Model. Proceedings of the Second Intelligent Sensors, Sensor Networks and Information Processing Conference, Melbourne, Australia, 5–8 December 2005; pp. 301–306.
- Barnes, N.M.; Edwards, N.H.; Rose, D.A.D.; Garner, P. Lifestyle monitoring-technology for supported independence. Comp. Contr. Eng. J. 1998, 9, 169–174. [Google Scholar]
- Virone, G.; Noury, N.; Demongeot, J. A system for automatic measurement of circadian activity deviations in telemedicine. IEEE Trans. Biomed. Eng. 2002, 49, 1463–1469. [Google Scholar]
- Chan, M.; Campo, E.; Estève, D. PROSAFE, A Multisensory Remote Monitoring System for the Elderly or the Handicapped. Proceedings of the International Conference on Smart Homes and Health Telematics, (ICOST' 03), Montreal, PQ, Canada, 20–22 June 2011; pp. 89–95.
- Fulk, G.D.; Lopez-Meyer, P.; Sazonov, E.S. Characterizing Walking Activity in People with Stroke. Proceedings of the 33rd Annual International Conference of the IEEE Engineering in Medicine and Biology Society (EMBS' 11), Boston, MA, USA, 30 August–3 September 2011; pp. 5211–5214.
- Martin Schepers, H.; van Asseldonk, E.H.; Baten, C.T.; Veltink, P.H. Ambulatory estimation of foot placement during walking using inertial sensors. J. Biomech. 2010, 43, 3138–3143. [Google Scholar]
- Helal, S.; Mann, W.; El-Zabadani, H.; King, J.; Kaddoura, Y.; Jansen, E. The gator tech smart house: A programmable pervasive space. Computer 2005, 38, 50–60. [Google Scholar]
- Kidd, C.D.; Orr, R.; Abowd, G.D.; Atkeson, C.G.; Essa, I.A.; MacIntyre, B.; Mynatt, E.; Starner, T.E.; Newstetter, W. The Aware Home: A Living Laboratory for Ubiquitous Computing Research. Proceedings of the Second International Workshop on Cooperative Buildings, (CoBuild' 99), Integrating Information, Organization, and Architecture, Pittsburgh, PA, USA, 1–2 October 1999; pp. 191–198.
- Isoda, Y.; Kurakake, S.; Nakano, H. Ubiquitous Sensors Based Human Behavior Modeling and Recognition Using a Spatio-Temporal Representation of User States. Proceedings of the 18th International Conference on Advanced Information Networking and Applications, (AINA' 04), Fukuoka, Japan, 29–31 March 2004; pp. 512–517.
- Charlon, Y.; Bourennane, W.; Bettahar, F.; Campo, E. Activity monitoring system for elderly in a context of smart home. IRBM 2013, 34, 60–63. [Google Scholar]
- Fourty, N.; Charlon, Y.; Campo, E. Embedded wireless system for pedestrian localization in indoor environments. J. Sens. Transd. 2012, 14–2, 211–227. [Google Scholar]
- Fried, L.P.; Tangen, C.M.; Walston, J.; Newman, A.B.; Hirsch, C.; Gottdiener, J.; Seeman, T.; Tracy, R.; Kop, W.J.; Burke, G.; et al. Frailty in older adults: Evidence for a phenotype. J. Gerontol. A Biol. Sci. Med. Sci. 2001, 56, 146–157. [Google Scholar]
- Deak, G.; Curran, K.; Condell, J. A survey of active and passive indoor localisation systems. Comput. Commun. 2012, 35–16, 1939–1954. [Google Scholar]
- Filliata, D.; Meyerb, J. Map-based navigation in mobile robots: A review of localization strategies. Cogni. Syst. Res. 2003, 4, 243–282. [Google Scholar]
- Sanchez, A.; Elvira, S.; de Castro, A.; Glez-de-Rivera, G.; Ribalda, R.; Garrido, J. Low Cost Indoor Ultrasonic Positioning Implemented in FPGA. Proceedings of the 35th Annual Conference of IEEE Industrial Electronics, Porto, Portugal, 3–5 November 2009; pp. 2709–2714.
- Khoury, H.M.; Kamat, V.R. Evaluation of position tracking technologies for user localization in indoor construction environments. Automat. Const. 2009, 18–4, 444–457. [Google Scholar]
- Kuo, W.H.; Chen, Y.S.; Jen, G.T.; Lu, T.W. An Intelligent Positioning Approach: RSSI-Based Indoor and Outdoor Localization Scheme in Zigbee Networks. Proceedings of the International Conference on Machine Learning and Cybernetics, (ICMLC' 10), Qingdao, China, 11–14 July 2010; pp. 2754–2759.
- Huang, C.N.; Chan, C.T. ZigBee-based indoor location system by k-nearest neighbor algorithm with weighted RSSI. Proc. Comp. Sci. 2011, 5, 58–65. [Google Scholar]
- Tsuji, J.; Kawamura, H.; Suzuki, K.; Ikeda, T.; Sashima, A.; Kurumatani, K. ZigBee Based Indoor Localization with Particle Filter Estimation. Proceedings of the IEEE International Conference on Systems Man and Cybernetics, (SMC' 10), Istanbul, Turkey, 10–13 October 2010; pp. 1115–1120.
- Ciurana, M.; Cugno, S.; Barcel-Arroyo, F. WLAN Indoor Positioning Based on TOA with Two Reference Points. Proceedings of the 4th Workshop on Positioning, Navigation and Communication, (WPNC' 07), Hannover, Germany, 22–22 March 2007; pp. 23–28.
- Mautz, R. The Challenges of Indoor Environments and Specification on Some Alternative Positioning Systems. Proceedings of the 6th Workshop on Positioning, Navigation and Communication, (WPNC' 09), Hannover, Germany, 19 March 2009; pp. 29–36.
- Priyantha, N.B.; Chakraborty, A.; Balakrishnan, H. The Cricket Location-Support System. Proceedings of the 6th Annual ACM International Conference on Mobile Computing and Networking, (MobiCom' 00), Boston, MA, USA, 6–11 August 2000; pp. 32–43.
- Hazas, M.; Hopper, A. Broadband ultrasonic location system for improved indoor positioning. IEEE Trans. Mob. Comput. 2006, 5, 536–547. [Google Scholar]
- Harter, A.; Hopper, A.; Steggles, P.; Ward, A.; Webster, P. The Anatomy of a Context-Aware Application. Proceedings of the 5th Annual ACM/IEEE International conference on Mobile computing and networking, (MobiCom' 99), Seattle, WA, USA, 17–19 August 1999; pp. 59–68.
- Man, L.A.N. Committee, S. IEEE Standard for information technology- Telecommunications and information exchange between systems- Local and metropolitan area networks. Specific requirements Part 15.4: Wireless Medium Access Control (MAC) and Physical Layer (PHY) specifications. IEEE Standard 2006, 137, 1–305. [Google Scholar]
- Daintree Networks. Available online: http://www.daintree.net/sna/sna.php (accessed on 12 June 2013).
- Freescale. Available online: http://www.freescale.com/webapp/sps/site/homepage.jsp?code/=CW_HOME (accessed on 12 June 2013).
- Casas, R.; Marco, A.; Guerrero, J.J.; Falco, J.L. Robust estimator for non-line-of-sight error mitigation in indoor localization. J. Appl. Sig. Process. 2006, 2006, 1–8. [Google Scholar]


| RTI of the Telemeter (ms) | Average current consumption of the Telemeter (mA) |
|---|---|
| 256 | 4.3 |
| 512 | 2.9 |
| 1,024 | 2.0 |
| RTI of the Telemeter (ms) | Average current consumption of the Beacon (mA) |
|---|---|
| 256 | 19.4 |
| 512 | 24.2 |
| 1,024 | 27.8 |
| Smart Hat Trajectories | Average Position Error (cm) | Maximum Position Error (cm) | Average Error on Distance Covered (%) | Average Error on Gait Speed (%) |
|---|---|---|---|---|
| Trajectory 1 | 0.8 | 8 | 5.3 | 7.6 |
| Trajectory 2 | 1.4 | 6 | 6.2 | 8.1 |
| Trajectory 3 | 4.4 | 15 | 7.3 | 9 |
| Trajectory 4 (1 lap) | 6.3 | 26 | 7.7 | 9.2 |
| Trajectory 4 (3 laps) | 5.2 | 28 | 4.1 | 4.9 |
| Trajectory 4 (5 laps) | 4.9 | 30 | 3.9 | 4.5 |
| Smart Shoe Trajectories | Average Position Error (cm) | Maximum Position Error (cm) | Average Error on Distance Covered (%) | Average Error on Gait Speed (%) |
|---|---|---|---|---|
| Trajectory 1 | 3.4 | 13 | 6.7 | 8.2 |
| Trajectory 2 | 2.8 | 17 | 7.5 | 8.8 |
| Trajectory 3 | 5.6 | 26 | 7.7 | 9.1 |
| Trajectory 4 (1 lap) | 7 | 38 | 8 | 9.5 |
| Trajectory 4 (3 laps) | 6.1 | 34 | 4.8 | 5.7 |
| Trajectory 4 (5 laps) | 5.4 | 43 | 4.5 | 5.5 |
© 2013 by the authors; licensee MDPI, Basel, Switzerland. This article is an open access article distributed under the terms and conditions of the Creative Commons Attribution license (http://creativecommons.org/licenses/by/3.0/).
Share and Cite
Charlon, Y.; Fourty, N.; Campo, E. A Telemetry System Embedded in Clothes for Indoor Localization and Elderly Health Monitoring. Sensors 2013, 13, 11728-11749. https://doi.org/10.3390/s130911728
Charlon Y, Fourty N, Campo E. A Telemetry System Embedded in Clothes for Indoor Localization and Elderly Health Monitoring. Sensors. 2013; 13(9):11728-11749. https://doi.org/10.3390/s130911728
Chicago/Turabian StyleCharlon, Yoann, Nicolas Fourty, and Eric Campo. 2013. "A Telemetry System Embedded in Clothes for Indoor Localization and Elderly Health Monitoring" Sensors 13, no. 9: 11728-11749. https://doi.org/10.3390/s130911728