Fall Detection with the Support Vector Machine during Scripted and Continuous Unscripted Activities


Abstract
: In recent years, the number of proposed fall-detection systems that have been developed has increased dramatically. A threshold-based algorithm utilizing an accelerometer has been used to detect low-complexity falling activities. In this study, we defined activities in which the body's center of gravity quickly declines as falling activities of daily life (ADLs). In the non-falling ADLs, we also focused on the body's center of gravity. A hyperplane of the support vector machine (SVM) was used as the separating plane to replace the traditional threshold method for the detection of falling ADLs. The scripted and continuous unscripted activities were performed by two groups of young volunteers (20 subjects) and one group of elderly volunteers (five subjects). The results showed that the four parameters of the input vector had the best accuracy with 99.1% and 98.4% in the training and testing, respectively. For the continuous unscripted test of one hour, there were two and one false positive events among young volunteers and elderly volunteers, respectively.1. Introduction
In 2010, 10.7% of Taiwan's population was age 65 or older. According to the government's evaluation, this proportion will become over 20% by 2025. Among the elderly, falls are not only life threatening [1] but also herald an inability to live independently [2]. Injuries from falls include broken bones, superficial cuts and abrasions to the skin as well as connective and soft tissue damage [3–5]. Detection of a fall would help to reduce the time between the fall and the arrival of medical attention [6,7], which could be realized either through an automatic fall-detection system or through a Personal Emergency Response System (PERS). However, the most common existing PERS using the push-button pendant is not always a satisfactory fall-detection method when elderly people lose consciousness or faint [8].
In recent years, the number of proposed fall-detection systems developed has increased dramatically [1,9]. The waist is a popular location for a fall-detection system because it provides reliable indications of full-body movements [10–12]. Studies have evaluated a set of fall-detection algorithms on data that recorded from 20 middle-aged volunteers (40–65 years old), performing six different falls and four scripted activities of daily living (ADL) [10,11]. The same ADLs were also recorded from 21 adults (aged 58–98 years) in a residential care unit. The results showed that a threshold on the impact and posture can achieve 97.5% sensitivity and 100% specificity. Chao et al. [13] recorded seven male subjects performing eight different types of falls and 17 functional ADLs. Using a combination algorithm of acceleration cross-products and post-fall postures, a sensitivity of 100% and a specificity of 49.8% were obtained. Bourke et al. [14] recorded 10 young healthy volunteers performing 240 falls and 120 ADLs and 10 elderly healthy volunteers performing 240 scripted ADLs; they employed thresholds on the velocity, impact and posture to achieve 100% specificity and sensitivity with a false-positive rate of 0.6 FP/day for continuous unscripted activities.
In previous studies, the signals of a tri-axial accelerometer were combined to produce many action parameters, such as the total sum vector, the dynamic sum vector, the sliding sum vector, the velocity and the tilting angle. Prior studies [14,15] have defined thresholds as criteria for fall-detection systems. A falling ADL is considered as falling down, such as forward fall, backward fall and lateral fall with both legs straight or with knee flexion [9–16]. The ADLs consist of sitting on a bed or chair, lying on a bed, walking up and down the stairs and walking [9–16]. However, the acts of standing and falling down are not classified as falling ADLs. Falling ADLs also include sitting at the bedside and slipping on the ground, sitting on a wheelchair and slipping on the ground, rolling off a bed or falling out of bed [17].
Support vector machine (SVM)-based classification methods represent a major development in pattern recognition research, for which innovation is the ability to find a hyperplane dividing samples into two classes and having the widest margin between them. Moreover, the hyperplane concept can extend a higher dimensional set with a kernel function to make a nonlinear separating hyperplane. This hyperplane, with maximum margins, can be formulated as a quadratic optimization problem in feature space. The subsets of patterns that are closest to the decision boundary are called support vectors. Therefore, SVMs have been applied to many pattern recognition and classification problems in bioinformatics [18–22]. Brown et al. [23] described a successful use of SVMs applied to gene expression data for the task of classifying unseen genes. Dehmeshki et al. [24] used SVMs for the classification of lung data. Chu et al. [25] applied SVMs for cancer diagnosis based on micro-array gene expression data and protein secondary structure prediction. Guler and Ubeyli [26] used SVMs on the classification of EEG signals. SVMs are also applied to ECG signal analysis and arrhythmia classification [27–29]. SVMs can also be used as criteria to detect the QRS complexes in 12-lead electrocardiograms [30].
In this study, we will first define falling ADLs as actions in which the center of gravity of the body quickly descends. These activities include, but are not limited to, slipping while ascending stairs, slipping while descending stairs, stumbling and falling down forwards, backwards falling down, lateral falling down, and falling down with a weak leg but also sitting on a bedside and slipping onto the ground, sitting in a wheelchair and slipping onto the ground, rolling down from a bed, and falling down on a bed. Moreover, the accelerometer measures the moving acceleration. If a non-falling ADL does not include the body's center of gravity falling down, then it is certain to be distinguished from the falling ADLs. Thus, our studies focus on non-falling ADLs in which the action involves the center of gravity falling. The non-falling ADLs include walking up stairs, walking down stairs, sitting down on a bed, standing up from a bed, sitting down in a wheelchair, standing up from a wheelchair, walking, lying down, sitting up from lying, squatting down, and standing up. Second, we used the hyperplane of the SVM as the separating plane to replace the traditional threshold method for the detection of falling ADLs on a comprehensive dataset containing simulated falling ADLs, non-falling ADLs, and continuously scripted ADLs, including falling ADLs and continuous unscripted ADLs performed by young and elderly volunteers with our designed device.
2. Overview of System
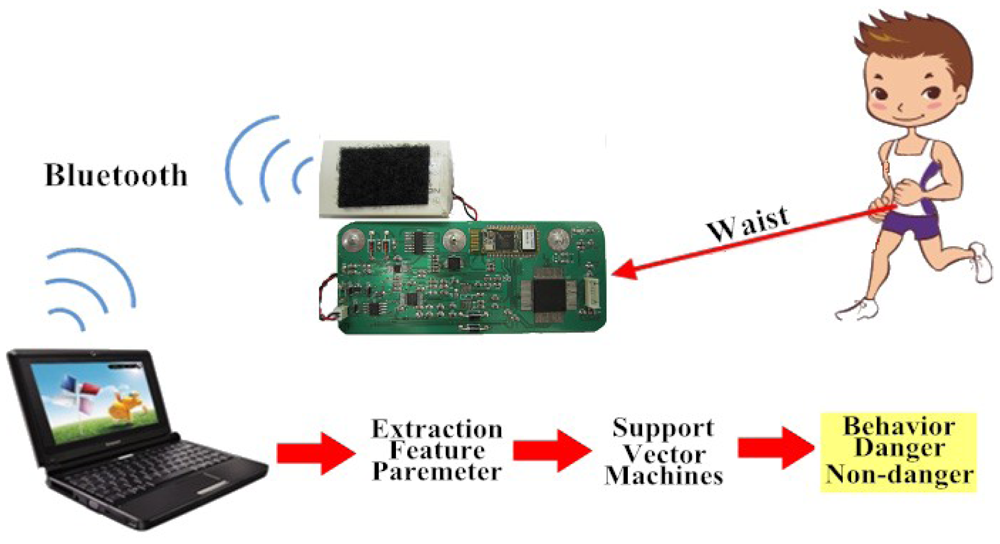
Figure 1 shows the flow diagram of our method. Subjects wore our designed device at the waist, which had a tri-axial accelerometer (Kionix Inc., KXPA4-2050, Range: ±2 g), a Bluetooth module (Atrie Inc., BTM-204B), and a microprocessor (Texas Instruments Inc., MSP430 F5438). The resolution was 12 bits and the sampling rate was 200 Hz for the signals of the tri-axial accelerometer. Digital accelerometer signals were then transferred to a Bluetooth chip and transmitted wirelessly to a remote server. A Visual Basic-based interface system was used to receive a Bluetooth transmitted signal and also to display and store information. Furthermore, feature extraction and falling ADL detection were performed by a program coded in Matlab.
3. Feature Extraction
Four different parameters that are associated with falling ADLs were examined: total sum vector, fast changed vector, vertical acceleration, and posture angle [14–16]. First, the total sum vector, SVTotal(t), containing both the dynamic and static acceleration components is calculated from the sampled data, as indicated below:
Second, the fast changed vector, CVFast(t), is calculated using the differences between the maximum and minimum acceleration in a 0.1 s sliding window for each axis, as follows:
4. Support Vector Machines
Considering a linearly separable dataset {Xi, Di}, i = 1, …, m, where Xi is the input pattern for the ith example and Di is the corresponding desired output (1, or −1), a hyperplane could be identified as the decision surface. This hyperplane can be written as follows:
When W and b are rescaled, the point nearest to the hyperplane has a distance of 1/‖w‖. By the use of Lagrange multipliers αi ≥ 0, and the Kuhan–Tuker theorem, the solution is given by the following:
Only a small fraction of the αj coefficient is nonzero. The corresponding pairs of Xj are known as support vectors (SV) and they define the decision boundary. All of the other input patterns with corresponding zero αj values are rendered irrelevant.
If the data are noisy, there will, in general, be no separation in the feature space. To optimize the margin slack vector, we need to introduce slack variables to allow the margin constraints to be violated. We can rewrite the objective function of the quadratic optimization problem as the following:
The solution given is similar to Equation (8) and the Lagrange multipliers are 0 ≤ αi ≤ C, i = 1, …, m. Finally, the hyperplane decision function for the input pattern vector X can be written as follows:
By replacing the inner product XT jX with the kernel function K(X, Xj), the input patterns are mapped to a higher dimensional space [31]. In this higher dimension, a separating hyperplane is constructed to maximize the margin.
We used LIBSVM software to detect the falling ADLs. LIBSVM is an integrated software package for support vector classification, regression and distribution estimation [32]. In the present problem, the Gaussian radial basis function was used to construct the kernel function, which is given below:
5. Experimental Results
There are three experimental procedures, including simulated ADL-based young volunteers, continuous unscripted ADL without falling ADL-based young and elderly volunteers, and continuous unscripted ADL with three falling ADL-based young volunteers. The classification performances were examined based on the sensitivity, specificity, and total classification accuracy. The sensitivity is the number of true positive (TP) decisions divided by the number of actual positive cases; the specificity is the number of true negative (TN) decisions divided by the number of actual negative cases. The total classification accuracy is the number of correct decisions divided by the total number of cases.
5.1. Simulated ADL
In this experiment, the two-fold cross-validation was used on half of the recorded data for training and the second half of the data from the same individuals for testing. Another testing was used on half of the subjects for training and half of the subjects for testing. However, much personal equipment has to be calibrated before use for the user; therefore using the user's behavior to train personal equipment is a more feasible method.
Ten healthy young volunteers (Set 1 in Table 1), five male and five female, performed 10 simulated falling ADLs and 11 simulated non-falling ADLs. Each ADL was repeated 10 times for the first experiment. The volunteers ranged from 24 to 35 years (27.2 ± 3.6 years), with a body mass of 68–111 kg (84.27 ± 14.4 kg) and a height of 1.65 to 1.96 m (1.81 ± 0.1 m). Simulated falling ADLs and non-falling ADLs were organized and are numbered in Table 2. The height of the bed was 62 cm, and the height of the wheelchair was 50 cm.
In simulated ADLs, we randomly chose five recorded signals of every ADL for each subject as the training input. Thus, the falling ADLs have 500 datasets, and the non-falling ADLs have 550 dataset. We extracted the ADL parameters described in Section 3 from the recorded signals. The training dataset were transformed into the format of LIBSVM. A training instance matrix is an m by n matrix. In this study, n is the ADL parameter's number. The number of training instances was equal to the sampled number of 1,050 selected datasets. The profile of the CVFast parameter was used to mark the falling range. We found the maximum value of the CVFast of each falling ADL. This value multiplied by 0.87 was set as the threshold. The elements of the training label vector were set to 1 when the training instance was over this threshold and were set to −1 when it was not over the threshold or belonged to a non-falling ADL. Table 3 shows the optimal training results with different parameters' combinations. We found that the combination of four parameters has the best results, with an accuracy of 99.14%, a sensitivity of 99.60%, and a specificity of 98.73%. Therefore, we used this SVM model to test the three experimental procedures. The first phase is the test of the simulated ADL.
Another 1,050 datasets were used to test the performance of the SVM. Table 4 shows the testing of the optimal results with different parameter combinations with the same criteria in training the SVM models. We also find that the results of four parameters are best, with an accuracy of 98.38%, a sensitivity of 97.40%, and a specificity of 99.27%. In addition, the pieces of equipment used in the test include one Intel i5 M480 2.67 GHz processor, 4 GB memory and Windows 7 operating system while the Matlab software 2009 version was used for development. The computation time was mainly spent on calculating the feature vectors as well as the kernel function and weight sum of the support vector. The experimental results showed that it takes about 1ms to calculate the feature vector, while the number of support vectors is about 10% of that of the training samples. Moreover, it takes about 3 ms to calculate the kernel function, so the computation time is about 4 ms which is less than the sampling time 5 ms. Therefore, this proves that the proposed method could be effective in real applications.
To analyze what actions are easily misclassified, Table 5 shows the frequency of the false classification of each ADL and the accuracy. The action of slipping when ascending stairs has the worst classification. The reason likely has to do with the procedure of the simulated action.
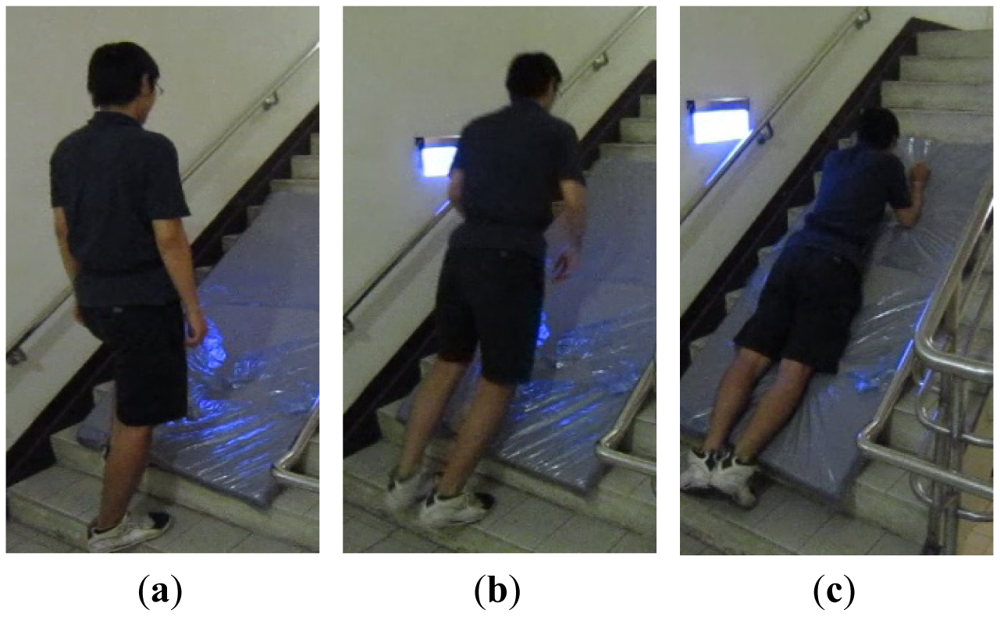
Figure 2 shows the decomposition of the motion, with the subject walking up the stairs, slipping and forward and falling down with a knee flexion, and the body lying on the stairs. We could find that the falling acceleration of the body's center of gravity and the falling distances are all lower than the other falling ADLs. Moreover, in continuous action including three falling ADLs, the types of missing detection are very similar to the types of worse classification in the simulated actions when the action of slipping and ascending stairs was excluded. These results show that the SVM method has a unified approach for the falling ADLs.
5.2. Continuous Unscripted ADL without Falling Activities
In continuous unscripted studies, five elderly volunteers, one male and four female (Set 2 in Table 1), who ranged from 70 to 83 years (74.3 ± 2.9 years), with a body mass of 46 to 65 kg (54.5 ± 4.7 kg) and a height from 148 to 158 cm (152.7 ± 2.3 cm), wore the device continuously for up to one hour. In this group, one subject had apoplexy and one subject had fallen down twice and broken his right leg bone and left humerus. During this time, volunteers conducted their normal activities, including sitting, lying, walking, walking up and down stairs, and doing house work. These studies took place at the volunteers' homes. Second, the same young volunteers (Set 1 in Table 1), including three males and two females, who executed the simulated experiment also performed continuous unscripted ADL, the same as the elderly volunteers, for up to one hour. These studies took place at the volunteers' school.
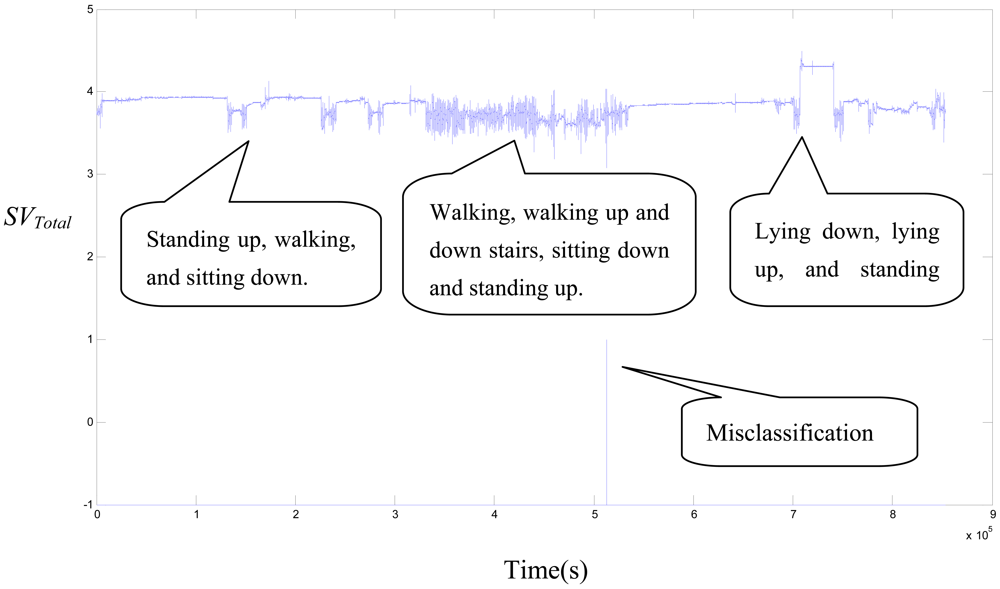
There are two conditions under which continuous action contains only non-falling ADLs for one hour. The four parameter combination in the input vector was used to test the SVM model. The false positive (FP) quantity and false positive rate (FP/h) were utilized to show the performance. The results from the same five young volunteers are shown in Table 6. The total time is 385.1 minutes and the FPs occurred three times. The false positive rate is 0.48 FP/h. The result from the five elderly volunteers is shown in Table 7. The total time is 363.8 minutes and there is one FP. The false positive rate is 0.18 FP/h. Figure 3 shows the SVTotal signal for the continuous action of the EF_3 subject. There is one FP during the act of walking down the stairs. The above results show that elderly people with slow and moderate activities have a lower FP rate than young people with intense and fast activities. On the other hand, the falling definition that we detected in this paper is different from that of previous studies. Therefore, the FP rate we obtained is relatively high than the threshold-based algorithm in unscripted continuous experiments.
5.3. Continuous Unscripted ADL
In continuous action, including three times falling ADLs, another ten young volunteers conducted this experiment (Set 3 in Table 2). Five males and five females, who ranged from 24 to 28 years (26.4 ± 2.2 years), with a body mass of 68–111 kg (84.27 ± 14.4 kg) and a height from 170 to 176 cm (173.8 ± 1.1 cm), continued to wear the device for 5 minutes. They not only conducted the non-falling ADLs, like the elderly volunteers, but also conducted falling ADLs three times during this period.
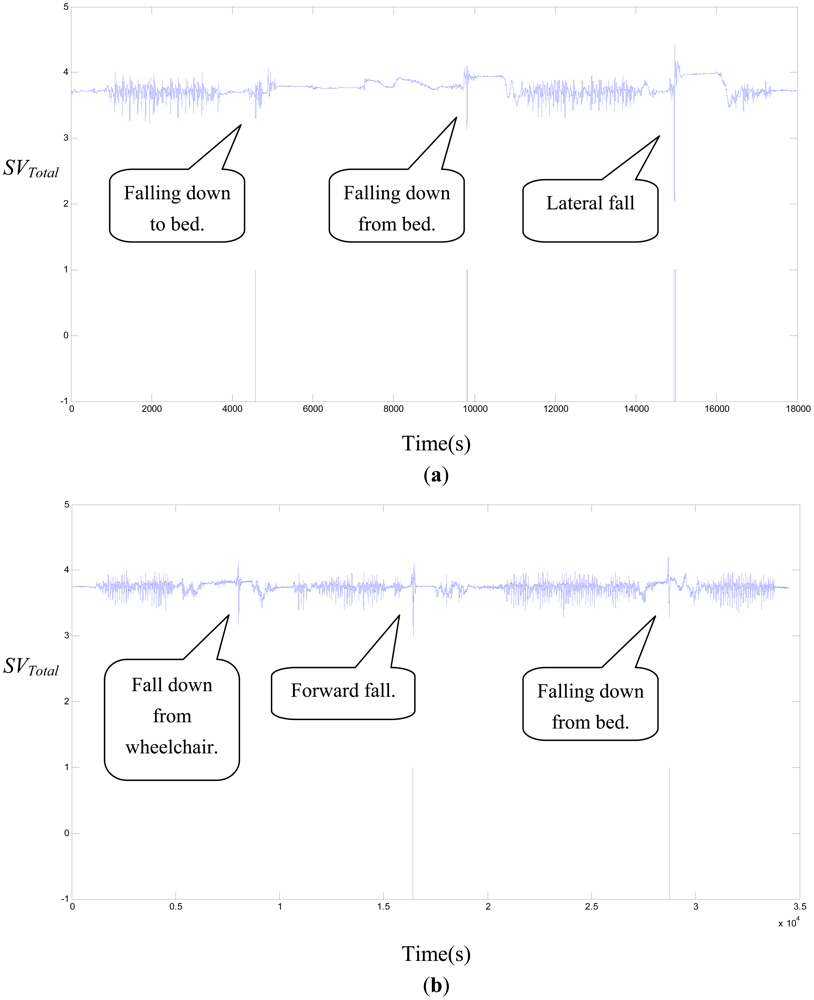
Because the action of slipping and ascending stairs is a more difficult action, we only conducted nine falling ADLs. The results show, in Table 8, that FP is zero, but there are three false negatives (FN). We analyzed the TP and TN of each falling ADL in Table 9. Falling down from a wheelchair, rolling down from a bed, and falling down to a bed all have one missing detection. Figure 4(a) shows the SVTotal signal for the continuous action of the CM_3 subject whose falling ADLs were falling down to a bed, falling down from a bed, and lateral falling down; these falling ADLs were all correctly detected. Figure 4(b) shows the SVTotal signal for the continuous action of the CM_1 subject whose falling ADLs were falling down from a wheelchair, forward falling down, and falling down from a bed; these falling ADLs had one missing detection.
5.4. The Comparison with the Threshold-Based Algorithm
Previous studies have frequently used a threshold-based algorithm with the impact and posture after the fall as the most popular method for fall detection [10,11,13–16]. The falling ADLs are described by calculating an action's parameters, such as the SVTotal, CVFast, VA, Φz, or velocity, and defining their upper and lower falling thresholds with respect to the impact and the posture. A boxplot (see Figure 5 or Figure 6) was used to set the thresholds of these parameters. Moreover, previous studies have focused on the actions of standing and falling down as the falling ADLs. We know that these falling actions are all encompassed in the body's center of gravity as it quickly falls down, and the falling distances are the highest compared to the non-falling ADLs. Thus, the upper or lower fall threshold could be used to separate the falling ADL and the non-falling ADL, for which the sensitivity and specificity all are 100%. However, the falling ADLs must also include sitting on a bedside and slipping onto the ground, sitting in a wheelchair and slipping onto the ground, rolling down from a bed, or falling down to a bed. The falling acceleration of the body's center of gravity in these falling ADLs is not larger than the actions of standing and falling down, and the falling distances are close to the moving distances of the non-falling ADLs. Under these conditions, the threshold-based method is not expected to have very good results.
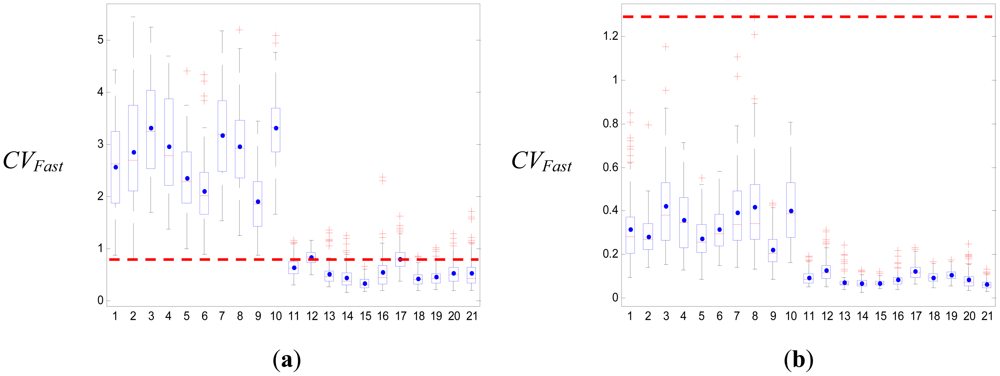
We used boxplots to define the upper and lower falling thresholds of four parameters that were used to separate the falling ADLs and the non-falling ADLs. The results of the simple threshold-based method in our study are shown in Table 10. The best threshold was the upper falling threshold of CVFast, of which the specificity was 81.9%. Figure 5 shows the boxplot of CVFast; the upper and lower falling thresholds were 0.8 and 1.26, respectively. If we considered the upper and lower falling thresholds of all the parameters, the specificity only reached 82.5%. They were much lower than our proposed SVM method. If we only considered forward falling down, backward falling down, literal falling down and falling down with leg weakness as falling ADLs, then the results of the SVM could attain an accuracy of 100% in the training and testing. The simple threshold-based method was used to detect these falling actions, with the results shown in Table 11. The best threshold was the upper falling threshold of CVFast, of which the specificity was 98.5% and the whole specificity was 98.6%. This result was very close to the results of previous studies. However, the result was also lower than the SVM method. Figure 6 shows the boxplot of CVFast; the upper and lower falling thresholds were 1.25 and 1.29, respectively.
6. Conclusions
We used the hyperplane of the SVM as the threshold for detecting the 21 ADLs, including 10 falling ADLs and 11 non-falling ADLs. The most successful parameter combination, SVTotal + CVFast + VA + Φz, achieved a training sensitivity and specificity of 99.60% and 98.73%, and a testing sensitivity and specificity of 97.40% and 99.27%, respectively If the threshold-based method was used to detect the falling ADLs, then the specificity was only 82.5%. Thus, the conclusion is that when the parameters of falling and non-falling ADLs are very close, the results of the SVM method are better than the threshold-based algorithm. In unscripted continuous experiments, the FP rates were 0.48 FP/h, 0.18 FP/h and 0 FP/h for the same young volunteers, for elderly volunteers and for different young volunteers, respectively. In continuous action, including three times falling ADLs, the sensitivity also became 90%. On the other hand, the falling definition that we detected in this paper is different from that of previous studies. Therefore, the FP rate we obtained is relatively high than the threshold-based algorithm in unscripted continuous experiments.
Acknowledgments
This work has been partly supported by the National Science Council of Taiwan (NSC 99-2632-E-324-001-MY3 and NSC 100-2221-E-324-013-MY2).
References
- Ozcan, A.; Donat, H.; Gelecek, N.; Ozdirenc, M.; Karadibak, D. The relationship between risk factors for falling and the quality of life in older adults. BMC Public. Health 2005, 5, 90. [Google Scholar]
- Yardley, L.; Smith, H. A prospective study of the relationship between feared consequences of falling and avoidance of activity in community-living older people. Gerontologist 2002, 42, 17–23. [Google Scholar]
- Salva, A.; Bolibar, I.; Pera, G.; Arias, C. Incidence and consequences of falls among elderly people living in the community. Med. Clin. 2004, 122, 172–176. [Google Scholar]
- Baker, S.P.; Harvey, A.H. Fall injuries in the elderly. Med. Clin. Geriatr. 1985, 1, 501–512. [Google Scholar]
- Tinetti, M.E.; Williams, C.S. Falls injuries due to falls, and the risk of admission to a nursing home. N. Engl. J. Med. 1997, 337, 1279–1284. [Google Scholar]
- Doughty, K.; Lewis, R.; McIntosh, A. The design of a practical and reliable fall detector for community and institutional telecare. J. Telemed. Telecare 2000, 6, 150–154. [Google Scholar]
- Huang, C.-N.; Chiang, C.-Y.; Chen, G.-C.; Hsu, S.; Chu, W.-C.; Chan, C.-T. Fall detection system for healthcare quality improvement in residential care facilities. J. Med. Biol. Eng. 2010, 30, 247–252. [Google Scholar]
- Gurley, R.J.; Lum, N.; Sande, M.; Lo, B.; Katz, M.H. Persons found in their homes helpless or dead. N. Engl. J. Med. 1996, 334, 1710–1706. [Google Scholar]
- Yang, C.C.; Hsu, Y.L. A review of accelerometry-based wearable motion detectors for physical activity monitoring. Sensors 2010, 10, 7772–7788. [Google Scholar]
- Kangas, M.; Konttila, A.; Lindgren, P.; Winblad, I.; Jamsa, T. Comparison of low-complexity fall detection algorithms for body attached accelerometers. Gait Posture 2008, 28, 285–291. [Google Scholar]
- Bourke, A.K.; O'Brien, J.V.; Lyons, G.M. Evaluation of a threshold-based tri-axial accelerometer fall detection algorithm. Gait Posture 2007, 26, 194–199. [Google Scholar]
- Liu, S.-H.; Chang, Y.-J. Using accelerometers for physical actions recognition by a neural fuzzy network. Telemed. J. e-Health 2009, 15, 867–876. [Google Scholar]
- Chao, P.-K.; Chan, H.-L.; Tang, F.-T.; Chen, Y.-C.; Wong, M.-K. A comparison of automatic fall detection by the cross-product and magnitude of tri-axial acceleration. Physiol. Meas. 2009, 30, 1027–1037. [Google Scholar]
- Bourke, A.K.; Van de Ven, P.; Gamble, M.; O'Connor, R.; Murphy, K.; Bogan, E.; McQuade, E.; Finucane, P.; O′Laighin, G.; Nelson, J. Evaluation of waist-mounted tri-axial accelerometer based fall-detection algorithms during scripted and continuous unscripted activities. J. Biomech. 2010, 43, 3051–3057. [Google Scholar]
- Kangas, M.; Vikman, I.; Wiklander, J.; Lindgren, P.; Nyberg, L.; Jamsa, T. Sensitivity and specificity of fall detection in people aged 40 years and over. Gait Posture 2009, 29, 571–574. [Google Scholar]
- Bourke, A.K.; Lyons, G.M. A threshold-based fall-detection algorithm using a bi-axial gyroscope sensor. Med. Eng. Phys. 2008, 30, 84–90. [Google Scholar]
- Lamb, S.; Jørstad-Stein, E.C.; Hauer, K.; Becker, C. Prevention of falls network Europe and outcomes consensus group. Development of a common outcome data set for fall injury prevention trials: The prevention of falls network Europe consensus. J. Am. Geriatr. Soc. 2005, 53, 1618–1622. [Google Scholar]
- Kecman, V. Learning and Soft Computing, Support Vector Machines, Neural Networks and Fuzzy Logic Models; The MIT Press: Cambridge, MA, USA, 2001. [Google Scholar]
- Wang, L.P., Ed.; Support Vector Machines: Theory and Application; Springer: Berlin, Germany, 2005.
- Sloin, A.; Burshtein, D. Support vector machine training for improved hidden markov modeling. IEEE Trans. Signal Process 2008, 56, 172–188. [Google Scholar]
- Wang, L.P.; Fu, X.J. Data Mining with Computational Intelligence; Springer: Berlin, Germany, 2005. [Google Scholar]
- Khandoker, A.H.; Palaniswami, M.; Karmakar, C.K. Support vector machines for automated recognition of obstructive sleep apnea syndrome from ECG recordings. IEEE Trans. Inf. Technol. Biomed. 2009, 13, 37–48. [Google Scholar]
- Brown, M.; Grundy, W.; Lin, D.; Cristianini, N.; Sugnet, C.; Furey, T. Knowledge based analysis of micro-array gene expression data using support vector machine. Proc. Natl. Acad. Sci. USA 2000, 97, 262–267. [Google Scholar]
- Dehmeshki, J.; Chen, J.; Casique, M.V.; Karakoy, M. Classification of Lung Data by Sampling and Support Vector Machine. Proceedings of the 26th IEEE EMBS Annual International Conference, San Francisco, CA, USA, 1– 5 September 2004; pp. 3194–3197.
- Chu, F.; Jin, G.; Wang, L. Cancer diagnosis and protein secondary structure prediction using support vector machine. Stud. Fuzz. Soft Comput. 2005, 177, 343–363. [Google Scholar]
- Guler, I.; Ubeyli, E.D. Multiclass support vector machines for EEG-signals classification. IEEE Trans. Inf. Technol. Biomed. 2007, 11, 117–126. [Google Scholar]
- Osowski, S.; Hoai, L.T.; Markiewicz, T. Support vector machines based expert system for reliable heartbeat recognition. IEEE Trans. Biomed. Eng. 2004, 51, 582–589. [Google Scholar]
- Acir, N. Classification of ECG beats by using a fast least square support vector machines with a dynamic programming feature selection algorithm. Neural Comput. Appl. 2005, 14, 299–309. [Google Scholar]
- Acir, N. A support vector machine classifier algorithm based on a perturbation method and its application to ECG beat recognition systems. Expert Syst. Appl. 2006, 31, 150–158. [Google Scholar]
- Mehta, S.S.; Lingayat, N.S. Identification of QRS complexes in 12-lead electrocardiogram. Expert Syst. Appl. 2009, 36, 820–828. [Google Scholar]
- Burges, C.J.C. A tutorial on support vector machines for pattern recognition. Data Min. Knowl. Discov. 1998, 2, 955–971. [Google Scholar]
- Chang, C.-C.; Lin, C.-J. LIBSVM: A Library for Support Vector Machines; Technical Report; National Taiwan University: Taipei, Taiwan, 2004. [Google Scholar]


| Set | No. | Gender | Age (year) | High (cm) | Weight (kg) | BMI |
|---|---|---|---|---|---|---|
| Set 1 | M_1 | Male | 22 | 182 | 73 | 22.5 |
| M_2 | Male | 23 | 178 | 73 | 21.7 | |
| M_3 | Male | 24 | 187 | 80 | 22.8 | |
| M_4 | Male | 24 | 178 | 73 | 23.0 | |
| M_5 | Male | 24 | 173 | 98 | 32.7 | |
| F_6 | Female | 25 | 160 | 50 | 19.5 | |
| F_7 | Female | 24 | 168 | 53 | 18.7 | |
| F_8 | Female | 25 | 167 | 55 | 19.7 | |
| F_9 | Female | 32 | 163 | 50 | 18.8 | |
| F_10 | Female | 17 | 155 | 47 | 19.5 | |
| Set 2 | EF_1 | Female | 70 | 155 | 46 | 19.1 |
| EF_2 | Female | 71 | 150 | 65 | 28.9 | |
| EF_3 | Female | 83 | 148 | 47 | 21.5 | |
| EF_4 | Female | 73 | 158 | 60 | 24.0 | |
| EM_5 | Male | 71 | 178 | 80 | 25.2 | |
| Set 3 | CM_1 | Male | 28 | 175 | 79 | 25.8 |
| CM_2 | Male | 28 | 173 | 60 | 20.0 | |
| CM_3 | Male | 28 | 175 | 68 | 22.2 | |
| CM_4 | Male | 24 | 170 | 95 | 32.9 | |
| CM_5 | Male | 24 | 176 | 88 | 28.4 | |
| CF_6 | Female | 19 | 158 | 50 | 20.0 | |
| CF_7 | Female | 18 | 160 | 48 | 18.8 | |
| CF_8 | Female | 19 | 162 | 52 | 19.8 | |
| CF_9 | Female | 19 | 165 | 55 | 20.2 | |
| CF_10 | Female | 22 | 155 | 71 | 29.6 | |
| Falling ADLs | Non-Falling ADLs | ||
|---|---|---|---|
| No. | Action | No. | Action |
| 1 | Slip and ascending stairs | 11 | Ascending stairs |
| 2 | Slip and descending stairs | 12 | Descending stairs |
| 3 | Forward fall | 13 | Sitting down on bed |
| 4 | Backward fall | 14 | Standing up from bed |
| 5 | Falling down from bed | 15 | Sitting down in wheelchair |
| 6 | Fall down from wheelchair | 16 | Standing up from wheelchair |
| 7 | Rolling down from bed | 17 | Walking |
| 8 | Lateral fall | 18 | Lying down |
| 9 | Falling down to bed | 19 | Lying up |
| 10 | Fall for the weak leg | 20 | Squatting down |
| 21 | Standing up | ||
| Parameters | Accuracy (%) | Sensitivity (%) | Specificity (%) |
|---|---|---|---|
| SVTotal, CVFast, VA, Φz | 99.14 | 99.60 | 98.73 |
| SVTotal, CVFast, VA, | 93.43 | 100.00 | 87.45 |
| SVTotal, CVFast, Φz | 88.76 | 100.00 | 78.55 |
| SVTotal, VA, Φz | 94.10 | 91.60 | 96.36 |
| CVFast, VA, Φz | 98.95 | 99.40 | 98.55 |
| SVTotal, CVFast | 96.38 | 98.80 | 94.18 |
| SVTotal, VA | 61.81 | 19.80 | 100.00 |
| SVTotal, Φz | 68.10 | 33.00 | 100.00 |
| CVFast, VA | 79.71 | 57.40 | 100.00 |
| CVFast, Φz | 83.81 | 100.00 | 69.09 |
| VA, Φz | 88.00 | 75.60 | 99.27 |
| Parameters | Accuracy (%) | Sensitivity (%) | Specificity (%) |
|---|---|---|---|
| SVTotal, CVFast, VA, Φz | 98.38 | 97.40 | 99.27 |
| SVTotal, CVFast, VA, | 90.19 | 99.80 | 81.45 |
| SVTotal, CVFast, Φz | 83.52 | 99.80 | 68.73 |
| SVTotal, VA, Φz | 90.19 | 93.20 | 87.45 |
| CVFast, VA, Φz | 98.10 | 98.00 | 98.18 |
| SVTotal, CVFast | 97.33 | 99.00 | 95.82 |
| SVTotal, VA | 60.67 | 17.60 | 99.82 |
| SVTotal, Φz | 69.81 | 36.60 | 100.00 |
| CVFast, VA | 83.24 | 65.00 | 99.82 |
| CVFast, Φz | 82.95 | 64.80 | 99.45 |
| VA, Φz | 93.24 | 89.20 | 96.91 |
| Falling ADL | Non-Falling ADL | ||||
|---|---|---|---|---|---|
| Action | # of False | False Rate | Action | # of False | False Rate |
| Slip and ascending stairs | 4 | 0.8% | Ascending stairs | 0 | 0.0% |
| Slip and descending stairs | 2 | 0.4% | Descending stairs | 2 | 0.4% |
| Forward fall | 0 | 0.0% | Sitting down on bed | 0 | 0.0% |
| Backward fall | 1 | 0.2% | Standing up from bed | 1 | 0.2% |
| Falling down from bed | 0 | 0.0% | Sitting down in wheelchair | 0 | 0.0% |
| Fall down from wheelchair | 2 | 0.4% | Standing up from wheelchair | 0 | 0.0% |
| Rolling down from bed | 2 | 0.4% | Walking | 0 | 0.0% |
| Lateral fall | 0 | 0.0% | Lying down | 0 | 0.0% |
| Falling down to bed | 2 | 0.4% | Lying up | 0 | 0.0% |
| Fall for the weak leg | 0 | 0.0% | Squatting down | 1 | 0.2% |
| Standing up | 0 | 0.0% | |||
| Volunteers | Time (min) | FP |
|---|---|---|
| F_6 | 79.1 | 0 |
| M_3 | 74.8 | 1 |
| M_5 | 84.2 | 0 |
| F_7 | 67.6 | 2 |
| M_2 | 79.4 | 0 |
| Total | 385.1 | 3 |
| FP Rate (FP/h) | 0.48 | |
| Volunteers | Time (min) | FP |
|---|---|---|
| EF_1 | 72.1 | 0 |
| EF_2 | 71.1 | 0 |
| EF_3 | 76.2 | 1 |
| EF_4 | 76.3 | 0 |
| EM_5 | 68.1 | 0 |
| Total | 363.8 | 1 |
| FP Rate (FP/h) | 0.18 | |
| Volunteers | TP | FN | FP |
|---|---|---|---|
| CM_1 | 2 | 1 | 0 |
| CM_2 | 3 | 0 | 0 |
| CM_3 | 3 | 0 | 0 |
| CM_4 | 2 | 1 | 0 |
| CM_5 | 3 | 0 | 0 |
| CF_6 | 3 | 0 | 0 |
| CF_7 | 2 | 1 | 0 |
| CF_8 | 3 | 0 | 0 |
| CF_9 | 3 | 0 | 0 |
| CF_10 | 3 | 0 | 0 |
| Total | 27 | 3 | 0 |
| Sensitivity | 90% | ||
| Falling ADL | Numbers | TP | FN |
|---|---|---|---|
| Slip and descending stairs | 2 | 2 | 0 |
| Forward fall | 4 | 4 | 0 |
| Backward fall | 3 | 3 | 0 |
| Lateral fall | 3 | 3 | 0 |
| Falling down from bed | 3 | 3 | 0 |
| Fall down from wheelchair | 3 | 2 | 1 |
| Rolling down from bed | 2 | 1 | 1 |
| Fall for the weak leg | 6 | 6 | 0 |
| Falling down onto bed | 4 | 3 | 1 |
| Total | 30 | 27 | 3 |
| Parameters | Specificity of Upper Threshold (TN) | Specificity of Lower Threshold (TN) |
|---|---|---|
| SVTotal | 0% | 5.2% |
| CVFast | 81.9% | 0% |
| Φz | 4.6% | 6.7% |
| VA | 0% | 0% |
| Total specificity | 82.5% | |
| Parameters | Specificity of Upper Threshold (TN) | Specificity of Lower Threshold (TN) |
|---|---|---|
| SVTotal | 0.00% | 5.2% |
| CVFast | 98.5% | 0.00% |
| Φz | 4.6% | 29.9% |
| VA | 0.00% | 0.00% |
| Total specificity | 98.6% | |
© 2012 by the authors; licensee MDPI, Basel, Switzerland. This article is an open access article distributed under the terms and conditions of the Creative Commons Attribution license (http://creativecommons.org/licenses/by/3.0/).
Share and Cite
Liu, S.-H.; Cheng, W.-C. Fall Detection with the Support Vector Machine during Scripted and Continuous Unscripted Activities. Sensors 2012, 12, 12301-12316. https://doi.org/10.3390/s120912301
Liu S-H, Cheng W-C. Fall Detection with the Support Vector Machine during Scripted and Continuous Unscripted Activities. Sensors. 2012; 12(9):12301-12316. https://doi.org/10.3390/s120912301
Chicago/Turabian StyleLiu, Shing-Hong, and Wen-Chang Cheng. 2012. "Fall Detection with the Support Vector Machine during Scripted and Continuous Unscripted Activities" Sensors 12, no. 9: 12301-12316. https://doi.org/10.3390/s120912301
APA StyleLiu, S.-H., & Cheng, W.-C. (2012). Fall Detection with the Support Vector Machine during Scripted and Continuous Unscripted Activities. Sensors, 12(9), 12301-12316. https://doi.org/10.3390/s120912301