Detecting Service Chains and Feature Interactions in Sensor-Driven Home Network Services

Abstract
: Sensor-driven services often cause chain reactions, since one service may generate an environmental impact that automatically triggers another service. We first propose a framework that can formalize and detect such service chains based on ECA (event, condition, action) rules. Although the service chain can be a major source of feature interactions, not all service chains lead to harmful interactions. Therefore, we then propose a method that identifies feature interactions within the service chains. Specifically, we characterize the degree of deviation of every service chain by evaluating the gap between expected and actual service states. An experimental evaluation demonstrates that the proposed method successfully detects 11 service chains and 6 feature interactions within 7 practical sensor-driven services.
1. Introduction
Research and development of home network systems (HNS) draws great attention as a key technology for the smart homes [1,2]. In the HNS, household appliances (e.g., TV, DVD Recorder, air-conditioner, lamp, fan) and equipments (e.g., curtain, ventilator, ceiling light) are integrated via a network to achieve various value-added services. Moreover, introducing sensors (e.g., temperature, brightness, motion, electricity, touch) to the HNS can provide autonomous sensor-driven services. A sensor-driven service is triggered automatically, depending on a designated context characterized by sensor values. Examples of the sensor-driven services are listed as follows [3]:
DVD Theater Service (DVD-T): This service allows a user to watch a movie in a theater-like atmosphere. When the user touches a touch sensor, a TV is turned on, a light is dimmed, a curtain is closed, and a DVD recorder is played.
Automatic Light Control Service (ALC): This service automatically turns on a light when the room becomes dark. When the brightness is lower than 200 lx and the user is in the room, a light is automatically turned on.
Automatic Room Heating Service (ARH): This service automatically heats the room with an air-conditioner. When the room temperature is colder than 14 °C, the air-conditioner is turned on with a heating mode of 28 °C.
Energy Saving Air-Conditioning Service (ESAC): This service controls an air-conditioner for energy saving. When the total electricity exceeds 1,500 Wm and the air-conditioner is working in a heating mode, the temperature of the air-conditioner is adjusted to 25 °C.
These sensor-driven services work fine when they are used separately. However, when multiple services are deployed in the same environment, execution of a service successively triggers another service in a certain condition. We define this phenomena as service chain, representing a chain reaction of sensor-driven services within the HNS. The service chain often causes undesirable conflicts among services, known as the feature interaction problem [3,4]. For the above four services, we can observe the following service chains.
Service Chain C1 (DVD-T⇒ALC): When a user runs DVD-T, a light is diminished and the room becomes dark. As a result, the condition “brightness is lower than 200 lx” holds. So, ALC is triggered and a light is turned on. This ruins the theater-like atmosphere of DVD-T.
Service Chain C2 (ARH⇒ESAC): Suppose that the room temperature drops below 14 °C, and that ARH starts the air-conditioner with the temperature setting 28 °C to heat the room. In course of time, the electricity consumption rises greater than 1,500 Wm. As a result, ESAC is triggered and the temperature setting is adjusted to 25 °C. Thus, the temperature setting of ARH is overwritten by ESAC.
Service Chain C3 (ALC⇒ESAC): Suppose that room brightness drops below 200 lx, and that ALC turns on a light. If the total electricity becomes greater than 1,500 Wm at this time, ESAC is automatically triggered.
In the above scenarios, the service chains C1 and C2 cause undesirable or unexpected behaviors for the users, whereas the service chain C3 causes nothing wrong. Thus, not all service chains are harmful, but they are potential factors of feature interactions. So, when deploying many sensor-driven services in the HNS, all service chains should be identified in advance. Furthermore, it is also important to extract harmful service chains automatically.
The goal of this paper is to propose a framework that can characterize and detect all potential service chains and feature interactions for given sensor-driven services within the HNS. Specifically, we first introduce the ECA (event, condition, action) rules to describe the sensor-driven services. We then develop the environment effect model to capture explicitly how each appliance affects the environment. Finally, we develop the service chain detection algorithm and feature interaction detection algorithm. The service chain detection algorithm can derive concrete conditions describing when the service chain occurs. In the feature interaction detection algorithm, we propose a severity evaluation method of each service chain by comparison between an expected state by a sensor-driven service and an actual state by a service chain including the sensor-driven service.
We conducted a case study with 7 practical services operated in our HNS. As a result, we could detect 11 service chains, in which 6 harmful feature interactions are identified.
2. Preliminaries
2.1. Home Network System
A home network system (HNS) consists of multiple networked appliances connected to the local area network at home. Each networked appliance has control APIs, with which users or software agents can control the appliance via the network. Each appliance is generally equipped with a network adapter, a processor and a storage.
A HNS typically involves a home server, which manages all the appliances deployed. It also plays a role of gateway to the external network. More importantly, various value-added services are installed in the home server. When a service is requested, the home server executes APIs of the appliances according to the logic specified in the service. As seen in Section 1, a service can orchestrate different appliances at the same time. In our research group, we are building an actual HNS (CS27-HNS) using legacy home appliances [5].
2.2. Sensor-Driven Service in HNS
Introducing sensors to the HNS can make the services autonomous and context-aware. Since the sensors can capture events and contexts, we use them as triggers of the service. In this paper, we write sensor-driven service to represent any HNS service triggered by a sensor. For example, let us take Automatic Light Control Service (ALC) in Section 1. The condition “the brightness is lower than 200 lx” can be evaluated by a light sensor. Thus, ALC can be implemented as a program which invokes API Light.on() when the reading of the light sensor becomes less than 200.
The sensor-driven services are smart and convenient in the sense that they do not require human operations. However, if many services are deployed in the same environment, they often cause unexpected service chains, as seen in Section 1. Since the number of potential service chains grows combinatorially in the number of services, we need a systematic method to detect and resolve the service chains.
2.3. Previous Work: Feature Interactions in HNS
In our previous work [3,4], we proposed an object-oriented modeling method to formalize and detect feature interactions in the HNS. In this method, we modeled every appliance (or an environment) as an object with properties and methods. The properties characterize the internal state of the appliance (or the environment), while the methods correspond to the API. Also, we defined every service as a sequence m1(); m2(); …; mn() of the appliance methods. Then, we defined that a feature interaction between services s1 and s2 occurs if a method m() of s1 and another method m′() of s2 conflict, either locally on an appliance object (called, appliance interaction) or indirectly via an environment object (called, environment interaction). However, this method assumed that every service is triggered manually by the user. Thus, the sensor-driven services and the incidental service chains were beyond the scope.
3. Modeling Sensor-Driven Services and Service Chains
3.1. Describing Sensor-Driven Services with ECA Rules
In order to capture the nature of the sensor-driven services, we here introduce the ECA (event, condition, action) rules [6] for the service description. A sensor-driven service S is defined by S = (ES, CS, AS) where
ES is an event that triggers S, which is defined by a condition over a single environment property.
CS is an enabling condition to determine the execution of S. On detecting ES, S is actually executed only when CS is satisfied. CS is defined by a condition over appliance properties and environment properties.
AS is an action to be executed, which is defined by a sequence m1(); m2(); …; mn() of appliance methods.
This model newly involves the event and condition, compared to the one in the previous work.
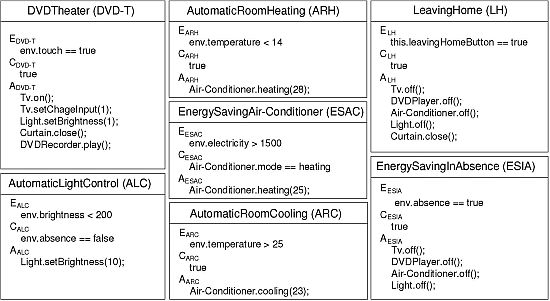
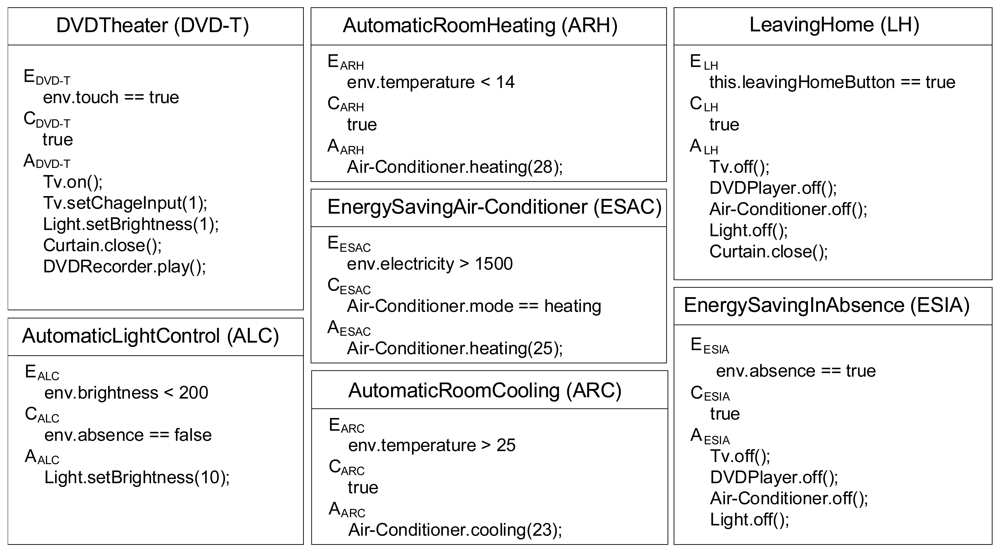
Figure 1 shows service descriptions of seven sensor-driven services, including the 4 services seen in Section 1 and 3 more described below.
Automatic Room Cooling (ARC): This service automatically cools down the room, using an air-conditioner. When the room temperature is warmer than 25 °C, the air-conditioner is turned on with a cooling mode of 23 °C.
Leaving Home (LH): This service shuts down all appliances when a user leaves home. When the user touches a button in the entrance, a TV, a DVD player, an air-conditioner and a light are turned off, and a curtain is closed.
Energy Saving in Absence (ESIA): This service automatically turns off appliances for energy saving in user's absence. When a sensor detects that nobody is in the room, the service turns off a TV, a DVD player, an air-conditioner and a light.
In Figure 1, env denotes a prefix of an environment property. Each event (or condition) is supposed to be detected (or evaluated, respectively) by appropriate sensors in the HNS. In each action, A.m() denotes a method m() of an appliance A. Let us take the description of ALC. The event of ALC is env.brightness < 200, specifying that the service is triggered when the brightness is less that 200 lx. The condition env.absence == false means that the service should be enabled only when somebody is in the room. If ALC is executed, the light is turned on with brightness level 10 as specified in the action Light.setBrightness(10).
3.2. Modeling Environmental Effects of Appliances
To detect the service chains, we have to know how much effect is given to the environment as a result of a service. Such effect is produced by appliance methods executed as an action of the service. For example, Light.on() increases env.brightness, and Air-Conditioner.cooling() decreases env.temperature. Therefore, we propose an environment effect model for each appliance, to define explicitly how the appliance gives the environmental effects.
As shown in Section 2.3, every appliance can be regarded as an object with internal states. Therefore, we model every appliance as an FSM (finite state machine) specifying the effects within transitions. Let d be an appliance. The environment effect model of d is defined by an FSM EMd = (Sd, Md, Td, s0, ed), where
Sd is a set of states of d.
Md is a set of appliance methods of d.
Td : Sd × Md → Sd is a state transition function.
s0 ∈ Sd is the initial state.
ed is an environment effect function, associating each transition t ∈ Td with a set of expressions over environment properties.
Tables 1 shows the environment effect models of an air-conditioner, a TV and a light, respectively. Each table describes an FSM in a table form, where a row represent a state, a column represents a method. Each entry represents a state transition, containing the effects to the environment and the next state (labeled by next). In the effects, =, += and −= respectively represent substitution, addition and subtraction operators. For example, Table 1(b) represents that the TV has two states OFF and ON. If method on() is executed within OFF, the state moves to ON. At this time, as the environment effects, the electricity is increased by 500 Wm, and the brightness is increased by 200 lx.
Assumption 1
Effects of every appliance to environmental values by each appliance are reflected instantly.
For some environment properties, the effect may be given gradually For example, it takes time for an air-conditioner to change the room temperature in the designated value. However, in this paper we define the environment effect by an expected value converged after sufficient time.
We assume that every appliance d in the HNS is first in the initial state of EMd. When a service S = (ES, CS, AS) is executed, each method d.m() in AS is executed one by one. Then, a corresponding transition t in EMd occurs and environment effects e(t) are accumulated to the environment.
3.3. Service Chain
A service chain occurs when the result of one service triggers another service, successively. We try to formalize this mechanism using the proposed service description and the environment effect model. Let SA = (ESA, CSA, ASA) and SB = (ESB, CSB, ASB) be two services. A service chain from SA to SB, denoted by SA ⇒ SB, occurs when the environment effects produced in ASA create an environment (state) where ESB is satisfied. A chain SA ⇒ SB may cause another chain SB ⇒ SC, creating SA ⇒ SB ⇒ SC. Also, if SB triggers SA again, then a loop SA ⇒ SB ⇒ SA ⇒ SB ⇒ … may be produced.
Note that the occurrence of SA ⇒ SB is conditional. That is, it depends on the current states of the appliances and the environment. For example, for ALC⇒ESAC in Section 1, if no other appliance is working before the execution of ALC, ESAC may not start. Therefore, it is important to identify the pre-condition of the service chain, explaining when the chain occurs. We denote [cond]SA ⇒ SB to represent that a chain SA ⇒ SB occurs when a pre-condition cond holds.
3.4. Feature Interactions in Service Chain
Service Chain may cause feature interactions. However, all service chains do not lead to harmful feature interactions. In the chain scenarios described in section D, scenario C1 is considered as harmful one. In the scenario C1, service chain DVD-T-ALC prevents a user from watching a movie in a theater-like atmosphere contained in the requirement of DVD-T. On the other hand, in the chain scenario C2, ESAC makes preset temperature of the air-conditioner lower than a user's requirement in ARH. Although this scenario is also considered as a feature interaction, a user may accept the change of room temperature for 1 degree. Moreover, energy saving, which is one of the requirements in ESAC, is satisfied in the scenario.
The service chain causes various feature interactions which can be serious or acceptable. Then, we propose a method to evaluate the severity of feature interactions.
4. Detecting Service Chains among Sensor-Driven Services
4.1. Service Chains Detection Algorithm
Now we present an algorithm that can automatically detect the service chains among sensor driven services, using the proposed service description and the environment effect model. Specifically, for a given pair of services SA = (ESA, CSA, ASA) and SB = (ESB, CSB, ASB), the algorithm checks if SA ⇒ SB occurs. Moreover, if the chain occurs, the algorithm derives a concrete pre-condition cond such that [cond]SA ⇒ SB holds. Intuitively, the algorithm checks if the environment effects produced by ASA may create a situation where ESB is satisfied, as discussed in Section 3.3. It consists of the following nine steps.
Step 1: Pick out an environment property p in ESB.
Step 2: By analyzing ASA, obtain a set Mp = {m1(), m2(), …, mn()} ⊆ ASA of appliance methods where every mi() has an environment effect on p.
Step 3: For every mi() ∈ Mp, analyze the environment effect models and obtain a set Tmi of any state transitions on which mi() appears.
Step 4: Construct a Cartesian product Tp = Tm1 × Tm2 × … × Tmn. Each element tt = (t1, t2, …, tn) ∈ Tp represents a sequence of transitions each of which has an environment effect on p.
Step 5: For each tt = (t1, t2, …, tn) ∈ Tp, calculate the total environment effect TE(tt) = Σ [ep(t1), ep(t2), …, ep(tn)], where ep(ti) is an environment effect added to the environment property p by the transition ti. The semantics of Σ will be defined later.
Step 6: Let se be any environment state where SB is enabled (i.e., ESB holds), and let sd be any state where SB is disabled (i.e., ¬ESB holds). For each tt ∈ Tp, if there exists such a pair (sd, se) that TE(tt) changes the state sd into se, then detect a service chain SA ⇒ SB. For this, we call tt potential transition sequence of the service chain.
Step 7: If tt = (t1, t2, …, tn) ∈ Tp is a potential transition sequence of the service chain, for each ti (1 ≤ i ≤ n), derive a condition dcondi of an appliance where ti is executed. Then, make a conjunction dcondp = dcond1 ∧ dcond2 ∧ … ∧ dcondn, which is a pre-condition of the service chain w.r.t. the appliances. In addition, obtain a condition econdp on the environment where sd of Step 6 is satisfied, which is a pre-condition of the service chain w.r.t. the environment.
Step 8: Validate that condp = dcondp ∧ econdp does not contradict to ESA ∧ CSA. If there is no contradiction, derive condp as the pre-condition of SA ⇒ SB. If there is a contradiction, SA is disabled. So conclude that SA ⇒ SB does not occur. (End)
Let vi be the value of the environment effect ep(ti). The semantics of Σ in Step 5 is defined by one of the following S1, S2 or S3, depending on the environment property p interested.
S1(Arithmetic Sum): Σ [ep(t1), ep(t2), …, ep(tn)] = v1 + v2 + … + vn. This semantics is taken when p is a cumulative property, including brightness, sound volume, etc.
S2(Maximum Value): Σ [ep(t1), ep(t2), …, ep(tn)] = max(v1, v2, …, vn). This semantics is taken when the value of p is overwritten by the maximum one, including the temperature of heater, wind level, etc.
S3(Minimum Value): Σ [ep(t1), ep(t2), …, ep(tn)] = min(v1, v2, …, vn). This semantics is taken when the value of p is converged to the minimum one, including the temperature of air-conditioner.
We briefly summarize the purpose of each step of the algorithm. Step 1 finds the key property p by which the service chain SA ⇒ SB may occur. Step 2 extracts appliance methods that potentially give an effect to p. Step 3 identifies all state transitions related to the methods within the environment effect models. Step 4 derives all possible combinations of the transitions affecting p. Step 5 calculates the total impact to p produced by each of the combinations. Step 6 examines if the total impact can trigger ESB or not. Step 7 derives the pre-condition of the service chain. Finally, Step 8 validates if the pre-condition does not contradicts to the enabling condition of SA.
In our service chain detection method, the conditions under which the potential conflicts may arise are derived from static structures of service models. Since our method does not need to utilize an exhaustive search such as model checking, the state explosion problem does not occur if service complexity increases.
4.2. Running Example
Using the proposed algorithm, we demonstrate to detect the service chain C1 (DVD-T⇒ALC) in Section 1. In this example, we use the service description in Figure 1, and the environment effect model of the appliances in Table 1.
4.2.1. Detection of Service Chain (DVD-T ⇒ ALC)
In Step 1, we pick up env.brightness from EALC and know that the brightness is the key property of the service chain. In Step 2, we obtain methods TV.on(), Light.setbrightness(1) from ADVD–T, since they have effects on env.brightness. In Step 3, we identify the corresponding transitions in the environment effect models. In Table 1(b), we find TTV.on() = { (OFF,on(),ON),(ON,on(),ON)}. In Table 1(c), we find TLight.setbrightness(1) = { (OFF, setBrightness(1), ON), (ON, setBrightness(1), ON)}. Step 4 constructs a product TTV.on() × TLigh.setbrightness(1) to derive the following four transition sequences.
tt1 = ((OFF,on(),ON),(OFF,setBrightness(1),ON))
tt2 = ((OFF,on(),ON),(ON,setBrightness(1),ON))
tt3 = ((ON,on(),ON),(OFF,setBrightness(1),ON))
tt4 = ((ON,on(),ON),(ON,setBrightness(1),ON))
Step 5 calculates the total the environment effect to env.brightness. Since the brightness is cumulative, we follow the Semantics S1.
TE(tt1) = +200 + 100 = +300
TE(tt2) = +200 +100 (1−bLevel)=300 − 100 * bLevel
TE(tt3) = + 0 + 100 = +100
TE(tt4) = + 0 + 100(1 − bLevel)=100 − 100 * bLevel
In Step 6, let sd be any state where ALC is not triggered, i.e., ¬EALC = env.brightness ≥ 200 holds. Also, let se be any state where ALC is triggered, i.e., EALC = env.brightness < 200 holds. Among tt1 to tt4, we want to find any transition sequences that can change sd to se. Since both tt1 and tt3 give positive impact to the brightness, they cannot move sd to se. So, tt2 and tt4 are chosen as the potential transition sequences of the service chain.
In Step 7, we first derive the pre-condition of the service chain from tt2. In order for the sequence tt2 to be executed, the TV must be OFF and the light is ON beforehand. So, dcondbright = [TV is OFF ∧ Light is ON]. From ¬EALC, we obtain a condition env.brightness ≥ 200 to be satisfied before DVD-T. Also, as for the condition after DVD-T, we have env.brightness +TE(tt2) < 200 so that ALC is triggered. Therefore, econdbright = [200 ≤ env.brightness < 100 * bLevel−100]. Similarly, we derive the pre-condition from tt4. As a result, we can see that the service chain DVD-T⇒ALC occurs when DVD-T is executed under the one of the following pre-conditions.
cond1: TV is OFF, Light is ON and a condition [200 ≤ env.brightness < 100 * bLevel−100] holds, or
cond2: TV is ON, Light is ON and a condition [200 ≤ env.brightness < 100 * bLevel+100] holds.
These pre-conditions are validated in Step 8 that they do not disable DVD-T. So, we finally detect [ cond1] DVD-T⇒ALC and [ cond2] DVD-T⇒ALC.
5. Estimation of the Severity of a Service Chain Using Prior Expectation of Sensor-Driven Service
5.1. Severity of a Service Chain
As described in Section 3.4, every service chain does not lead to harmful feature interactions. Then, we define the degree of severity of a service chain, in order to evaluate whether the service chain is harmful. Intuitively, we consider that the service chain is serious, when the state after a service execution differs from the state after a service chain significantly We define a set es = (v1, v2, …, vn) of arbitrary value of environment properties p1, p2, …, pn as an environmental state. When an environmental state es[SA] at the time of SA being executed independently and other environmental state of es[SA ⇒ SB] at the time of a service chain es[SA ⇒ SB] being executed are compared, we estimate that the gap between both environmental states is large.
5.2. Prior Expectation in a Sensor-Driven Service
It is also dependent on the requirement(prior expectation) which a user expects to be satisfied by a service whether the service chain is serious or not. The prior expectation is expressed as a state of appliances and environment properties contained in the main purpose of a service. Table 2 shows examples of prior expectation in each service. In the table, the prior expectation in ARH is related to “indoor temperature”. Similarly, the prior expectation in ESAC is related to “electricity”. Therefore, when evaluating the degree of severity of a service chain, it is necessary to narrow down a state es in the view point of the prior expectation.
We define a projection es = (v1, v2, …, vn) to I = {pi1, …, pik}(a set of environmental properties) as projI(es) = (vi1, …, vik). Let IA be a set of environment properties related to the prior expectation in SA. Moreover, let es[SA] be a state at the time of SA being executed independently, and es[SA ⇒ SB] be a state at the time of SA ⇒ SB being executed. Here, projIA(es[SA]) can be considered as a prior expectation expected by a user to SA. Similarly, projIA(es[SA ⇒ SB]) is regarded as an actual state at the time of SA ⇒ SB being executed.
5.3. Estimation of Service Chain Severity
We estimate whether a service chain causes serious feature interaction or not, depending on whether the difference between projIA(es[SA]) which is expected by a user to SA and projIA(es[SA]) is below a threshold value τ. Here, τ is a given value experientially by a user or the service creator.
Assumption 2
A sensor-driven service SA = (ESA, CSA, ASA) and SB = (ESB, CSB, ASB) cause a service chain [cond]SA ⇒ SB. A set of properties which a user expects to the SA is IA = {pi1, …, pik}.
Each pij is given a threshold value τ(pij).
Step 1: Create a set of state es = (v1, v2, …, vn) which is formed by the cond.
Step 2: In the es, the method of ASA is virtually invoked according to each appliance model. Let ttA = (t1, t2, …, ts) be a set of transition sequence of the appliance model performed. We calculate by compounding the total environment effect TE(ttA)(described in Section 4.1) to es.
Step 3: In the es, ASA and ASB are invoked in order. Let ttA,B = (t1, t2, …, tl) be a set of transition sequence performed in the service chain. We calculate by compounding the total environment effect TE(ttA,B) to each element in es.
Step 4: Calculate the gap between a state caused by prior expectation and an actual state by the service chain as follows.
Step 5: Determine SA ⇒ SB as a serious service chain if is true.
Here, if a service has multiple environment properties as the target of prior expectation, our algorithm calculates each severity separately. For instance, if a service has brightness property and temperature property as the target of prior expectation, severities of the service in the view point of brightness and temperature are calculated respectively, and the service is judged whether the service chain is a feature interaction or not.
Second, if a service does not include any prior expectation, it is difficult to capture the user's desire about the service. We assume the prior expectation depends on user's requirement or desire. Therefore, in our future approach, though the service chain is detected, the severity of the service is not calculated.
Our method to estimate the severity of service chains generates a set of state which satisfies the conditions. Though the set of state which satisfies the conditions may exist infinitely, environment properties not included in prior expectations are treated symbolically in our method. For example, a state about a service which includes brightness property as the prior expectation is expressed like (Temperature, Brightness, Electricity) = (x, 800, y) in internal implementation. An environment property included in a prior expectation may take various values. Two or more typical values should be checked for estimating severity. The typical values should reflect user's desire or some kinds of situation in which the service is invoked. Concrete methods to configure the property values for severity estimation are left for our future research.
5.4. Running Example
We evaluated the degree of severity about the service chain in Section 1. Here, we focused on three properties, such as temperature, brightness and electricity in HNS. Moreover, the threshold of deviation tau is 2 (°C), 500 (lx), and 500 (W), respectively.
5.4.1. Severity Evaluation of DVD-T⇒ALC
In Step 1, we create an environmental state es = (temperature, brightness, electricity)= (24, 800, 50) which may trigger the service chain. Here, current brightness setting of the light in the services is level 8. In Step 2, when only DVD-T is invoked, es[DVD − T] changes to (24, 100, 850). In Step 3, when DVD-T and ALC are invoked in order, es[DVD − T ⇒ ALC] changes to (24, 1000, 850). In Step 4, if IDVD−T is {brightness}, the gap is calculated as follows. projIDVD−T(es[DVD − T]) — projIDVD−T(es[DVD − T] ⇒ ALC) = (100) − (1000)= (−900) That is, user's prior expectation of brightness in DVD-T has significant deviation: −900 from the actual environment state by the service chain. In Step 5, |−900| > τ(brightness) = 500. As a result, this service chain can be considered serious.
6. Implementation of Service Chain/feature Interaction Detection System
6.1. Architecture
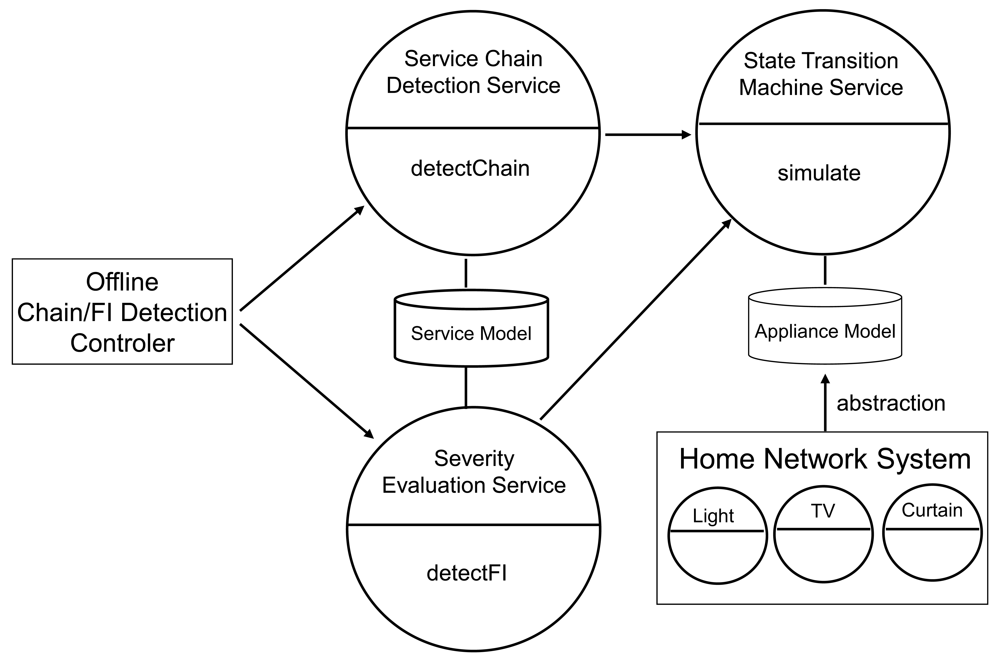
Figure 2 shows the architecture of our service chain/feature interaction detection system. Our system consists of a state transition machine service, a service chain detection service, a severity evaluation service and an offline service chain/feature interaction detection controller. The chain detection controller detects service chains and feature interactions by invoking the service chain detection service and the severity evaluation service. Henceforth, the details of each component are explained.
6.1.1. State Transition Machine Service
The state transition machine service calculates the environment effect e(t) for each appliance based on the appliance model.
This service exhibits the following methods.
imulate(String[] methods):SimulationResult[] This method receives an array of appliance method (String type) as an argument, and returns an array of the SimulationResult class. This method returns SimulationResult class which contains combination of the environment effect and the appliance state transition based on the given appliance method sequence. The SimulationResult has the following attributes.
SimulationResult
- -
effects(Effect[]) : An array of the environment effect for each environment property
- -
transitions(Transition[]) : An array of appliance transition sequence caused by appliance method execution
Effect
- -
propertyName(String) : A name of an environment property
- -
value(double) : Degree of environment effect
- -
operator(String) : Operator is any one of ”=”,”+=”,”-=”.
Transition
- -
deviceName(String) : Device name
- -
preState(String) : A state before transition
- -
postState(String) : A state after transition
This method controls Steps 2–5 in Section 4.1 and Steps 2 and 3 in Section 5.3.
6.1.2. Service Chain Detection Service
The service chain detection service stores the service models and detects a service chain between given sensor-driven services. This service exhibits the following method.
detectChain(String service1, String service2):boolean This method receives names of two sensor-driven services (a source service and a destination service), which may cause a chain reaction, as arguments, and returns a boolean value which indicates whether there exists a service chain. This method controls our service chain detection algorithm in 4.1. First, this method gets an action of the source service and an event of the destination service from the service models. Next, this method calculates a total environment effect of the source service with using the simulate() method in the state transition machine service.
6.1.3. Severity Evaluation Service
The severity evaluation service stores service models, and evaluates degree of a severity of a given service chain. This service exhibits the following method.
detectFI(String service1, String service2):boolean This method receives names of two sensor-driven services (a source service and a destination service), which may cause a chain reaction, as arguments, and returns a boolean value which indicates whether there exists a feature interaction. This method controls our severity evaluation algorithm in Section 5.3. First, this method gets method information in the service model. Next, this method calculates an environment state after execution of the source service, and another environment state after the occurrence of the service chain, respectively. Then, this method calculates the degree of deviation of the environment state for every property which is related to the prior expectation in the source service which may cause the chain reaction.
6.2. Implementation and Evaluation
The total lines of code of our program are about 4,300, and the programming language used for development is Java. We use the actual HNS(CS27-HNS) developed by our research group for sensor-driven services. All the services included in the service chain/feature interaction detection system were deployed under the following environments.
Server Specification: 950 MB RAM 2.00 GHz WinXP Pro
Tomcat 5.5
Apache Axis 2.2
Java JDK5
We performed the service chain/feature interaction detection for the 7 services in Figure 1. Our system required about 16 seconds for detecting the service chains and the feature interactions.
7. Case Study
To evaluate the proposed method, we have conducted a case study to detect all service chains and feature interactions among the seven sensor-driven services shown in Figure 1.
Table 3 shows the result. In the table, a row represents a service triggered first (called first service, say SA), and a column represents one triggered second (called second service, say SB). Each entry shows whether a service chain SA ⇒ SB occurs or not. Out of all 42(= 7×6) possible combinations, 11 service chains and 6 feature interactions were automatically detected by our system (marked as Chain and FI in Table 3). Scenarios of DVD-T⇒ALC and ARH⇒ESAC are the same as C1 and C2 in Section 1, respectively. Scenarios of other FIs are explained below.
7.1. Service Chain Scenario (ESIA⇒ARH)
In a day of winter, as nobody remains the room, ESIA turns off all the appliances. This situation makes the temperature decrease, and ARH is triggered in due course. The service chain violates the goal of energy-saving of ESIA.
7.2. Service Chain Scenario (LH⇒ARH)
This service chain is similar to ESIA⇒ARH. As a user presses the button of LH, all the appliances are shut down. This makes the temperature decrease and has ARH triggered. This service chain is against the user's requirement that all the appliances should be off while leaving home.
7.3. Service Chain Scenario (ARH⇒ARC)
As the temperature decreases, ARH is triggered to heat the room using the air-conditioner. This makes room warm enough to trigger ARC to cool the room, which violates the goal of ARH. The algorithm derives a pre-condition that the air-conditioner is OFF or working with the temperature setting 25 °C or less.
7.4. Service Chain Scenario (LH⇒ALC)
If a user presses the button of LH in the night, all the appliances are shut down, and the room becomes dark. Then, ALC is triggered and the light is turned on again. The chain violates the user's requirement that all the appliances should be off while leaving home. The algorithm derives a pre-condition that [200 ≤ env.brightness < 200 + 100* Light.bLevel, the light is ON, and TV is OFF].
8. Discussion
8.1. Advantage and Limitations
For given sensor-driven services, the proposed method can detect all potential service chains and feature interactions automatically. It also derives concrete pre-conditions for every service chain detected. Therefore, the proposed method can make service developers aware of unexpected service chains in advance. Furthermore, we could calculate the degree of severity of each service chain and judge the undesirable feature interactions resulting from the service chain.
In this sense, the proposed method is useful especially for the offline validation at the design stage of the services.
On the other hand, the detected harmful service chain needs to be resolved. However, this paper does not show the concrete resolution method for such service chains. It is necessary to define the suitable resolution method according to the degree of severity of the service chain. A service developer and a user are to determine the magnitude of the deviation experientially. More systematic determination method for the deviation is our future subject.
It is significant problem to determine adequate value of the τ. The value of τ is a criterion which indicates the degree of the severity of detected feature interactions. Accordingly, wrong value of τ does not capture the user's desire. On the other hand, since the value of τ depends on user's requirement, desire, or environment where sensor-driven services are deployed, it is significantly difficult to decide the value statically in advance. Currently, a method to configure the value of τ and resolve feature interactions are both left for our future research. In our next research, we consider about a method to use the value small enough as an initial value of τ. In the approach, feature interactions are detected based on the initial value of τ, and a user decides and conveys whether each feature interaction is acceptable or not. The recursive feedback process between the user and our system make the value of τ configured gradually.
8.2. Related Work
Kolberg et al. [7] presented a classification of feature interactions in smart home, where our service chains can be categorized as the sequential action interaction (SAI). However, the concrete detection method of the service chains was not described. Wilson et al. [8] took the environment effects of the appliances for detecting feature interactions. However, since the amount of the effects was not explicitly considered, it would be difficult to derive detailed pre-conditions of the service chains. The ECA rules have been often used for detecting policy conflicts [6,9,10]. These methods basically focused on action conflicts only, and the service chains were not explicitly considered. In [11], we proposed a service-oriented framework that facilitates development of individual sensor-driven services. However, this method did not cover interactions among multiple services.
In distributed system, many techniques for detecting policy conflict based on policies such as Authorization Policy and Obligation policy have been proposed. Lupu et al. [12] have classified policy conflicts occurring in distributed systems and proposed conflict resolution method according to the classification. Dunlop et al. [13] have proposed dynamic and scalable policy conflict detection method. In the method, conflict DB stores the combination of the policies which may cause conflicts.
In the viewpoint of conflict detection, these researches differ from our proposed method detecting conflicts based on the service chain using the HNS component model. On the other hand, it is significant to apply the dynamic and scalable conflict detection method to our detection technique.
Charalambides et al. [14] have proposed conflict analysis using Event Calculus in the domain of QoS management. In the analysis method, they used abductive reasoning to detect the potential conflicts. Furthermore, they have identified a number of potential conflicts, and have classified them. In the classification, the redundancy conflict and the mutual exclusion conflict can be considered as some kinds of feature interactions in HNS [4] However, in this paper, we proposed FI detection method based on the service chain which differs from conventional FIs such as redundancy and mutual exclusion.
Shankar et al. [15] have proposed a method to detect conflicts and cycles in policies based on their rule framework “Event-Condition-Precondition-Action-Postcondition” in pervasive systems. Their conflict detection method using the rule framework ECPAP resembles our proposed method. However, since they assume that the framework is used in general-purpose pervasive systems, the subjects peculiar to the sensor-driven services in HNS have not necessarily been solved. We have proposed our framework which takes multiple different kinds of environment properties into account. Furthermore, our framework provides the concrete conditions under which each potential conflict may arise and estimation of severity of the conflicts quantitatively.
9. Conclusions
In this paper, we have proposed a method that detects service chains among sensor-driven services in the home network system (HNS), and evaluates the severity of the detected service chains. The proposed method adopts the ECA rules for the service description, and introduces the environment effect model to define the effect of the appliances to the environment, explicitly. We also implemented the proposed method as a tool and detected 11 service chains and 6 feature interactions among 7 practical services. Based on our method, we proposed systematic resolution schemes of undesirable service chains. Extending the method for general sensor services outside the HNS is also a challenging issue.
References
- Panasonic Electric Works Co., Ltd. eco ideas HOUSE. Available online: http://panasonic.co.jp/ecohouse/en/Homenetwork/index.html (accessed on 20 June 2012).
- Toshiba Lighting & Technology Corporation. Toshiba Network Appliance Feminity. Available online: http://feminity.toshiba.co.jp/feminity/feminity_eng/about/index.html (accessed on 20 June 2012).
- Igaki, H.; Nakamura, M. Modeling and detecting feature interactions among integrated services of home network systems. IEICE Trans. Inf. Syst. 2010, E93-D, 822–833. [Google Scholar]
- Nakamura, M.; Igaki, H.; Yoshimura, Y.; Ikegami, K. Considering Online Feature Interaction Detection and Resolution for Integrated Services in Home Network System. Proceedings of the 10th International Conference on Feature Interactions in Telecommunications and Software Systems (ICFI2009), Lisbon, Portugal, 11–12 June 2009; pp. 191–206.
- Nakamura, M.; Tanaka, A.; Igaki, H.; Matsumoto, K. Constructing home network systems and integrated services using legacy home appliances and web services. Int. J. Web Serv. Res. 2008, 5, 82–98. [Google Scholar]
- Wang, F.; Turner, K.J. Policy Conflicts in Home Care System. Proceedings of the 9th International Conference on Feature Interactions in Telecommunications and Software Systems (ICFI2007), Grenoble, France, 3–5 September 2007; pp. 54–65.
- Kolberg, M.; Magill, E.; Wilson, M.E. Compatibility issues between services supporting networked appliances. IEEE Commun. Mag. 2003, 41, 136–147. [Google Scholar]
- Wilson, M.; Kolberg, M.; Magill, E. Considering Side Effects in Service Interactions in Home Automation—an Online Approach. Proceedings of the 9th International Conference on Feature Interactions in Software and Communication Systems (ICFI2007), Grenoble, France, 3–5 September 2007; pp. 172–187.
- Layouni, A.F.; Logrippo, L.; Turner, K.J. Conflict detection in call control using first-order logic model checking. Proceedings of 9th Int. Conf. on Feature Interactions in Software and Communications Systems (ICFI2007), Grenoble, France, 3–5 September 2007; pp. 66–82.
- Ter Beek, M.H.; Gnesi, S.; Montangero, C.; Semini, L. Detecting policy conflicts by model checking UML state machines. In Featur. Interact. Softw. Commun. Syst. X; 2009; 0, pp. 59–74. [Google Scholar]
- Nakamura, M.; Matsuo, S.; Matsumoto, S.; Sakamot, H.; Igaki, H. Application Framework for Efficient Development of Sensor as a Service for Home Network System. Proceedings of the IEEE International Conference on Services Computing (SCC2011), Washington DC, USA, 4–9 July 2011; pp. 576–583.
- Lupu, E.; Sloman, M. Conflicts in policy-based distributed systems management. IEEE Trans. Softw. Eng. 1999, 25, 852–869. [Google Scholar]
- Dunlop, N.; Indulska, J.; Raymond, K. Dynamic Conflict Detection in Policy-Based Management Systems. Proceedings of Sixth International Enterprise Distributed Object Computing Conference, Lausanne, Switzerland, 17–20 September, 2002; pp. 15–26.
- Charalambides, M.; Flegkas, P.; Pavlou, G.; Bandara, A.; Lupu, E.; Russo, A.; Dulav, N.; Sloman, M.; Rubio-Loyola, J. Policy Conflict Analysis for Quality of Service Management. Proceedings of Sixth IEEE International Workshop on Policies for Distributed Systems and Networks, Stockholm, Sweden, 6–8 June 2005; pp. 99–108.
- Shankar, C.; Campbell, R. A Policy-Based Management Framework for Pervasive Systems Using Axiomatized Rule-Actions. Proceedings of Fourth IEEE International Symposium on Network Computing and Applications, Cambridge, MA, USA, 27–29 July 2005; pp. 255–258.


| Method | ||||
|---|---|---|---|---|
| off() | heating(setTemp) | cooling(setTemp) | ||
| State | OFF | next : OFF | env. electricity += 1500 | env. electricity += 1500 |
| env. temperature = setTemp | env. temperature = setTemp | |||
| next : HEATING | next : COOLING | |||
| HEATING | env.electricity -= 1500 | env. temperature = setTemp | env.temperature = setTemp | |
| env.temperature =10 | next : HEATING | next : COOLING | ||
| next : OFF | ||||
| COOLING | env.electricity -= 1500 | env.temperature = setTemp | env.temperature = setTemp | |
| env.temperature =10 | next : HEATING | next : COOLING | ||
| next : OFF | ||||
| (a) | ||||
| Method | |||
|---|---|---|---|
| off() | on() | ||
| State | OFF | next : OFF | env.electricity += 500 |
| envbrightness += 200 | |||
| next : ON | |||
| ON | electricity -= 500 | next : ON | |
| env.brightness -= 200 | |||
| next : OFF | |||
| (b) | |||
| Method | ||||
|---|---|---|---|---|
| off() | on() | setBrightness(setB) | ||
| State | next : OFF | env.brightness += | env.brightness += 100 * setB | |
| OFF | 100 * this.bLevel | env.electricity +=50 | ||
| env.electricity +=50 | this.bLevel = setB | |||
| next : ON | next : ON | |||
| env.brightness -= | next : ON | env.brightness += | ||
| ON | 100 * this.bLevel | 100 *(setB-this.bLevel) | ||
| env.electricity -=50 | this.bLevel = setB | |||
| next : OFF | next : ON | |||
| (c) | ||||
| Environment Property | ||||
|---|---|---|---|---|
| temperature | brightness | electricity | ||
| Service | DVD-T | ○ | ||
| ALC | ○ | |||
| ARH | ○ | |||
| ESAC | ○ | |||
| ARC | ○ | |||
| LH | ○ | |||
| ESIA | ○ | |||
| Second Service SB | ||||||||
|---|---|---|---|---|---|---|---|---|
| DVD-T | ALC | ARH | ESAC | ARC | LH | ESIA | ||
| First Service SA | DVD-T | Chain FI | Chain | |||||
| ALC | Chain | |||||||
| ARH | Chain FI | Chain FI | ||||||
| ESAC | Chain | |||||||
| ARC | Chain | |||||||
| LH | Chain FI | Chain FI | ||||||
| ESIA | Chain | Chain FI | ||||||
© 2012 by the authors; licensee MDPI, Basel, Switzerland. This article is an open access article distributed under the terms and conditions of the Creative Commons Attribution license (http://creativecommons.org/licenses/by/3.0/).
Share and Cite
Inada, T.; Igaki, H.; Ikegami, K.; Matsumoto, S.; Nakamura, M.; Kusumoto, S. Detecting Service Chains and Feature Interactions in Sensor-Driven Home Network Services. Sensors 2012, 12, 8447-8464. https://doi.org/10.3390/s120708447
Inada T, Igaki H, Ikegami K, Matsumoto S, Nakamura M, Kusumoto S. Detecting Service Chains and Feature Interactions in Sensor-Driven Home Network Services. Sensors. 2012; 12(7):8447-8464. https://doi.org/10.3390/s120708447
Chicago/Turabian StyleInada, Takuya, Hiroshi Igaki, Kosuke Ikegami, Shinsuke Matsumoto, Masahide Nakamura, and Shinji Kusumoto. 2012. "Detecting Service Chains and Feature Interactions in Sensor-Driven Home Network Services" Sensors 12, no. 7: 8447-8464. https://doi.org/10.3390/s120708447
APA StyleInada, T., Igaki, H., Ikegami, K., Matsumoto, S., Nakamura, M., & Kusumoto, S. (2012). Detecting Service Chains and Feature Interactions in Sensor-Driven Home Network Services. Sensors, 12(7), 8447-8464. https://doi.org/10.3390/s120708447