Developing a Reading Concentration Monitoring System by Applying an Artificial Bee Colony Algorithm to E-Books in an Intelligent Classroom

Abstract
: A growing number of educational studies apply sensors to improve student learning in real classroom settings. However, how can sensors be integrated into classrooms to help instructors find out students' reading concentration rates and thus better increase learning effectiveness? The aim of the current study was to develop a reading concentration monitoring system for use with e-books in an intelligent classroom and to help instructors find out the students' reading concentration rates. The proposed system uses three types of sensor technologies, namely a webcam, heartbeat sensor, and blood oxygen sensor to detect the learning behaviors of students by capturing various physiological signals. An artificial bee colony (ABC) optimization approach is applied to the data gathered from these sensors to help instructors understand their students' reading concentration rates in a classroom learning environment. The results show that the use of the ABC algorithm in the proposed system can effectively obtain near-optimal solutions. The system has a user-friendly graphical interface, making it easy for instructors to clearly understand the reading status of their students.1. Introduction
In recent years, the use in educational contexts of e-books, which are learning materials in electronic form, has attracted more attention [1–3]. However, researchers and educators not only have to understand the effect on student learning that arise from using e-books, but also have to know the learning status of students in the classroom when reading e-books, such as reading concentration rates, emotions, and anxiety levels. With the development of computer networks, sensor technologies have been widely applied in various fields, such as biomedical engineering [4,5], material science [6,7], navigation [8–11], and warehousing [12–14]. In addition, more and more educators have applied sensor technologies to classroom activities and in learning environments, because they have the advantages of low cost and fast data collection. Some related applications of sensor technologies in education include context aware ubiquitous learning [15–21], augmented reality [22–26], e-books [27], intelligent classrooms [28,29], and the physiological measurement of students [30,31]. The results of these previous studies show that using sensor technologies can promote the learning achievement and motivation of students in their learning environments.
Sensors make measurements and can send the related data to various devices. With regard to physical measurements, sensors can be used to monitor pressure, temperature, humidity, oxygen, and gravity, many of which have been applied in learning environments. Hwang et al. proposed a set of basic criteria and strategies that can be used for context-aware ubiquitous learning [32], and used radio-frequency identification (RFID) tags with PDAs to increase the botanical knowledge of students. Wang and Wu proposed an adaptive u-learning system to improve learning effectiveness using context-aware technology and recommendation algorithms [20]. In addition, Chen and Huang presented a context-aware ubiquitous learning system (CAULS) based on RFID, wireless networks, embedded handheld devices, and database technologies to detect and examine the real-world learning behaviors of students [33]. The findings obtained by Chen and Huang suggested that this innovative approach enhanced the students' learning intentions. In a science course, Hwang et al. proposed a context-aware u-learning environment that was developed for guiding inexperienced researchers to practice single-crystal X-ray diffraction operations. The results of their study showed that the benefits of this innovative approach are: (a) it is systematic, authentic, and economical, and (b) this context-aware technology could be applied to help students understand and carry out complex science experiments in different domain, such as physics, chemistry or biotechnology [19]. Sayed et al. presented an augmented reality student card (ARSC) as an application of augmented reality (AR) in an educational context. In their work, the ARSC was used by a number of students of both genders, aged between 10 and 17, and it was widely accepted by students [24]. Huang et al. developed an interactive e-book learning system (IELS) for elementary school students, and concluded that its touch screen-based learning tracking technique was able to provide a clear view of the students' learning processes [27].
Researchers have also used sensor technologies to obtain students' physiological data. For example, Wu et al. proposed the concept of an intelligent classroom, and they presented a prototype system that integrated various sensors and networking technologies to develop an effective e-book learning environment for students [34]. Su et al. proposed the simple system of learning concentration detection based on a webcam and pressure cushion [31]. Hwang et al. also developed a sensor-assisted learning system (SALS) based on various sensor technologies, including a pressure sensor, heartbeat sensor, and webcam. Their study used decision trees (C4.5 Algorithm) to build the structure of the SALS, and it was found that recognition accuracy with regard to the students' concentration levels ranged from 86% to 90% [30]. Previous studies [20,30–32,34] demonstrate that sensor technologies have now become an important tool for use in education, and thus the current work aims to use sensors to help instructors discover students' reading concentration rate and to raise their learning effectiveness.
Reading concentration measures how actively a student actively pays attention to the learning materials and contents during the learning process. In the past few decades, there were several terms proposed for concentration on learning, and one of them is attention. Attention refers to the awareness [35]. Attention is the ability to focus or sustain on an action without interference from external stimuli. Davenport and Beck [36] stated that attention is the ability to focus on specific items, while Dumont [37] pointed out that focused attention is the same as concentration. Jensen [38] stated that attention in an educational environment usually refers to an externally focused concentration. Concentration or attention plays an important role in improved learning [39,40], as students must focus on the learning materials, and then continue to do so for some time if they are to retain the information they contain [41,42]. Corno [43] pointed out that enhances learning outcomes are often seem for students with high concentration or motivation and student concentration is a key factor in the effectiveness of instructors' teaching strategies [44].
In general, understanding the individual learning status of each student can help instructors develop more appropriate teaching strategies and enhance the quality of learning that occurs in the classroom. However, in traditional classroom instructors usually need to teach many students at once, and thus it is difficult for instructors to pay attention to the learning status of each student to give them appropriate assistance. In the current study, reading concentration refers to the attention that is focused on reading or learning. Delgado et al. indicated that students' learning concentration is a crucial factor in their learning performance [45], and while concentration can be easily observed from the students' behavior [46], it is hard to analyze using technology. Therefore, some studies have tried to examine learning concentration by using sensor technologies, and the results indicate that this approach can be effective [30,31]. In addition, by using sensor technologies instructors can understand some of the crucial factors that reveal learning concentration, including facial expressions, and eye and body movements.
Monitoring learning behavior by using sensor technologies in an educational environment is a challenging exercise, especially when various different sensors are used, and the data needs to be combined. Over the past few years, several studies have used an artificial bee colony algorithm (ABC) to solve different combinatorial problems [47], and Karaboga [48] indicated that the performance of the ABC is better than, or at least similar to, that of an evolutionary strategy (ES) or particle swarm optimization algorithm (PSO).
In recent years the Taiwanese government has conducted a series of e-learning experimental projects [49], examining the use of intelligent classrooms, e-books, and digital Chinese learning materials. An intelligent classroom is defined as a classroom that integrates of information technology, such as interactive whiteboards, e-books, and sensors, to facilitate the teacher teaching and enhance student learning. One of the aims when using digital learning materials is to monitor reading concentration. However, it is difficult for instructors to observe the learning of individual students so that they can provide enough attention to help their learning.
The purpose of this study was to develop a reading concentration monitoring system using sensor technologies that includes a webcam, heartbeat sensor, and blood oxygen sensor to help instructors observe the learning status of students when they are reading digital materials in an intelligent classroom. Using the three types of sensors, the proposed system can evaluate the reading concentration of students. Moreover, the ABC algorithm is used to search for the students that are not paying attention to the digital learning materials. The reading concentration data can help instructors understand the learning status of the individual students, and thus adopt more suitable teaching strategies based on this.
2. Artificial Bee Colony (ABC) Algorithm
The artificial bee colony (ABC) algorithm was first proposed by Karagoga to search for near-optimal solutions [47]. The ABC algorithm is based on the foraging behaviors of bees, and mimics the interactions that occur in swarm intelligence to solve optimization problems [48]. Swarm intelligence, like particle swarm optimization, has been successfully applied in various fields, such as wireless sensor networks, e-learning, flow shop problems, scheduling problems, and clustering problems [50–59].
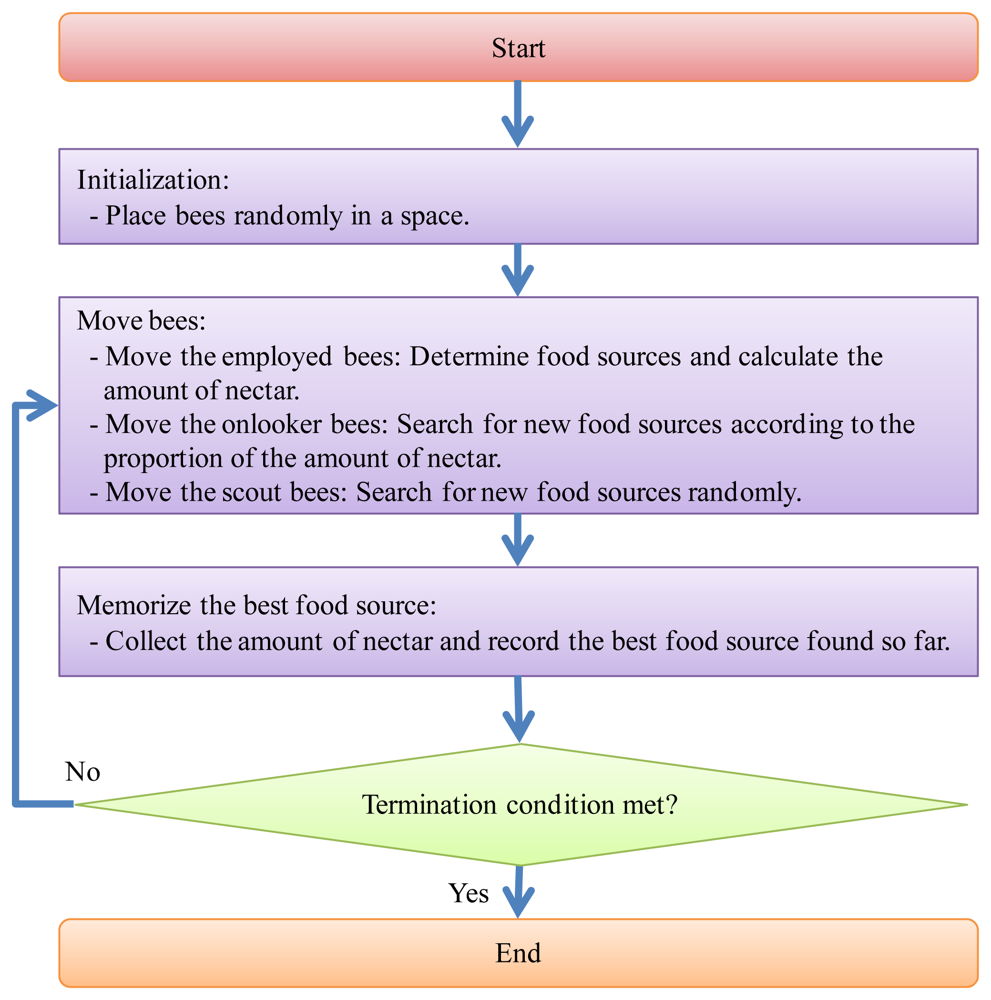
In the real environment, a social community of bees in a colony is composed of three main types of bees, which are a queen as the kernel, a few drones for reproducing the next generation, and a large number of workers that look for pollen and take care of larvae in the colony. The ABC algorithm is based on the behavior of worker bees, which it divides into employed, onlooker, and scout bees. Scout bees are responsible for searching for new food sources and reporting the amount of nectar at each location. After the scout bees have gathered this information, the employed bees fly to the neighborhood of the food sources to search for the new source and find out how much nectar they have. The onlooker bees wait for information about the food sources from the employed bees, and then use this to go out and gather nectar. Figure 1 shows the detailed procedure of the ABC algorithm.
At first, assume that bees are generated in the initialization step. Half of the N bees are selected to randomly spread out to search for food resources in the solution space. Each bee selects a position and retains the amount of nectar there in its memory, with the results of this being used to produce the first fitness value. Next, each employed bee flies to the selected food source and chooses a new position near the original ones. After comparing the amount of nectar at both food sources, the employed bee selects the one with the most nectar as the new food source. Third, the onlooker bees stay at the hive to wait for information about the amount of nectar at the selected food sources. The onlooker bees then select a food source, and the probability that a particular food source will be selected increases along with the amount of nectar that it has.
The probability of a food source will be selected is shown in the following formula:
3. Reading Concentration Monitoring System Scheme
This study presents a reading concentration monitoring system as a method of observing the learning status of students and providing the results to the instructors, so that they can improve learning outcomes. To determinate the students' learning status, the system uses three types of sensor technologies, namely a webcam, heartbeat sensor, and blood oxygen sensor (fingertip oximeter), in order to gather eye gaze, heartbeat, and blood oxygen saturation data. The important notations and variables used in this paper are listed in Table 1.
The reading concentration monitoring system can acquire the learning status of each student in an intelligent classroom, and then record their concentration rates in the database of this system. The instructor can then use the results to modify the learning materials or teaching strategies. Assume that the reading concentration monitoring system observes N students in a teaching environment, who are denoted as L1, L2, … LN. The learning behaviors in the activity are monitored by sensors and recorded in the database. There are M students, which are a subset of N, that are selected from the database for learning status to monitor their learning status. The term si indicates whether a student is selected or not. Based on the three variables obtained from the sensors, the system can reveal whether the students are attentive or not.
First, networked webcams are used to observe the positions of students' eyes. Hwang et al. proposed the SALS that captured the image of an individual student by a webcam, and analyzed the image whether the eyes were in the image for identifying the student's attention [30]. According to Hwang et al., networked webcams in our method are used to observe the positions of students' eyes and calculate the center position of their two eyes to determine their reading fixation. This study determines that the student pays attention in reading materials presented on the screen for acquiring knowledge, when the center position of the student's eyes is in the image. On the other hand, the networked webcam captures the eyes' center point Pi of student i on the screen T times during a fixed period for detecting reading fixation. The center point is composed of a two-dimensional vector [pi,j,1 pi,j,2], which includes the x-axis and the y-axis dimensions, where j means the j-th measurement. Therefore, the definition of center point Pi is as follows:
The element pi,j,k of matrix Pi represents that student i looks at point k at a time point j, where 1 ≤ i ≤ N, 1 ≤ j ≤ T, and 1 ≤ k ≤ 2. In order to determine whether student i is paying attention to the screen, a matrix Gi = [gi,1 gi,2 gi,3 ⋯ gi,T]Tr is used to set the value of reading fixation. The element gi,j of matrix Gi represents the degree of reading fixation. gi,j is set to 1 if one pi,j,k exists in the position of the screen, and 0 otherwise. The definition of the reading fixation rate ri is used to obtain the level of fixation of student i, as follows:
The value of reading fixation rate ri of student i increases, as the reading fixation of student i on the screen increases. The μ represents the reading fixation rate of the selected students with regard to the reading materials. Therefore, the strength of relationship μ between the reading fixation rate and the concentration of the students is presented as follows:
Second, heartbeat detectors are used to observe the heartbeat rates of the students. Previous studies found that there are significant correlations between attention and heartbeat rate, which goes down when students pay more attention to learning materials, and vice versa [60–62]. Hwang et al. thus proposed the SALS, which obtained the heartbeat rates of an individual student via a heartbeat sensor, and analyzed these to assess their level of attention [30]. In our work the system automatically detects the heartbeat of student i for T times during a fixed period via the heartbeat detector. With regard to heartbeats of students, both the heart rate and its variation are considered. When a student concentrates on reading materials, their heart rate is at a certain value, and the variation is relatively low. The target heart rate hi,Target is the measured heart rate, when student i concentrates on reading materials. The heart rate of student i is presented as the matrix Hi = [hi,1 hi,2 hi,3 …hi,T]Tr, and the element hi,j means the heart rate measured at a fixed point of time j. The average heart rate ai is presented as follows:
To determine the slope, the system uses the variation of heart rate Δbi of student i:
The variable λ represents the heartbeat status of the selected students. When the students have a high level of reading concentration, the value of λ is also high. The strength of relationship λ between heart rate and the students' concentration is showed as follows:
Finally, blood oxygen detectors are used to observe the blood oxygenation of the students. In general, a learner in the state of hypoxia is more likely to experience memory loss, lack of concentration, lethargy, and mental depression. There are various methods for measuring blood oxygen saturation such as saturation of peripheral oxygen (SpO2), venous oxygen saturation (SvO2), and arterial oxygen saturation (SaO2). Saturation of peripheral oxygen (SpO2) is a nonintrusive measurement, and has been used to estimate mental and physical fatigue [63]. In our work the system automatically detects the oxygenation of the blood via a physical SpO2 detector. In general, when the oxygen in the blood is lower, the student is more easily fatigued and is less likely to concentrate on the reading learning materials. Two factors are considered here, the oxygen in the blood and the variation of this. The oxygen in the blood is presented as the matrix Oi = [oi,1 oi,2 oi,3 …oi,T]Tr,. The element oi,j of matrix Oi is the oxygen in the blood for student i at a time point j. In order to find students that are within a specific range, such as the range from 100% to 90%, the system determines the matrix Xi = [xi,1 xi,2 xi,3 …xi,T]Tr to transform original oxygen of blood, and the element xi,j of matrix Xi is presented as follows:
The average transformed oxygen xi in the blood during a time is presented as follows:
In order to determine the slope, the system uses the variation of oxygen in the blood Δyi:
The variable π represents the oxygen situation in blood of the selected students with regard to the reading materials. When the selected students have higher levels of oxygen in the blood, the value of π is higher. The strength of relationship π between the oxygen in the blood and the concentration of the students is shown as follows:
The fitness function F(s) in the reading concentration monitoring system model consists of the following three constraints. The fitness value is obtained by the fitness function F(s), and the fitness value is updated by a process of computation and iteration to find students who are not paying attention. When the students have a low level of reading concentration, their presented fitness value will be lower than that of the other students with more reading concentration. If the selected students have a minimal fitness value, the system will select the optimal solution. The formal definition of the system model is as follows:
4. Framework of a Reading Concentration Monitoring System
In this section, we present a reading concentration monitoring system that collects learning behaviors through sensor technologies and then finds the students' actual reading concentration rates in an actual learning environment. The related procedures are described in detail.
4.1. Architecture
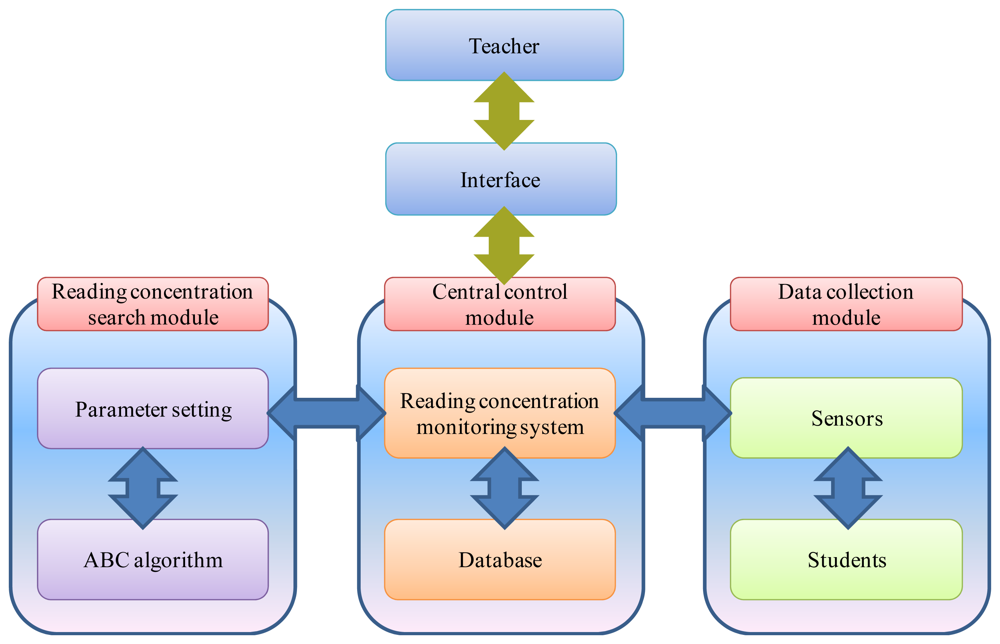
Figure 2 shows the architecture of the reading concentration monitoring system. There are three main components, which are the central control module, data collection module, and reading concentration search module.
Central control module: The central control module is the main module of the system, and is responsible for information exchange. This module receives the reading behaviors of students and records them into the database. It then transforms these behaviors into reading concentration data using an equation. The results are then provided to the reading concentration search module for searching purposes.
Data collection module: The main purpose of the data collection module is to observe the reading behaviors of students, and this is carried out using three types of sensors, which are a webcam, heartbeat sensor, and blood oxygen sensor. The heartbeat and blood oxygen sensors are embedded on the side of the computer mouse. The webcam captures the center point of the student's eyes on the screen. The heartbeat sensor detects the heartbeat and the variations in this that occur when the student is on reading. Finally, the blood oxygen sensor is used to measure the level of oxygen in the student's blood. The data collected from these sensors is then sent to the central control module.
Reading concentration search module: The reading concentration search module is used so that the instructor can find specific information. Via the user interface, the instructor can set specific parameters, such as time and activities, as well the range of view on the screen, variations on heart rate, and the threshold of the oxygen in the blood. After the instructor has set these parameters, the ABC algorithm searches for students that are not paying attention, with the results being sent to the central control module and then presented on the user interface.
4.2. Procedure
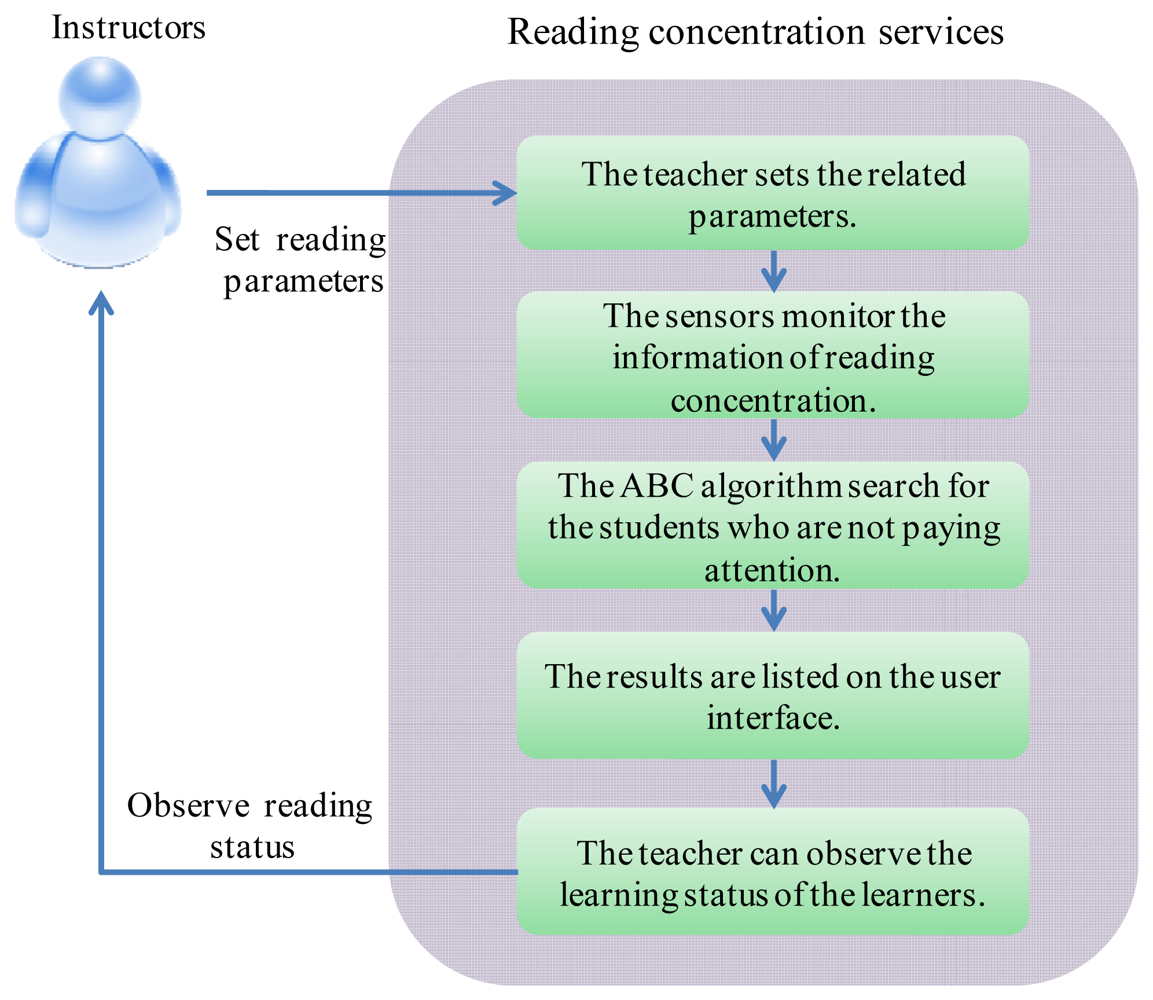
By using the reading concentration system, an instructor can easily understand the learning status of students and the learning atmosphere in class. The flow path of the reading concentration system is shown in the following steps in Figure 3.
Step 1
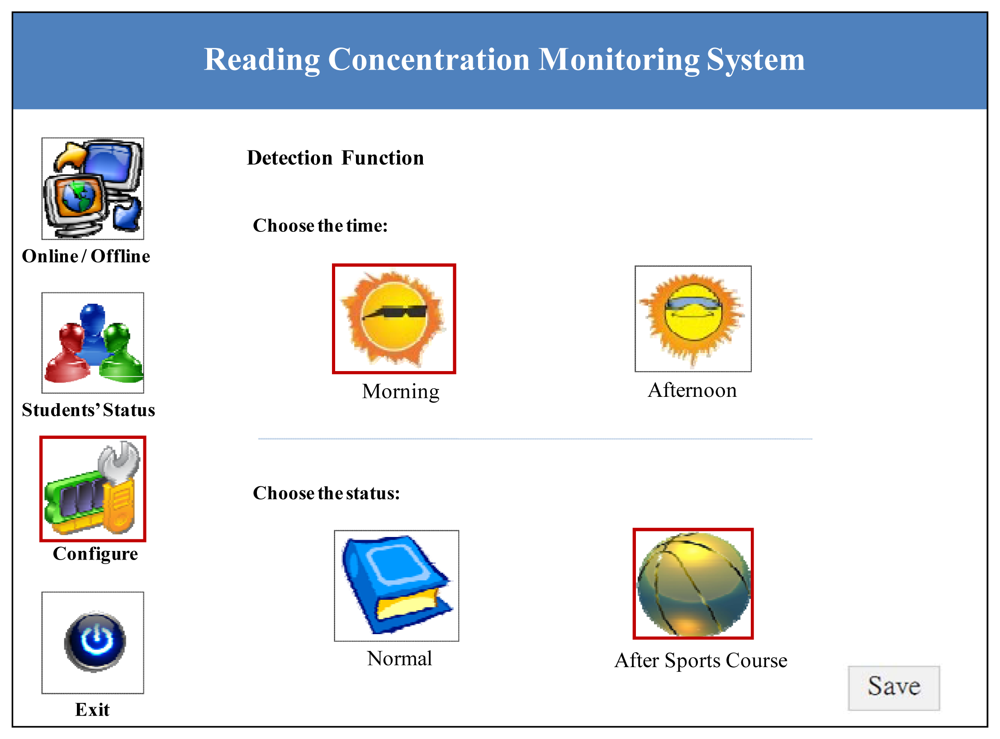
In this system, instructors can set various parameters to suit the specific classroom situation. For example, different times and activities may affect the data, with the former being divided into morning and afternoon, and the latter into a general learning class and a sports class having taken place before the focal class. In general, people have better spirits in the morning than in the afternoon due to variations in blood oxygen. More, the heart rate of is faster after exercise, and this will affect the data that is gathered. Because physiological conditions are affected by many external factors, instructors can select the appropriate detection functions to best monitor the reading concentration of students. Figure 4 shows a screenshot for setting the parameters of the reading concentration monitoring system.
Step 2
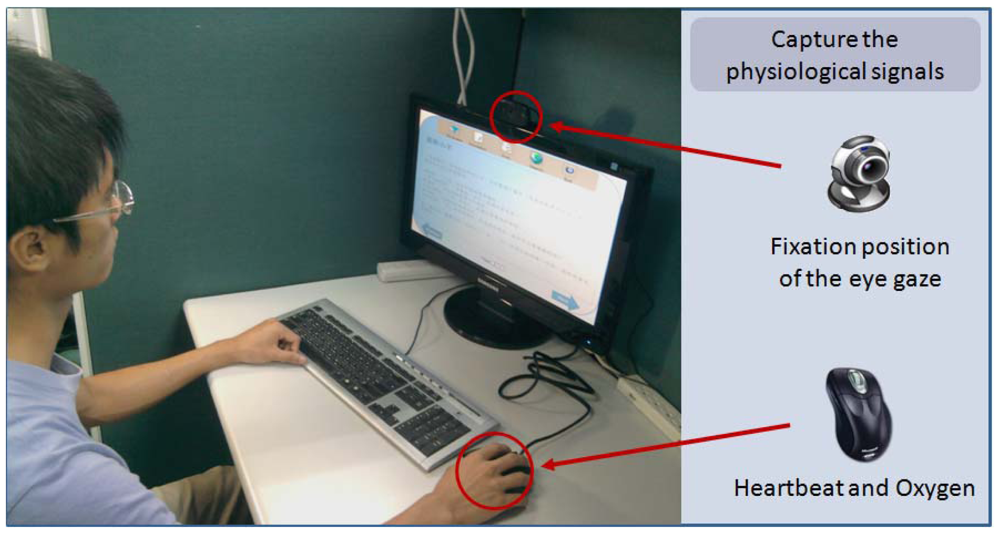
The sensors monitor various physiological signals while the students are reading the learning materials. Figure 5 shows an example of a student using the proposed system. In this figure, the student uses a PC to read the digital learning materials contained in a software type e-book, and the computer is equipped with the reading concentration monitoring system. The proposed system provides information of reading concentration to help instructors understand the learning status of the individual students and it is used to provide suitable teaching strategies based on the level of students' reading concentration. The assisted teaching features of this proposed system accords with the concept of assisting tools in intelligent classroom.
Step 3
The ABC algorithm searches for the students with a low level of attention, based on the data that the sensors collect than the ABC algorithm.
Step 4
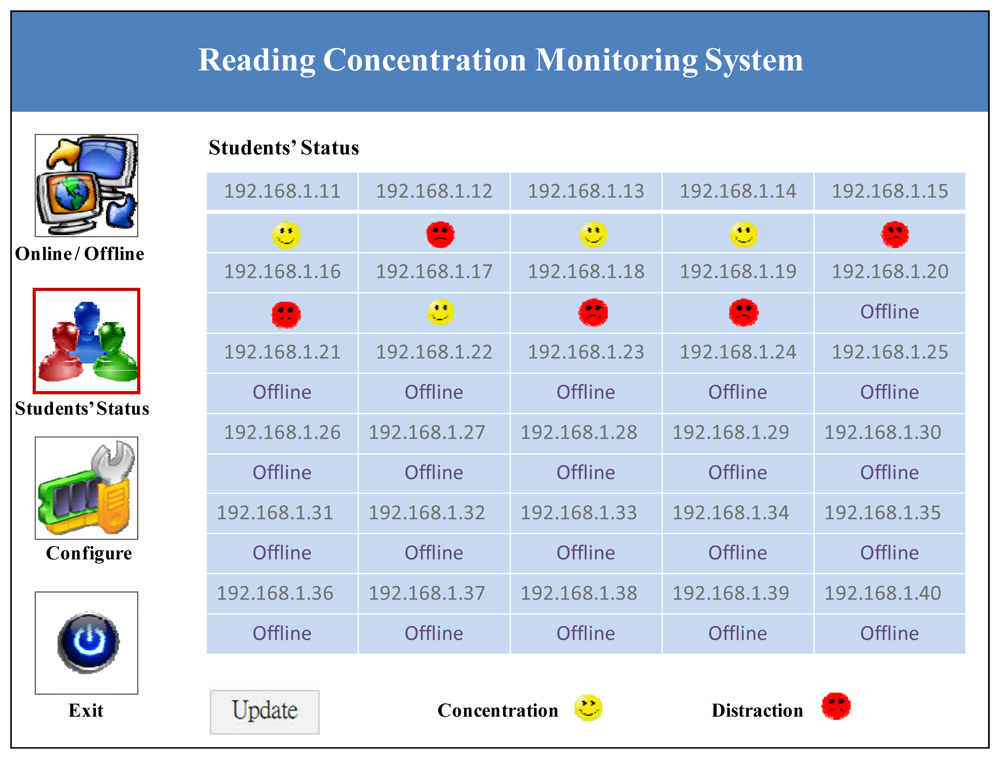
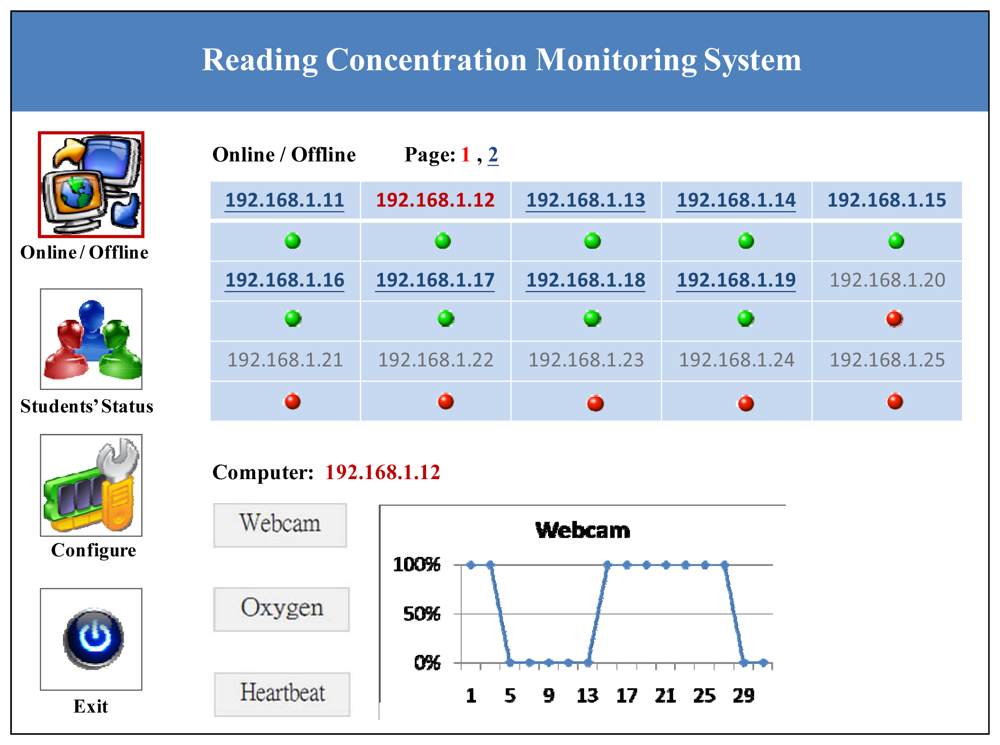
The results are presented on the user interface, as shown in Figure 6.
Step 5
The instructor can observe the learning status of the students, and if he or she wants to see more details, these can be obtained by clicking on the students who are not concentrating on the learning materials. Figure 7 shows the reading status of an individual student.
5. Experimental Results
To evaluate the performance of the reading concentration monitoring system proposed in this work, a series of experiments were conducted to compare the average fitness values and computation time values. Three main scenarios that were considered as follows: (1) the ABC algorithm and the random search method, (2) 2,000 iterations and different numbers of bees, and (3) 20 bees and different numbers of students. A personal computer which included an Intel Core 2 Quad 2.4 GHz CPU and one 2 GB of RAM was used to run all the experiments. The database included ten datasets of students and the number of students ranged from 150 to 1,500. Every dataset was run ten times each for the ABC algorithm and the random search method. The number of bees was set from 20 to 100. The number of computing iterations was set at 2,000 and the limit value of the ABC algorithm was set at 100.
In the first scenario, the random search method and the ABC algorithm were adopted to compare the fitness values and execution time values, as shown in Tables 2 and 3. The results show that the fitness value obtained from the random search method was around 0.9 in ten datasets. The fitness value obtained from the ABC algorithm was under 0.6 at 1,000 iterations, and the fitness value from the algorithm at 2,000 iterations was under 0.3. The maximum execution time of the random search method was under 1 s, while that of the ABC algorithm was about 36 s. As stated above, although the execution time of the ABC algorithm in each dataset was more than that of the random search method, the fitness value of the ABC algorithm is lower than that of the random search method.
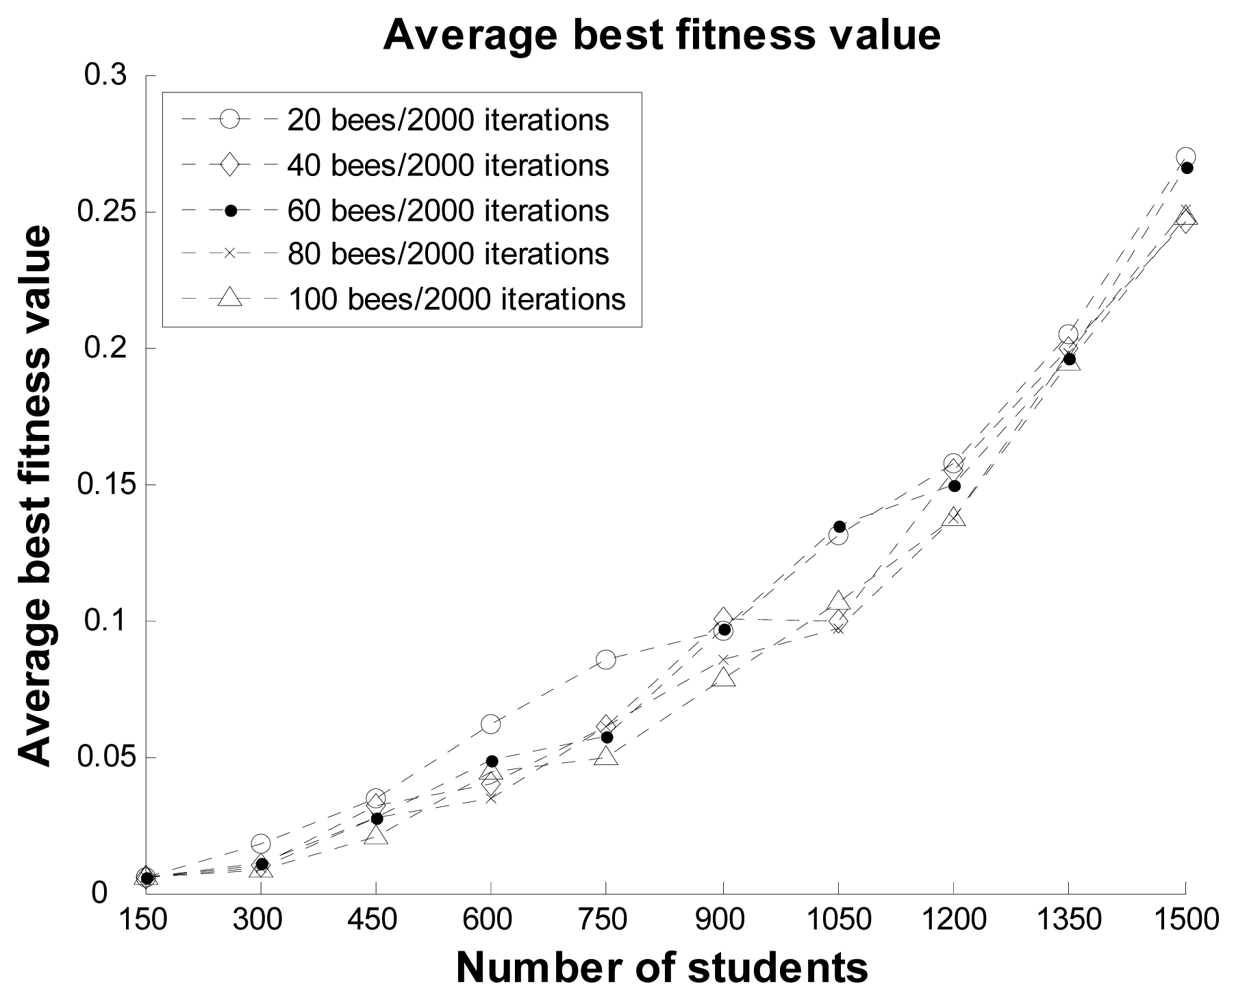
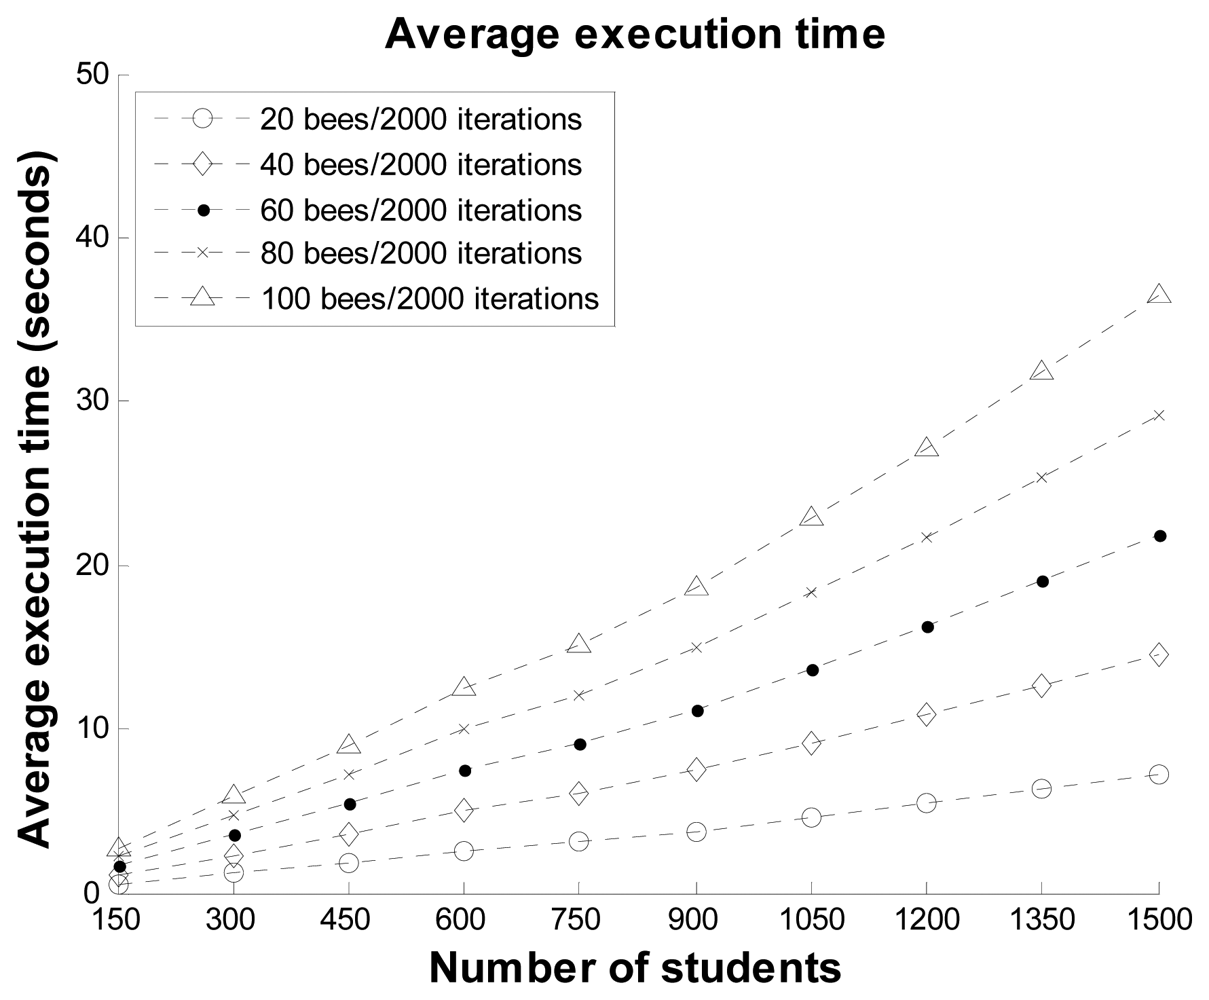
In the second scenario, the experiment considered the impact of the number of bees on the ABC optimal method for the proposed system. Twenty, 40, 60, 80, and 100 bees were used to compare the fitness values and execution times, as shown in Figures 8 and 9, respectively. It can be observed that the maximum difference in the fitness values among the different numbers of bees was about 0.05 for 750 students. In the other datasets, the difference in the fitness values among the different numbers of bees was also very small. The execution time in each dataset increased almost linearly with the number of bees. The results demonstrate that while a greater number of bees can reduce the best fitness value, the influence on the optimal solutions is small. Therefore, we suggest that the proposed system can use 20 bees in practical applications.
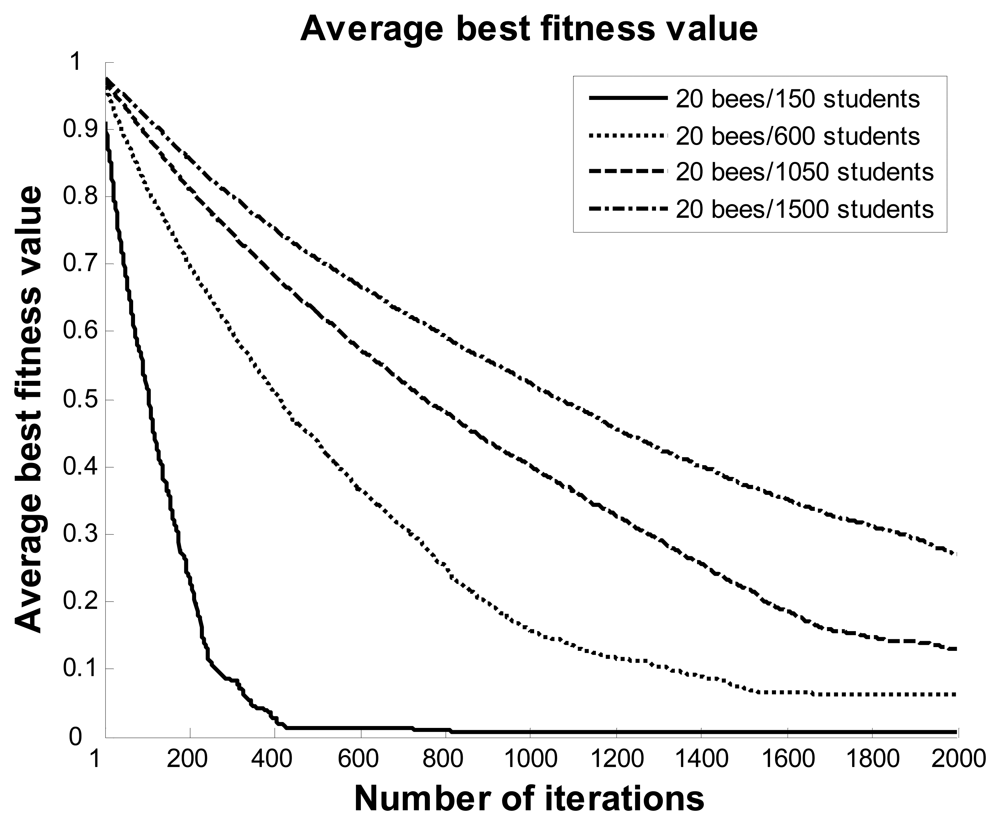
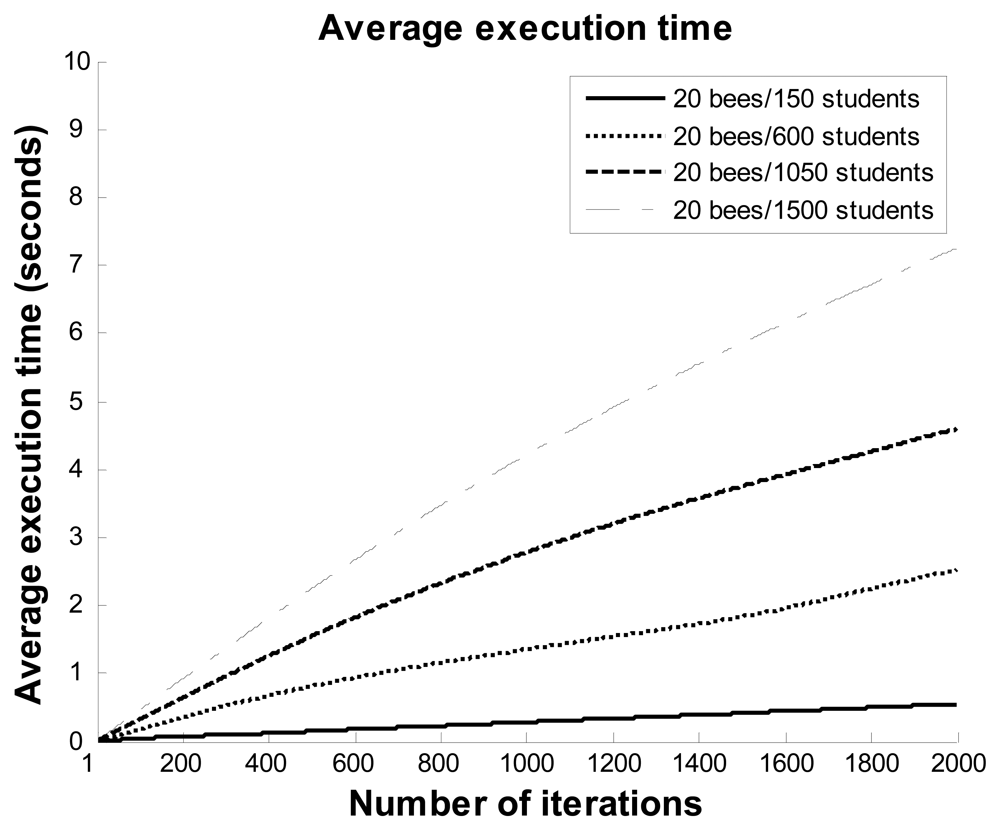
In order to observe the near-optimal solutions of the ABC algorithm in different datasets, four datasets that included 150, 600, 1,050, and 1,500 students were selected for this experiment in the third scenario. Figures 10 and 11 show the best fitness and execution time values of the ABC algorithm with 20 bees and different numbers of students. When the number of students was 400, the fitness value rapidly fell to under 0.1 before about 210 iterations, and then continued to decline to close to zero at 420 iterations. The line for 600 students had a similar falling trend as the line for 150 students. For the lines of 1,050 and 1,500 students, the fitness values decreased following a smooth curve with the number of iterations, and the fitness values fell to less than 0.3 at 2,000 iterations. The maximum execution time for this experiment was under eight seconds. The results show that the ABC algorithm can help users to quickly obtain near-optimal solutions within a reasonable period of time.
6. Conclusions
This paper proposed a reading concentration monitoring system using sensor technologies to detect the learning behaviors of students when reading an e-book, based on physiological signals and an artificial bee colony algorithm (ABC). To evaluate the performance of this system in a learning environment, a series of experiments were conducted on ten datasets. The results show that the ABC algorithm can effectively reduce the fitness value, while the random search method may not achieve the near-optimal solution. In addition, the downward trend of the fitness value of the ABC algorithm toward the best solution is very rapid, and has the capability to explicitly produce effective results within a reasonable time to meet the immediate needs of instructors. Based on our findings, the proposed system can help instructors develop more appropriate teaching strategies that are better able to promote student learning motivation, class management, and peer discussions, by understanding the individual learning status of each student. In our future work, we plan to extend this research by using the proposed system in an actual teaching and learning environment, and to assess its practicality based on feedback from instructors.
Acknowledgments
This work was supported by the National Science Council (NSC), Taiwan, under Contracts No. NSC 100-2511-S-006-015-MY3, NSC 100-2218-E-006-017, and NSC 101-2511-S-041-001-MY3.
References
- Korat, O. Reading electronic books as a support for vocabulary, story comprehension and word reading in kindergarten and first grade. Comput. Educ. 2010, 55, 24–31. [Google Scholar]
- Korat, O.; Shamir, A. The educational electronic book as a tool for supporting children's emergent literacy in low versus middle SES groups. Comput. Educ. 2008, 50, 110–124. [Google Scholar]
- Woody, W.D.; Daniel, D.B.; Baker, C.A. E-books or textbooks: Students prefer textbooks. Comput. Educ. 2010, 55, 945–948. [Google Scholar]
- Shambat, G.; Kothapalli, S.R.; Khurana, A.; Samiento, T.; Cheng, K.; Cheng, Z.; Harris, J.; Daldrup-Link, H.; Gambhir, S.S.; Vučković, J. A photonic crystal cavity-optical fiber tip nanoparticle sensor for biomedical applications. Appl. Phys. Lett. 2012, 100. 213702-213702-4. [Google Scholar]
- Khoshnoud, F.; de Silva, C.W. Recent advances in MEMS sensor technology—Biomedical applications. IEEE Instrum. Meas. Mag. 2012, 15, 8–14. [Google Scholar]
- Ion, I.; Ion, A.C. Determination of chlorpyriphos in broccoli using a voltammetric acetylcholinesterase sensor based on carbon nanostructure-chitosan composite material. Mater. Sci. Eng. C-Mater. Biol. Appl. 2012, 32, 1001–1004. [Google Scholar]
- Zamani, H.A.; Mohammadhosseini, M.; Haji-Mohammadrezazadeh, S.; Faridbod, F.; Ganjali, M.R.; Meghdadi, S.; Davoodnia, A. Gadolinium(III) ion selective sensor using a new synthesized Schiff's base as a sensing material. Mater. Sci. Eng. C-Mater. Biol. Appl. 2012, 32, 712–717. [Google Scholar]
- Abdelfatah, W.F.; Georgy, J.; Iqbal, U.; Noureldin, A. FPGA-based real-time embedded system for RISS/GPS integrated navigation. Sensors 2011, 12, 115–147. [Google Scholar]
- Guerrero, L.A.; Vasquez, F.; Ochoa, S.F. An indoor navigation system for the visually impaired. Sensors 2012, 12, 8236–8258. [Google Scholar]
- He, B.; Zhang, H.; Li, C.; Zhang, S.; Liang, Y.; Yan, T. Autonomous navigation for autonomous underwater vehicles based on information filters and active sensing. Sensors 2011, 11, 10958–10980. [Google Scholar]
- Morrison, A.; Renaudin, V.; Bancroft, J.B.; Lachapelle, G. Design and testing of a multi-sensor pedestrian location and navigation platform. Sensors 2012, 12, 3720–3738. [Google Scholar]
- Chow, H.K.H.; Choy, K.L.; Lee, W.B.; Lau, K.C. Design of a RFID case-based resource management system for warehouse operations. Expert Syst. Appl. 2006, 30, 561–576. [Google Scholar]
- Poon, T.C.; Choy, K.L.; Chan, F.T.S.; Ho, G.T.S.; Gunasekaran, A.; Lau, H.C.W.; Chow, H.K.H. A real-time warehouse operations planning system for small batch replenishment problems in production environment. Expert Syst. Appl. 2011, 38, 8524–8537. [Google Scholar]
- Poon, T.C.; Choy, K.L.; Chow, H.K.H.; Lau, H.C.W.; Chan, F.T.S.; Ho, K.C. A RFID case-based logistics resource management system for managing order-picking operations in warehouses. Expert Syst. Appl. 2009, 36, 8277–8301. [Google Scholar]
- Chiou, C.K.; Tseng, J.C.R.; Hwang, G.J.; Heller, S. An adaptive navigation support system for conducting context-aware ubiquitous learning in museums. Comput. Educ. 2010, 55, 834–845. [Google Scholar]
- Chu, H.C.; Hwang, G.J.; Tsai, C.C. A knowledge engineering approach to developing mindtools for context-aware ubiquitous learning. Comput. Educ. 2010, 54, 289–297. [Google Scholar]
- Huang, Y.M.; Chiu, P.S.; Liu, T.C.; Chen, T.S. The design and implementation of a meaningful learning-based evaluation method for ubiquitous learning. Comput. Educ. 2011, 57, 2291–2302. [Google Scholar]
- Hwang, G.J.; Kuo, F.R.; Yin, P.Y.; Chuang, K.H. A heuristic algorithm for planning personalized learning paths for context-aware ubiquitous learning. Comput. Educ. 2010, 54, 404–415. [Google Scholar]
- Huang, Y.M.; Huang, Y.M.; Huang, S.H.; Lin, Y.T. A ubiquitous English vocabulary learning system: Evidence of active/passive attitudes vs. usefulness/ease-of-use. Comput. Educ. 2012, 58, 273–282. [Google Scholar]
- Wang, S.L.; Wu, C.Y. Application of context-aware and personalized recommendation to implement an adaptive ubiquitous learning system. Expert Syst. Appl. 2011, 38, 10831–10838. [Google Scholar]
- Tsai, P.S.; Tsai, C.C.; Hwang, G.H. College students' conceptions of context-aware ubiquitous learning: A phenomenographic analysis. Internet High Educ. 2011, 14, 137–141. [Google Scholar]
- Chen, C.M.; Tsai, Y.N. Interactive augmented reality system for enhancing library instruction in elementary schools. Comput. Educ. 2012, 59, 638–652. [Google Scholar]
- Di Serio, Á.; Ibánez, M.B.; Kloos, C.D. Impact of an augmented reality system on students' motivation for a visual art course. Comput. Educ. 2012. in press. [Google Scholar]
- El Sayed, N.A.M.; Zayed, H.H.; Sharawy, M.I. ARSC: Augmented reality student card. Comput. Educ. 2011, 56, 1045–1061. [Google Scholar]
- Salmi, H.; Kaasinen, A.; Kallunki, V. Towards an open learning environment via augmented reality (AR): Visualising the invisible in science centres and schools for teacher education. Proc. Soc. Behav. Sci. 2012, 45, 284–295. [Google Scholar]
- Chen, R.; Wang, X. An empirical study on tangible augmented reality learning space for design skill transfer. Tsinghua Sci. Technol. 2008, 13, 13–18. [Google Scholar]
- Huang, Y.M.; Liang, T.H.; Su, Y.N.; Chen, N.S. Empowering personalized learning with an interactive e-book learning system for elementary school students. Educ. Technol. Res. Dev. 2012, 60, 703–722. [Google Scholar]
- Sevindik, T. Future's learning environments in health education: The effects of smart classrooms on the academic achievements of the students at health college. Telemat. Inform. 2010, 27, 314–322. [Google Scholar]
- Suo, Y.; Miyata, N.; Morikawa, H.; Ishida, T.; Shi, Y. Open smart classroom: Extensible and scalable learning system in smart space using web service technology. IEEE Trans. Knowl. Data Eng. 2009, 21, 814–828. [Google Scholar]
- Hwang, J.P.; Wu, T.T.; Lai, F.J.; Huang, Y.M. A sensor-assisted model for estimating the accuracy of learning retention in computer classroom. Proceeding of the 5th International Conference on Sensing Technology (ICST2011), Palmerston North, New Zealand, 28 November–1 December 2011; pp. 650–654.
- Su, Y.N.; Hsu, C.C.; Chen, H.C.; Huang, K.K.; Huang, Y.M. A learning concentration detection system by using an artificial bee colony algorithm. Proceedings of the 2nd International Conference on Engineering and Technology Innovation (ICETI2012), Kaohsiung, Taiwan, 2–6 November 2012.
- Hwang, G.J.; Tsai, C.C.; Yang, S.J.H. Criteria, strategies and research issues of context-aware ubiquitous learning. Educ. Technol. Soc. 2008, 11, 81–91. [Google Scholar]
- Chen, C.C.; Huang, T.C. Learning in a u-Museum: Developing a context-aware ubiquitous learning environment. Comput. Educ. 2012, 59, 873–883. [Google Scholar]
- Wu, T.T.; Hwang, J.P.; Huang, Y.M.; Tan, Q.; Mukhopadhyay, S. Using a sensor-assisted model for learning retention in an e-book reading environment. Proceedings of the International Instrumentation and Measurement Technology Conference (I2MTC2012), Graz, Austria, 13–16 May 2012; pp. 2553–2557.
- Martens, R. Coaches Guide to Sport Psychology; Human Kinetics: Champaign, IL, USA, 1987. [Google Scholar]
- Davenport, T.H.; Beck, J.C. The Attention Economy: Understanding the New Currency of Business; Harvard Business School Press: Boston, MA, USA, 2001. [Google Scholar]
- Dumont, T.Q. The Power of Concentration. Available online: http://www.jogena.com/resources/concentration.pdf (accessed on 1 October 2012).
- Jensen, A.R. The g Factor: The Science of Mental Ability; Prageger: Westport, CT, USA, 1998. [Google Scholar]
- Melchert, P.L. Attention: A Critical Component of Learning; Pacific Lutheran University: Parkland, WA, USA, 1996. [Google Scholar]
- Schmidt, R. The role of consciousness in second language learning. Appl. Ling. 1990, 11, 129–158. [Google Scholar]
- Berdine, W.H.; Meyer, S.A. Assessment in Special Education; Little, Brown Co.: Boston, MA, USA, 1987. [Google Scholar]
- Hayden, R.R.; Murdoch, R.L.; Quick, C.A. Teacher aides improve attention span. Elem. Sch. J. 1969, 70, 43–47. [Google Scholar]
- Corno, L. The best-laid plans: Modern conceptions of volition and educational research. Educ. Res. 1993, 22, 14–22. [Google Scholar]
- Liu, T.C.; Lin, Y.C.; Tsai, M.J.; Paas, F. Split-attention and redundancy effects in mobile learning in physical environments. Comput. Educ. 2012, 58, 172–180. [Google Scholar]
- Delgado, M.R.; Phelps, E.A.; Robbins, T.W. Decision Making, Affect, and Learning: Attention and Performance; Oxford University Press: New York, NY, USA, 2011. [Google Scholar]
- Namlu, A.G. The effect of learning strategy on computer anxiety. Comput. Hum. Behav. 2003, 19, 565–578. [Google Scholar]
- Karaboga, D. An Idea Based on Honey Bee Swarm for Numerical Optimization; Technical Report TR06; Erciyes University: Kayseri, Turkey, 2005. [Google Scholar]
- Karaboga, D.; Akay, B. A comparative study of artificial bee colony algorithm. Appl. Math. Comput. 2009, 214, 108–132. [Google Scholar]
- Industrial Development Bureau. 2010 E-learning in Taiwan; Innovative DigiTech-Enabled Applications & Services Institute, Institute for Information Industry: Taipei, Taiwan, 2010. [Google Scholar]
- Ozturk, C.; Karaboga, D.; Gorkemli, B. Probabilistic dynamic deployment of wireless sensor networks by artificial bee colony algorithm. Sensors 2011, 11, 6056–6065. [Google Scholar]
- Hwang, J.P.; Hsu, C.C.; Chen, H.C.; Liu, M.C.; Huang, Y.M. Design of a learning companion recommendation system based on learning style on Facebook using an artificial bee colony algorithm. J. Internet Technol. 2012, 13, 817–826. [Google Scholar]
- Lin, Y.T.; Huang, Y.M.; Cheng, S.C. An automatic group composition system for composing collaborative learning groups using enhanced particle swarm optimization. Comput. Educ. 2010, 55, 1483–1493. [Google Scholar]
- Hsu, C.C.; Chen, H.C.; Huang, K.H.; Huang, K.K.; Huang, Y.M. The development of an adaptive group composition system on Facebook for collaborative learning using an artificial bee colony algorithm. Appl. Math. Inform. Sci. 2012, 6. in press. [Google Scholar]
- Chen, H.C.; Hsu, C.C.; Huang, K.K.; Huang, Y.M. An individual video learning material recommendation system on MySpace applying an artificial bee colony algorithm. Adv. Sci. Lett. 2012, 9, 585–590. [Google Scholar]
- Huang, Y.M.; Wu, T.T. A systematic approach for learner group composition utilizing u-learning portfolio. Educ. Technol. Soc. 2012, 14, 102–117. [Google Scholar]
- Hsu, C.C.; Chen, H.C.; Huang, K.K.; Huang, Y.M. A personalized auxiliary material recommendation system based on learning style on Facebook applying an artificial bee colony algorithm. Comput. Math. Appl. 2012, 64, 1506–1513. [Google Scholar]
- Tasgetiren, M.F.; Pan, Q.K.; Suganthan, P.N.; Chen, A.H.L. A discrete artificial bee colony algorithm for the total flowtime minimization in permutation flow shops. Inform. Sci. 2011, 181, 3459–3475. [Google Scholar]
- Ziarati, K.; Akbari, R.; Zeighami, V. On the performance of bee algorithms for resource-constrained project scheduling problem. Appl. Soft. Comput. 2011, 11, 3720–3733. [Google Scholar]
- Zhang, C.; Ouyang, D.; Ning, J. An artificial bee colony approach for clustering. Expert Syst. Appl. 2010, 37, 4761–4767. [Google Scholar]
- Lacey, J.I. Somatic response pattering and stress: Some revisions of activation theory. In Psychological Stress: Issues in Research; Appley, M.H., Trumbull, R., Eds.; Appleton-Century-Crofts: New York, NY, USA, 1967. [Google Scholar]
- Lacey, B.C.; Lacey, J.I. Studies of heart rate and other bodily processes in sensorimotor behavior. In Cardiovascular Psychophysiology; Obrist, P.A., Black, A.H., Brener, J., DiCara, L.V., Eds.; Aldine: Chicago, IL, USA, 1974. [Google Scholar]
- Lacey, B.C.; Lacey, J.I. Cognitive modulation of time-dependent primary bradycardia. Psychophysiology 1980, 17, 209–221. [Google Scholar]
- Singh, R.R.; Banerjee, R. Multi-parametric analysis of sensory data collected from automotive drivers for building a safety-critical wearable computing system. Proceedings of the 2010 2nd International Conference on Computer Engineering and Technology (ICCET2010), Chengdu, China, 16–18 April 2010; pp. 355–360.


| Notation and variable | Meaning and explanation |
|---|---|
| si | The selection of the student 1 ≤ i ≤ N. |
| Pi | The matrix, the information of center position of the eyes' point of student i on the screen during a certain time. |
| pi,j,k | The element of matrix Pi, the position information k of center position of the eyes' point of student i on the screen at time point j. |
| Gi | The matrix, the information about the reading fixation of the student i on a screen during a certain time. |
| gi,j | The element of matrix Gi, the degree of the reading fixation of student i on the screen on a time point j. |
| ri | The reading fixation rate of student i. |
| μ | The strength of the relationship between the level of reading fixation and the concentration of the students. |
| Hi | The matrix, the heart rate of student i during a time. |
| hi,j | The element of matrix Hi, the heart rate of student i at a time point j. |
| ai | The average heart rate of student i. |
| Δbi | The variation of the heart rate of student i. |
| λ | The strength of the relationship between the heart rate and the concentration of the students. |
| Oi | The matrix, the blood oxygen for student i during a certain time. |
| oi,j | The element of matrix Oi, the blood oxygen for student i at a time point j. |
| Xi | The matrix, the transformed blood oxygen for the student i during a certain time. |
| xi,j | The element of matrix Xi, the transformed blood oxygen for student i at a time point j. |
| Δyi | The variation of blood oxygen for student i during a certain time. |
| π | The strength of the relationship between blood oxygen and the concentration of the students. |
| F(s) | The fitness function used for the reading concentration monitoring system. |
| Number of students | Random search method | ABC algorithm (number of bees/number of iterations) | |||
|---|---|---|---|---|---|
| 20/1,000 | 20/2,000 | 100/1,000 | 100/2,000 | ||
| 150 | 0.8905 | 0.0062 | 0.0060 | 0.0060 | 0.0060 |
| 300 | 0.8977 | 0.0327 | 0.0179 | 0.0098 | 0.0079 |
| 450 | 0.8880 | 0.0932 | 0.0343 | 0.0471 | 0.0208 |
| 600 | 0.9063 | 0.1573 | 0.0620 | 0.1137 | 0.0441 |
| 750 | 0.9021 | 0.2592 | 0.0853 | 0.2287 | 0.0499 |
| 900 | 0.8951 | 0.3243 | 0.0964 | 0.3168 | 0.0787 |
| 1,050 | 0.9177 | 0.4011 | 0.1307 | 0.3749 | 0.1068 |
| 1,200 | 0.9056 | 0.4533 | 0.1572 | 0.4216 | 0.1376 |
| 1,350 | 0.9240 | 0.4814 | 0.2051 | 0.4748 | 0.1940 |
| 1,500 | 0.9132 | 0.5239 | 0.2698 | 0.5152 | 0.2478 |
| Number of students | Random search method | ABC algorithm (number of bees/number of iterations) | |||
|---|---|---|---|---|---|
| 20/1,000 | 20/2,000 | 100/1,000 | 100/2,000 | ||
| 150 | 0.0782 | 0.2858 | 0.5515 | 1.4094 | 2.7547 |
| 300 | 0.1563 | 0.6217 | 1.1781 | 3.0375 | 5.8640 |
| 450 | 0.2343 | 0.9409 | 1.7969 | 4.6500 | 9.0484 |
| 600 | 0.3110 | 1.3546 | 2.5218 | 6.8343 | 12.4750 |
| 750 | 0.3890 | 1.8109 | 3.0844 | 9.1328 | 15.1594 |
| 900 | 0.4703 | 2.2734 | 3.7375 | 11.4654 | 18.5890 |
| 1,050 | 0.5437 | 2.7811 | 4.6000 | 13.9204 | 22.8953 |
| 1,200 | 0.6219 | 3.2548 | 5.4141 | 16.3031 | 27.1750 |
| 1,350 | 0.7000 | 3.7563 | 6.3578 | 18.7671 | 31.8344 |
| 1,500 | 0.7781 | 4.2156 | 7.2485 | 21.1874 | 36.4359 |
© 2012 by the authors; licensee MDPI, Basel, Switzerland. This article is an open access article distributed under the terms and conditions of the Creative Commons Attribution license (http://creativecommons.org/licenses/by/3.0/).
Share and Cite
Hsu, C.-C.; Chen, H.-C.; Su, Y.-N.; Huang, K.-K.; Huang, Y.-M. Developing a Reading Concentration Monitoring System by Applying an Artificial Bee Colony Algorithm to E-Books in an Intelligent Classroom. Sensors 2012, 12, 14158-14178. https://doi.org/10.3390/s121014158
Hsu C-C, Chen H-C, Su Y-N, Huang K-K, Huang Y-M. Developing a Reading Concentration Monitoring System by Applying an Artificial Bee Colony Algorithm to E-Books in an Intelligent Classroom. Sensors. 2012; 12(10):14158-14178. https://doi.org/10.3390/s121014158
Chicago/Turabian StyleHsu, Chia-Cheng, Hsin-Chin Chen, Yen-Ning Su, Kuo-Kuang Huang, and Yueh-Min Huang. 2012. "Developing a Reading Concentration Monitoring System by Applying an Artificial Bee Colony Algorithm to E-Books in an Intelligent Classroom" Sensors 12, no. 10: 14158-14178. https://doi.org/10.3390/s121014158