Theoretical Analysis of the Performance of Glucose Sensors with Layer-by-Layer Assembled Outer Membranes

Abstract
: The performance of implantable electrochemical glucose sensors is highly dependent on the flux-limiting (glucose, H2O2, O2) properties of their outer membranes. A careful understanding of the diffusion profiles of the participating species throughout the sensor architecture (enzyme and membrane layer) plays a crucial role in designing a robust sensor for both in vitro and in vivo operation. This paper reports the results from the mathematical modeling of Clark's first generation amperometric glucose sensor coated with layer-by-layer assembled outer membranes in order to obtain and compare the diffusion profiles of various participating species and their effect on sensor performance. Devices coated with highly glucose permeable (HAs/Fe3+) membranes were compared with devices coated with PSS/PDDA membranes, which have an order of magnitude lower permeability. The simulation showed that the low glucose permeable membrane (PSS/PDDA) sensors exhibited a 27% higher amperometric response than the high glucose permeable (HAs/Fe3+) sensors. Upon closer inspection of H2O2 diffusion profiles, this non-typical higher response from PSS/PDDA is not due to either a larger glucose flux or comparatively larger O2 concentrations within the sensor geometry, but rather is attributed to a 48% higher H2O2 concentration in the glucose oxidase enzyme layer of PSS/PDDA coated sensors as compared to HAs/Fe3+ coated ones. These simulated results corroborate our experimental findings reported previously. The high concentration of H2O2 in the PSS/PDDA coated sensors is due to the low permeability of H2O2 through the PSS/PDDA membrane, which also led to an undesired increase in sensor response time. Additionally, it was found that this phenomenon occurs for all enzyme thicknesses investigated (15, 20 and 25 nm), signifying the need for a holistic approach in designing outer membranes for amperometric biosensors.1. Introduction
The design and implementation of miniaturized implantable potentiometric or amperometric sensors for glucose monitoring has recently gained considerable attention in light of their ability to be integrated with integrated electronic circuits in the development of continuous glucose monitoring systems [1–6]. Among these, Clark's type amperometric sensors drew a lot of attention which is owed to their design simplicity and ease of fabrication. First generation Clark-based amperometric sensors employ a glucose oxidase (GOx) enzyme immobilized on top of the working electrode [7]. The flavin adenine dinucleotide (FAD) redox cofactor of GOx catalyzes the oxidation of glucose to glucarolactone, as shown in Equations (1) and (2):
The generated H2O2 is amperometrically assessed on the surface of working electrode by the application of the appropriate redox potential, hence relating the current to glucose concentration,
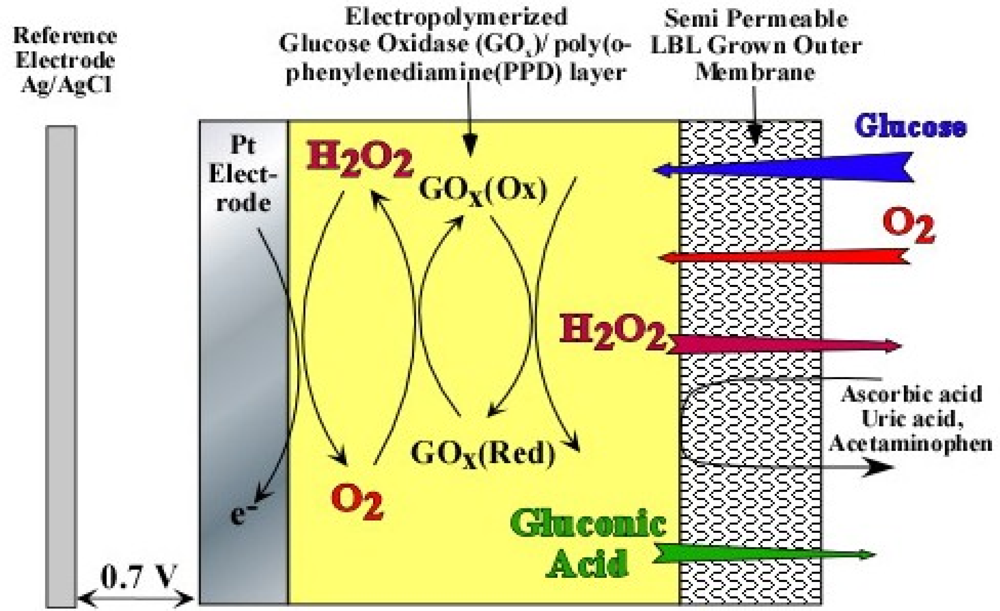
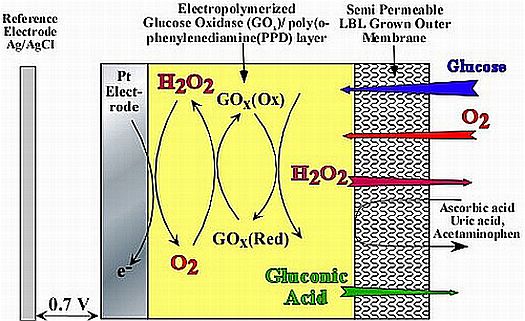
As evident from Equations (1) and (2), optimum sensor performance can only be obtained when the glucose to oxygen ratio is less than 1. If not, Equation (2) becomes oxygen limited, which is the case for most in vivo applications [8]. For example, in the subcutaneous tissue the O2 concentration is only 0.18 mM as compared to 5.6 mM of physiological glucose concentration (glucose/O2 ratio ≌ 30) 9], which leads to signal saturation at higher glucose concentrations. In order to mitigate signal saturation and render the sensor response linear, perm-selective membranes based on pore size has been employed, which decrease the glucose to O2 ratio in the vicinity of GOx (Figure 1). However, the use of outer membranes inadvertently decreases sensitivity and increases response time.
Second and third generation Clark-type biosensors employ redox mediators and direct ‘wiring’ of enzymes to electrodes in an attempt to minimize or completely eliminate the need for O2 [9]. However, the unwanted toxicity associated with the nanomaterials used in second and third generation Clark type glucose sensors stand against their application in implantable sensor configurations [9]. With this in mind, our group has been evaluating mediator-free, 1st generation Clark-type sensors that solely rely on careful mass transfer balance of the various species involved in the operation of these devices [10–13]. As part of this, using a series of layer-by-layer assembled glucose flux limiting membranes (namely humic acids/ferric cations (HAs/Fe3+) and poly(styrene sulfonate)/poly(diallyldimethylammonium chloride) (PSS/PDDA)), we have shown that the outer diffusion of H2O2 through these membranes plays a vital role in determining the sensitivity of the sensor. It was proven that sensors fabricated with highly glucose permeable HAs/Fe3+ membranes exhibited lower sensitivities and better linearities compared to sensors with less permeable PSS/PDDA membranes [10]. Through a series of analyte diffusion studies and oxygen dependence of these sensors [10], it was proven that this unique phenomenon did not occur as a result of the poor diffusion of oxygen through the outer membranes, but rather as a result of the outer diffusion of H2O2 through the various outer layers. In light of these findings, we have shown that optimal sensor performance could be easily achieved via a careful stratification of five functional layers, each of which is intended to carefully balance the mass transfer of various participating species involved [11]. This has also prompted us to theoretically understand the diffusion profiles of various participating species as they diffuse through the polymer and enzyme layers, which is a powerful tool useful in facilitating the development of future high performance first generation Clark-based amperometric implantable sensors.
Herein, we present our initial results from our theoretical analysis of glucose sensors employing the two aforementioned LBL membranes. A multi-layer analyte diffusion model based on Fick's second law was employed to analyze the diffusion profiles of the participating species (namely, glucose and H2O2). The computational model presented here utilizes well-developed enzyme-catalyzed reaction diffusion equations, which were applied to glucose and H2O2, to model the reaction of glucose with glucose oxidase. This along with Fick's second law of diffusion, which represents the diffusive transport of glucose and the enzyme-generated H2O2 throughout the LBL assembled outer membranes, gives a full dynamic representation of the sensor-system under study. The explicit finite difference scheme was coded in MATLAB to solve the diffusion-based partial differential equations in order to obtain concentration profiles of glucose and H2O2 as a function of LBL thickness and enzyme thickness. In doing this, we were able to precisely analyze the role of H2O2 in sensor operation and its effect on the amperometric response. In accordance with our previously reported experimental studies [10], sensors coated with the less glucose permeable PSS/PDDA membrane showed a pronounced build-up of H2O2 compared to that of sensors coated with the more permeable HAs/Fe3+ membrane. It was also found that this phenomenon appears for increasing enzyme thicknesses, further confirming the previous experimental studies. Furthermore, amperometric response times were found to increase with increasing enzyme thickness, due to the time necessary for the participating species to establish equilibrium within the enzyme layer.
2. The Theoretical Model
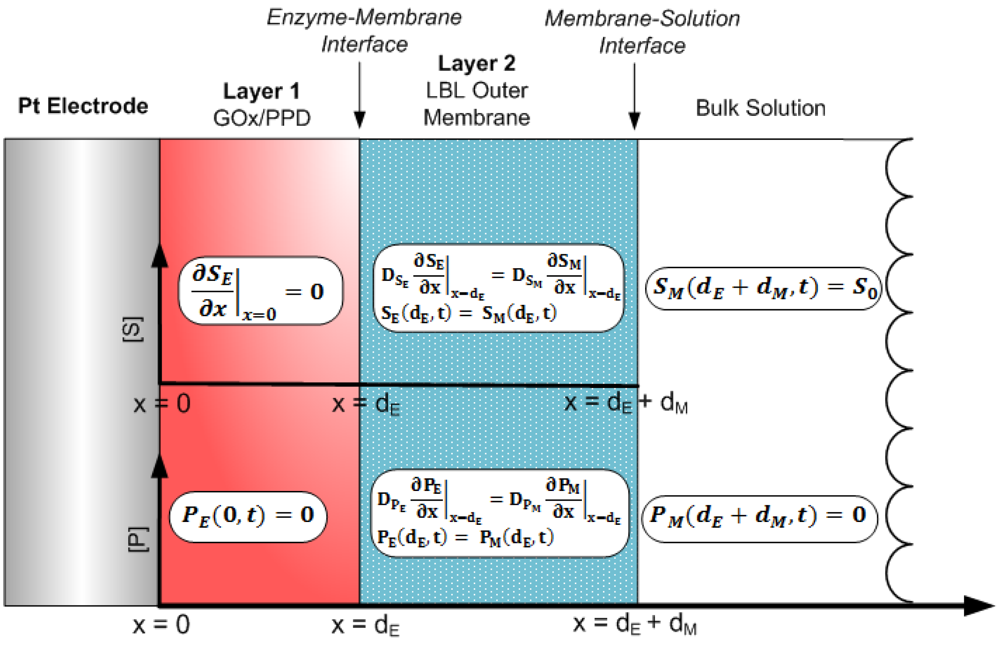
Figure 1 shows the cross-section of the sensor under study. The platinum electrode is covered with an electropolymerized GOx/poly(o-phenylenediamine) (PPD) layer followed by a layer-by-layer assembled outer membrane based on HAs/Fe3+ (Device A) and PSS/PDDA (Device B). As can be seen in Figure 1, the incorporation of GOx into the electropolymerized poly(o-phenylenediamine) (PPD) has been previously shown to block the oxidation of other endogenous species like uric acid, ascorbic acid and acetaminophen, which are highly likely to oxidize at the operating potential of the sensor [14–16]. The dynamic operation of this multi-layer sensor can be accurately modeled by one-substrate Michaelis-Menten enzyme kinetics [17–21]. First, consider the enzyme-catalyzed reaction where the substrate, SE, is irreversibly converted to a product, PE:
Here, the substrate, SE, is the glucose present in the enzyme layer, the product, PE, is the hydrogen peroxide (H2O2) in the enzyme layer generated per Equation (2), and k1, k−1 and k2 are the rate constants. The rate at which the product is formed, V, can be expressed as:
Applying the quasi steady-state assumption on the rate of variation of the [ESE] complex [17] leads to the following equation:
where KM is the Michaelis-Menten constant and VM is the maximum enzymatic rate when the enzyme is fully saturated. We can integrate this rate equation to the well-known diffusion equation to obtain expressions for the effect of enzyme-catalyzed reactions on both glucose and H2O2 as they diffuse through the GOx/PPD layer (layer 1). Here we can safely assume that the GOx is uniformly distributed throughout the layer [22], which is a self-limiting electropolymerization process that yields a thickness comparable to the size of the immobilized enzyme [23]. Additionally, we assume that oxygen is present in sufficient amounts to drive the enzematic reaction to completion. The results in two reaction-diffusion equations (Equations (7) and (8)):
The operation of the system initiates immediately after the substrate in the bulk solution reaches the surface of the outer membrane (layer 2), which we define as the following initial conditions:
Here, we introduce SM (x, t) and PM (x, t) which are the concentrations of glucose and H2O2, respectively, in the outer LBL membrane, where x = dM represents the surface of the outer membrane. The assumptions made are the following: (1) the substrate does not react at the electrode surface, (2) the H2O2 at the electrode surface gets permanently reduced to zero, (3) if the substrate is well stirred, then the diffusion layer (0 < x < dE +dM) remains at a constant thickness, dE + dM, during sensor operation and (4) the concentration of H2O2 at the sensor/bulk solution interface is zero. This can be quantitatively described as the following boundary conditions:
The aforementioned initial conditions and boundary conditions have been previously employed to model various amperometric and potentiometric biosensors, with various physical parameters and testing conditions [18–21,24–31]. At the boundary between the enzyme layer and the flux-limiting membrane, matching conditions are defined (for t > 0) [32]:
Following H2O2 oxidation at the Pt surface, the amperometric current response of the device is expressed as:
2.2. The Solution Scheme
The cross-sectional schematic of Figure 2 was modeled by constructing a mesh employing a finite set of x and t, and utilizing the boundary conditions of Equations (11) to (15) as a means to obtain a solution to the tridiagonal system. Based on this, the explicit finite difference scheme was used to obtain substrate and product concentrations of the Michaelis-Menten reaction-based differential Equations (7) and (8), as:
Glucose (S)
Glucose (S)
Glucose (S)
Numerical parameters for the enzymatic layer, such as diffusion coefficients, Michaelis-Menten constant, maximum rate of velocity and thickness have been obtained from earlier reports [22,33]. A keen understanding of the kinetics of H2O2 diffusion though this multi-layer model has been simulated and analyzed by studying the effect of enzyme thickness (15, 20 and 25 nm GOx/PPD) as a function of these two LBL outer membranes. A summation of variables employed in the model can be seen in Table 1.
The physical parameters for the enzyme layer, as well the parameters of the two outer membranes are summarized in Table 2.
3. Results
It is well believed that the amperometric response of first generation Clark's glucose sensors is directly proportional to the glucose permeability through the outer membranes assuming that O2 is not the limiting factor for the GOx reaction (Equation (2)). Having said this, in order to keep the glucose-to-oxygen ratio less than 1, a variety of outer membranes with less and less glucose permeability have been reported [8,9], albeit without a mechanistic understanding of the diffusion profiles of other participating species such as H2O2. Layer-by-layer assembled outer membranes afford such studies in that the thickness as well as analyte permeability can be precisely controlled via the number of bilayers within the membrane. Utilizing a series of such LBL assembled membranes (namely a more glucose permeable HAs/Fe3+ and less glucose permeable PSS/PDDA membrane), we have previously deduced that the amperometric response of a sensor is also dependent on the outward diffusion of H2O2. Intuitively, the more glucose-permeable HAs/Fe3+ outer membrane is expected to yield a higher response; yet the outwards diffusion of H2O2 through these membranes is also significant thereby contributing to a lowering of the amperometric response. In addition, through a series of oxygen dependence studies it was concluded that any potential role of lower oxygen levels within HAs/Fe3+ membranes in lowering the amperometric response of HAs/Fe3+ device has been excluded.
In this contribution, we report a simulation on the concentration profiles of both glucose and H2O2 throughout the multi-layer system in an attempt to quantify their peak concentrations within the interior of the sensor and to re-assert our earlier finding that H2O2 is a key contributor in advanced implantable sensor design. Here, it is worth noting that the theory and mathematical analysis of enzyme-catalyzed reactions used in this model are widely-accepted, and thus have been previously applied to similar glucose oxidase systems along with a wide-range of other enzymatic processes. More importantly, based on our earlier experimental studies on oxygen dependence of implantable glucose sensors, we have in this study assumed that O2 is present in sufficient amounts (for Equation (2) to go to completion) and that there is no variation in oxygen levels during sensor operation. Moreover, any effect of oxygen within the electropolymerized PPD/GOx layer can be considered negligible based on the fact that the pore size of PPD is enough to let H2O2 pass through, which is a bigger molecule than O2. In fact, it has been reported that sensors having PPD/GOx structures are minimally affected by oxygen [34], reinforcing our O2-independnce assumption. Having said this, it should be clear that the assumption of abundant O2 levels within the sensor is an approximation, and has been used in order to solely analyze the role of H2O2 in these devices.
Based on that, we have utilized a one-substrate Michaelis-Menten model [18] in conjunction with diffusion kinetics through the LBL assembled outer membranes to get a holistic representation of sensor performance for the comparison of both devices.
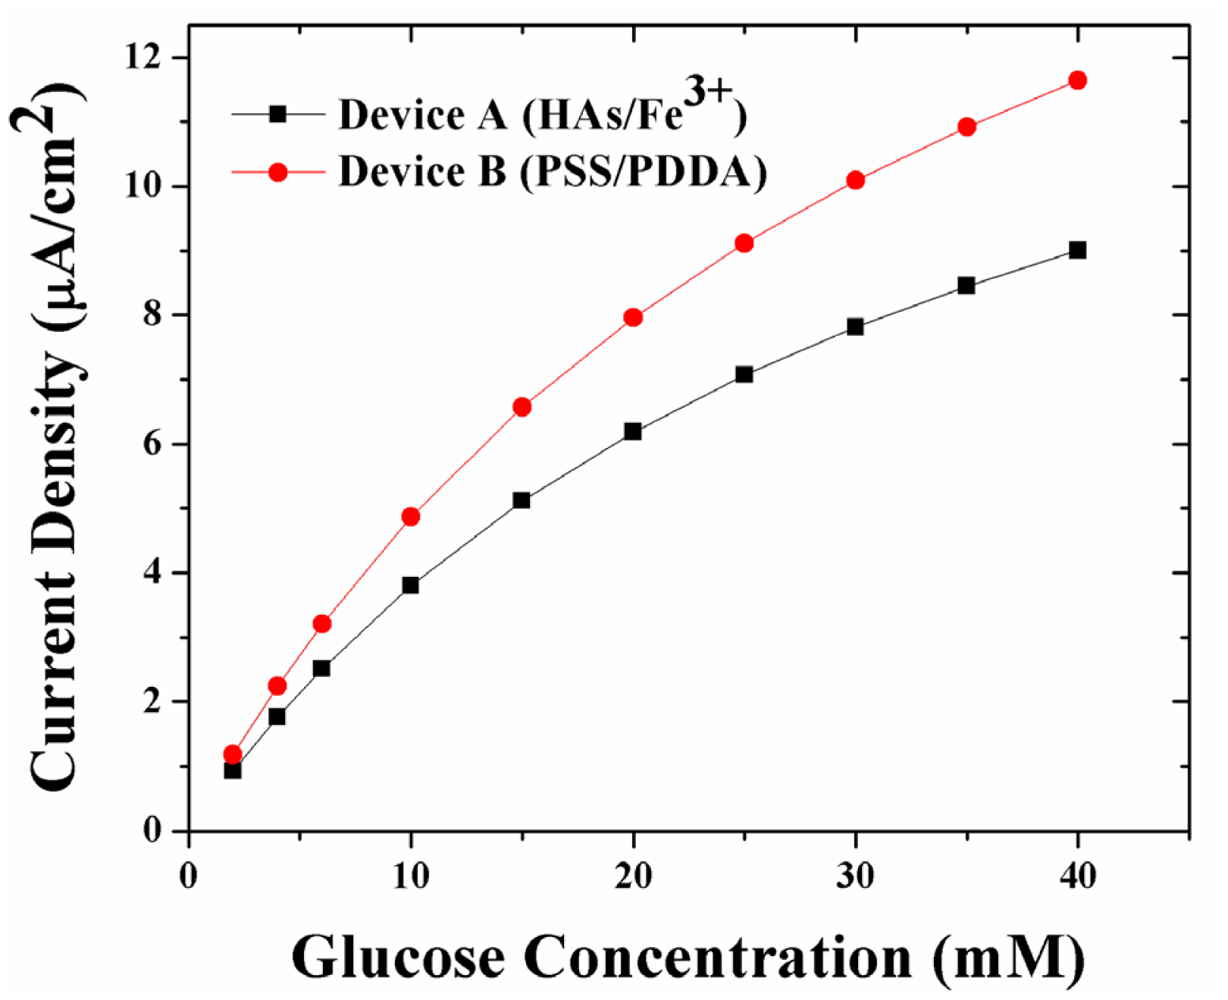
Figure 3 shows the simulated amperometric response of sensors coated with the two LBL systems. For any glucose concentration, and in particular at higher glucose concentrations, the amperometric response of Device B (with PSS/PDDA membranes) is 27% higher than that of Device A (HAs/Fe3+ membranes). This trend in amperometric response is opposite to the trends observed in glucose permeability through the LBL membranes (which is highest through the HAs/Fe3+, Device A, and least through the PSS/PDDA, Device B, membranes), wherein the amperometric response from Device A is 27–30% lower than Device B. Here, it is worth noting that the trend in simulated amperometric responses is similar to that of experimental data reported earlier [10]. Taking into account the low oxygen permeability of PSS/PDDA membranes compared to HAs/Fe3+ membranes, it was concluded that the observed higher amperometric response from Device B (PSS/PDDA) is due to a higher build-up of H2O2 within its sensor geometry. The higher build-up of H2O2 is in turn attributed to its low permeability through the PSS/PDDA membrane compared to the HAs/Fe3+ membrane. In order to further elucidate this, a theoretical understanding of the concentration profiles of glucose and H2O2 as a function of various LBL membranes has been performed.
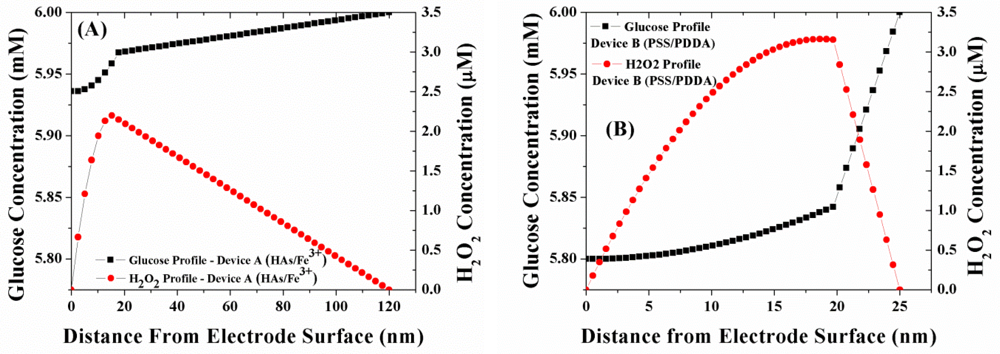
Figure 4(A,B) illustrates the simulated concentration profile of glucose and H2O2 within a sensor geometry coated with either of the two LBL membranes namely (HAs/Fe3+ and PSS/PDDA) at normal physiological glucose concentrations (6 mM glucose). The GOx enzyme for both devices is immobilized within a 20 mM poly(phenylenediamine) (PPD) layer and is assumed to be uniformly distributed within the PPD layer [22]. Employing the outer membrane thickness values of Table 1, the bulk solution of Device A is present at 120 nm from the electrode surface, while the bulk solution is present at 25 nm from the electrode surface for Device B. As illustrated in Figure 4(A,B), the glucose flux within the GOx layer for Device B (PSS/PDDA) lower than that in Device A (HAs/Fe3+), which is in agreement with the trends in glucose permeability through these membranes [12]. Based on the observed lower glucose flux within Device B, one would expect it to have a lower concentration of H2O2 generated compared to Device A. However, as seen in Figure 4, the concentration of H2O2 within Device B is 48% higher than that of Device A. Considering the facts that the rate of oxidation of H2O2 at the Pt electrode is the same for all the electrodes and that the oxygen permeability through the three membranes follows the same trend as glucose [10], the higher concentration of H2O2 within Device B can easily be attributed to the poor outwards diffusion of H2O2 through the PSS/PDDA membrane compared to the HAs/Fe3+ membrane. This larger build-up of H2O2 within Device B in turn leads to its higher amperometric response (27–30%) as illustrated in Figure 3.
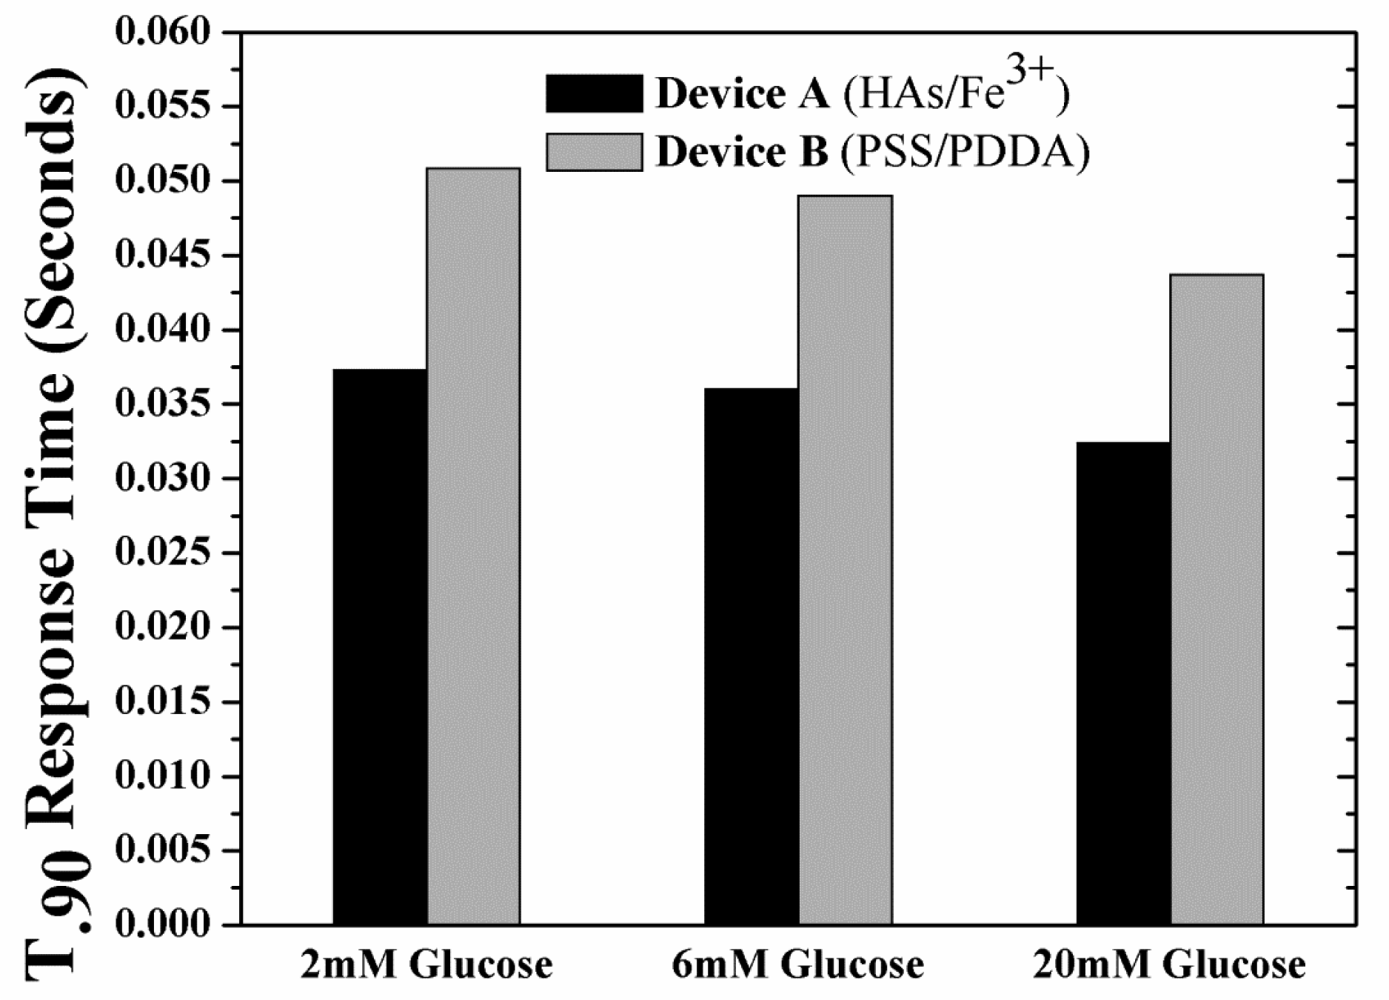
The unwanted build-up of H2O2 within Device B is also expected to increase the sensor response time considering the longer times needed to establish equilibrium. This increase in response times adds to the already longer response times resulting from the use of tighter (less glucose permeable membranes). With this in mind, the response times (t90%; time taken to reach 90% of the saturation current value as obtained from the simulated sensor transient response, Figure S3 of Supplementary Information) of the devices have been investigated as a function of glucose concentration and type of outer LBL membrane. Figure 5 shows the t90% response times for the two devices under hypoglycemia (2 mM glucose), normal physiological glucose concentrations (6 mM glucose) and hyperglycemia (20 mM glucose). For both devices at any glucose concentration, the response time of Device A was ca. 35% less than that of Device B, as expected.
Overall the results of Figures 4 and 5 indicate one has to utilize a tighter PSS/PDDA membrane for higher sensitivities (e.g., for glutamate detection which are in the sub-μM levels [35]) even though it can lead to longer response times (due to build-up of H2O2) necessitating a means to remove H2O2 buildup within the sensor. This can be achieved by methods including: (i) increasing the catalytic activity of the Pt working electrode [22] (ii) introducing an additional H2O2-consuming layer (e.g., Catalase enzyme) [11], and (ii) grading the GOx concentrations in the PPD membrane. Such schemes retain the outer boundary conditions of the currently utilized model (Figure 2), however the inner boundary conditions must be modified in order to include the associated diffusion and reaction-diffusion equations.
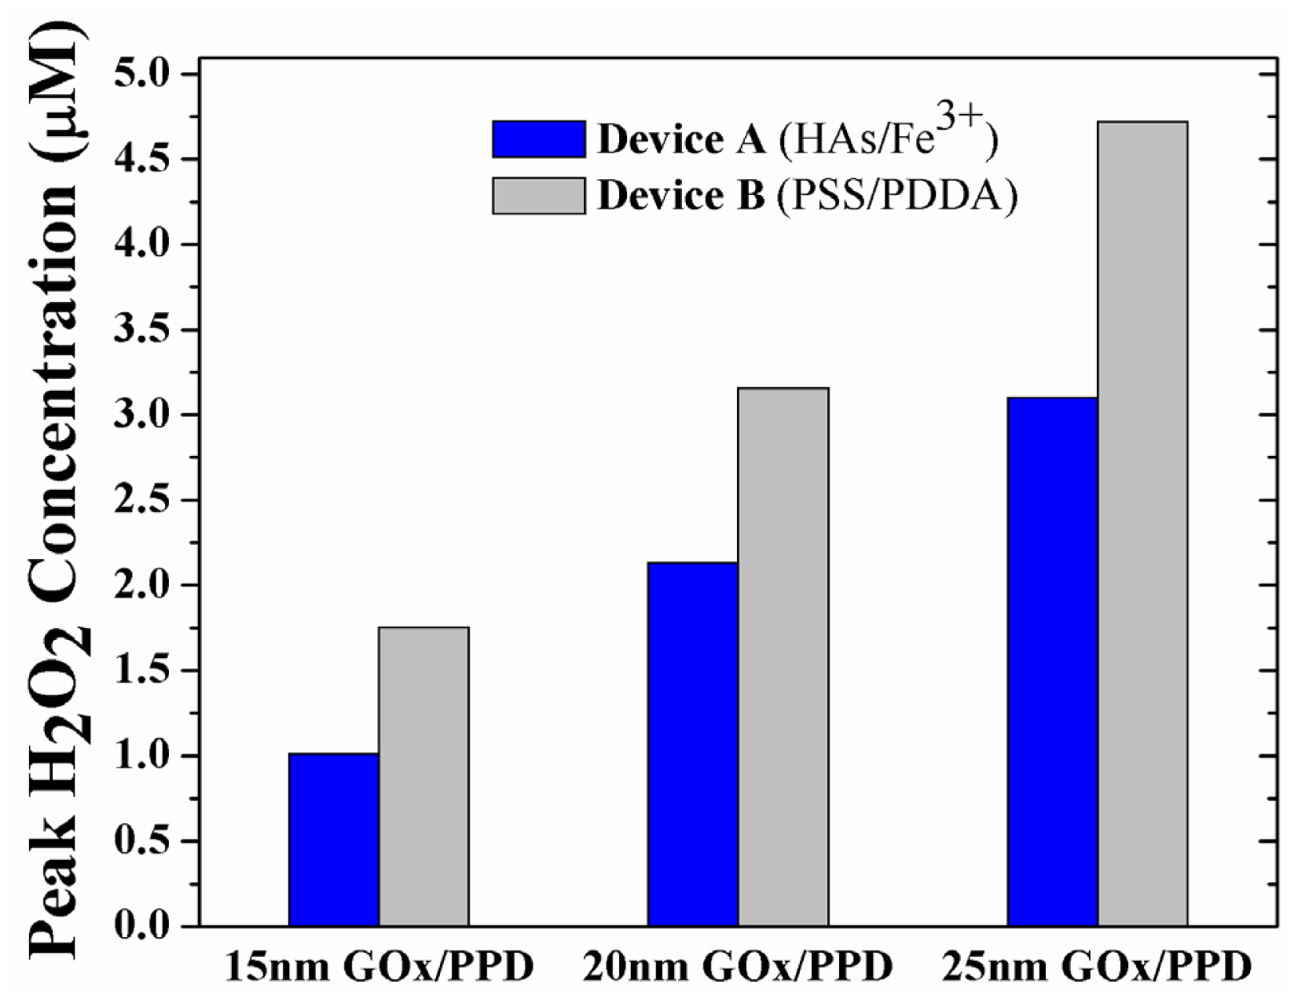
Having established the importance of outwards diffusion of H2O2 on sensor performance, the enzyme layer thickness was additionally simulated at 15 nm and 25 nm, in an effort to determine if the observed phenomenon is enzyme-thickness dependent. Figure 6 shows the peak H2O2 concentration in the GOx/PPD layer of Device A and B at 15 nm (Figure S1 of Supplementary Information), 20 nm (Figure 4) and 25 nm (Figure S2 of Supplementary Information) thick enzyme layers. Intuitively, it is seen that there is increase in peak H2O2 concentration at increasing enzyme thicknesses, due to the increase in GOx-induced H2O2 turnover. Moreover, for any enzyme thickness, the H2O2 concentration for Device B is ca. 50–70% larger than Device A due to the pronounced buildup of H2O2 in the enzyme layer.
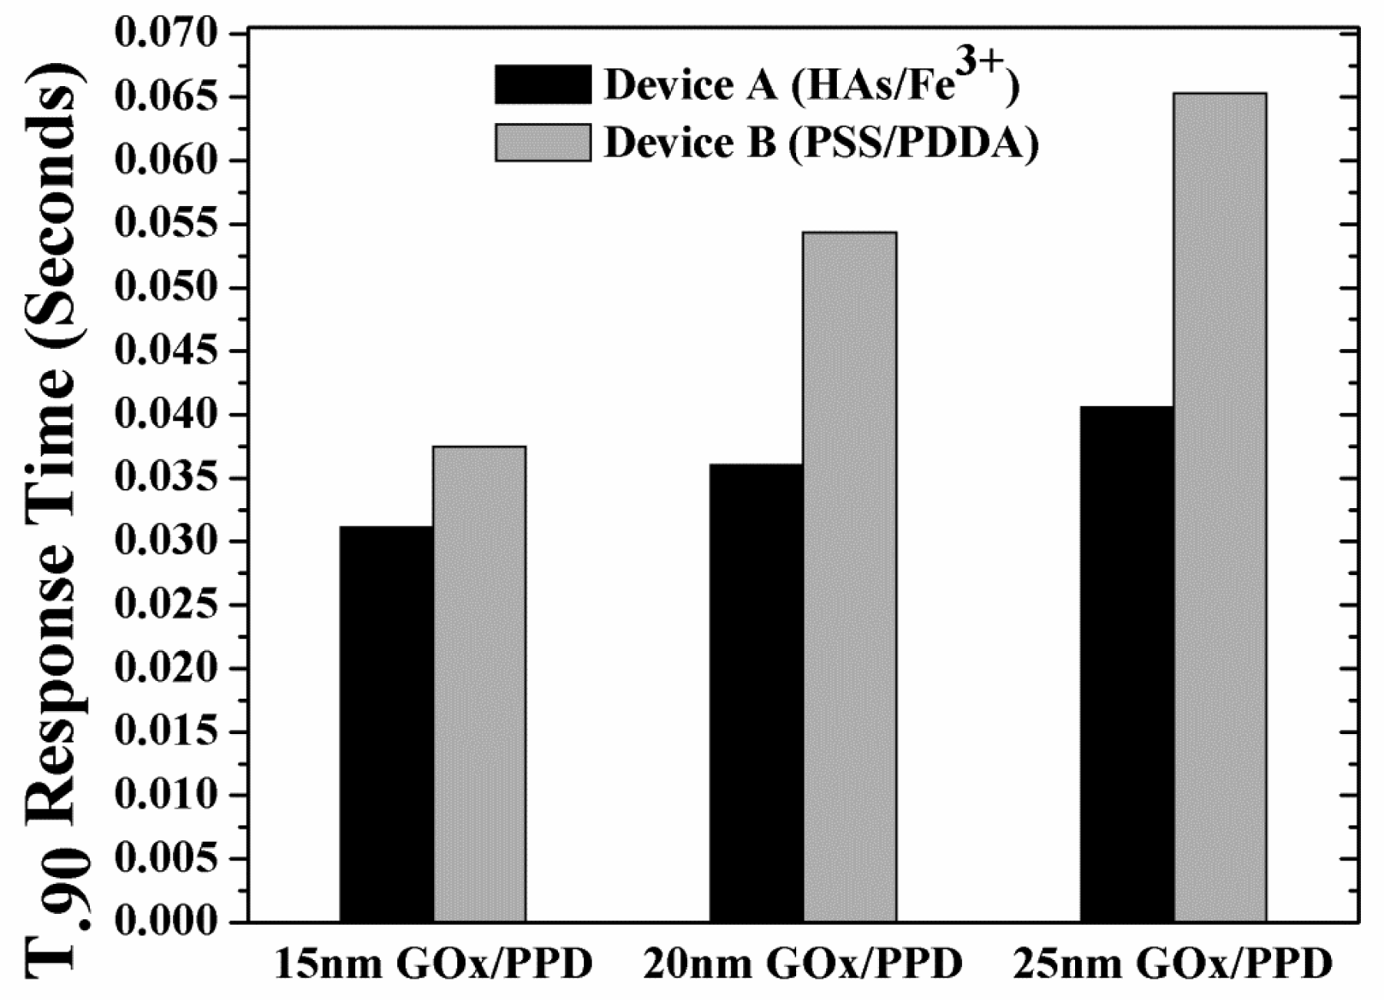
Following the analysis of peak H2O2 concentration as a function of varying GOx/PPD thickness, the t90% response times of these thicknesses was investigated. Figure 7 shows the response times of the devices as a function of enzyme thickness. As expected, for any enzyme thickness, the response times of Devices B is higher than that of Devices A, due to the higher build-up of H2O2 (shown in Figure 6).
4. Conclusions
In this contribution, a multi-layered computational model has been utilized to compare the performance of an enzymatic glucose sensor coated with two kinds of LBL assembled outer membranes, namely humic acids/ferric cations and poly(styrene sulfonate)/poly(diallyldimethylammonium chloride) outer membranes. The diffusion profiles of glucose (S) and H2O2 (P) have been computed under specified boundary conditions for sensors coated with high glucose permeable (HAs/Fe3) and low glucose permeable (PSS/PDDA) membranes. Sensors coated with PSS/PDDA membranes, although have low inwards flux, have displayed high sensitivity due to low outwards diffusion of H2O2 in all simulated enzyme thicknesses. This trend in simulation corroborates our previous experimental finding of the role H2O2 on sensor sensitivity [10] and re-signifying the need for outer membrane optimization not only in terms of glucose diffusion, but also for H2O2 diffusion. Moreover, it is also found that this low outer diffusion of H2O2 through the less glucose permeable PSS/PDDA membranes leads to longer response times thereby alluding to the necessity for a means to remove H2O2 buildup within an outer membrane-coated biosensor. Currently, we are investigating the efficacy of this model in a variety of physiological environments as well as understanding the need for gradients, if any. Additionally, even though H2O2 serves as the key contributor to the dynamics of these devices, the role of H2O2 in an environment of varying oxygen levels is currently under investigation, and will be the topic of future publications.
The study presented here, even though only two LBL membranes were compared, could be extended to other designs that utilize a different outer membrane or to designs that employ a series of stratified membranes and could be used a guide for optimization of outer layers.
Supplementary Material
sensors-12-13402-s001.pdfAcknowledgments
Financial support for this study was obtained from US Army Medical Research Grants (W81XWH-09-1-0711 and W81XWH-07-10688), NIH grants (1-R21-HL090458-01, ES013557, R43EB011886 and 9R01EB014586) and NSF/SBIR grants (1046902 and 1230148). The authors would also like to thank Dr. Evan Heller for technical assistance and discussions.
References
- Valdastri, P.; Menciassi, A.; Arena, A.; Caccamo, C.; Dario, P. An Implantable Telemetry Platform System for In Vivo Monitoring of Physiological Parameters. IEEE Trans. Inform. Technol. Biomed. 2004, 8, 271–278. [Google Scholar]
- Valdastri, P.; Rossi, S.; Menciassi, A.; Lionetti, V.; Bernini, F.; Recchia, F.A.; Dario, P. An Implantable ZigBee Ready Telemetric Platform for In Vivo Monitoring of Physiological Parameters. Proceedings of the 20th European Conference on Solid-State Transducers, Dresden, Germany, 7– 10 September 2008; pp. 369–378.
- Valdastri, P.; Susilo, E.; Förster, T.; Strohhöfer, C.; Menciassia, A.; Dario, P. Wireless Implantable Electronic Platform for Blood Glucose Level Monitoring. Proceedings of the Eurosensors XXIII Conference, Lausanne, Switzerland, 6–9 September 2009; pp. 1255–1258.
- Ahmadi, M.M.; Jullien, G.A. A Wireless-Implantable Microsystem for Continuous Blood Glucose Monitoring. IEEE Trans. Biomed. Circ. Syst. 2009, 3, 169–180. [Google Scholar]
- Serra, P.A.; Rocchitta, G.; Bazzu, G.; Manca, A.; Puggioni, G.M.; Lowry, J.P.; O'Neill, R.D. Design and Construction of a Low Cost Single-Supply Embedded Telemetry System for Amperometric Biosensor Applications. Sens. Actuat. B Chem. 2007, 122, 118–126. [Google Scholar]
- Bolomey, L.; Meurville, E.; Ryser, P. Implantable Ultra-Low Power DSP-Based System for a Miniature Chemico-Rheological Biosensor. Proceedings of the Eurosensors XXIII Conference, Lausanne, Switzerland, 6–9 September 2009; pp. 1235–1238.
- Wilson, G.S.; Gifford, R. Biosensors for Real-Time In Vivo Measurements. Biosens. Bioelectr. 2005, 20, 2388–2403. [Google Scholar]
- Vaddiraju, S.; Burgess, D.J.; Tomazos, I.; Jain, F.C.; Papadimitrakopoulos, F. Technologies for Continuous Glucose Monitoring: Current Problems and Future Promises. J. Diabetes Sci. Technol. 2010, 4, 1540–1562. [Google Scholar]
- Vaddiraju, S.; Tomazos, I.; Burgess, D.J.; Jain, F.C.; Papadimitrakopoulos, F. Emerging Synergy between Nanotechnology and Implantable Biosensors: A Review. Biosens. Bioelectr. 2010, 25, 1553–1565. [Google Scholar]
- Vaddiraju, S.; Burgess, D.J.; Jain, F.C.; Papadimitrakopoulos, F. The Role of H2O2 Outer Diffusion on the Performance of Implantable Glucose Sensors. Biosens. Bioelectr. 2009, 24, 1557–1562. [Google Scholar]
- Vaddiraju, S.; Legassey, A.; Wang, Y.; Qiang, L.; Burgess, D.J.; Jain, F.C.; Papadimitrakopoulos, F. Design and Fabrication of a High-Performance Electrochemical Glucose Sensor. J. Diabetes Sci. Technol. 2011, 5, 1044–1051. [Google Scholar]
- Tipnis, R.; Vaddiraju, S.; Jain, F.C.; Burgess, D.J.; Papadimitrakopoulos, F. Layer-by-Layer Assembled Semipermeable Membrane for Amperometric Glucose Sensors. J. Diabetes Sci. Technol. 2007, 1, 193–200. [Google Scholar]
- Vaddiraju, S.H.; Burgess, D.J.; Jain, F.C.; Papadimitrakopoulos, F. Enhanced Glucose Sensor Linearity Using Poly(vinyl Alcohol) Hydrogels. J. Diabetes Sci. Technol. 2009, 863–874. [Google Scholar]
- McMahon, C.P.; Killoran, S.J.; Kirwan, S.M.; O'Neill, R.D. The Selectivity of Electrosynthesised Polymer Membranes Depends on the Electrode Dimensions: Implications for Biosensor Applications. Chem. Commun. 2004, 21, 2128–2130. [Google Scholar]
- Moussy, F.; Harrison, D.J.; O'Brien, D.W.; Rajotte, R.V. Performance of Subcutaneously Implanted Needle-Type Glucose Sensors Employing a Novel Trilayer Coating. Anal. Chem. 1993, 65, 2072–2077. [Google Scholar]
- Kirwan, S.; Rocchitta, G.; McMahon, C.; Craig, J.; Killoran, S.; O'Brien, K.; Serra, P.; Lowry, J.; O'Neill, R. Modifications of Poly(o-phenylenediamine) Permselective Layer on Pt-Ir for Biosensor Application in Neurochemical Monitoring. Sensors 2007, 7, 420–437. [Google Scholar]
- Shuler, M.L.; Kargi, F. Bioprocess Engineering: Basic Concepts; Prentice Hall: Upper Saddle River, NJ, USA, 2002. [Google Scholar]
- Baronas, R.; Ivanauskas, F.; Kulys, J. Mathematical Modeling of Biosensors: An Introduction for Chemists and Mathematicians; Springer: New York, NY, USA, 2009. [Google Scholar]
- Baronas, R.; Ivanauskas, F.; Kulys, J. Computational Modelling of Amperometric Enzyme Electrodes with Selective and Perforated Membranes. AIP Conf. Proc. 2007, 963, 457–460. [Google Scholar]
- Baronas, R.; Ivanauskas, F.; Kulys, J. The Influence of the Enzyme Membrane Thickness on the Response of Amperometric Biosensors. Sensors 2003, 3, 248–262. [Google Scholar]
- Baronas, R.; Ivanauskas, F.; Kulys, J. Computational Modelling of the Behaviour of Potentiometric Membrane Biosensors. J. Math. Chem. 2007, 42, 321–336. [Google Scholar]
- Reyes De Corcuera, J.I.; Cavalieri, R.P.; Powers, J.R. Improved Platinization Conditions Produce a 60-Fold Increase in Sensitivity of Amperometric Biosensors Using Glucose Oxidase Immobilized in Poly-o-phenylenediamine. J. Electroanal. Chem. 2005, 575, 229–241. [Google Scholar]
- Chen, X.; Matsumoto, N.; Hu, Y.; Wilson, G.S. Electrochemically Mediated Electrodeposition/Electropolymerization to Yield a Glucose Microbiosensor with Improved Characteristics. Anal. Chem. 2002, 74, 368–372. [Google Scholar]
- Ivanauskas, F.; Baronas, R. Numerical Simulation of a Plate-Gap Biosensor with an Outer Porous Membrane. Simul. Modell. Pract. Theory 2008, 16, 962–970. [Google Scholar]
- Meena, A.; Rajendran, L. Mathematical Modeling of Amperometric and Potentiometric Biosensors and System of Non-Linear Equations—Homotopy perturbation approach. J. Electroanal. Chem. 2010, 644, 50–59. [Google Scholar]
- Kulys, J.; Baronas, R. Modelling of Amperometric Biosensors in the Case of Substrate Inhibition. Sensors 2006, 6, 1513–1522. [Google Scholar]
- Patre, B.M.S.V.G. Mathematical Model of an Amperometric Biosensor for the Design of an Appropriate Instrumentation System. J. Med. Eng. Technol. 2007, 31, 351–360. [Google Scholar]
- Cambiaso, A.; Delfino, L.; Grattarola, M.; Verreschia, G.; Ashworth, D.; Maines, A.; Vadgama, P. Modelling and Simulation of a Diffusion Limited Glucose Biosensor. Sens. Actuat. B Chem. 1996, 33, 203–207. [Google Scholar]
- Gaidamauskait, E.; Baronas, R. A Comparison of Finite Difference Schemes for Computational Modelling of Biosensors. Nonlin. Anal. Model. Control 2007, 12, 359–369. [Google Scholar]
- Bacha, S.; Bergel, A.; Comtat, M. Transient Response of Multilayer Electroenzymic Biosensors. Anal. Chem. 1995, 67, 1669–1678. [Google Scholar]
- Baronas, R.; Ivanauskas, E.; Kulys, J. Computer Simulation of the Response of Amperometric Biosensors in Stirred and Non Stirred Solution. Nonlin. Anal. Model. Control 2003, 8, 3–18. [Google Scholar]
- Hickson, R.I.; Barry, S.I.; Mercera, G.N.; Sidhu, H.S. Finite Difference Schemes for Multilayer Diffusion. Math. Comput. Modell. 2011, 54, 210–220. [Google Scholar]
- Gros, P.; Bergel, A. Improved Model of a Polypyrrole Glucose Oxidase Modified Electrode. J. Electroanal. Chem. 1995, 386, 65–73. [Google Scholar]
- Lowry, J.P.; McAteer, K.; Atrash, S.S.E.; O'Neill, R.D. Efficient Glucose Detection in Anaerobic Solutions Using an Enzyme-Modified Electrode Designed to Detect H2O2: Implications for Biomedical Applications. J. Chem. Soc. Chem. Commun. 1994. [Google Scholar] [CrossRef]
- McMahon, C.P.; Rocchitta, G.; Serra, P.A.; Kirwan, S.M.; Lowry, J.P.; O'Neill, R.D. Control of the Oxygen Dependence of an Implantable Polymer/Enzyme Composite Biosensor for Glutamate. Anal. Chem. 2006, 78, 2352–2359. [Google Scholar]


| Declaration of Variables | |||
|---|---|---|---|
| SE | Concentration of glucose in the GOx/PPD layer | DSM | Diffusion coefficient of glucose in the various LBL outer membranes |
| PE | Concentration of H2O2 in the GOx/PPD layer | DPM | Diffusion coefficient of H2O2 in the various outer membranes |
| SM | Concentration of glucose in the various LBL outer membranes | VMAX | Maximum enzymatic rate of reaction |
| PM | Concentration of H2O2 in the various outer membranes | KM | Michaelis-Menten constant |
| dE | Thickness of the GOx/PPD layer | I | Response current |
| dM | Thickness of the various LBL outer membranes | ne | Number of electrons (2 for H2O2) |
| DSE | Diffusion coefficient of glucose in the GOx/PPD layer | F | Faraday's Constant (96,500 C/mol) |
| DPE | Diffusion coefficient of H2O2 in the GOx/PPD layer | ||
| Layer | |||
|---|---|---|---|
| Parameter | GOx/PPD | HAs/Fe3+ | PSS/PDDA |
| DGlucose (cm2/sec) | 4 × 10⁻¹⁰ [22,33] | 4.4 × 10⁻⁹ [10] | 0.058 × 10⁻⁹ [10] |
| DH2O2 (cm2/sec) | 5 × 10⁻⁹ [22,33] | 4.8 × 10⁻⁹ [10] | 0.1 × 10⁻⁹ [10] |
| Thickness (nm) | 15, 20 and 25 [33] | 100 [10,12] | 5 [10,12] |
| KM (mol/cm3) | 33 × 10−6 [22,33] | n/a | n/a |
| VMax (mol/cm2sec) | 60 × 10−6 [22,33] | n/a | n/a |
© 2012 by the authors; licensee MDPI, Basel, Switzerland. This article is an open access article distributed under the terms and conditions of the Creative Commons Attribution license (http://creativecommons.org/licenses/by/3.0/).
Share and Cite
Croce, R.A., Jr.; Vaddiraju, S.; Papadimitrakopoulos, F.; Jain, F.C. Theoretical Analysis of the Performance of Glucose Sensors with Layer-by-Layer Assembled Outer Membranes. Sensors 2012, 12, 13402-13416. https://doi.org/10.3390/s121013402
Croce RA Jr., Vaddiraju S, Papadimitrakopoulos F, Jain FC. Theoretical Analysis of the Performance of Glucose Sensors with Layer-by-Layer Assembled Outer Membranes. Sensors. 2012; 12(10):13402-13416. https://doi.org/10.3390/s121013402
Chicago/Turabian StyleCroce, Robert A., Jr., Santhisagar Vaddiraju, Fotios Papadimitrakopoulos, and Faquir C. Jain. 2012. "Theoretical Analysis of the Performance of Glucose Sensors with Layer-by-Layer Assembled Outer Membranes" Sensors 12, no. 10: 13402-13416. https://doi.org/10.3390/s121013402