Abstract
While multifaceted, a chief aim when designating parks and protected areas is to support the preservation of biological diversity, in part, through representing and conserving the full range of landscape conditions observed throughout a representative area. Parks and protected areas are, however, typically developed using a static interpretation of current biodiversity and landscape conditions. The observed and potential climate change impacts to biodiversity have created a need to also contemplate how parks and protected areas will respond to climate change and how these areas will represent the future range of landscape conditions. To assess change in biodiversity, broad-scale ecosystem information can be sourced from indirect remotely sensed indicators. Quantifying biodiversity through indirect indicators allows characterization of inter-relationships between climate and biodiversity. Such characterizations support the assessment of possible implications of climatic change, as the indicators can be generated using modeled forecasts of future climatic conditions. In this paper we model and map impacts of climate change on British Columbia’s parks and protected areas by quantifying change in a number of remotely sensed indicators of biodiversity. These indicators are based on the measured amount of incoming solar energy used by vegetation and map the overall annual energy utilization, variability (seasonality), and latent or baseline energy. We compare current conditions represented by parks and protected areas, to those forecasted in the year 2065. Our results indicate that parks and protected areas are forecasted to become more productive and less seasonal, due to increased vegetation productivity in higher elevation environments. While increased vegetation productivity may be beneficial for biodiversity overall, these changes will be particularly problematic for sensitive and specialist species. Future gaps in vegetation conditions protected by parks and protected areas are observed in the eastern edge of the Rocky Mountains and the central interior region of British Columbia. Protected areas along the Coast Mountains, Vancouver Island highlands, and the Rocky Mountains show the greatest levels of change in the biodiversity indicators, including decreasing seasonality, with the Mountain Hemlock ecozone most at risk. Examples of large parks that are predicted to experience rapid change in vegetation characteristics include Strathcona, Garabaldi, and Kitlope. Our maps of future spatial distributions of indirect biodiversity indicators fill a gap in information products available for adaptive parks management and provide an opportunity for dialogue and further research on the use of future scenarios of landscape conditions in conservation planning.
1. Introduction
Parks and protected area systems play a key role in conserving biological diversity. Many international and national conservation targets call for between 10–12% protection of every ecosystem or habitat type [] with a new target of 17% recently set by Aichi Biodiversity Target []. The conservation targets have been criticized for their over-simplified and arbitrary values placed on biological elements yet applauded for their intention in achieving a more resilient and representative global protected areas system. As one might expect, opinion in areas to be protected often differ between those making recommendations based upon ecological principles and those responsible for land management and the often monetary implications. Regardless, in order for protection to be effective, all habitat types must have representation, resiliency, and redundancy within a protected area system [], and while the allocation of land for conservation is often opportunistic [] conservation networks should be designed to consider the spatial distribution of biodiversity, ecosystem threats [], habitat configuration, environmental representation, and species at risk [].
An assumption of protected area planning is that designated areas offer long term environmental conservation. However, planning does not typically account for anticipated landscape and ecological change that may occur over time [,,]. Climate change is understood to threaten global ecosystem functions and has been shown to potentially cause rapid shifts to species’ geographic range, diversity, and abundance [,,]. As a result, protected areas will rapidly diminish in their intended purpose of preserving natural conditions and representing a particular suite of landscape conditions, indicating a need for a more adaptive planning process and prioritization of appropriate policy and/or management responses []. Previous research has predicted that 37–48% of Canada’s protected areas could experience a conversion in ecological classification type due to climate change [] requiring information to support the prioritization, revision, or expansion of protected areas most expected to be impacted by climate change is required to inform proactive planning and management [,,].
Climate change has been identified as a threat to the preservation of biological diversity where it is altering environmental conditions at a rate at which species cannot effectively adapt in situ or migrate [,] resulting in different potential impacts to geographic ranges []. Species and ecosystem responses to climate change will thus be diverse and complex. Given climate is the main driving and limiting force determining productivity, measures of productivity offer insights into the amount of species richness and abundance a terrestrial habitat can sustain [,,,].
Flexible, broad scale, monitoring opportunities such as afforded by remote sensing provide quantitative information for mapping ecosystem productivity dynamics over large areas that are difficult to measure and assess on the ground [,]. Satellite based measures of vegetation productivity for example, have been utilized extensively as indirect indicators of biodiversity [,,,] and show promise in detecting conditions of sensitive ecosystems and parks ecosystem representation []. To date, satellite measures of productivity have been correlated with plant canopy cover [,] and overall productivity [] in historical [,,] and current contexts [,]. Relationships between productivity indicators and biodiversity have also been used to assess future spatial distributions of species [] and biodiversity [,]. Time series of remotely sensed productivity components have been linked with climate data and applied to forecast future indicators of biodiversity [,,,,]. For example, [] predicted future productivity in Washington and Oregon by linking climate data to metrics of fractional Photosynthetically Active Radiation (fPAR) (a measure for the amount of energy absorbed by the plant canopy). Other studies have used remotely sensed productivity indicators to predict climate alterations to ecosystem dynamics such as [] and []. The findings from these studies showed that climate change is often predicted to cause warmer and wetter conditions that are likely to increase forest productivity and, hence, biological diversity [].
Our goal in this paper is to examine potential alterations to vegetation conditions in protected areas due to climate change for the over 94 million hectare province of British Columbia, Canada. To meet our research goal, forecasted changes in biodiversity metrics are quantified to (1) characterize how the frequency of biodiversity indicators in parks and protected areas will behave under a changing climate in order identify possible future gaps in the types of vegetation conditions protected by parks; (2) evaluate potential changes to biodiversity indicators by biogeoclimatic zones in order to identify broad species assemblages and ecosystem types that are most threatened by climate change; and (3) rank protected areas by mean level of potential change as a mechanism for identifying parks that may experience the most change. To complete this research we initially modeled and mapped future indirect indicators of biodiversity based on a historical archive of remotely sensed and climate data and future climate change scenarios []. We compared biodiversity conditions represented within the parks and protected areas system at present and expected in the future. By forecasting changes in vegetation conditions province-wide and within protected areas, we can inform strategies for long-term preservation of biodiversity.
2. Study Area
British Columbia is located in the Pacific Northwest of North America from 49°00'N to 60°00' N and spans 944,735 km2. The province is highly diverse with temperate rainforests, deserts, and tundra. British Columbia also has highly variable topography and a wide-range of climates from mild coastal maritime to highly seasonal northern-interior continental conditions []. Urban and agriculture centers are concentrated in the south juxtaposed with biologically rich landscapes []. The rural areas of British Columbia are relatively untouched with most disturbances traced to forest management activities, ongoing infestation by mountain pine beetle (Dendroctonus ponderosae), regionalized drought conditions, and wildfires [,]. Protected areas as classified by the International Union for Conservation and Nature (IUCN) as categories I–VI, include ecological reserves, conservancies, provincial and national parks. Using this definition British Columbia has 13.7% land area protected [] within 1008 parks.
3. Data
3.1. The Dynamic Habitat Index
The Dynamic Habitat Index (DHI) is an example of an indirect indicator of biodiversity derived from remotely sensed imagery and is based on annual trends in the amount of photosynthetically active energy absorbed by the plant canopy (400 nm–700 nm) (fPAR) []. Shown to represent annual ecosystem vegetation dynamics, fPAR has been associated with biodiversity including butterfly and avian species richness [,]. Using high temporal resolution satellite sensors, such as AVHRR and MODIS (AVHRR: Advanced Very High Resolution Radiometer; MODIS: MODerate-resolution Imaging Spectrometer.), fPAR can potentially be mapped twice daily and can be used to map intra-annual productivity conditions [].
The DHI is a combination of three annual fPAR metrics: cumulative greenness (greenness), coefficient of variation (seasonality), and minimum cover. High greenness values indicate landscapes of year-round productivity with stable and temperate climates. Higher greenness equates to more productive habitat [,] and greater species diversity [,]. Therefore, protected areas with possible increases in greenness may see an increase in both species abundance and/or richness and existing species may become more dynamic. Examples of high greenness habitats include productive coniferous forests at lower elevations. Reduction in greenness, as observed in some dry interior habitats, may indicate that the environment will become less productive [,]. For instance, bunchgrass may become more prolific as forested (higher productivity) environments are being extirpated from the region.
High seasonality values indicate habitats that are often snow covered for at least some portion of the year (interior or northern locations), or that occur at higher elevations, with vegetation growth mostly occurring in the warmer summer months. Examples of high seasonality environments include high elevation alpine habitats and deciduous forests with significant winter snowfall. Decreasing seasonality indicates less variation in productivity between winter and summer growing seasons. Decreased seasonality is a key factor for species succession and movement, especially at higher elevation environments because it can limit nutrient cycles and biomass accumulation and therefore restrict species movement up elevation gradients [].
High minimum cover is indicative of habitats with increased productivity, often densely vegetated and with limited snow cover []. An increase to minimum cover can result in a greater forecasted baseline year-round productivity levels and therefore equates to more year round sustainable food supplies and biomass []. High minimum cover environments are often associated with riparian areas and productive coniferous forests along the coast and central interior regions of British Columbia.
In previous work, a historical archive of DHI [] derived from AVHRR data was compared to historical climate data [], and models developed to generate potential future spatial distributions of each DHI metric []. Historical productivity metrics were generated using archival remote sensing information as processed by []. Annual (1 km × 1 km resolution) DHI data from 1987–2007 were linked, using recursive partitioning (Rpart) regression trees [], to 10 corresponding climate and landscape variables that consisted of mean annual temperature, mean annual precipitation, temperature difference, growing degree days, number of frost free days, mean coldest month temperature, Julian date on which frost free period begins, climate moisture deficit, evapotranspiration, and mean summer precipitation.
Observed climate-DHI relationships were then projected to 2065 using established climate change scenarios. To do so, three climate scenarios from the Canadian Centre for Climate Modelling and Analysis (CCCma) derived from Climate WNA (Western North America) version 4.6. [] were used. The future climate models were projected to a thirty year average 2050–2080, hereafter referred to as 2065, and ranged from B1 (AR4–R1), representing the least extreme scenario, A1 (AR4–R1), representing the business-as-usual scenario where atmospheric CO2 to continues to increase unabated, and A2 (AR4–R4), representing the most extreme scenario. To simplify the comparison between present day and 2065 results, the climate model A1 (CCCma A1–AR4–R1) was chosen because it was positioned in the middle of the projected precipitation and temperature ranges for mainstream climate models []. Monserud et al. [] utilized three general circulation model climate outputs (CGCM2, UK Hadley Centre and the Max Plank Institute) and found all three predicted similar trends of changing climate over the next 100 years across Alberta. Mote et al. [] compared the ability of 10 global climate models to track recently recorded trends in temperature and precipitation in the Pacific Northwest and reported that the Canadian model was consistent in predicting a relatively rapid rate in warming and increases in precipitation when compared to actual observations.
3.2. Protected Area and Ecological Classification Data
Parks data were provided by the government of British Columbia data server last updated in July 2012 []. Zones from British Columbia’s province-wide Biogeoclimatic Ecosystem Classification (BEC) system (Version 8) developed by the BC Ministry of Forests were used to provide more species specific information about protected areas and what species assemblages might be most impacted. The BEC system categorizes ecosystems hierarchically according to vegetation, soil, topography, and climate classifications to create homogenous units of similar physical and ecosystem characteristics []. At the most broad scale, 16 zones provide broad spatial species assemblage information for the entire province [].
4. Methods
In order to categorize potential change in the DHI characteristics of parks through time, DHI values were classified into nine categories using natural breaks []. The changing area (or number of pixels) in each DHI class, between the present and future (modelled year 2065) DHI maps, provided an indication on how well a current park’s characteristics may be represented by parks in the future.
Gaps in protection are observed when DHI characteristics are currently well represented by protected areas, however not represented in the future. Gaps indicate vegetation conditions that may become minimally or no longer protected by the parks system as climate change impacts ecological processes. Several methodological steps were used to identify gaps. First, the current and future DHI values for protected areas were extracted from each DHI element (cumulative greenness, seasonality, and minimum cover). Second, each of the nine categories per DHI component (cumulative greenness, seasonality, or minimum cover) was mapped by park for current and future conditions. Lastly, changes in each DHI component, by category, were assessed by scenario to identify the locations of gaps. Categories less than 1000 km2 in area were excluded from the analysis.
At the ecozone level to quantify spatial variation in predicted broad-scale habitat change, image differencing was used to measure regional change in indicators by BEC zones from present day to 2065. Greenness, seasonality, and minimum cover metrics were each subtracted by pixel to produce a forecasted change map. Change was summarized by ranking the mean change of BEC zones.
Park size was identified as a potential factor in ranking change, as smaller parks had lower sample sizes and thus could be entirely located within regions of high or low change. To account for the influence of park size, parks were divided into three categories for ranking, large (>1000 km2), medium-sized (50–1000 km2), and small (<50 km2) based on natural breaks. Parks were ranked by size and change in DHI categories to highlight the most threatened parks and characterize the nature of modelled change.
5. Results
Presently, all DHI classes are unequally represented across the total province and within parks (Figure 1 a,b,c). Forecasted change indicates that in the future the DHI value categories will potentially be more evenly represented, both generally and within parks. Currently, parks and protected areas overrepressent low greenness (Figure 1a), high seasonality (Figure 1b) and low minimum cover (Figure 1c). By 2065 there is potential for increased greenness and reduced seasonality within parks. Gaps in cumulative greenness protection occurred in the mid-low values to mid-high values and were located along the eastern and central regions of the province. Gaps in seasonality, only, were more geographically limited compared to greenness only gaps which occur in moderate greenness locations from the Rocky Mountains to the central interior. Minimum cover only gaps were observed in mid-low values stretching the latitudinal length of the province with clusters situated in the eastern edge of the Coastal Mountains and valleys of the Rocky Mountains. Figure 2 shows 81 parks that are identified as having gaps in all three DHI variables, and have a total area of 5,105 km2.
The 10 top ranking large, medium-sized, and small parks, according to mean level of forecasted change to their greenness, seasonality, and minimum cover, are shown in Figure 3, Figure 4, Figure 5. Impacts for individual parks were spatially variable with some parks having consistently high degrees of change for all three indirect biodiversity indicators. Protected areas along the Coast Mountains were consistently ranked among those with the greatest levels of change, followed by the Rocky Mountains and the northern central interior. Protected areas with the least amount of forecasted change were located on low lying coastal zones and leeward interior parks.
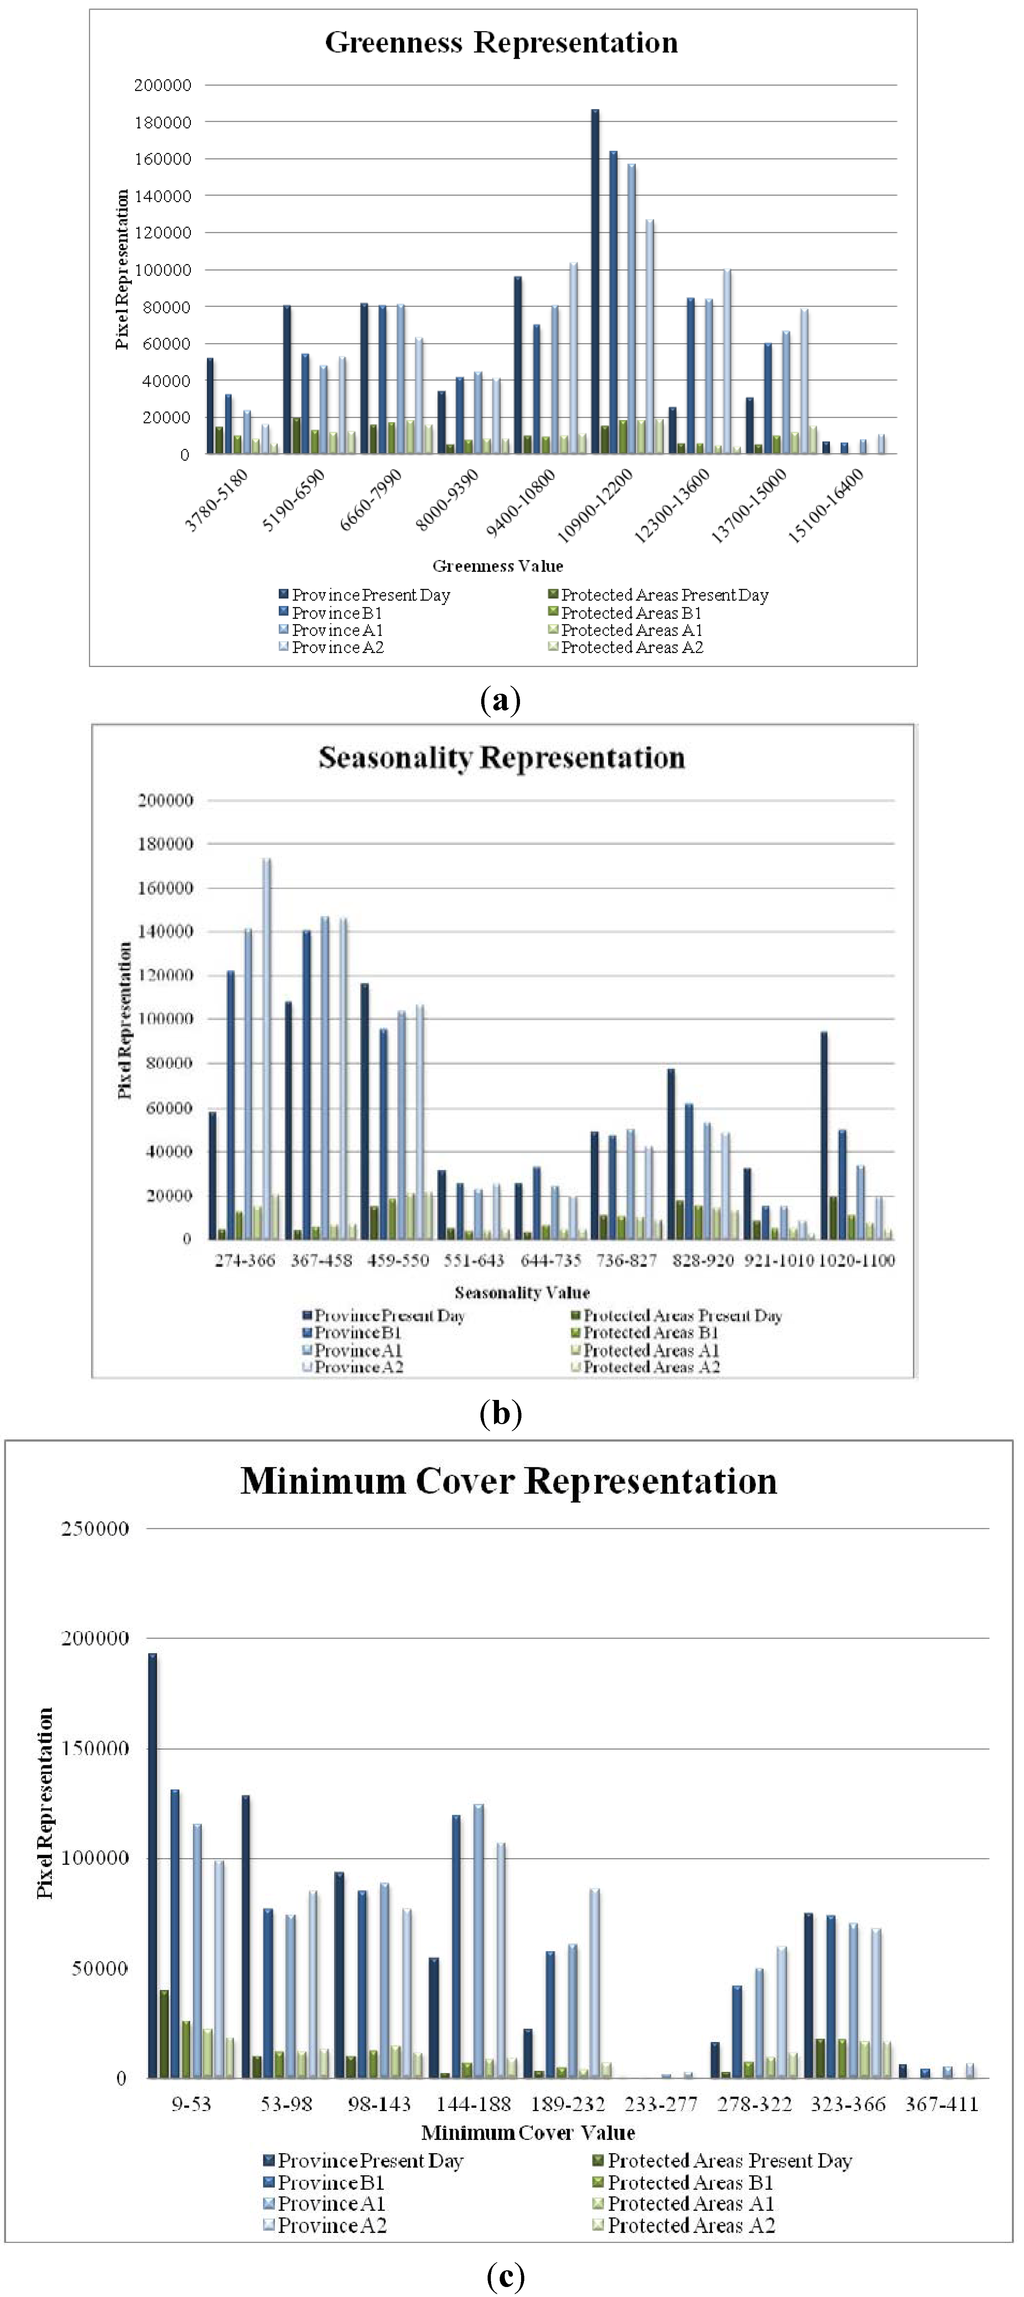
Figure 1.
(a) Changes in greenness representation showing present day, B1, A1, and A2 2065 climate scenarios. Overall changes indicate a better representation for higher greenness due to climate change. (b) Changes in seasonality representation showing present day, B1, A1, and A2 2065 climate scenarios. Overall changes indicate a better representation for lower seasonality due to climate change. (c) Changes in minimum cover representation showing present day, B1, A1, and A2 2065 climate scenarios. Overall changes indicate a better representation for higher minimum cover due to climate change.
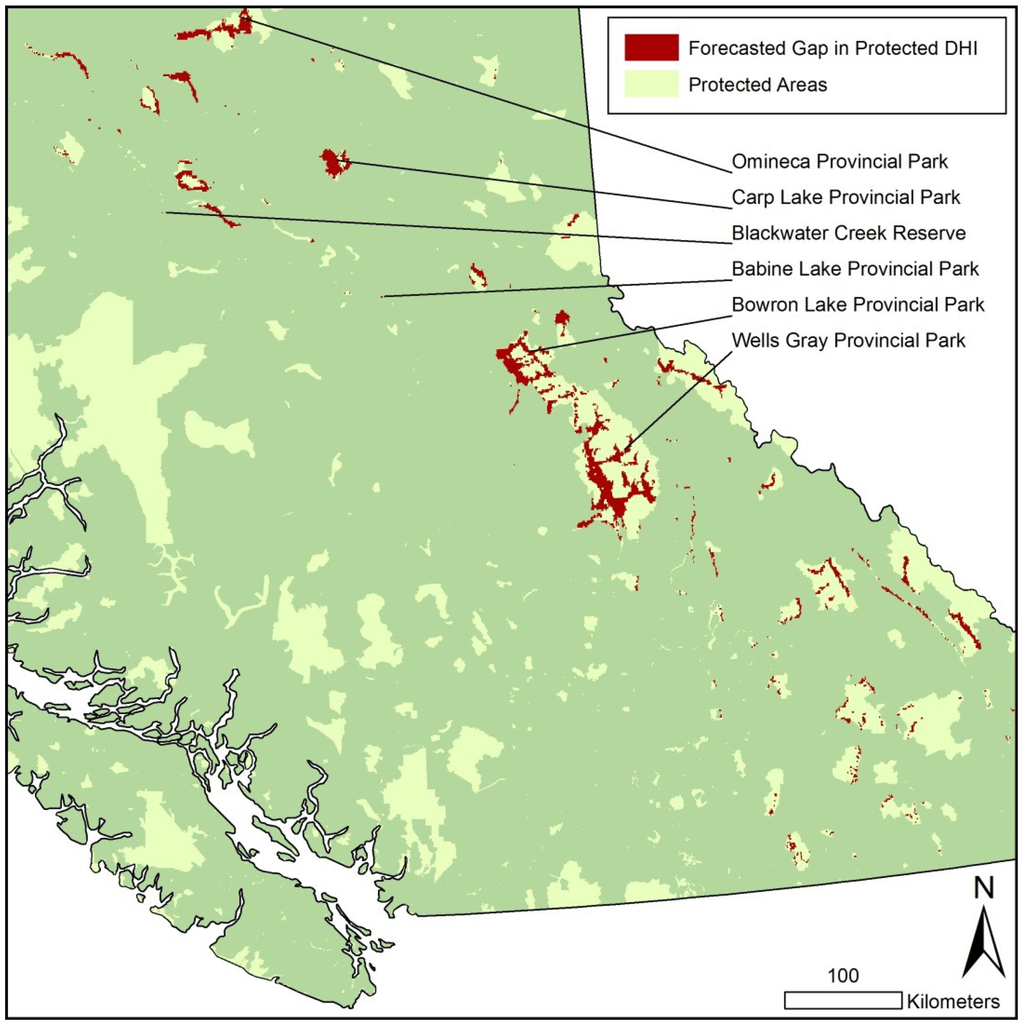
Figure 2.
Sub-set of British Columbia and select parks and protected areas illustrating gaps in DHI representation.
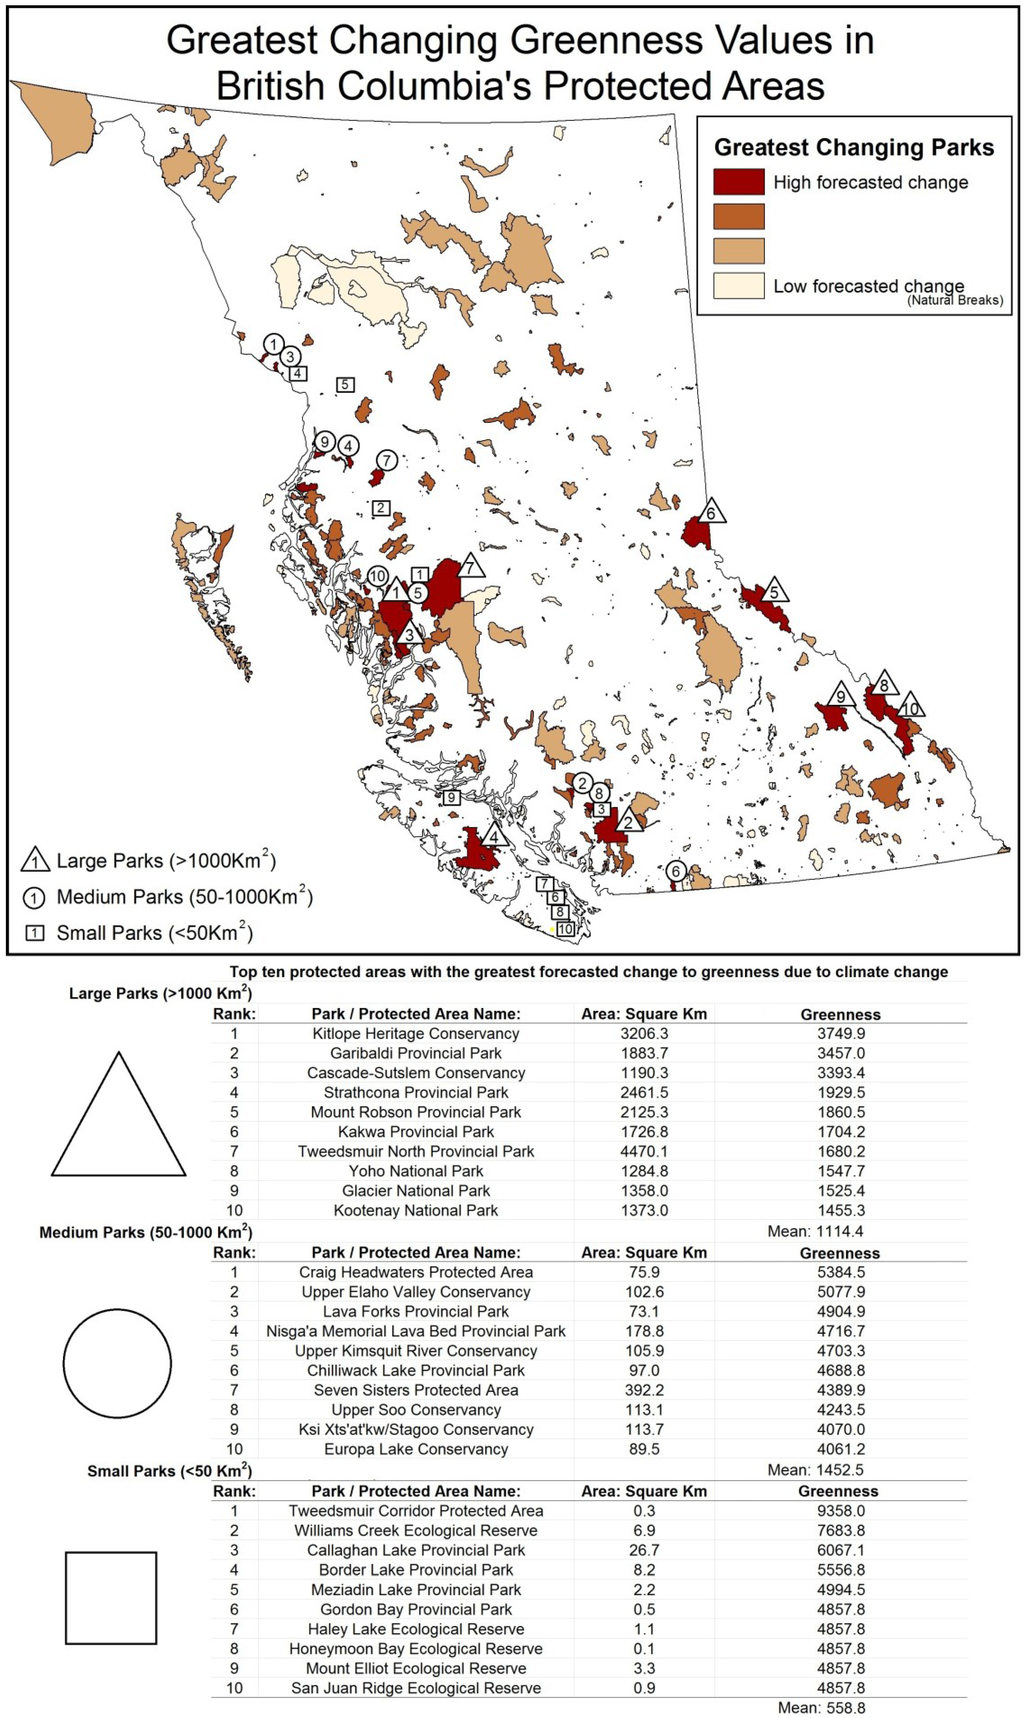
Figure 3.
Ranking of highest changing greenness in large, medium, and small protected areas.
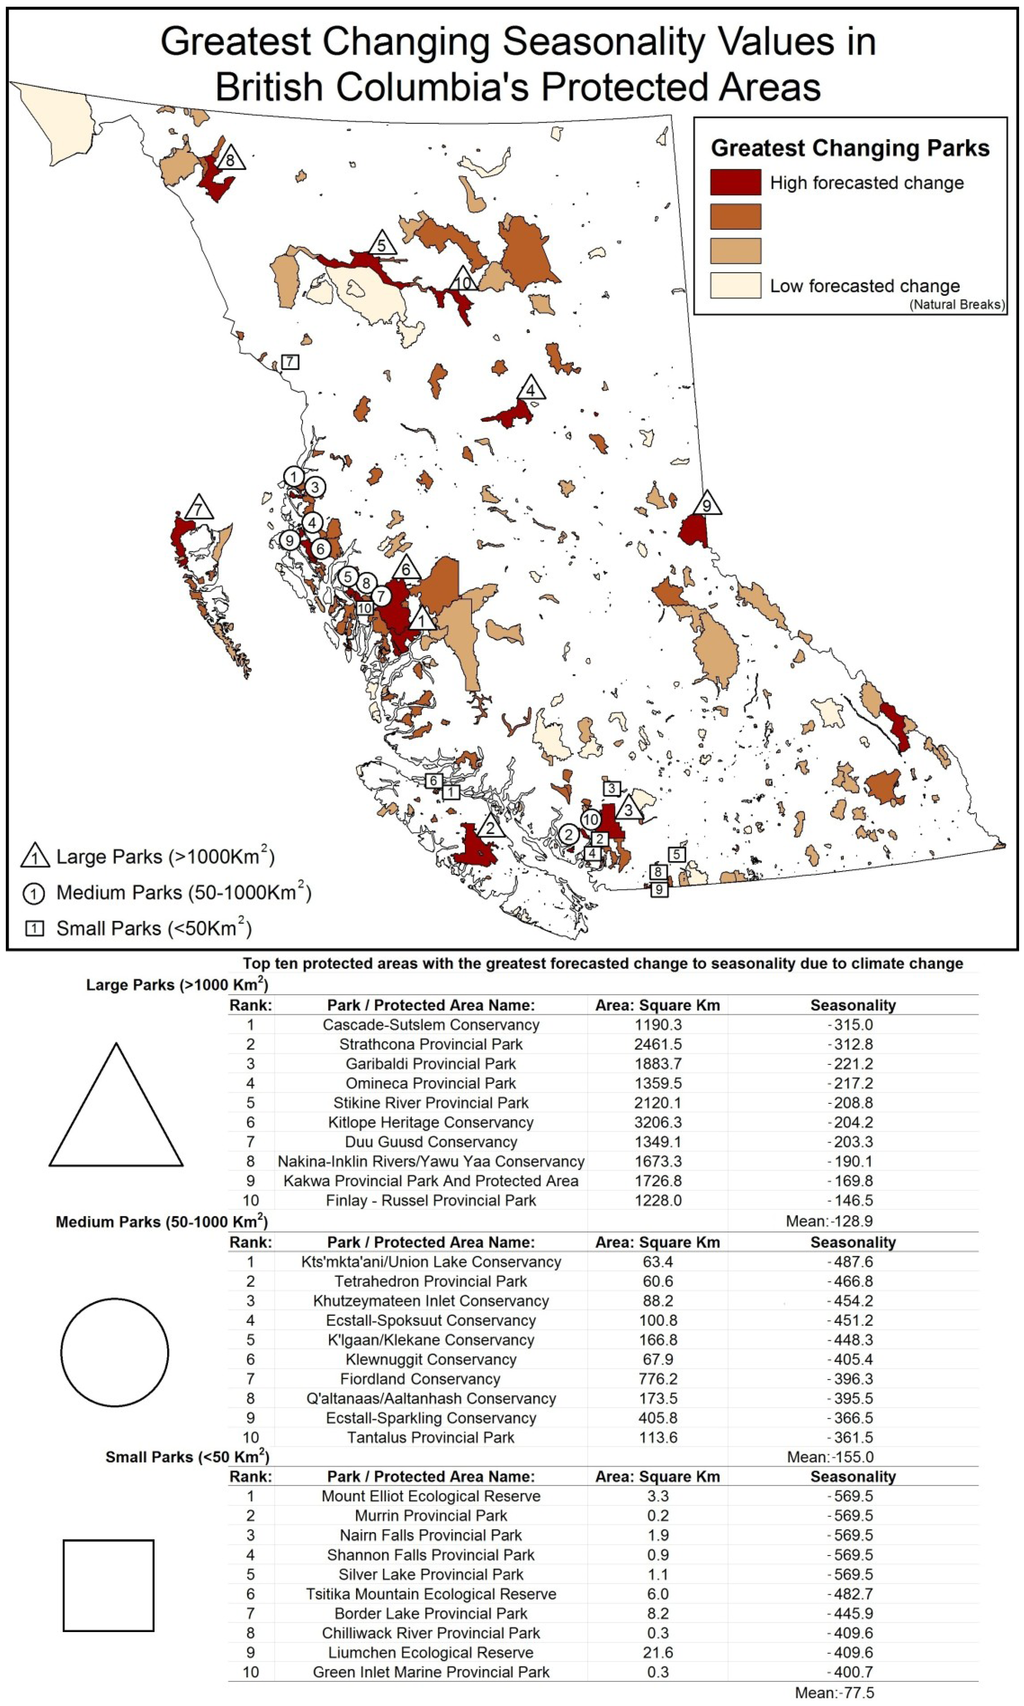
Figure 4.
Ranking of highest changing seasonality in large, medium, and small protected areas.
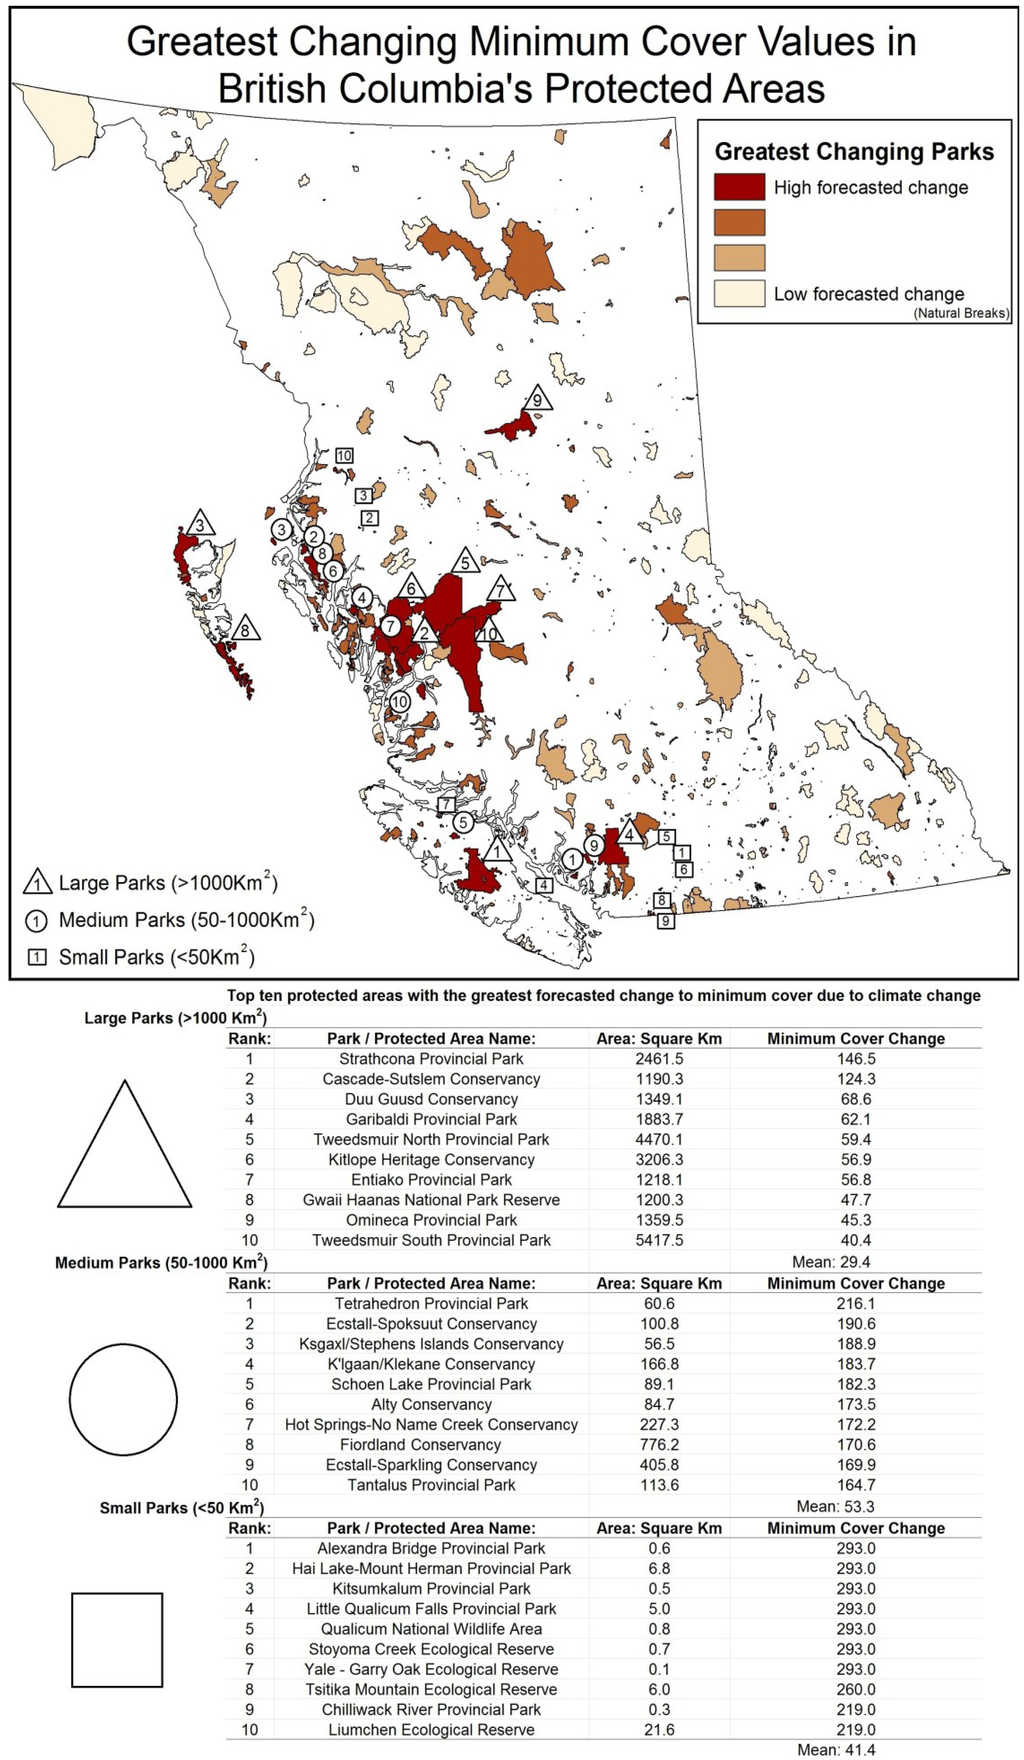
Figure 5.
Ranking of highest changing minimum cover in large, medium, and small protected areas.
Most of the 32 large protected areas (>1000 km2) are situated along the Coast Mountains, Rocky Mountains, and northern regions; they include Strathcona and Garibaldi Provincial Parks, and Kitlope Protected Areas with all forecasted to have decreases in seasonality and increases in greenness and minimum cover. Of these, Strathcona Provincial Park is the most sensitive to change with mean greenness increasing 173.1% greater than the provincial average, seasonality 242.7% above average levels, and minimum cover increasing 498.3% above average levels. Other large parks were impacted by only one indicator, such as the Stitkine River Provincial Park, which was forecasted to have a large decrease in seasonality while attaining low to average levels of change in greenness and minimum cover.
Medium-sized parks (50–1000 km2) varied greatly in their rankings between DHI categories; however, many are located along the western mountainous region of British Columbia. Parks consistently predicted to experience high levels of change included Tetrahedron Provincial Park, Fiordland Conservancy, and Ecstall-Spoksuut Conservancy, all located along the Coast Mountains. For example, Tetrahedron Provincial Park by comparison to mean medium-sized parks was forecasted to have greenness increase 230.4% above average, seasonality increase 301.2% above average, and minimum cover increase 405.4% above average. In the southcentral interior, some parks had negative forecasted values. For example, Kalamalka Lake Protected Area, which was forecasted to have a decrease in greenness of 158.5% below the mean for medium-sized parks, is indicative of the complex interrelationships observed in the drier interior environments.
Like medium-sized parks, small parks (<50 km2) with considerable projected change were located in the Coast Mountains of British Columbia. The rankings for high changing small area parks were often not consistent across DHI categories resulting in a wide variety of protected areas identified as high risk. Examples include Mount Elliot Ecological Reserve, Tsitika Mountain Ecological Reserve, and Williams Creek Ecological Reserve. The Mount Elliot Ecological Reserve (3.3 km2) on northern Vancouver Island had a predicted decrease in the seasonality value of 734.8% above average, greenness value increase of 869.3% above average, and minimum cover value increase 490.3% above small park average. Small parks are often located strategically to protect a particular set of values. For instance, Milligan Hills Provincial Park is located in the northeast Boreal region and protects woodland caribou habitat. Milligan Hills had a projected decrease in greenness metric of 47.5% below the provincial mean and an increase in minimum cover of 141.2% above average indicating possible alterations to vegetation and the spatial distribution of forging resources.
At the BEC zone level, projected changes in ecosystem biodiversity were represented by ranked mean change in DHI component (Table 1). The Mountain Hemlock zone had a 332.0% increase in greenness greater than the provincial average, followed by Coastal Western Hemlock ecozone (213.2% above average). Interior Douglas-fir zone was observed to have a decrease in mean greenness of 141.7%, Ponderosa Pine zone decreased 110.4%, and Bunchgrass zone decreased 148.2%; however, they did not change considerably in seasonality or minimum cover. BEC zones with the least amount of change were observed in geographically restricted zones or areas of limited area such as the Coastal Douglas-fir, Bunchgrass, and Ponderosa Pine zones.

Table 1.
Ranking changes to the Dynamic Habitat Index within each Biogeoclimatic Ecosystem Classification (BEC) zone.
| Rank | BEC Zone | Mean Greenness Change | ||
| High Change Zone | | 1 | Mountain Hemlock | 3437.4 |
| 2 | Coastal Mountain-heather Alpine | 2207.7 | ||
| 3 | Interior Mountain-heather Alpine | 1781.0 | ||
| 4 | Coastal Western Hemlock | 1712.7 | ||
| 5 | Engelmann Spruce - Subalpine Fir | 1466.8 | ||
| 6 | Sub-Boreal Spruce | 786.9 | ||
| 7 | Boreal White and Black Spruce | 759.6 | ||
| 8 | Interior Cedar - Hemlock | 676.3 | ||
| 9 | Boreal Altai Fescue Alpine | 613.9 | ||
| 10 | Bunchgrass | −498.5 | ||
| 11 | Interior Douglas-fir | −431.6 | ||
| 12 | Spruce - Willow - Birch | 407.3 | ||
| Low Change Zone | 13 | Montane Spruce | 227.8 | |
| 14 | Ponderosa Pine | −107.4 | ||
| 15 | Sub-Boreal Pine - Spruce | 53.3 | ||
| 16 | Coastal Douglas-fir | 0.0 | ||
| Rank | BEC Zone | Mean Seasonality Change | ||
| High Change Zone | | 1 | Mountain Hemlock | −257.4 |
| 2 | Coastal Western Hemlock | −192.4 | ||
| 3 | Spruce - Willow - Birch | −178.9 | ||
| 4 | Engelmann Spruce - Subalpine Fir | −165.4 | ||
| 5 | Coastal Mountain-heather Alpine | −134.1 | ||
| 6 | Interior Cedar - Hemlock | −106.5 | ||
| 7 | Sub-Boreal Spruce | −95.1 | ||
| 8 | Montane Spruce | −87.3 | ||
| 9 | Interior Mountain-heather Alpine | −63.1 | ||
| 10 | Boreal Altai Fescue Alpine | −61.5 | ||
| 11 | Boreal White and Black Spruce | −56.9 | ||
| 12 | Sub-Boreal Pine - Spruce | −48.4 | ||
| Low Change Zone | 13 | Interior Douglas-fir | −24.8 | |
| 14 | Ponderosa Pine | −0.3 | ||
| 15 | Bunchgrass | −0.2 | ||
| 16 | Coastal Douglas-fir | 0.0 | ||
| Rank | BEC Zone | Mean Minimum Cover Change | ||
| High Change Zone | | 1 | Mountain Hemlock | 90.8 |
| 2 | Coastal Western Hemlock | 87.8 | ||
| 3 | Sub-Boreal Pine - Spruce | 57.4 | ||
| 4 | Sub-Boreal Spruce | 53.9 | ||
| 5 | Coastal Douglas-fir | 48.5 | ||
| 6 | Montane Spruce | 41.3 | ||
| 7 | Interior Cedar - Hemlock | 41.1 | ||
| 8 | Coastal Mountain-heather Alpine | 41.0 | ||
| 9 | Boreal White and Black Spruce | 40.8 | ||
| 10 | Interior Douglas-fir | 39.4 | ||
| 11 | Engelmann Spruce - Subalpine Fir | 16.7 | ||
| 12 | Spruce - Willow - Birch | 14.7 | ||
| Low Change Zone | 13 | Bunchgrass | 12.9 | |
| 14 | Interior Mountain-heather Alpine | 7.4 | ||
| 15 | Ponderosa Pine | 4.3 | ||
| 16 | Boreal Altai Fescue Alpine | 4.1 |
6. Discussion
Our research provides maps of future, potential spatial distributions of indirect indicators of biodiversity, which are informative and quantitative input to adaptive management. Both the Canadian Biodiversity Strategy [] and British Columbia’s Climate Change Adaptation Strategy [] state that improved data and monitoring are essential to aid adaptive management and ensure ecological resilience. Although climate change is perceived to be impacting Canadian parks, there is limited information on what may occur in the future []. Mapping potential change to biodiversity supports landscape-scale strategic conservation frameworks that are designed to aid adaptive management [].
Provincially, our model showed an increase in greenness and minimum cover and a decrease in seasonality. Generally, provincial trends were mirrored by the parks system. The current system favours higher elevation environments that have lower productivity (greenness and minimum cover) and higher seasonality [], and due to high rates of change forecasted to occur by 2065 in mid- to high-elevation landscapes, increased greenness and reduced seasonality are predicted. The forecasted changes to DHI varied and, as a result, there was also variability to how well the parks represent the range of landscape conditions. In some respects, the findings appear positive. Given that parks presently over-represent low greenness values, while high greenness values are under-represented, the forecasted shift has potential to create an increasingly balanced representation of greenness landscapes within protected areas. Greater greenness may mean more biomass and enhanced productivity [] and lower seasonality habitats can sustain greater biodiversity []. It is worth noting that this representation is province wide, with the regionalized considerations where large changes in conditions are expected remaining important (i.e., localized changes, and possible loss of unusual conditions, niches, or particular species).
Some species will not benefit as well (in relation to the general trends) based on predicted scenarios of future DHI distributions. Consider, for instance, the northern woodland caribou (Rangifer tarandus-caribou) that inhabit the large Omineca Provincial Park (1359.5 km2), which was forecast to have a high rate of change with large increases in greenness, minimum cover, and decreases in seasonality. Omineca Park is an important calving location in the spring for the blue-listed caribou species. For food, shelter, and reduction of predation risk, caribou favour alpine and mid-elevation environments in Omineca Park [] which are among the highest changing types of environments. As a result, increased vegetation productivity in the alpine will have negative impacts on the caribou in Omineca. Likewise small southern parks that host the most endangered species [] are less able to adapt to changes in their habitats and a greening effect may have a negative impact on their survivability []. Other examples of negative impacts include the landscape becoming more homogenous, with loss of heterogeneity, potentially resulting in a reduction in overall biodiversity. Further, rapidly shifting environmental conditions (i.e., DHI) have many unknown consequences since individual species’ resilience to change and degradation thresholds are difficult to assess []. Not all DHI values are better represented in the future. For instance, reduced representation occurred in locations with mid- to low-level minimum greenness values, which are found throughout most of the interior (i.e., Tweedsmuir and Wells Grey Provincial Parks) and in areas associated with lower productivity forests.
Meeting biodiversity related mandates requires representative protection of the landscape []. By identifying under-represented biological characteristics in the existing protected areas system, we identified gaps in protection [], which in turn are predicted to be most at risk to climate change. The Rocky Mountains and central interior were both identified as locations where gaps in all three DHI characteristics were evident. Gaps had DHI characteristics of high greenness and mid-level minimum cover and seasonality, and were located in the following BEC zones: Interior Cedar Hemlock, Sub-Boreal Spruce, and Montane Spruce. Other gaps were observed at Wells Grey Provincial Park and appear to be located in the valleys dominated by Interior Cedar Hemlock zones up in elevation to the Engelmann Spruce-Subalpine Fir zones. The Wells Gray Provincial Park Master Plan states the need to preserve park values of wildlife and ecosystem health [] and our results indicate further assessment of climate change impacts to wildlife and ecosystem health will be beneficial.
In contrast, General regions such as the Boreal (in the northeast) and Okanagan (in the south region) demonstrated decreasing predicted greenness. Although the interior landscape did not rank amongst the greatest changing region, it did present complex combinations of negative greenness, decreased seasonality, and increased minimum cover which indicates dry forests associated with this unique DHI characteristic may shift northward. The southern interior region has a number of parks that are projected to observe a decrease in greenness. The South Okanagan Grasslands Protected Area, for example, has a projected decrease in greenness. Decreased greenness in the grasslands region equates to an expansion of dry grassland habitats and less favourable conditions for the megafauna species like the dry forests that have a higher greenness DHI characteristic. The Grasslands Protected Area hosts 15 endangered species such as the red listed Lyall’s mariposa lily (Calochortus lyallii) and the flat-topped broomrape (Orobanche corymbosa ssp. Mutabilis) []. Many of the endangered plants that thrive in grasslands may benefit from expansion of their habitat due to diminished climate limiters that once restricted migration into new regions. Changes to climate may also impact species negatively in the south, such as the bird species that require dry forests for their habitat. Decreased greenness indicates that the dry forests within the Grasslands Protected Area may decline causing red-listed species such as the Brewer’s sparrow (Spizella breweri breweri) and the sage thrasher (Oreoscoptes montanus) to reduce in population. To protect these bird species in the future, parks must either expand into territories where habitats are projected to be more favourable or park conservation efforts should implement strategies to preserve species abundance and diversity within park boundaries.
At the ecosystem level, our models indicate the Mountain Hemlock BEC zone will see the greatest change by 2065. Mountain Hemlock BEC zone (407–1428 m elevation) is located in the transition zone of Coastal Western Hemlock and higher alpine habitats. Mountainous temperate regions have been found to be highly sensitive landscapes to climate change worldwide []. High alpine forests and BEC zones such as Mountain Hemlock and Englemann Spruce-Subalpine Fir are sensitive to slight changes in climate since their distribution is predominately determined by climate and are pressed between highly competitive ecosystems [,]. Protected areas closer to the coast are forecasted to have little change in biodiversity indicators; however, the Coastal Western Hemlock BEC zone borders on the highest changing ecosystems (Mountain Hemlock) and has a high mean rate of change. Low elevation parks in the Coastal Douglas-fir BEC zone were forecasted to have minimal change with only increases in minimum cover, while inland Coastal Hemlock BEC zone parks changed considerably. Interior BEC zones (i.e., Bunchgrass, Interior Douglas-fir, and Ponderosa Pine) were found to expand due to their forecasted decreases in greenness. Decreased greenness signifies that drier ecosystems will dominate over wetter forests of the interior such as those in Montane Spruce and Sub-Boreal Spruce BEC zones. Grasses and drier forests will spread throughout much of the southern interior of the province. Our findings are corroborated by BEC zone forecasting completed by Wang et al. [] where warmer and wetter future conditions will lead to species groupings to shift northward and to higher elevations. [].
Small protected areas (>50 km2) are commonly designed to protect specific species or unique habitats and often protect the most threatened regions []. The most extreme range in forecasted DHI results were found for small parks, they are often surrounded by regions of strong change. Williams Creek Ecological Reserve (7km2) in the northwest of the province represents one of the highest forecasted increases in greenness because it is located along the Coast Mountains, is situated at an elevation gradient of 490–1,735m, and includes fast changing ecosystem zones such as Mountain Hemlock and Coastal Mountain-heather Alpine []. Increased greenness may result in a push of dominant ecosystem species up elevation gradients, allowing coastal hemlock to overtake traditional Mountain Hemlock zones and Mountain Hemlock trees can advance into traditional alpine environments.
Achieving equal representation of landscape conditions within parks can be difficult, especially for biologically rich environments because of conflicting interests such as resource extraction, urbanization, and agriculture practices []. In fact, climate change begs the question of whether representativeness of parks should continue to be a goal in parks planning []. Southern Vancouver Island, for example, has a unique Garry oak (Quercus garryana) ecosystem with the greatest high priority species counts in British Columbia [], but protection of this ecosystem is limited by urbanization. Evaluation of present protection coverage shows capricious results with some biological characteristics lacking adequate protection. Biases exist, especially in large reserves over 10,000 km2, toward protection of more seasonal, higher elevation, lower biodiversity environments [,]. Critiques of protected area systems identify a bias toward low biodiversity regions that protect barren or glacial environments [,,] rather than southern forests and riparian habitats that host many more species at risk []. As vegetation on the landscape becomes more homogenous, parks will be more representative of the overall landscape. However, a likely cost is the loss of species vulnerable to change and species with specific habitat requirements [].
The CCCma climate models have been shown to have consistent results, when compared to 10 global climate models, and are calibrated for Canada []. However, there are climate models, such as the GFD GCM (Geophysical Fluid Dynamic, Generalized Circulation Model), that predict less precipitation in the future [] and would forecast different vegetation trends. In the future, it will be beneficial to expand modeling of future DHI spatial distributions using a wider range of future climate scenarios and even updated climate scenarios. These mapped trends in future DHI are therefore not viewed as the final solution, rather highlight possible scenarios of the future distribution of indirect indicators of biodiversity. One of the strengths of this research is that it can be used to highlight locations where large amounts of change are possible and future benefits will be obtained by integrating this research with other results to build consensus models [].
Our method of assessing change to individual parks and ecosystems using remotely sensed biodiversity indicators (i.e., fPAR metrics) provides a broad understanding of the vectors of change. By using indirect indicators of biodiversity we avoid the problems and assumptions associated with species specific niche-based modelling []. It is unrealistic to represent complex ecological processes such as adaptation, tolerance, and migration [,] over a broad scale. Indirect indicators of biodiversity provide a broad lens for identifying where and how biodiversity may change and should be considered as a tool for strategic-level planning and resource prioritization.
7. Conclusions
Our remote sensing-based approach, modelling indirect indicators of biodiversity, provides information on possible changes to vegetation support for biodiversity in parks, which is essential for adaptive management. We have identified protected areas and ecosystem assemblages that are most threatened by climate change, such as Strathcona Provincial Park and the Mountain Hemlock Ecozone. Coast Mountains, Vancouver Island, and southern regions of the province are of particular importance because of their projected large change and the need to preserve the region’s high concentrations of endangered species. Overall, trends in biodiversity indicators suggest future parks and protected areas may better represent landscape conditions. Climate change will lead to increased vegetation productivity and reduced seasonality in many alpine parks, which may also improve the biases currently observed in how well parks represent the range of landscape conditions. However, the cost of more representative parks may likely cause negative impacts to sensitive habitats and species due to their inability to adapt to changes in climate and ecosystem functions [].
In the future, landscapes with high greenness and mid- to low-level seasonality and minimum cover will be poorly represented by parks. These are located in the valleys of the Rocky Mountains and central interior. Planning new protected areas should be focused around identified gap regions which are associated with Interior Cedar Hemlock and Sub-Boreal Spruce BEC zones.
With repeated coverage and spatially continuous data, our research, linking remote sensing-based biodiversity indicators to historical climate data and future climate models, responds to repeated calls for better information on future park conditions to aid adaptive management. The next phase is to better understand how to integrate scenarios of future landscape conditions into adaptive management to meet long term conservation goals.
Acknowledgments
Our research, was supported by the British Columbia Innovation Council (BCIC) and was undertaken as an extension of the “BioSpace: Biodiversity monitoring with Earth Observation data” project jointly funded by the Canadian Space Agency (CSA) Government Related Initiatives Program (GRIP), Canadian Forest Service (CFS) Pacific Forestry Centre (PFC), and the University of British Columbia (UBC).
Conflict of Interest
The authors declare no conflict of interest.
References and Notes
- Barton, J.H. Biodiversity at Rio. BioScience 1992, 42, 773–776. [Google Scholar] [CrossRef]
- Aichi Biodiversity Target. Available online: http://www.cbd.int/sp/targets/ (accessed on 2 March 2013).
- Svancara, L.K.; Brannon, R.; Scott, J.M.; Groves, C.R.; Noss, R.F.; Pressey, R.L. Policy-Driven versus evidence-based conservation: A review of political targets and biological needs. BioScience 2005, 55, 989. [Google Scholar] [CrossRef]
- Andrew, M.E.; Wulder, M.A.; Coops, N.C. Patterns of protection and threats along productivity gradients in Canada. Biol. Conserv. 2011, 144, 2891–2901. [Google Scholar] [CrossRef]
- Pressey, R.L.; Cabeza, M.; Watts, M.E.; Cowling, R.M.; Wilson, K.A. Conservation planning in a changing world. Trends Ecol. Evol. 2007, 22, 583–592. [Google Scholar] [CrossRef]
- Kerr, J.T.; Deguise, I. Habitat loss and the limits to endangered species recovery. Ecol. Lett. 2004, 7, 1163–1169. [Google Scholar] [CrossRef]
- Hannah, L.; Midgley, G.F.; Sandy, A.; Araujo, M.B.; Hughes, G.; Enrique, M.-M.; Richard, P.; Paul, W. Protected area needs in a changing climate. Front. Ecol. Environ. 2007, 5, 131–138. [Google Scholar] [CrossRef]
- Lemieux, C.J.; Scott, D.J. Climate change, biodiversity conservation and protected area planning in Canada. Can. Geogr./Le Geogr. Can. 2005, 49, 384–397. [Google Scholar] [CrossRef]
- Visser, M.E. Keeping up with a warming world; assessing the rate of adaptation to climate change. Proc. R. Soc. 2008, 275, 649–659. [Google Scholar] [CrossRef]
- Harrison, P.; Berry, P.; Butt, N.; New, M. Modelling climate change impacts on species’ distributions at the European scale: Implications for conservation policy. Environ. Sci. Policy 2006, 9, 116–128. [Google Scholar] [CrossRef]
- Berry, P.M.; Dawson, T.P.; Harrison, P.A.; Pearson, R.G. Modelling potential impacts of climate change on the bioclimatic envelope of species in Britain and Ireland. Glob. Ecol. Biogeogr. 2002, 11, 453–462. [Google Scholar] [CrossRef]
- Midgley, G. Developing regional and species-level assessments of climate change impacts on biodiversity in the Cape Floristic Region. Biol. Conserv. 2003, 112, 87–97. [Google Scholar] [CrossRef]
- Halpin, P. Global climate change and natural-area protection: Management responses and research directions. Ecol. Appl. 1997, 7, 828–843. [Google Scholar] [CrossRef]
- United Nations Environment Programme (UNEP), Decisions Adopted by the Conference of the Parties to the Convention on Biological Diversity at its Seventh Meeting; UNEP: Kuala Lumpur, Malaysia, 2004.
- Environment Canada, Canadian Protected Areas Status Report; Environment Canada: Gatineau, QC, Canada, 2006.
- Canadian Biodiversity Strategy. Available online: http://www.cbin.ec.gc.ca/strategie-strategy (accessed on 22 October 2010).
- Iverson, L.R.; Prasad, A.M. Predicting abundance of 80 tree species following climate change in the eastern United States. Ecol. Monogr. 1998, 68, 465–485. [Google Scholar] [CrossRef]
- Fussel, H.M. Adaptation planning for climate change: Concepts, assessment approaches, and key lessons. Sustain. Sci. 2007, 2, 265–275. [Google Scholar] [CrossRef]
- Willis, S.G.; Hole, D.G.; Collingham, Y.C.; Hilton, G.; Rahbek, C.; Huntley, B. Assessing the impacts of future climate change on protected area networks: A method to simulate individual species’ responses. Environ. Manag. 2009, 43, 836–845. [Google Scholar]
- Hannah, L.; Midgley, G.F.; Lovejoy, T.; Bond, W.J.; Bush, M.; Lovett, J.C.; Scott, D.; Woodward, F.I. Conservation of biodiversity in a changing climate. Conserv. Biol. 2002, 16, 264–268. [Google Scholar] [CrossRef]
- Hawkins, B.A.; Field, R.; Cornell, H.V.; Currie, D.; Guégan, J.F.; Kaufman, D.M.; Kerr, J.T.; Mittelbach, G.G.; Oberdorff, T.; O’Brien, E.M.; et al. Energy, water, and broad-scale geographic patterns of species richness. Ecology 2003, 84, 3105–3117. [Google Scholar] [CrossRef]
- Araújo, M.B.; Rahbek, C. How does climate change affect biodiversity? Science 2006, 313, 1396–1397. [Google Scholar]
- Nagendra, H. Using remote sensing to assess biodiversity. Int. J. Remote Sens. 2001, 22, 2377–2400. [Google Scholar] [CrossRef]
- Turner, W.; Spector, S.; Gardiner, N. Remote sensing for biodiversity science and conservation. Trends Ecol. Evol. 2003, 18, 306–314. [Google Scholar]
- Waide, R.B.; Willig, M.R.; Steiner, C.F.; Mittelbach, G.; Gough, L.; Dodson, S.I.; Juday, G.P.; Parmenter, R. The relationship between productivity and species richness. Ann. Rev. Ecol. Syst. 1999, 30, 257–300. [Google Scholar] [CrossRef]
- Latta, G.; Hailemariam, T.; Barrett, T. Mapping and imputing potential productivity of Pacific Northwest forests using climate variables. Can. J. For. Res. 2009, 39, 1197–1207. [Google Scholar] [CrossRef]
- Running, S.W.; Hunt, E.R. Generalization of a Forest Ecosystem Process Model for Other Biomes, BIOME-BGC, and an Application for Global-Scale Models; San Diego Academic press: San Diego, MA, USA, 1993; pp. 141–158. [Google Scholar]
- Shilling, F. Do habitat conservation plans protect endangered species? Science 1997, 276, 1662–1663. [Google Scholar] [CrossRef]
- Algar, A.C.; Kharouba, H.M.; Young, E.R.; Kerr, J.T. Predicting the future of species diversity: Macroecological theory, climate change, and direct tests of alternative forecasting methods. Ecography 2009, 32, 22–33. [Google Scholar] [CrossRef]
- Fitterer, J.L.; Nelson, T.A.; Coops, N.C.; Wulder, M.A. Modelling the ecosystem indicators of British Columbia using Earth observation data and terrain indices. Ecol. Indic. 2012, 20, 151–162. [Google Scholar]
- Fontana, F.M.; Coops, N.C.; Khlopenkov, K.V.; Trishchenko, A.P.; Riffler, M.; Wulder, M.A. Generation of a novel 1km NDVI data set over Canada, the northern United States, and Greenland based on historical AVHRR data. Remote Sens. Environ. 2012, 121, 171–185. [Google Scholar]
- Slayback, D.A.; Pinzon, J.E.; Los, S.O.; Tucker, C.J. Northern hemisphere photosynthetic trends 1982–99. Glob. Change Biol. 2003, 9, 1–15. [Google Scholar] [CrossRef]
- Xiao, J.; Moody, A. Geographical distribution of global greening trends and their climatic correlates: 1982–1998. Int. J. Remote Sens. 2005, 26, 2371–2390. [Google Scholar] [CrossRef]
- Waser, L.T.; Stofer, S.; Schwarz, M.; Küchler, M.; Ivits, E.; Scheidegger, C. Prediction of biodiversity—regression of lichen species richness on remote sensing data. Community Ecol. 2004, 5, 121–133. [Google Scholar] [CrossRef]
- Puumalainen, J.; Kennedy, P.; Folving, S. Monitoring forest biodiversity: A European perspective with reference to temperate and boreal forest zone. J. Environ. Manag. 2003, 67, 5–14. [Google Scholar] [CrossRef]
- Fitterer, J.L.; Nelson, T.A.; Coops, N.C.; Wulder, M.A.; Mahony, N.A. Exploring the ecological processes driving geographical patterns of breeding bird richness in British Columbia, Canada. Ecol. Appl. 2012, 20, 151–162. [Google Scholar]
- Running, S.W.; Nemani, R.R. Relating seasonal patterns of the AVHRR vegetation index to simulated photosynthesis and transpiration of forests in different climates. Remote Sens. Environ. 1988, 24, 347–367. [Google Scholar] [CrossRef]
- Zhang, X.; Tarpley, D.; Sullivan, J.T. Diverse responses of vegetation phenology to a warming climate. Geophys. Res. Lett. 2007, 34, 1–5. [Google Scholar]
- Herrmann, S.; Anyamba, A.; Tucker, C. Recent trends in vegetation dynamics in the African Sahel and their relationship to climate. Glob. Environ. Change Part A 2005, 15, 394–404. [Google Scholar] [CrossRef]
- Kawabata, A.; Ichii, K.; Yamaguchi, Y. Global monitoring of interannual changes in vegetation activities using NDVI and its relationships to temperature and precipitation. Int. J. Remote Sens. 2001, 22, 1377–1382. [Google Scholar]
- Nemani, R.R.; Keeling, C.D.; Hashimoto, H.; Jolly, W.M.; Piper, S.C.; Tucker, C.J.; Myneni, R.B.; Running, S.W. Climate-driven increases in global terrestrial net primary production from 1982 to 1999. Science 2003, 300, 1560. [Google Scholar] [CrossRef]
- Churkina, G.; Running, S. Investigating the balance between timber harvest and productivity of global coniferous forests under global change. Clim. Change 2000, 47, 167–191. [Google Scholar] [CrossRef]
- Hall, R.J.; Raulier, F.; Price, D.T.; Arsenault, E.; Bernier, P.Y.; Case, B.S.; Guo, X. Integrating remote sensing and climate data with process-based models to map forest productivity within west-central Alberta’s boreal forest: Ecoleap-West 1. For. Chronicle 2006, 82, 159–176. [Google Scholar]
- Holmes, K. Forecasting impacts of climate change on indicators of British Columbia’s Biodiversity. MSc thesis, University of Victoria, Victoria, BC, Canada, 2012. [Google Scholar]
- Austin, M.A.; Buffett, D.A.; Nicolson, D.J.; Scudder, G.G.E.; Stevens, V. Taking Nature’s Pulse: The Status of Biodiversity in British Columbia; publisher: Victoria, BC, Canada, 2008; p. 268. Available online: http://www.biodiversitybc.org/ (accessed on 5 March 2013).
- Kerr, J.; Cihlar, J. Patterns and causes of species endangerment in Canada. Ecol. Appl. 2004, 14, 743–753. [Google Scholar] [CrossRef]
- Mote, P.W.; Parson, E.A.; Hamlet, A.F.; Keeton, W.S.; Lettenmaier, D.; Mantua, N.; Miles, E.L.; Peterson, D.W.; Peterson, D.L.; Slaughter, R.; et al. Preparing for climatic change: The water, salmon, and forests of the Pacific Northwest. Clim. Change 2003, 61, 45–88. [Google Scholar] [CrossRef]
- Coops, N.C.; Wulder, M.A.; Duro, D.; Han, T.; Berry, S. The development of a Canadian dynamic habitat index using multi-temporal satellite estimates of canopy light absorbance. Ecol. Indic. 2008, 8, 754–766. [Google Scholar] [CrossRef]
- Summary of the Park and Protected Areas System. BC Parks, Ministry of Environment. Available online: http://www.env.gov.bc.ca/bcparks/aboutBCParks/prk_desig.html/ (accessed on 5 March 2013).
- Coops, N.C.; Wulder, M.A.; Iwanicka, D. Demonstration of a satellite-based index to monitor habitat at continental-scales. Ecol. Indic. 2009, 9, 948–958. [Google Scholar] [CrossRef]
- Andrew, M.E.; Wulder, M.A.; Coops, N.C.; Baillargeon, G. Beta-diversity gradients of butterflies along productivity axes. Glob. Ecol. Biogeogr. 2012, 21, 352–364. [Google Scholar] [CrossRef]
- Pettorelli, N.; Vik, J.O.; Mysterud, A.; Gaillard, J.-M.; Tucker, C.J.; Stenseth, N.C. Using the satellite-derived NDVI to assess ecological responses to environmental change. Trends Ecol. Evol. 2005, 20, 503–510. [Google Scholar] [CrossRef]
- Berry, S.; Mackey, B.; Brown, T. Potential applications of remotely sensed vegetation greenness to habitat analysis and the conservation of dispersive fauna. Pac. Conserv. Biol. 2007, 13, 120–127. [Google Scholar]
- Liu, J.; Cihlar, J.; Chen, W. Net primary productivity distribution in the BOREAS region from a process model using satellite and surface data. J. Geophys. Res. 1999, 104, 27735–27754. [Google Scholar] [CrossRef]
- Huston, M. A general hypothesis of species diversity. Am. Soc. Nat. 1979, 113, 81–101. [Google Scholar]
- Tilman, D.; Wedin, D.; Knops, J. Productivity and sustainability influenced by biodiversity in grassland ecosystems. Nature 1996, 379, 718–720. [Google Scholar] [CrossRef]
- Los, S.O.; Collatz, G.J.; Bounoua, L.; Sellers, P.J.; Tucker, C.J. Global interannual variations in sea surface temperature and land surface vegetation, air temperature, and precipitation. J. Clim. 2001, 14, 1535–1549. [Google Scholar] [CrossRef]
- Shaver, G.R.; Chapin, F., III; Gartner, B.L. Factors limiting seasonal growth and peak biomass accumulation in Eriophorum. vaginatum in Alaskan tussock tundra. J. Ecol. 1986, 74, 257–278. [Google Scholar] [CrossRef]
- Breiman, L.; Friedman, J.H.; Olshen, R.A.; Stone, C.G. Classification and Regression Trees; Wadsworth International Group: Belmont, CA, USA, 1984. [Google Scholar]
- Wang, T.; Hamann, A.; Splittlehouse, D. ClimateWNA: A program to generate high-resolution climate data for climate change studies and applications in western North America. Available online: http://www.genetics.forestry.ubc.ca/cfcg/ClimateWNA/help.htm/ (accessed on 21 March 2011).
- Murdock, T.; Bürger, G. Research Plan for Regional Climate Impacts. Pacific Climate Impacts Consortium 2010. Available online: http://www.pacificclimate.org/ (accessed on 21 March 2011).
- Monserud, R.A.; Yang, Y.; Huang, S.; Tchebakova, N. Potential change in lodgepole pine site index and distribution under climate change in Alberta. Can. J. For. Res. 2008, 38, 343–352. [Google Scholar] [CrossRef]
- Mote, P.; Salathé, E.; Peacock, C. Scenarios of future climate for the Pacific Northwest. Climate Impacts Group. University of Washington, 2005. Available online: http://www.cses.washington.edu/db/pdf/kc05scenarios462.pdf (accessed on 5 March 2013).
- GeoBC British Columbia Data Distribution Service. Available online: https://www.apps.gov.bc.ca/pub/dwds/home.so/ (accessed on 29 July 2012).
- B.C. Ministry of Forests Biogeoclimatic Zones of British Columbia. Available online: http://www.for.gov.bc.ca/hfd/library/documents/treebook/biogeo/biogeo.htm/ (accessed 21 March 2011).
- Ministry of Environment. Preparing for Climate Change, British Columbia’s Adaptation Strategy; Government of British Columbia: Victoria, BC, Canada, 2010. Available online: http://www.livesmartbc.ca/attachments/Adaptation_Strategy.pdf (accessed on 5 March 2013).
- Lemieux, C.J.; Beechey, T.J.; Gray, P.A. Prospects for Canada’s protected areas in an era of climate change. Land Use Policy 2011, 28, 928–941. [Google Scholar] [CrossRef]
- Johnson, C.J.; Parker, K.L.; Heard, D.C.; Seip, D.R. Movements, foraging habits, and habitat use strategies of northern woodland caribou during winter: Implications for forest practices in British Columbia. JEM 2004, 5, 22–35. [Google Scholar]
- Food and Agriculture Organization. Assessing forest degradation: Towards the Development of Globally Applicable Guidelines; Food Resources Assessment Working Paper 177; Food and Agriculture Organization: Rome, Italy, 2011; p. 99. Available online: http://www.fao.org/docrep/015/i2479e/i2479e00.pdf (accessed on 5 March 2013).
- Flather, C.; Wilson, K. Identifying gaps in conservation networks: Of indicators and uncertainty in geographic-based analyses. Ecol. Appl. 1997, 7, 531–542. [Google Scholar] [CrossRef]
- Ministry of Lands Parks and Housing. Wells Gray Provincial Park Master Plan. Province of British Columbia: Victoria, BC, Canada, 1986; p. 55. Available online: http://www.env.gov.bc.ca/bcparks/planning/mgmtplns/wellsgray/wells_gray_mp.pdf (accessed on 5 March 2013).
- Ministry of Water, Land and Air Protection. Management Direction for Chopaka. East. Site, South. Okanagan Grasslands Protected Area; Province of British Columbia: Victoria, BC, Canada, 2003. Available online: http://www.env.gov.bc.ca/bcparks/planning/mgmtplns/s_okanpa/chopeast.pdf (accessed on 5 March 2013).
- Klanderud, K. Climate change effects on species interactions in an alpine plant community. J. Ecol. 2005, 93, 127–137. [Google Scholar] [CrossRef]
- Brink, V. A directional change in the subalpine forest-heath ecotone in Garibaldi Park, British Columbia. Ecology 1959, 40, 10–16. [Google Scholar] [CrossRef]
- Wang, T.; Campbell, E.M.; O’Neill, G.A.; Aitken, S.N. Projecting future distributions of ecosystem climate niches: Uncertainties and management applications. For. Ecol. Manag. 2012, 279, 128–140. [Google Scholar] [CrossRef]
- Williams Creek Ecological Reserve—Detailed Description. BC Parks, Ministry of Environment. Available online: http://www.env.gov.bc.ca/bcparks/eco_reserve/williamscrk_er.html/ (accessed on 5 March 2013).
- Kerr, J.T. Global Change Impacts on Biodiversity: The View from Canada. In Coast to Coast Seminar Series; Sage: Ottawa, ON, Canada, 2012. [Google Scholar]
- Garry Oak Ecosystems Recovery Team. Species at Risk. Available online: http://www.goert.ca/about/species_at_risk.php/ (accessed on 5 March 2013).
- Hamann, A.; Smets, P.; Yanchuk, A.; Aitken, S. An ecogeographic framework for in situ conservation of forest trees in British Columbia. Can. J. For. Res. 2005, 35, 2553–2561. [Google Scholar] [CrossRef]
- Species at Risk and Local Government. A Primer for British Columbia. Available online: http://www.speciesatrisk.bc.ca/ (accessed on 8 May 2012).
- Redfeldt, G.E.; Crookston, N.L.; Sáenz-Romero, C.; Campbell, E.M. North American vegetation model for land-use planning in a changing climate: a solution to large scale classification problems. Ecol. Appl. 2012, 22, 119–141. [Google Scholar] [CrossRef]
- Marmion, M.; Parviainen, M.; Luoto, M.; Heikkinen, R.K.; Thuiller, W. Evaluation of consensus methods in predictive species distribution modelling. Divers. Distrib. 2009, 15, 59–69. [Google Scholar] [CrossRef]
- Pearson, R.G.; Dawson, T.P. Predicting the impacts of climate change on the distribution of species: Are bioclimate envelope models useful? Glob. Ecol. Biogeogr. 2003, 12, 361–371. [Google Scholar] [CrossRef]
- Austin, M. Spatial prediction of species distribution: An interface between ecological theory and statistical modelling. Ecol. Model. 2002, 157, 101–118. [Google Scholar] [CrossRef]
- Heikkinen, R.K.; Luoto, M.; Araujo, M.B.; Virkkala, R.; Thuiller, W.; Sykes, M.T. Methods and uncertainties in bioclimatic envelope modelling under climate change. Progress Phys. Geogr. 2006, 30, 751–777. [Google Scholar] [CrossRef]
© 2013 by the authors; licensee MDPI, Basel, Switzerland. This article is an open access article distributed under the terms and conditions of the Creative Commons Attribution license (http://creativecommons.org/licenses/by/3.0/).