Article

Linking Spatio-Temporal Land Cover Change to Biodiversity Conservation in the Koshi Tappu Wildlife Reserve, Nepal

International Centre for Integrated Mountain Development GPO Box 3226, Kathmandu, Nepal
*
Author to whom correspondence should be addressed.
Diversity 2013, 5(2), 335-351; https://doi.org/10.3390/d5020335
Submission received: 4 February 2013 / Revised: 3 April 2013 / Accepted: 15 April 2013 / Published: 2 May 2013
(This article belongs to the Special Issue Biodiversity Loss & Habitat Fragmentation)

Abstract

:
Land cover change has been one of the major drivers of change leading to an alteration of critical habitats for many of the threatened species worldwide. Species with a narrow range and specialized habitats such as wetland ecosystems are at higher risk. The present paper describes spatial and temporal land use and cover change over the period of last 34 years (1976–2010) in the Koshi Tappu Wildlife Reserve (KTWR), Nepal. High spatial resolution Indian Remote-Sensing Satellite (IRS) Linear Imaging and Self Scanning Sensor (LISS-4) from 2005 and medium spatial resolution Landsat Multispectral Scanner (MSS) from 1976; Thematic Mapper (TM) from 1989; Enhanced Thematic Mapper Plus (ETM+) from 1999 and TM from 2010 were used to generate a land use/land cover map and change analysis. Acquired IRS LISS-4 and Landsat image was orthorectified into Universal Transverse Mercator (UTM), Zone 45 based on generated digital terrain model (DTM) from a topographic map and Ground Control Point (GCP) from the field. After rectifying all the images, eCognition developer software was used for object-based image analysis (OBIA). The change in the land cover and land use types were compared with the potential habitat of twenty globally significant species present in the reserve. The habitat information was collected from the literature and a map was prepared based on ‘presence’ data, habits and habitats used to identify their distribution pattern. The analysis revealed that the KTWR has gone through significant changes in land cover and ecosystems over the last 34 years due to the change in river course and anthropogenic pressure leading to direct change in habitats of the species. Forests have been reduced by 94% from their original state whereas the grassland has increased by 79% from its original state. On the basis of total land cover, forests, river and stream, swamp and marshes decreased by 16%, 14% and 3% respectively over the last 34 years whereas the grassland has increased by 45%. These ecosystems are also an important habitat for the majority of the species, which is resulting in habitat loss. Notably, the wetland ecosystems (marshes/swamps and river/streams), being one of the most important habitat for many globally threatened species, have changed by more than 30% from their original state in 1976. Based on the analysis, recommendations for management interventions were made.

Graphical Abstract

1. Introduction

The land use and cover change influence the distribution and dynamics of terrestrial biodiversity, ecosystem structure and functioning [1,2,3] leading to alternation of ecosystems [4] and critical habitats for many of the threatened species worldwide including freshwater ecosystems [5,6,7,8]. Habitat loss and fragmentation are among the major threats to wildlife populations because the loss of habitat reduces the carrying capacity of the ecosystems, and fragmentation disrupts biological processes and exposes wildlife populations, especially the species with narrow range and specialized habitats [7,9]. By 2100, the impact of land use change on biodiversity is likely to be more significant than climate change, nitrogen deposition, species introductions and changing atmospheric concentrations of carbon dioxide on a global scale [10,11]. This has a strong implication on conservation and management of protected areas at global, regional and national levels, which are the store house and repository of a wide range of biodiversity [12,13,14,15].
Turner et al. [3] have argued that ‘land change science’ has now emerged as a central component of global environmental and sustainability research. However, the majority of the literature on ‘land change science’ is in land use patterns either by converting the natural land into human use or changing management practices of human-dominated ecosystems [16,17,18,19]. There are very little documentations on the change in land cover by natural processes and their consequences on biodiversity [20,21,22,23]. More importantly, it is a paradox that in spite of being highly rich ecosystem, the wetlands are poorly studied [24] and are being over-used, underrepresented in protected areas, and having the highest portion of species threatened with extinction [7].
In the recent years, Remote Sensing data and Geographical Information System (GIS) have been widely used in conservation planning [25,26,27]. Beyond the mapping of land cover and its impact on biodiversity, the capability now exists to monitor many of the physical and biological characteristics of the land and the impacts of habitat fragmentation and the interactions between landscape patterns and ecological processes [28,29,30]. In our present study, an attempt has been made to observe the spatio-temporal changes of land cover and ecosystems on biodiversity in the Kosi Tappu Wildlife Reserve (KTWR), one of the most diverse wetland ecosystems of eastern Nepal. The main objective of the study was to look at the land cover and ecosystem changes due to natural process of river course change and its potential impacts on the biodiversity of the reserve.

2. Methods

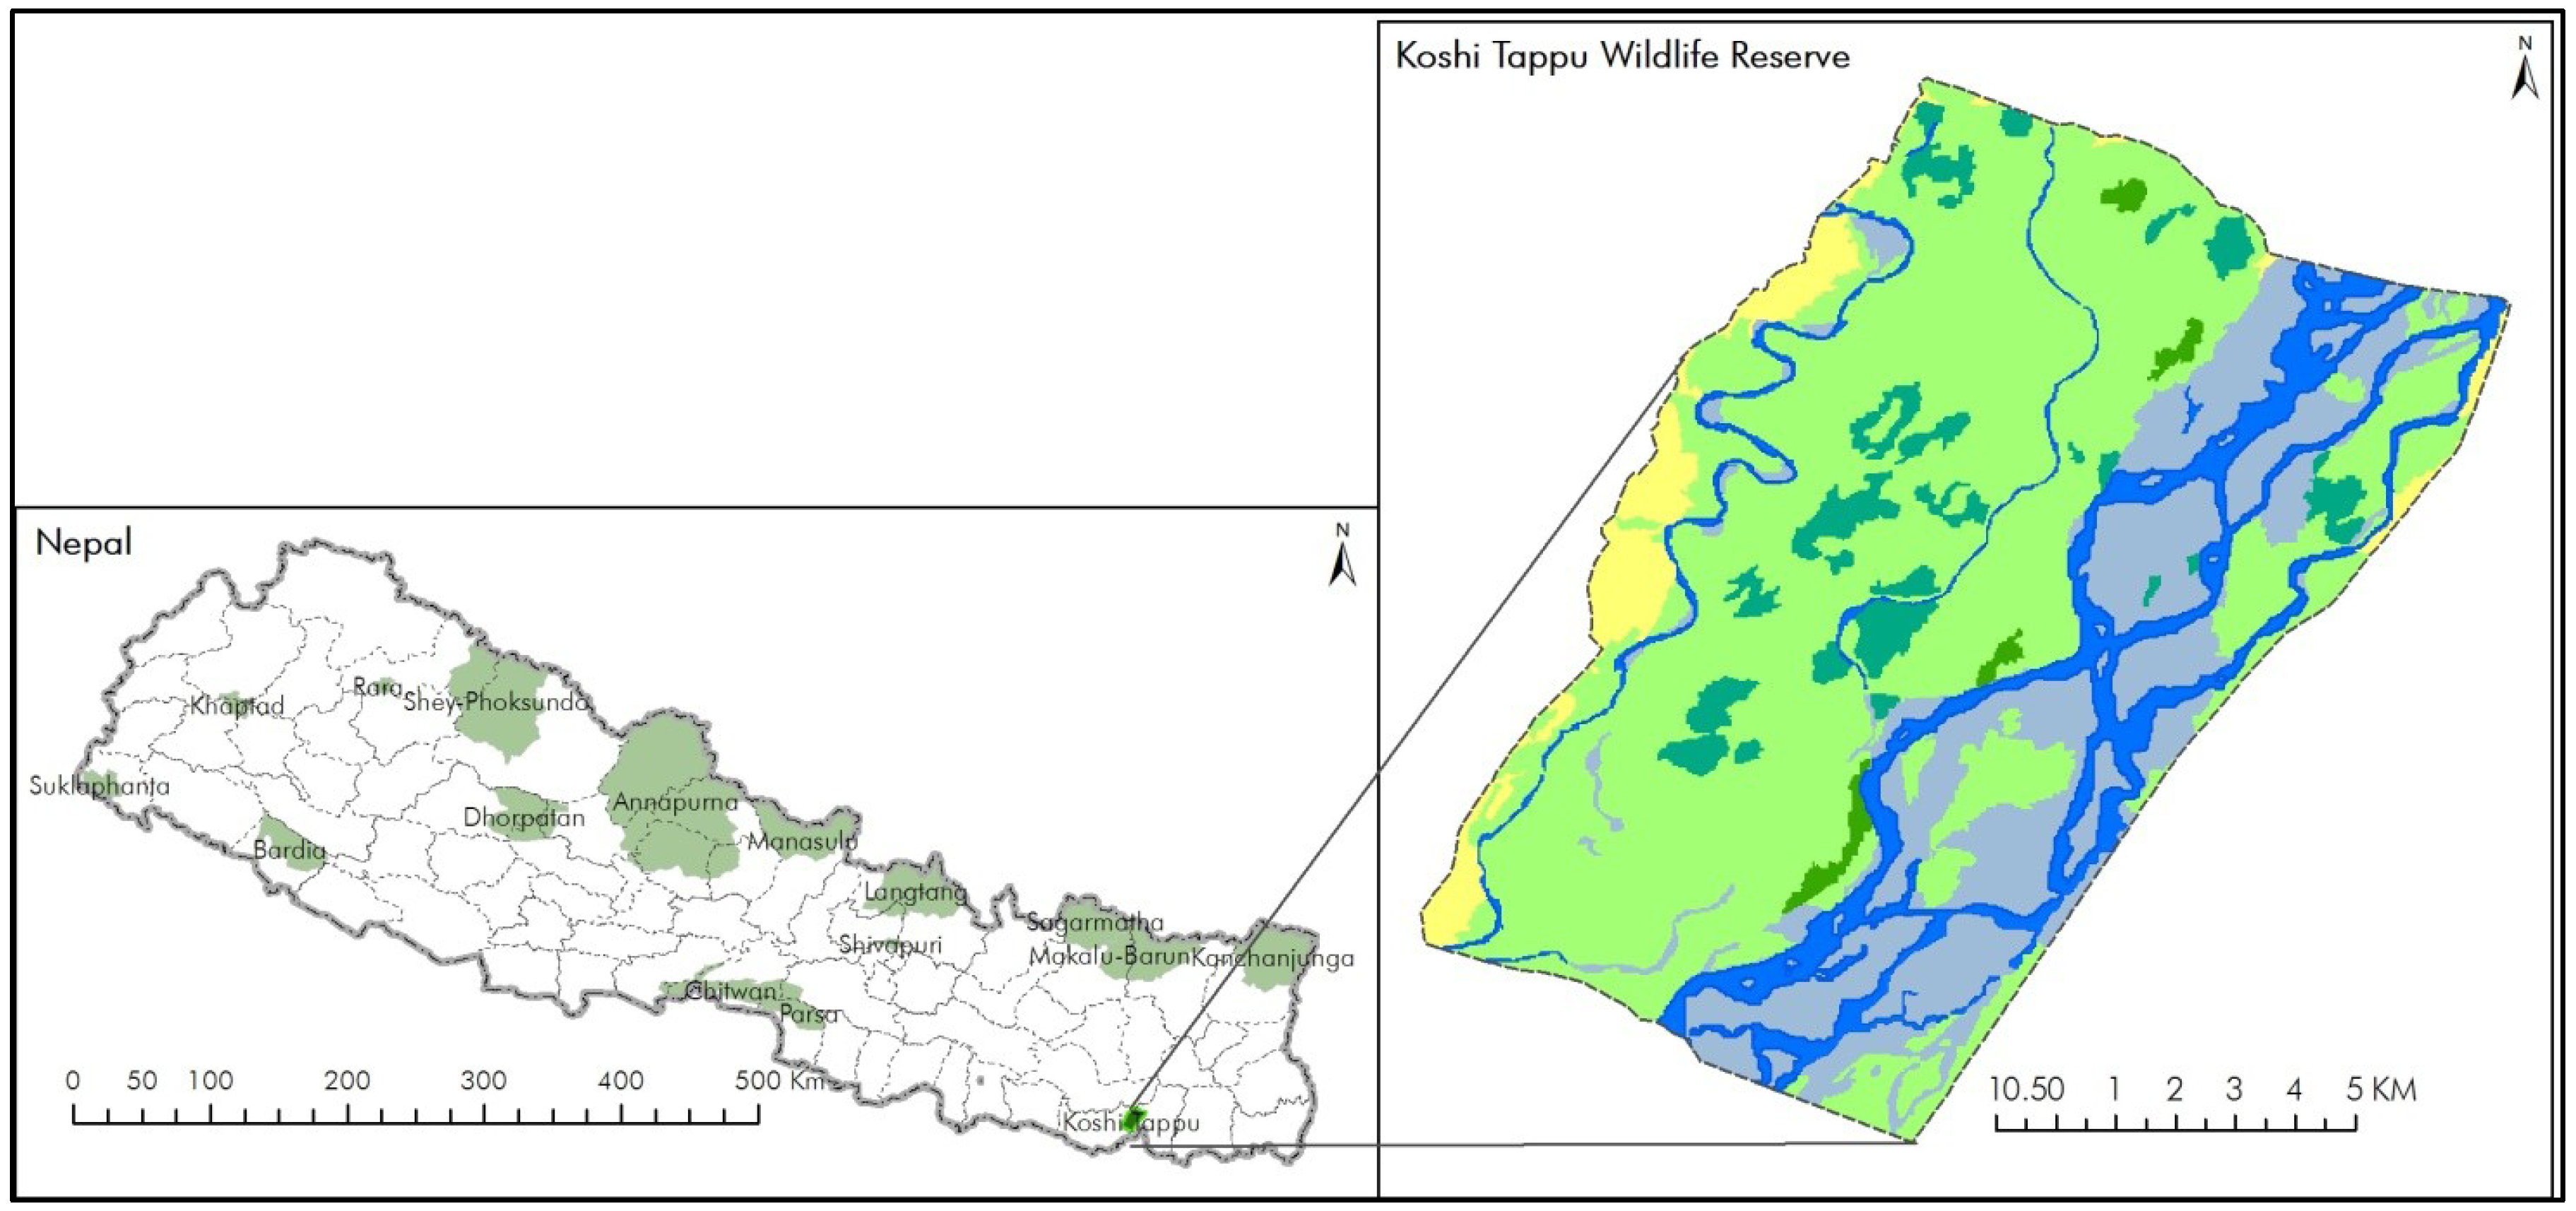
2.1. Site Description

Situated between 86°91'–87°08'E and 26°72'–26°56'N, the Koshi Tappu Wildlife Reserve (KTWR) is one of the most important wildlife reserves in Nepal (Figure 1). The reserve, a protected area established in 1976 under IUCN category IV, spreads over an area of 175 square kilometers [31]. It is the habitat for the last remaining population of Wild Water Buffalo (Bubalus bubalis arnee), and was also designated as a wetland of international importance by the Ramsar Convention in 1987 for its special value in maintaining the genetic and ecological diversity of the region [31]. Located in the floodplains of Sapta Koshi, KTWR is a freshwater, natural and permanent river system, rich in biodiversity with 670 species of vascular plants [32], 21 species of mammals [33], 23 species of herpetofauna [34], 77 species of butterflies [35], 494 species of birds [36] and is habitat for a large number of globally and nationally threatened species [37]. The reserve is also designated as one of the Important Bird Areas of Nepal with habitat for a number of endangered bird species such as Swamp Francolin (Francolinus gularis) and Bengal Florican (Houbaropsis bengalensis) etc. [38]. The wetland is also home to Ganges River Dolphin (Platanista gangetica), Gharial (Gavialis gangeticus) and Smooth Coated Otter (Lutrogale perspicillata). These globally important species play a vital role in maintaining the ecological integrity of the area.
Figure 1. Location of the Koshi Tappu Wildlife Reserve (KTWR).
Diversity 05 00335 g001
The KTWR is surrounded by 16 Village Development Committees (VDCs) bringing challenges due to high dependency on ecosystems for goods and services, flooding and sand casting, and crop damage by wildlife (Figure 1). The ecosystem goods and services have greatly contributed to local people’s livelihoods and the local economy showing strong linakge between the protected area and local livelihoods [39]. The water resources from the KTWR are used for irrigation, fishing, grazing, religious rituals, and collection of non-timber products. The reserve also provides regulating and supporting services such as carbon sequestration, ground water recharge, flood control etc., which help stabilize the local climate contributing to the regional as well as the global climate regulation. Interestingly, the reserve has diverse land cover types, which are used by many globally significant species. Despite the flow of goods and services and the vital ecological and economic importance of these ecosystems, they have continuously been degrading [40]. However, little effort has been made to understand the linkages between the dynamic nature of ecosystems and their consequences to the biodiversity of the reserve [37].

2.2. Land Covers Change Analysis

Remote Sensing data from 1976, 1989, 1999 and 2010 covering the KTWR core area were used for the decadal spatio-temporal land cover change over the period of 34 years and its impact on biodiversity (Table 1). High spatial resolution Indian Remote-Sensing Satellite (IRS) Linear Imaging and Self Scanning Sensor (LISS-4) of 2005 and medium spatial resolution Landsat Multispectral Scanner (MSS) of 1976; Thematic Mapper (TM) of 1989 and 2010; Enhanced Thematic Mapper Plus (ETM+) of 1999 were used to generate a land use/land cover map and change analysis. Landsat MSS, TM and Enhanced Thematic Mapper Plus (ETM+) imagery were accessed from USGS Global Visualization Viewer [41] whereas Shuttle Radar Topography Mission (SRTM) Digital Elevation Model was accessed from Consultative Group on International Agricultural Research (CGIAR)-Consortium for Spatial Information (CSI) GeoPortal [42].
Table 1. List of Landsat imagery considered for analysis.
Sl NoSatelliteSeniorPathRowAcquisition date
1LandsatMSS1504213 November 1976
2LandsatTM1404017 January 1989
3LandsatETM+1404028 October 1999
4LandsatTM1404004 February 2010
Acquired IRS LISS-4 and Landsat image was orthorectified into Universal Transverse Mercator (UTM), Zone 45 based on generated digital terrain model (DTM) from a topographic map and Ground Control Point (GCP) from the field. After rectifying all the images, eCognition developer software was used for object-based image analysis (OBIA). The OBIA provides a methodological framework for machine-based interpretation of complex classes, defined by spectral, spatial, contextual as well as hierarchical properties yields better classification results with higher degree of accuracy compared to pixel-based methods, as it uses both spectral and spatial information [43]. A hierarchical classification scheme was used with six major land classes based on Land Cover Classification System (LCCS) following Di Gregorio [44]. This was necessary to harmonize the land use and cover legends with global standards [45]. The major land cover classes considered were forest, agriculture, grassland, marshes and swamps, river and streams and sand and gravels. To classify these classes, the “multiresolution segmentation” algorithm was used, which consecutively merges pixels or existing image objects that essentially identifies single image objects of one pixel in size and merges them with their neighbors, based on relative homogeneity criteria [46]. Multiresolution segmentations are those groups of similar pixel values, which merge the homogeneous areas into larger objects and heterogeneous areas in smaller ones [47].
During class modeling, information on spectral values, vegetation indices like the Normalized Difference Vegetation Index (NDVI), a Land Water Mask created through band ratio and texture information were used. NDVI is a standardized index allowing generating an image displaying greenness (relative biomass). Index values can range from −1.0 to 1.0, normally an area containing a dense vegetation canopy will tend to positive values (say 0.3 to 0.8), while clouds and snow fields will be characterized by negative values of this index. In a pre-processing stage, the NDVI image was created using customized features applying the formula: NDVI = (RED – IR)/(RED + IR). The land and water mask was created using the formula IR/Green*100. Land and water mask index values can range from 0 to 255, but water values typically range between 0 and 50.The next step was to label those image objects according to their attributes, such as NDVI, Land and water mask, layer value and color and relative position to other objects using user-defined rules. Objects with an area smaller than the defined minimum mapping unit were merged with other objects. The classified land cover map was also exported to a raster file format for correlation with the species presence/absence data. The overall research design is presented in Figure 2.
Figure 2. Flow diagram of study design.
Diversity 05 00335 g002

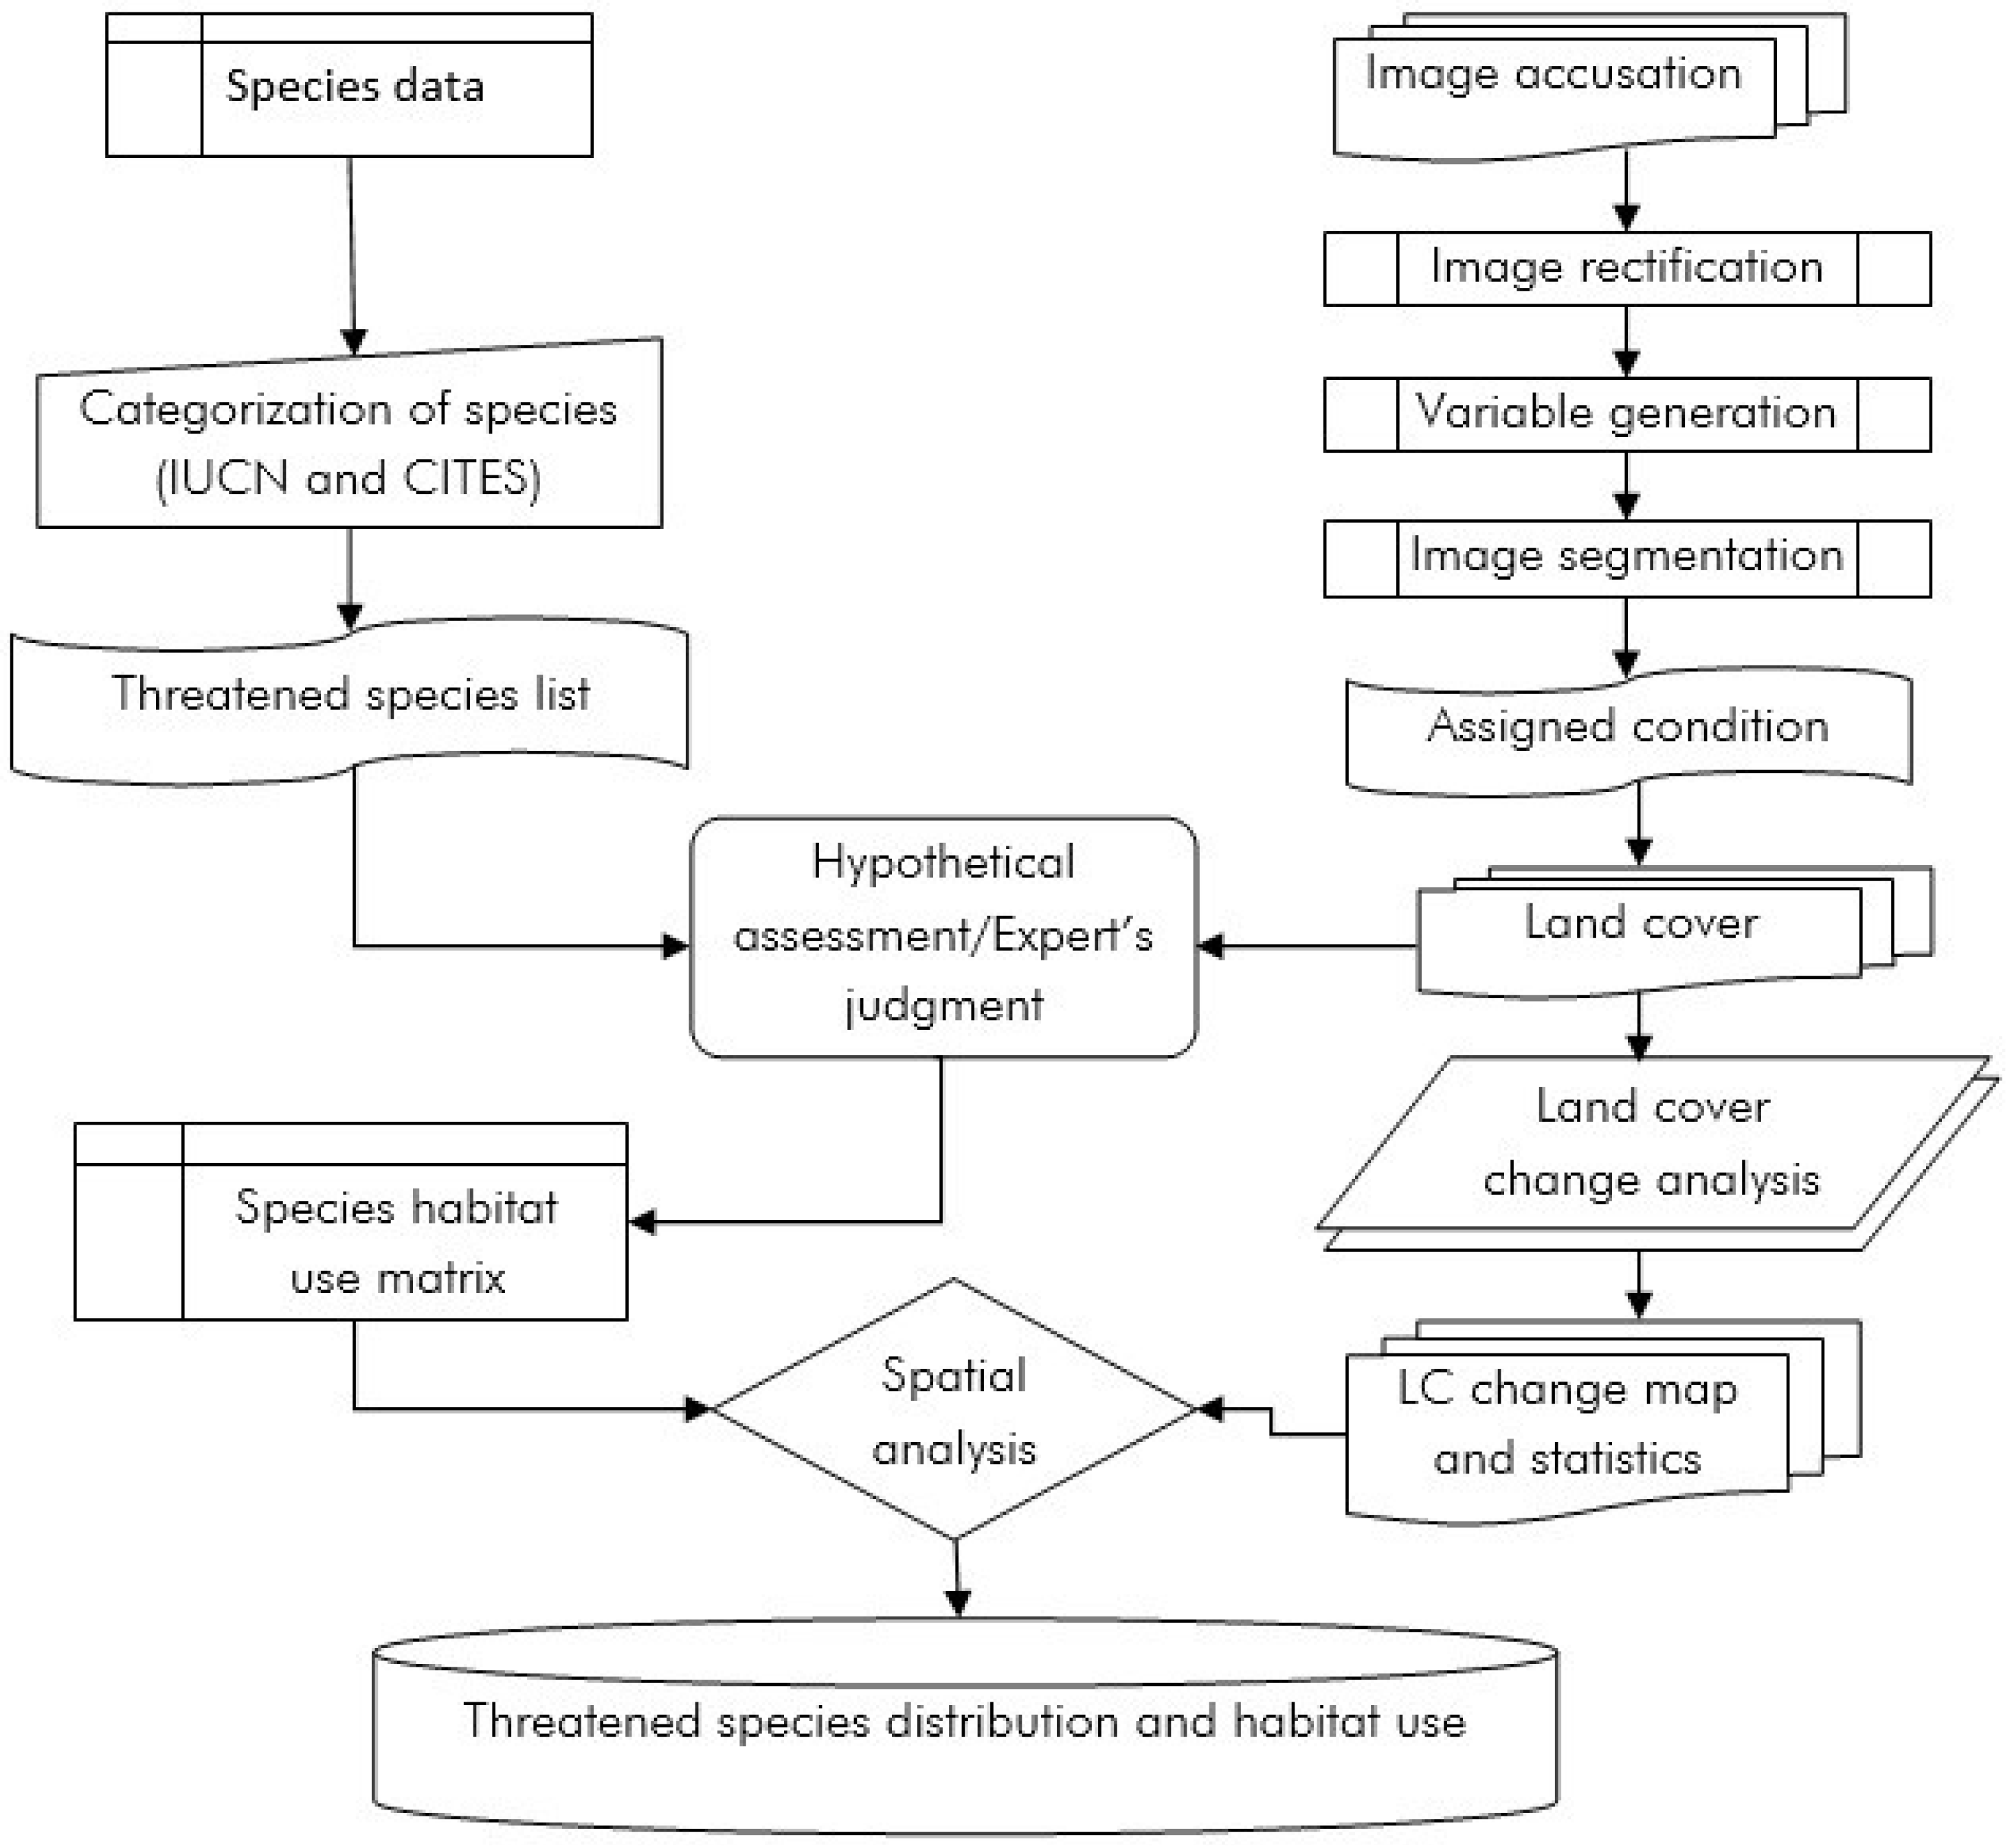
2.3. Habitat Mapping

Based on IUCN Red List and CITES list, 19 globally significant species in terms of their conservation values such as Endangered (EN), Vulnerable (VU), Critically endangered (CR) and near Threatened (NT) corresponding to their CITES status were enlisted for KTWR from the secondary sources and considered in matrix analysis. We also included the representative species of migratory birds as KTWR, which is one of the most important habitats for migratory birds including others. In the matrix, six broad land cover types or ecosystems such as Grassland, Swamps/Marshes, Forest, Rivers/Lakes, Sand and Gravel and Agriculture were considered for habitat mapping. Based on the habitat preference and use pattern, species were assigned presence in a particular habitat (+) or absence (-) as shown in Table 2. For instance, if a certain species such as Wild Water Buffalo uses a certain land cover of ecosystems such as grassland, swamps/marshes or rivers/lakes, then a point (+) is given to those specific land uses. If a certain land use (such as gravel and sand) is not used by the Wild Water Buffalo, then (-) is given to that particular landuse or ecosystems. These catagorization was then validated through experts judgement in a focus group discussion among the experts. At the end, the use and non-use values were weighted as one (1) for use and zero (0) for non use and added the values of 19 enlisted species.
Table 2. Species Habitat Matrix of the Koshi Tappu Wildlife Reserve, Nepal.
SpeciesStatusLand use
IUCNCITESGrasslandSwamps/MarshesForestsRivers/LakesSand/gravelsAgri-culture
Wild Water Buffalo (Bubalus bubalis arnee)ENIII++ +
Ganges River Dolphin (Platanista gangetica)VUI +
Black Giant Squirrel (Ratufa bicolor)NTI+ +
Hog Deer (Axis porcinus)ENI+ +
Smooth Coated Otter (Lutrogale perspicillata)VUII +++
Fishing Cat (Prionailurus viverrinus)ENII +++
Asiatic Elephant (Elephas maximus)ENI+++
Indian Bison or Gaur (Bos gaurus)VUI+ +
Spotted Leopard (Panthera pardus)NTI+ +
Gharial (Gavialis gangeticus)CRI + +
Mugger Crocodile (Crocodylus palustris)VUI + +
Rock Python (Python molurus)NTII+++++
King Cobra (Ophiophagus hannah)VUII+++
Red-crowned Roof Turtle (Kachuga kachuga)CRII++++
Elongated Tortoise (Indotestudo elongata)ENII++++
Indian Softshell Turtle (Aspederetes gangeticus)VUI + +
Greater Adjutant (Leptoptilos dubius)EN +++ +
Pallas’s Fish Eagle (Haliaeetus leucoryphus)VUII +++
Bengal Florican (Houbaropsis bengalensis)CRI++
Swamp Francolin (Francolinus gularis)VUIII++++ +

3. Results

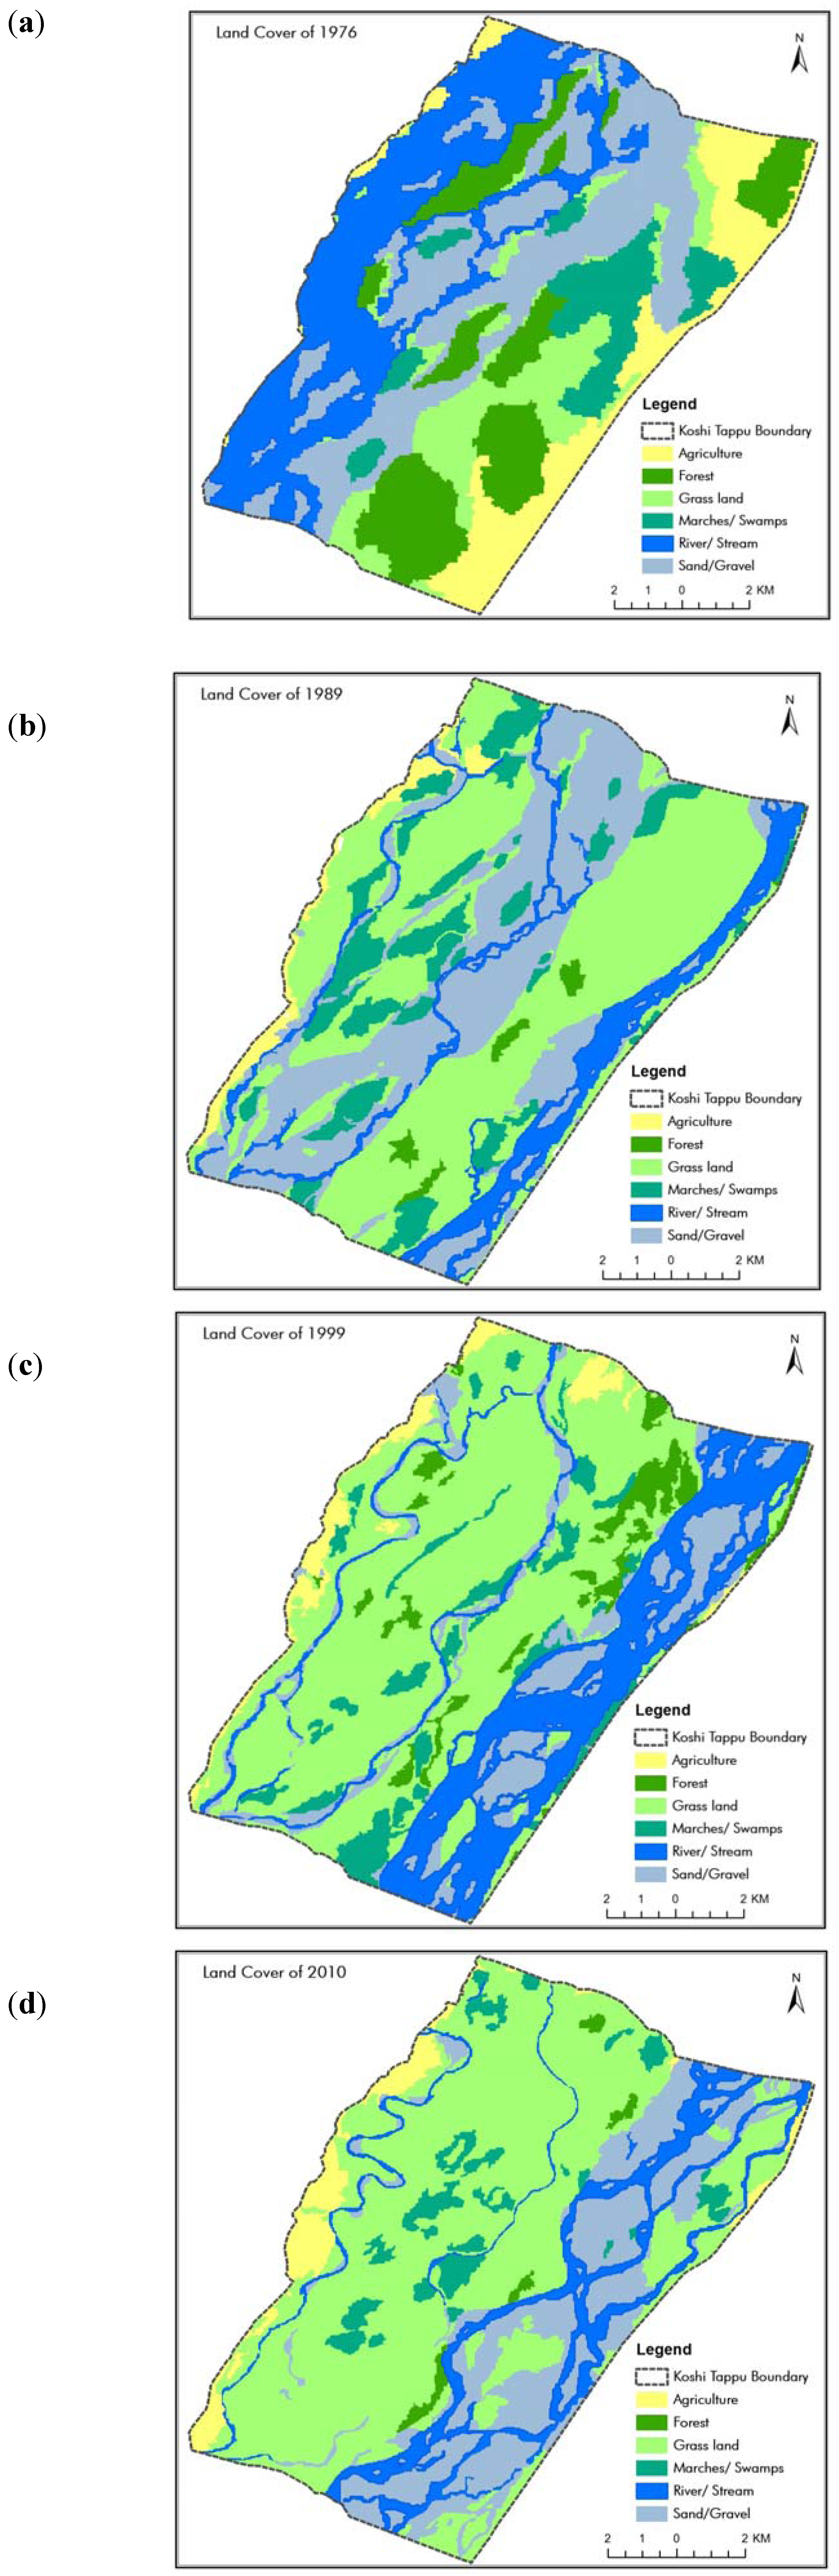
3.1. Land Cover Change

As per the 2010 data analysis, the KTWR showed six major land cover types with some predominant ecosystems such as grassland, forest, freshwater, marshes, etc. (see Figure 3a). The time series land use and cover change analyses (1976–2010) brought some interesting facts about the dynamic ecosystems of the KTWR. The first observation was on course change of the river from west to east (see Figure 3). During the shift over the last 34 years, significant changes on the land use and ecosystem types have been observed. In 2010, the forested ecosystems have reduced by 94% compared to 1976 covering only 150 hectares of its original state of 1853 hectare whereas the grassland has increased by 79% of its original state 1716 hectares (Table 3). On the basis of total land cover, forests, river and stream, swamp and marshes decreased by 16%, 14% and 3% respectively over the last 34 years whereas the grassland has increased by 45% (Figure 3). These ecosystems are also important habitat for majority of the species resulting to habitat loss. Interestingly, the wetland areas such as marshes/swamps and river/stream, the most important habitat for majority of species including migratory birds, have reduced by more than 30% of their original state (Table 3).
Table 3. Land use and land cover change over 34-year time period. The unit area is in hectare and the numbers in parenthesis are the percentage of the total land cover.
Land cover and ecosystems1976198919992010Change between 1976-2010
Agriculture1853 (12)408 (3)608 (4)774 (5)−1079 (−7.2)
Forest 2507 (17)180 (1)736 (5)150 (1)−2357 (−15.7)
Grassland1716 (11)6632 (44)7744 (51)8409 (56)+6693 (+44.5)
Lake/pond1 (0.01)9 (0.06)2 (0.01)2 (0.01)+1 (+0.01)
Marshes/swamps1282 (9)1877 (13)1087 (7)822 (6)−460 (−3.06)
River/stream3620 (24)1428 (9)2567 (17)1546 (10)−2074 (−13.8)
Sand/gravel 4066 (27)4512 (30)2301 (15)3342 (22)−724 (4.8)
Total 15045150451504515045

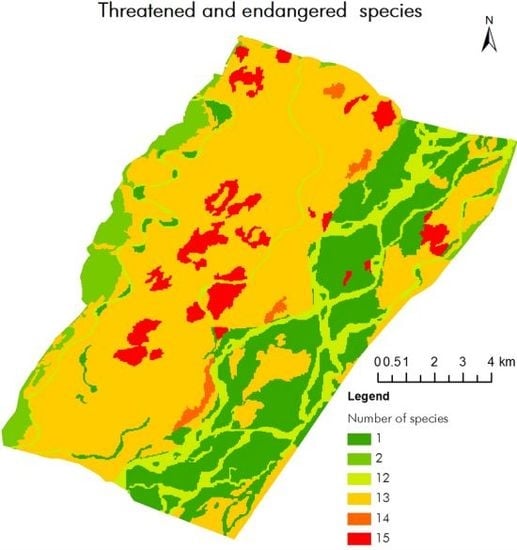
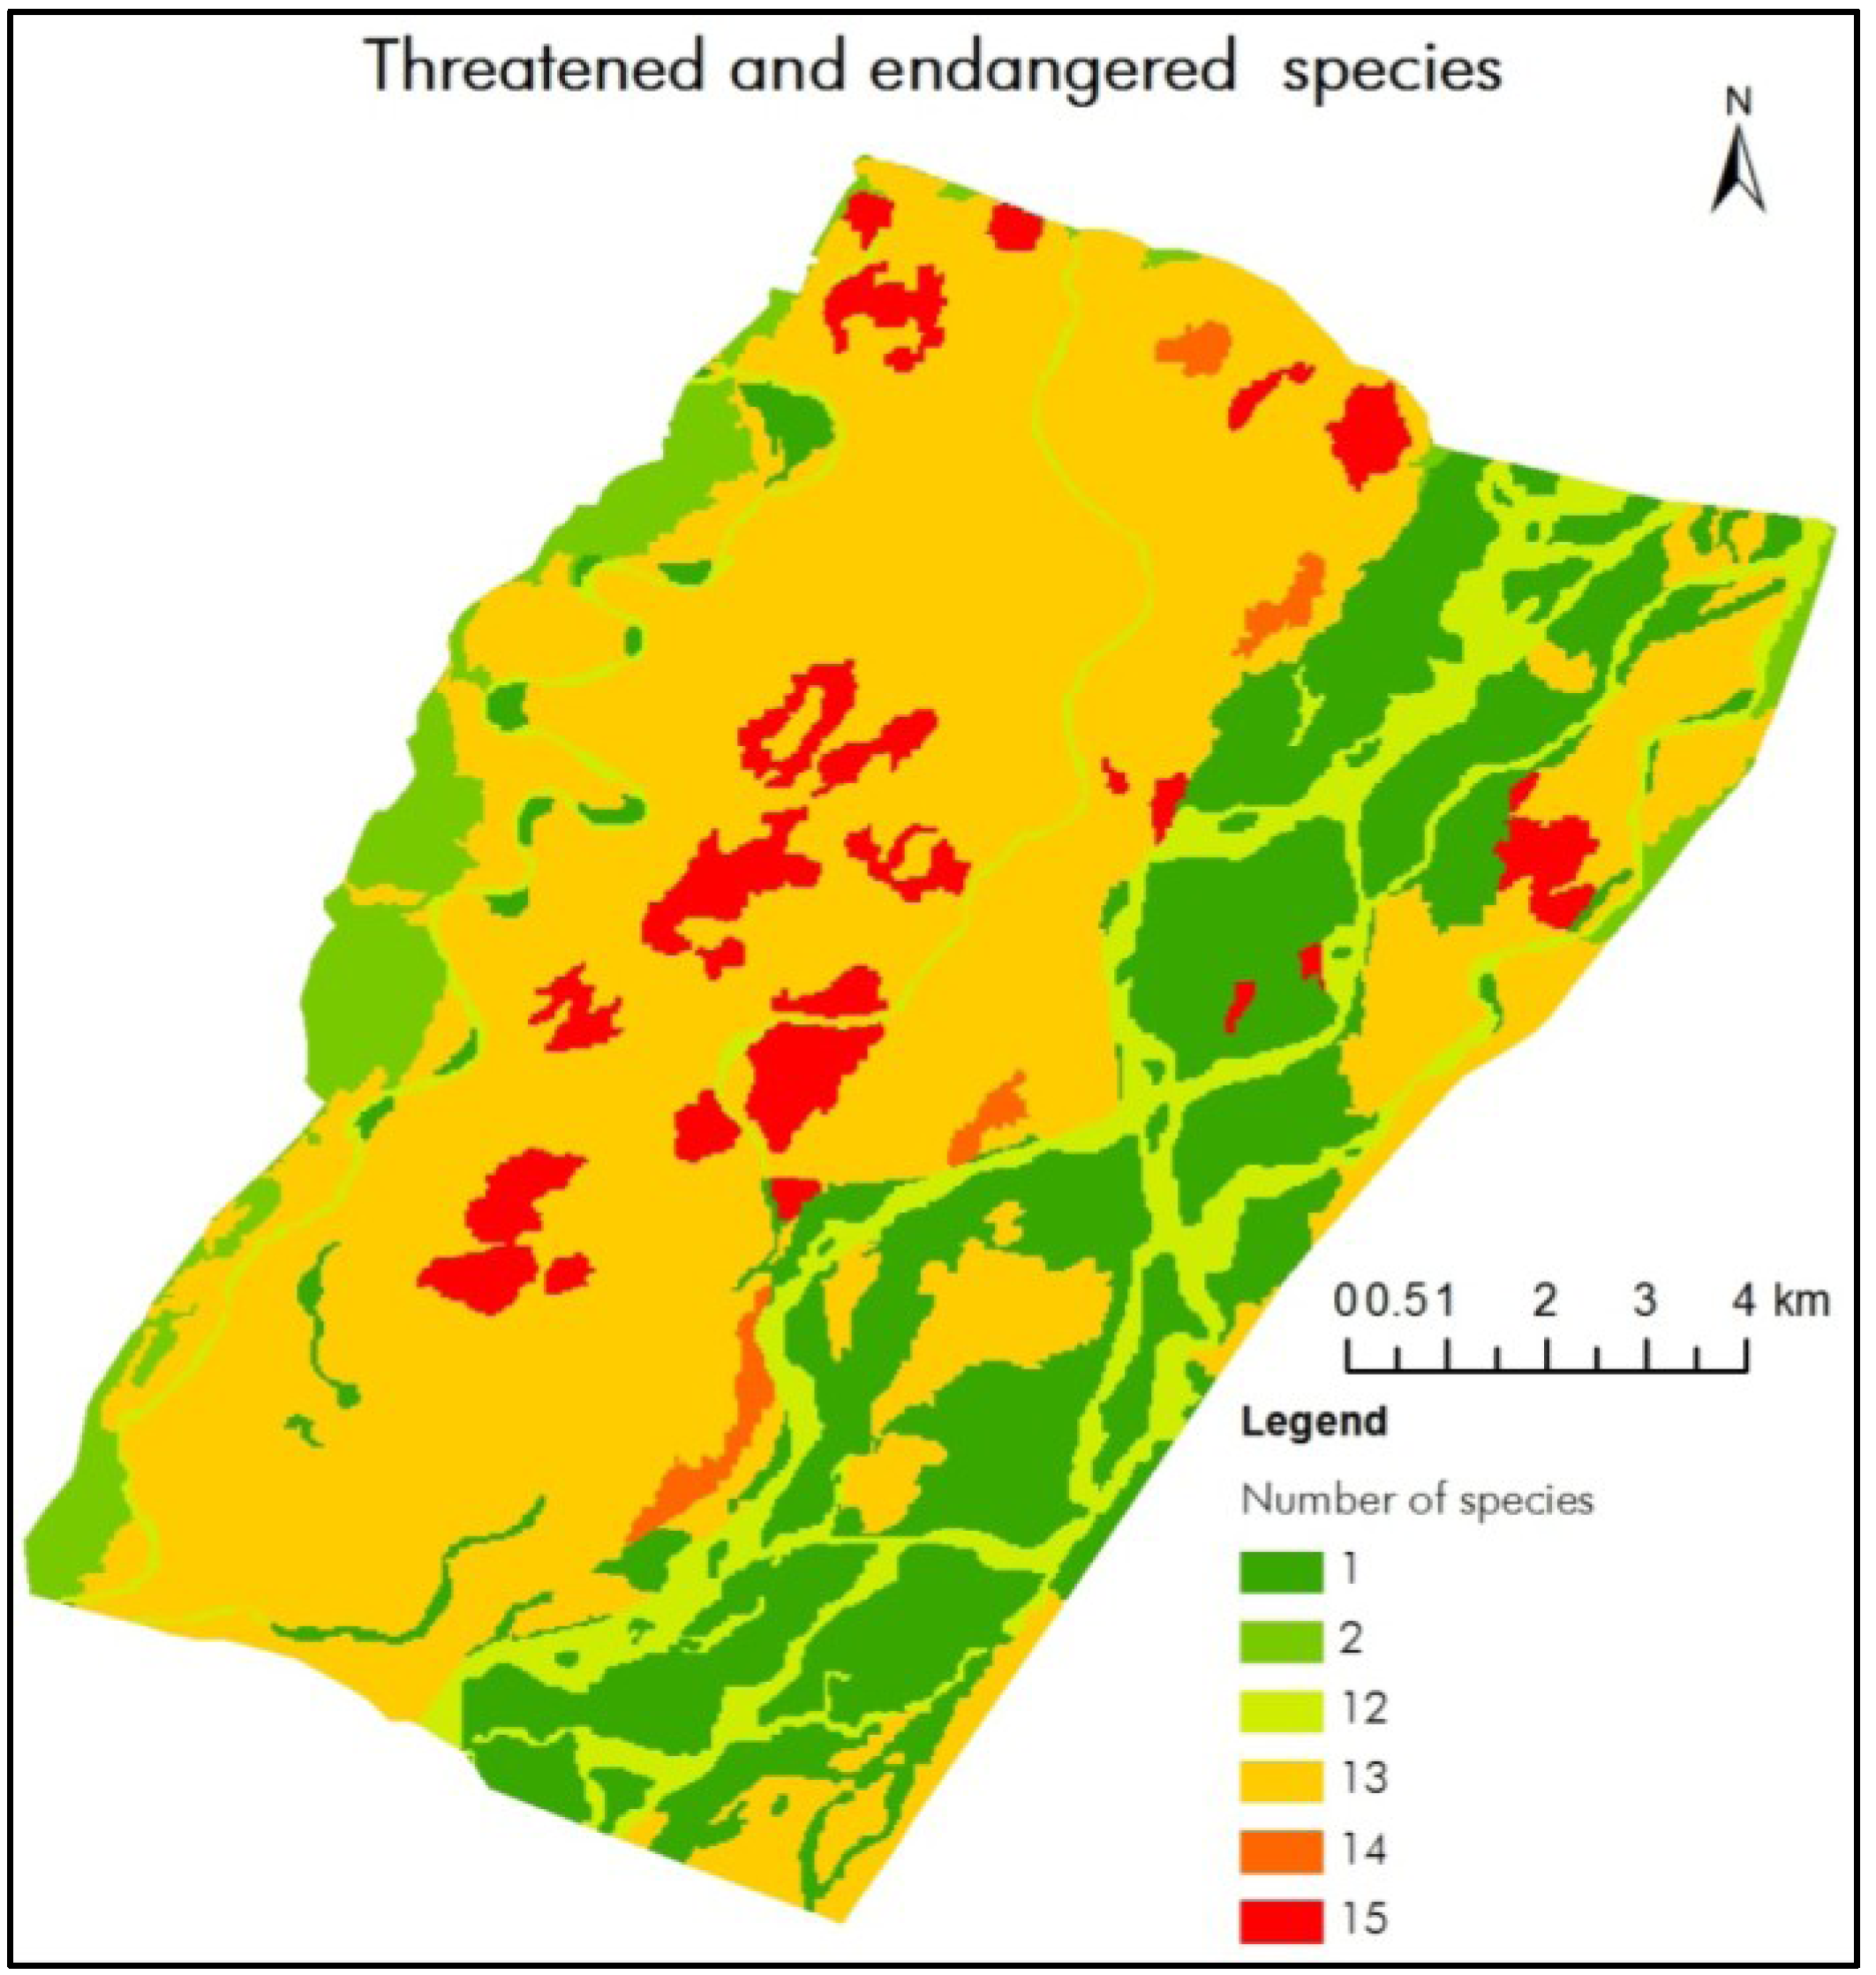
3.2. Distribution Pattern of Threatened Species

The land cover/ecosystem and habitat matrix showed that majority of species use a wide variety of land cover or ecosystems and in many cases they are overlapping. For example, Rock Python (Python molurus), Red-crowed Roofed Turtle (Kachuga kachuga), Elongated Tortoise (Indotestudo elongate), Greater Adjutant (Leptoptilos dubius) and Swamp Francolin were reported from more than three land cover types or ecosystems. On the other hand, there were many species with narrow habitat choices. Gharial Crocodile and Mugger Crocodile were restricted to swamps/marshes and river/lakes. Likewise the Wild Water Buffalo, Indian Bison and Bengal Florican showed narrow habitat choice. In the matrix analysis, swamps/marshes scored the highest species number with 15, followed by forest (14), river and lake (13) and grassland (12) and the least by agriculture (2). It was observed that forested ecosystems of the KTWR are one of the most important habitats used by 15 globally significant species followed by river and lakes and grassland. These matrix ranking values were then converted to the raster maps prepared for land cover of 2010 to show their potential richness (number of species) to each of the ecosystems types defined earlier (Figure 4).
Figure 3. Sets of maps showing land use and cover changes in the Koshi Tappu Wildlife Reserve during 1976 to 2010. (a). Land cover in KTWR 1976; (b). Land cover in KTWR 1989; (c). Land cover in KTWR 1999; (d). Land cover in KTWR 2010.
Diversity 05 00335 g003
Figure 4. Map showing distribution and habitat use pattern by 20 threatened species in KTWR.
Diversity 05 00335 g004

3.3. Land Cover Change and Its Potential Impact on Biodiversity

The KTWR is home for many globally threatened species (Table 2). Swamp and marshes; forests, grassland and freshwater ecosystems are important habitats for majority of the species. The decadal change analyses have already revealed that these ecosystems have significantly changed over the last 34 years, which are also the most important habitats for species of global importance. The changes have brought remarkable alternation in the habitats of these species. Forested ecosystem has witnessed the most significant loss over the last 34 years followed by the wetland ecosystems such as marshes/swamps and rivers/streams. Moreover, the decreasing ecosystems such as forests and swamp/marsh are also the highly used habitats by a number of key faunal communities. It is also interesting to note that in 2010, the river/streams covering 10% of the total area of the KTWR, and swamp/marsh land with 6% of the total land are important habitats for majority of species (Table 3). Reductions on the total area of these habitats are bringing challenges for the long term conservation of species, which are exclusively dependent in such habitats. The concern is more serious for species that use the wetlands as their primary habitat. Similarly, forested ecosystems with only about 1% coverage in 2010 are also habitat for many threatened species. This means that the ecosystems with decreasing trend has a direct impact on the habitats of these threatened species. As a result, the conservation and reserve management challenges have also increased due to the dynamic nature of ecosystems manifested by changing of the river course.

4. Discussion

Understanding the nexus between ecosystem change and biodiversity is important but complicates by lack of data on the extent to which these ecosystems are currently managed and conserved. The Millennium Ecosystems Assessment [7] revealed that only 12% of the world’s inland waters are in protected area network. The World Database on Protected Area records the extent of marine and terrestrial biomes in protected areas but the only freshwater category is “lake systems”, with 1.54% coverage [48]. At best, existing data suggest that freshwaters have been mostly excluded from protected designations [49].
Government of Nepal has initiated the documentation of wetland since 1992 [50] and the preliminary list accounted for more than 5,000 lakes, 1,380 reservoirs, and 5,183 village ponds in the country [51,52]. Among these wetlands, the Government has designated nine important wetlands as Ramsar sites covering about 35,000 hectares of its territory. According to IUCN inventory, there are 163 wetlands in Terai [53]. The KTWR is the first Ramsar site in Nepal [31]. History of the reserve shows dense riverine forest and tall grasses, which served as a habitat for large carnivores like Tigers (Panthera tigris) and Spotted Leopards (Panthera pardus). Between 1958 and 1964, a barrage was constructed on the river under the Indian aided Koshi Project. Eastern and western embankments bounded the river floodplain, thereby restricting the water from flooding agricultural fields during the monsoons. Subsequently, many large carnivores also disappeared from the area due to continuous degradation of the forested habitat as a result of changes in the river course [54], and the continuous utilization of the area for fuel wood, fodder and livestock grazing by the growing human population in surrounding villages [55].
In the recent years, the geospatial tools have became an important breakthrough for tracking such changes in wetland ecosystems [56,57]. Our observation on land cover and ecosystems revealed the dynamic nature of the KTWR. It was observed that after the notification of KTWR in 1976, there has been significant reduction on agricultural practices prevailed in the area. However, there are still some patches of agriculture land observed in the western part of the reserve which is encroached as the boundary is not very well maintained and the river course also keeps changing [55]. The river course change brought some significant changes on critical ecosystems such as forests and marshes/swamps and others. The Koshi River, which was earlier shifting gradually, changed its course dramatically during the monsoon of 2008 swinging from the main channel to the eastern part of the reserve in the settlement area by making a 2 km breach in the Kusaha VDC (see Figure 3c,d). This sudden shift in the course of Koshi River has had a dramatic change in the physical landscape. Large track of forest and grassland has been totally washed away and many surrounding agricultural land were covered with sand making them unproductive. KTWR has from the beginning faced tremendous anthropogenic pressure and continues to do so. The flood of 2008 further complicated the problem as the Reserve had to cope with all the externalities ranging from temporary settlement, fuel wood and fodder supply, excessive use of local resources and the construction and repair work of the embankment.
Wetland degradation due to human induced disturbances is becoming a common issue in the Himalaya [57,58,59]. In many cases the critical ecosystems such as water bodies, marshy land and forested areas are degrading [57,58,60]. Unlike the ecosystems changes in wetland elsewhere, KTWR faces additional challenges from the dynamics of river course change, which is a big management challenge for the authority of this protected area. Though systematic species level ecological studies and biodiversity status in the KTWR are limited [55,61,62,63,64,65,66], and the management has been facing numerous challenges, the wildlife of the KTWR have shown improvement [55]. Even being one of the smallest protected areas in the country, KTWR provides habitat for a number of endangered species. But the decreasing trend in the original habitats for species such as Wild Water Buffalo, Asiatic Elephant (Elephas maximus), Indian Bison (Bos gaurus) and Spotted Leopard and isolation from the nearby population from the protected areas pose a serious threat for long term conservation [55]. The management challenges are numerous compounded by the river dynamics. Human pressure is increasing and the demand for resources from the reserve also increasing. Habitats for the globally significant species are shrinking and in some cases, the rate is increasing. In the recent years, the remaining forested areas are highly infected by various invasive species including Mikania micrantha. Therefore, managing KTWR as protected area in isolation is becoming difficult.
From present results, it is evident that KTWR is an important wetland habitat as well as important Ramsar site. The challenges are multiple manifested by climate changes and other drivers of change. Poverty still plays an important role in making local people more dependent on the resources of the KTWR. Therefore, there is an urgent need of system thinking and more serious interventions in poverty alleviation. It is also important to have a regular monitoring of species distribution, population and impacts of floods on the habitats and species. Though the park management regularly conduct species census, they are mostly targeted for higher species such as Wild Water Buffalo. More intensive and regular monitoring for other species including extension of invasive species and their impacts on native species are desirable. Moreover, integrated approach and alternative livelihood options for the people who are dependent of the KTWR have to be designed and implemented.
ICIMOD in partnership with Wetlands International, WWF, IUCN and other local NGOs are supporting the governments in the region to establish the ‘Himalayan Wetlands Initiative’ within the framework of regional cooperation under the Ramsar Convention since 2002 [67]. The initiative addresses the wetland issues from global to regional and local levels in achieving the goals of conservation and wise use of wetlands as a contribution to sustainable development. Its mission is “to sustain and restore wetlands, their resources, and biodiversity for future generations”. The initiative is aimed to establish a regional forum for integrated wetland conservation through wise use of resources, and at the same time providing a basis for regional cooperation. This cooperation has led to the development of a regional strategy for conservation of wetlands and is the driving force behind development of the capacity-building framework, tools for wetlands, and the wetland information system. However, new challenges posed by climate change needs to be integrated in overall biodiversity conservation and management agendas in the wetland. Since 2012, ICIMOD in collaboration with its member countries of the HKH and Ramsar Secretariat would like to propose a program for better understanding the role of Ramsar sites on their biodiversity values, the potential impact of climate change and their consequences on the local development agendas. Especial emphasis will be given to the peat lands to understand their role on carbon sequestration and the consequence of climate change on the state of such peat lands.

5. Conclusions

Today, protected areas are still the primary tool for conserving terrestrial and wetland biodiversity. Freshwater biodiversity is in decline and its conservation has not been advanced in protected area to a great extent because of the lack of attention to the needs of freshwater biodiversity. Though there has been significant progress, the Government of Nepal is yet to achieve the aspirations they have set for freshwater biodiversity conservation by notifying KTWR as Ramsar site. The KTWR has been and will continue to be an important habitat for significant number of globally important species. The systematic inventory and long term monitoring of biodiversity is the pre-requisite for management of the biodiversity within the KTWR. The habitat degradation due to river course change manifested by anthropogenic pressure from the buffer zone in posing challenges to maintain the integrity of this important wetland of global importance. Ensuring alternative livelihood options for people inhabiting the surrounding areas and adequate connectivity among existing potential habitats and protected areas and planning at ecoregional or landscape/catchment-scale are necessary.

Acknowledgements

We express our gratitude to the Director General of the ICIMOD, for his inspiration and for providing the required facilities. We are also thankful to Department of National Park and Wildlife Conservation, Ministry of Forests and Soil Conservation, Government of Nepal for the support received to work in the Kosi Tappu Wildlife Reserve. Guidance provided by Birendra Bajracharya of ICIMOD for preparation of maps is highly appreciated. Financial support received from MacArthur Foundation and German Society for International Cooperation (GIZ) for conducting this analysis is highly appreciated.

Conflict of Interest

The authors declare that there is no conflict of interest.

References

  1. Lambin, E.; Turner, B.; Geist, H.; Agbola, S.; Angelsen, A.; Bruce, J.; Coomes, O.; Dirzo, R.; Fischer, G.; Folke, C. The causes of land-use and land-cover change: moving beyond the myths. Global Environ. Change 2001, 11, 261–269. [Google Scholar]
  2. Pettorelli, N.; Vik, J.O.; Mysterud, A.; Gaillard, J.M.; Tucker, C.J.; Stenseth, N.C. Using the satellite-derived NDVI to assess ecological responses to environmental change. Trends Ecol. Evol. 2005, 20, 503–510. [Google Scholar] [CrossRef]
  3. Turner, B.L.; Lambien, E.F.; Reenberg, A. The emergence of land change science for global environmental change and sustainability. Proc. Natl. Acad. Sci. USA. 2007, 104, 20666–20671. [Google Scholar] [CrossRef]
  4. Hooper, D.U.; Adair, E.C.; Cardinale, B.J.; Byrnes, J.E.K.; Hungate, B.A.; Matulich, K.L.; Gonzalez, A.; Duffy, J.E.; Gamfeldt, L.; O’Connor, M.I. A global synthesis reveals biodiversity loss as a major driver of ecosystem change. Nature 2012, 486, 105–108. [Google Scholar]
  5. Dudgeon, D. The Ecology of Tropical Asian Rivers and Streams in Relation to Biodiversity Conservation. Annu. Rev. Ecol. Syst. 2000, 31, 239–263. [Google Scholar] [CrossRef]
  6. Haines, Y.R. Land use and biodiversity relationships. Land Use Policy 2009, 26S, S178–S186. [Google Scholar] [CrossRef]
  7. MA (Millennium Ecosystem Assessment). In Ecosystems and Human Well‐being: Synthesis; Published for World Resources Institute, Island Press: Washington, DC, USA, 2005.
  8. Sarma, P.K.; Lahkar, B.P.; Ghosh, S.; Rabha, A.; Das, J.P.; Nath, N.K.; Dey, S.; Brahma, N. Land-use and land-cover change and future implication analysis in Manas National Park, India using multi-temporal satellite data. Curr. Sci. India 2008, 95, 223–227. [Google Scholar]
  9. Berg, R.A.; Warren, Y.; Nicholas, A.; Dunn, A.; Imong, I.; Sunderland-Groves, J.L.; Oates, J.F. Remote sensing analysis reveals habitat, dispersal corridors and expanded distribution for the Critically Endangered Cross River gorilla Gorilla gorilla diehli. Oryx 2011, 46, 278–289. [Google Scholar]
  10. Chapin, F.S., III; Zavaleta, E.S.; Eviner, V.T.; Naylor, R.L.; Vitousek, P.M.; Reynolds, H.L.; Hooper, D.U.; Lavorel, S.; Sala, O.E.; Hobbie, S.E.; et al. Consequences of changing biodiversity. Nature 2000, 405, 234–242. [Google Scholar]
  11. Sala, O.E.; Chapin, F.S., III; Armesto, J.J.; Berlow, E.; Bloomfield, J.; Dirzo, R.; Huber-Sanwald, E.; Huenneke, L.F.; Jackson, R.B.; Kinzig, A.; et al. Global biodiversity scenarios for the year 2100. Science 2000, 287, 1770–1774. [Google Scholar]
  12. Chettri, N.; Shakya, B.; Thapa, R.; Sharma, E. Status of a protected area system in the Hindu Kush-Himalayas: An analysis of PA coverage. Int. J. Biodivers. Sci. Manag. 2008, 4, 164–178. [Google Scholar] [CrossRef]
  13. Joppa, L.N.; Pfaff, A. Global protected area impacts. Proc. R. Soc. B 2010, 278, 1633–1638. [Google Scholar] [CrossRef]
  14. Pandit, M.; Sodhi, N.; Koh, L.; Bhaskar, A.; Brook, B. Unreported yet massive deforestation driving loss of endemic biodiversity in Indian Himalaya. Biodivers. Conserv. 2007, 16, 153–163. [Google Scholar] [CrossRef]
  15. Rodríguez-Rodríguez, D.; Bomhard, B.; Butchart, S.H.M.; Foster, M.N. Progress towards international targets for protected area coverage in mountains: A multi-scale assessment. Biol. Conserv. 2011, 144, 2978–2983. [Google Scholar] [CrossRef]
  16. Cincotta, R.; Wisnewski, J.; Engelman, R. Human population in the biodiversity hotspots. Nature 2000, 404, 990–992. [Google Scholar] [CrossRef]
  17. Bawa, K.; Rose, J.; Ganeshaiah, K.N.; Barve, N.; Kiran, M.C.; Umashaanker, R. Assessing biodiversity from space: An example from the Western Ghats, India. Conserv. Ecol. 2002, 6, 7. [Google Scholar]
  18. Defries, R.; Hansen, A.; Turner, B.L.; Reid, R.; Liu, J. Land use change around protected areas: management to balance human needs and ecological function. Ecol. Appl. 2007, 17, 1031–1038. [Google Scholar]
  19. Lepers, E.; Lamin, E.F.; Janetos, A.C.; DeFries, R.; Achard, F.; Ramankutty, N.; Scholes, R.J. A synthesis of information on rapid land-cover change for the period 1891–2000. BioScience 2005, 55, 115–124. [Google Scholar]
  20. Gauthier, P.; Foulon, Y.; Jupille, O.; Thompson, J.D. Quantifying habitat vulnerability to assess species priorities for conservation management. Biol. Conserv. 2013, 158, 321–325. [Google Scholar]
  21. Kollár, S.; Vekerdy, Z.; Márkus, B. Forest Habitat Change Dynamics in a Riparian Wetland. Procedia. Environ. Sci. 2011, 7, 371–376. [Google Scholar] [CrossRef]
  22. Yue, T.X.; Liu, J.Y.; Jørgensen, S.E.; Ye, Q.H. Landscape change detection of the newly created wetland in Yellow River Delta. Ecol. Model. 2003, 164, 21–31. [Google Scholar] [CrossRef]
  23. Zomer, R.J.; Ustin, S.L.; Carpenter, C.C. Land Cover Change Along Tropical and Subtropical Riparian Corridors Within the Makalu Barun National Park and Conservation Area, Nepal. Mt. Res. Dev. 2001, 21, 175–183. [Google Scholar] [CrossRef]
  24. Dudgeon, D.; Arthington, A.H.; Gessner, M.O.; Kawabata, Z.; Knowler, D.J; Lévêque, C.; Naiman, R.J.; Prieur-Richard, A.; Soto, D.; Stiassny, M.L.J.; et al. Freshwater biodiversity: Importance, threats, status and conservation challenges. Biol. Rev. 2006, 81, 163–182. [Google Scholar]
  25. Grumbine, R.E.; Pandit, M.K. Threats from India’s Himalaya Dams. Science 2013, 339, 36–37. [Google Scholar] [CrossRef]
  26. LaRue, M.A.; Nielsen, C.K. Modelling potential dispersal corridors for cougars in midwestern North America using least-cost path methods. Ecol. Model. 2008, 212, 372–381. [Google Scholar] [CrossRef]
  27. Macauley, M.K. Earth observations in social science research for management of natural resources and the environment: identifying the Landsat contribution. J. Terres. Observ. 2009, 1, 31–51. [Google Scholar]
  28. Forrest, J.L.; Wikramanayake, E.; Shrestha, R.; Areendran, G.; Gyeltshen, K.; Maheshwari, A.; Mazumdar, S.; Naidoo, R.; Thapa, G.J.; Thapa, K. Conservation and climate change: Assessing the vulnerability of snow leopard habitat to treeline shift in the Himalaya. Biol. Conserv. 2012, 150, 129–135. [Google Scholar] [CrossRef]
  29. Harihar, A.; Pandav, B. Influence of connectivity, wild prey and disturbance on occupancy of Tigers in the human-dominated Western Terai Arc Landscape. PLoS One 2012, 7, e40105. [Google Scholar] [CrossRef]
  30. Potschin, M.B.; Haines-Young, R.H. Rio + 10, sustainability science and landscape ecology. Landscape Urban. Plan. 2006, 75, 162–174. [Google Scholar] [CrossRef]
  31. Sah, J.P. Koshi Tappu Wetlands: Nepal’s Ramsar Site; IUCN: Bangkok, Thailand, 1997. [Google Scholar]
  32. Siwakoti, M. An overview of floral diversity in wetland of terai Region of Nepal. Our Nature 2009, 4, 83–90. [Google Scholar]
  33. Chhetri, D.T.; Pal, J. Diversity of Mammals in and around Kosi Tappu Wildlife Reserve. Our Nature 2010, 8, 254–257. [Google Scholar]
  34. Chhetri, D.T. Diversity of herpetofauna in and around Kosi Tappu Wildlife Reserve. Bibechana 2010, 6, 15–17. [Google Scholar]
  35. DNPWC, Koshi. Tappu. Wildlife Reserve and Buffer Zone Management Plan 2009–2013; Department of National Parks and Wildlife Conservation, Government of Nepal: Kathmandu, Nepal, 2009.
  36. BCN, Bird Check List of the Koshi. Tappu. Wildlife Reserve; Bird Conservation Nepal: Kathmandu, Nepal, 2011.
  37. CSUWN, Baseline Survey Report, Koshi. Tappu. Wildlife Reserve; Conservation and Sustainable Use of Wetlands in Nepal, Babar Mahal: Kathmandu, Nepal, 2009.
  38. Baral, H.S.; Inskipp, C. Important Bird Areas in Nepal: Key sites of Conservation; Bird Conservation Nepal, Kathamndu, Nepal and Birdlife International: Cambridge, UK, 2005. [Google Scholar]
  39. Shrestha, R.K.; Alavalapati, J.R.R. Linking conservation and development: An analysis of local people’s attitude towards Koshi Tappu Wildlife Reserve, Nepal. Environ. Dev. Sust. 2006, 8, 69–84. [Google Scholar] [CrossRef]
  40. Goit, R.K.; Basnet, K. Status and conservation of crocodiles in the Koshi Tappu Wildlife Reserve, eastern Nepal. J. Threatened Taxa 2011, 3, 2001–2010. [Google Scholar]
  41. GLOVIS. United States Geological Survey, Global Visualization Viewer (GLOVIS) Earth Resources Observation and Science Center (EROS). Available online: http://glovis.usgs.gov/ (accessed on 15 May 2012).
  42. SRTM, Hole-filled SRTM for the globe Version 4. Available online: http://srtm.csi.cgiar.org/.
  43. Lang, S.; Kaab, A.; Pechstadt, J.; Flugel, W.A.; Zeil, P.; Lanz, E.; Kahuda, D.; Frauenfelder, R.; Casey, K.; Fureder, P.; et al. Assessing components of the natural environment of the Upper Danube and Upper Brahmaputra river basins. Adv. Sci. Res. 2011, 7, 21–36. [Google Scholar]
  44. Di Gregorio, A. Land Cover Classification System (LCCS), version 2: Classification Concepts and User Manual; FAO Environment and Natural Resources Service Series, No. 8; Food and Agriculture Organisation of United Nation: Rome, Italy, 2005. [Google Scholar]
  45. Bajracharya, B.; Uddin, K.; Chettri, N.; Shrestha, B.; Siddiqui, S.A. Understanding land cover change using a harmonized classification system in the Himalayas: A case study from Sagarmatha National Park, Nepal. Mt. Res. Dev. 2010, 32, 142–156. [Google Scholar]
  46. Blaschke, T.; Hay, G.J. Object-oriented image analysis and scale-space: theory and methods for modeling and evaluating multiscale landscape structure. Int. Arch. Photogram. Rem. Sens. 2001, 34, 22–29. [Google Scholar]
  47. Baatz, M.; Arini, N.; Schäpe, A.; Binnig, G.; Linssen, B. Object oriented image analysis for high content screening: Detailed quantification of cells and sub cellular structures with the Cellenger software. Cytom. Part A 2006, 69, 652–658. [Google Scholar]
  48. Chape, S.; Blyth, S.; Fish, L.; Fox, P.; Spalding, M. United Nations list of Protected Areas; UNEP-World Conservation Monitoring Centre/IUCN–The World Conservation Union: Cambridge/Gland, UK/ Switzerland, 2003. [Google Scholar]
  49. Abell, R.; Allan, J.D.; Lehner, B. Unlocking the potential for protected areas in conserving freshwaters. Biol. Conserv. 2007, 134, 48–63. [Google Scholar] [CrossRef]
  50. Bhandari, B. The current status of wetlands in Nepal. In Presented at the Asian Wetland Symposium organized by Ramsar Centre Japan, Otsu-Kushiro, Japan, 14–20 October 1992.
  51. Kafle, G.; Savillo, I.T. Present status of Ramsar sites in Nepal. Int. J. Biodivers. Conserv. 2009, 1, 146–150. [Google Scholar]
  52. Bhuju, U.R.; Khadka, M.; Neupane, P.K.; Adhikari, A. A map based inventory of lakes in Nepal. Nepal J. Sci. Tech. 2010, 11, 173–180. [Google Scholar]
  53. IUCN-Nepal, An. Inventory of Nepal’s wetlands; IUCN: Kathmandu, Nepal, 1996.
  54. Sah, J.P. IUCN Wetlands Programme Newsletter; No. 8; IUCN: Kathmandu, Nepal, 1993. [Google Scholar]
  55. Khatri, T.B.; Shah, D.P.; Shah, R.D.; Mishra, N. Biodiversity of Koshi Tappu Wildlife Reserve: A post flood assessment. J. Wetlands Ecol. 2010, 4, 69–82. [Google Scholar]
  56. Nagabhatla, N.; Denagamage, R.C.W.; Prasad, N.; Finlayson, M. A multi-scale geospatial study of wetlands distribution and agricultural zones, and the case of India. Trop. Conserv. Sci. 2010, 3, 344–360. [Google Scholar]
  57. Deka, J.; Tripathi, O.P.; Khan, M.L. A multi-temporal remote sensing approach for monitoring changes in spatial extent of freshwater lake of Deepor Beel Ramsar Site, a major wetland of Assam. J. Wetland Ecol. 2011, 5, 40–47. [Google Scholar]
  58. Alam, A.; Rashid, S.M.; Bhat, M.S.; Sheikh, A.H. Impact of land use/land cover dynamics on Himalayan wetland ecosystem. J. Experim. Sci. 2011, 2, 60–64. [Google Scholar]
  59. Trisal, C. Wetland of the Hindu Kush Himalayas: Ecosystem functions, services and implications of climate change. In Proceedings on ‘International Mountain Biodiversity Conference, conference location(city, country), day/month/year, ICIMOD, Kathmandu, Nepal; Sharma, E., Ed.; 2009; pp. 169–178. [Google Scholar]
  60. Nagabhatla, N.; Finlayson, C.M.; Sellamuttu, S.S. Assessment and change analyses (1987–2002) for tropical wetland ecosystem using earth observation and socioeconomic data. Eur. J. Rem. Sens. 2012, 45, 215–232. [Google Scholar]
  61. Baral, H.S. Surveys for Lesser Adjutant Leptoptilos. javanicus in and around Koshi Tappu Wildlife Reserve, Nepal. Forktail. 2005, 21, 90–193. [Google Scholar]
  62. Baral, H.S.; Ram, A.K.; Chaudhary, B.; Basnet, S.; Chaudhary, H.; Giri, T.R.; Chaudhary, D. Conservation Status of Bengal Florican Houbaropsis. bengalensis bengalensis (Gmelin, 1789) (Gruiformes: Otididae) in Koshi Tappu Wildlife Reserve and adjoining areas, eastern Nepal. J. Threatened Taxa 2012, 4, 2464–2469. [Google Scholar]
  63. Chaudhary, S. Status of and Threates to, the Ganges River Dolphin (Platanista gangetica) in the Koshi River, Nepal. MSc. Thesis, University of Klagenfurt, Austria, 2007. [Google Scholar]
  64. Dahal, B.R.; McGowan, P.J.K.; Browne, S.J. An assessment of census techniques, habitat use and threats to Swamp Francolin Francolinus gularis in Koshi Tappu Wildlife Reserve, Nepal. Bird Conserv. Int. 2009, 19, 137–147. [Google Scholar]
  65. Heinen, J.T. Population viability and management recommendations for wild water buffalo Bubalus. bubalis in Kosi Tappu Wildlife Reserve, Nepal. Biol. Conserv. 1993, 65, 29–34. [Google Scholar] [CrossRef]
  66. Heinen, J.T.; Khadel, R. Threats to a small population: a census and conservation recommendations for wild buffalo Bubalus. arnee in Nepal. Oryx 2006, 40, 324–330. [Google Scholar] [CrossRef]
  67. Lei, G. Review of the Himalayan Wetlands Conservation Initiative. Review Note, Ramsar Secretariat, Gland, Swizerland. In Asia Regional Meeting in preparation for Ramsar COP9, Beijing, China, 13–16 May 2005.

