Article

Diversity-Carbon Flux Relationships in a Northwest Forest

Field and Ecosystem Ecology Laboratory, Lab II 3265, The Evergreen State College, 2700 Evergreen Parkway NW, Olympia, WA, 98505, USA
*
Author to whom correspondence should be addressed.
Diversity 2012, 4(1), 33-58; https://doi.org/10.3390/d4010033
Submission received: 12 November 2011 / Revised: 12 December 2011 / Accepted: 23 December 2011 / Published: 29 December 2011
(This article belongs to the Special Issue Biodiversity and Forest Dynamics and Functions)

Abstract

:
While aboveground biomass and forest productivity can vary over abiotic gradients (e.g., temperature and moisture gradients), biotic factors such as biodiversity and tree species stand dominance can also strongly influence biomass accumulation. In this study we use a permanent plot network to assess variability in aboveground carbon (C) flux in forest tree annual aboveground biomass increment (ABI), tree aboveground net primary productivity (ANPPtree), and net soil CO2 efflux in relation to diversity of coniferous, deciduous, and a nitrogen (N)-fixing tree species (Alnus rubra). Four major findings arose: (1) overstory species richness and indices of diversity explained between one third and half of all variation in measured aboveground C flux, and diversity indices were the most robust models predicting measured aboveground C flux; (2) trends suggested decreases in annual tree biomass increment C with increasing stand dominance for four of the five most abundant tree species; (3) the presence of an N-fixing tree species (A. rubra) was not related to changes in aboveground C flux, was negatively related to soil CO2 efflux, and showed only a weak negative relationship with aboveground C pools; and (4) stands with higher overstory richness and diversity typically had higher soil CO2 efflux. Interestingly, presence of the N-fixing species was not correlated with soil inorganic N pools, and inorganic N pools were not correlated with any C flux or pool measure. We also did not detect any strong patterns between forest tree diversity and C pools, suggesting potential balancing of increased C flux both into and out of diverse forest stands. These data highlight variability in second-growth forests that may have implications for overstory community drivers of C dynamics.

1. Introduction

Forests of the Pacific Northwest (PNW) can be highly productive [1,2,3,4], and as temperate forests they may store more biomass carbon (C) per unit area than most other ecosystems [1,5,6,7,8]. Second-growth forest productivity can also be highly variable, and understanding reasons for this variability is an important research priority with implications for ecosystem C dynamics and global C cycles. While a large portion of variability in forest C flux (both above- and belowground) occurs in response to abiotic variation [9,10,11,12,13,14,15,16,17,18,19], biotic gradients in plant community composition and diversity may be especially important as drivers of patterns in C cycling and productivity even at fine scales [4,7,20,21,22,23]. Stand diversity (richness, evenness, and diversity of dominant species), species biomass dominance, and presence/absence of soil modifying organisms (such as nitrogen [N]-fixing plants) could all represent major biotic influences on ecosystem C flux. A better understanding of how ecosystem C dynamics are affected by biotic factors such as these could lead to a better understanding of C dynamics of the global climate system [24].
Productivity-diversity and diversity-ecosystem function experiments (especially in grassland systems), generally show that more diverse plots are more productive [4,25,26], and have suggested positive relationships between ecosystem C-uptake and species diversity [25,26,27,28], and recent research spanning PNW forests also suggest positive relationships between productivity and diversity in natural forested ecosystems [4]. In fact, studies across productivity gradients have suggested the reverse relationship where productivity predicts forest tree diversity in large-scale regional datasets [16,29]. Forests may exhibit positive productivity-diversity relationships even though peaks in forest diversity across gradients in site quality have often shown intermediate productivity [16,21,30]. However, when productivity and diversity are related within a site, it is unclear whether productivity-diversity relationships are due to the influence of hyper-productive species (i.e., sampling effects) or complementarity in resource acquisition [21,31,32]. There is also a general need for more studies examining biodiversity-ecosystem function patterns in natural systems [33] where site-quality variation is constrained.
Undoubtedly, presence of dominant plant species can play a major role in determining the C flux in ecosystems [34]. Although biomass stand dominance by abundant species can influence productivity [4], species differences in functional traits are also important as drivers of ecosystem productivity and are well-recognized as important controls on ecosystem processes (e.g., [35,36]). It is also possible that different species achieve similar net C uptake rates via different trait suites. For example, Alnus rubra Bong., a deciduous species in the PNW with a symbiotic association with an N-fixing bacteria, may maintain high productivity during the regular growing season that is matched by consistently lower (comparatively) productivity by coniferous evergreen species like Pseudotsuga menziesii (Mirb.) Franco., which accumulate biomass over a greater portion of the year [37]. Thus it has been hypothesized that mixtures of these N-fixing and non-N-fixing species could yield more productive forests [38,39,40]. Presence of A. rubra may be especially important in increasing forest productivity (e.g., [16,38,39,40,41,42,43,44]) via N additions to soils [37,45,46,47]. This is important because low levels of soil N can limit growth in many PNW, USA forests (but see Binkley et al. [44]).
Aboveground C stocks and aboveground productivity (especially aboveground net primary productivity (ANPP)) have been thoroughly investigated using numerous metrics in multiple experimental systems [48], but soil CO2 efflux responses to biotic variation in forest ecosystems are less well-studied [8,17,49]. Significant variation in belowground C flux exists alongside variation in dominant plant diversity [18], and this could be driven by the influence of hyper-productive (or nutrient-cycle altering) species (e.g., [21,32,49]).
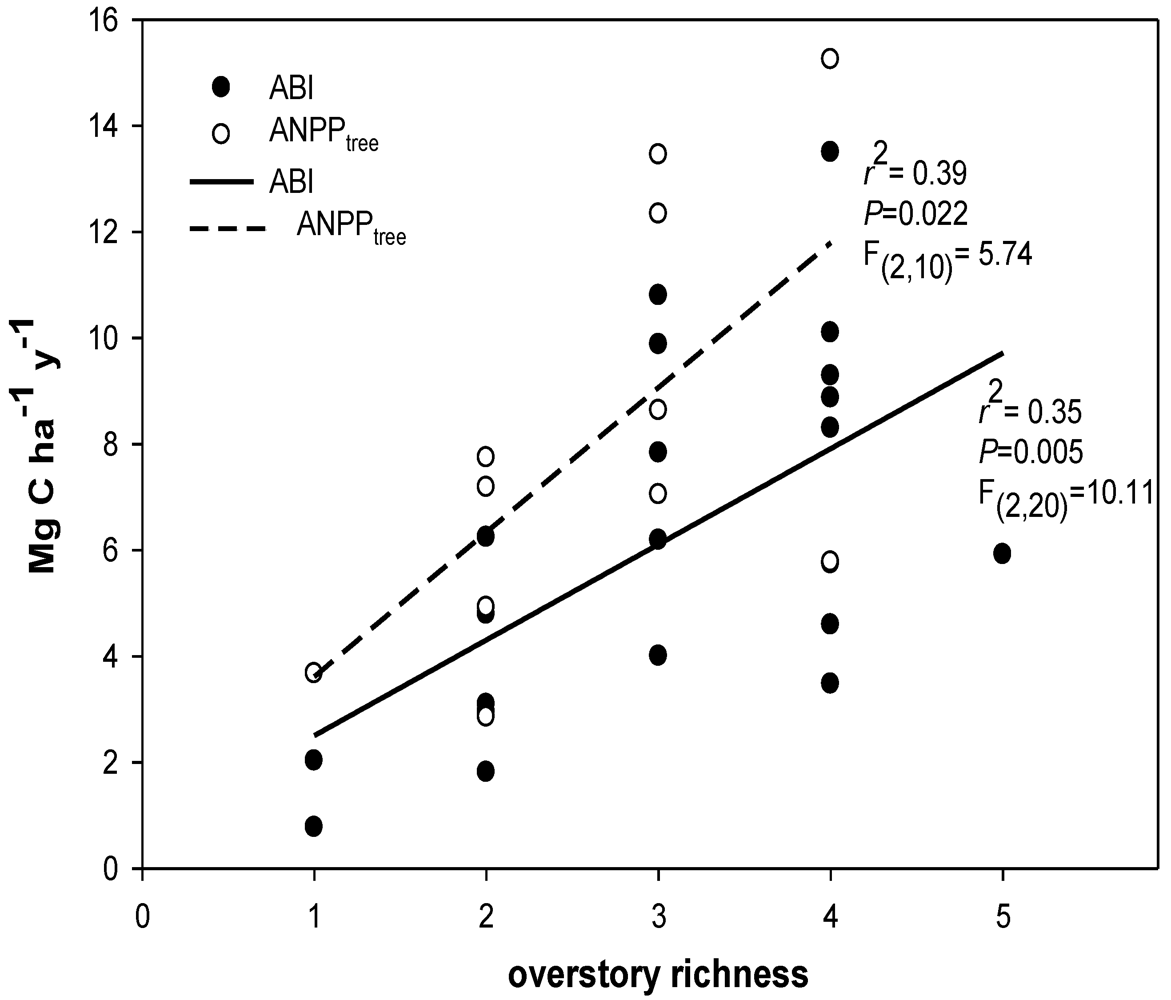
In this study, we hypothesized that stand diversity, species biomass dominance, and presence/absence of an N-fixing tree species were all major biotic influences related to ecosystem C flux. We focused on three key measurable C flux measures in a natural second-growth PNW forest: net changes in aboveground tree C pools (hereafter; aboveground biomass increment (ABI), aboveground net primary productivity of trees (ANPPtree)), and net soil CO2 efflux. While not an exhaustive list of potential C fluxes in forests, these variables (ABI, ANPPtree, and soil CO2 efflux) may be indicative of major above- and belowground shifts in C flux associated with biotic variation in forests. All three of these variables can be responsive to both biotic and abiotic changes, and are important to quantify in order to understand whole ecosystem C flux. Our primary goal was to identify variation in aboveground C flux and net soil CO2 efflux co-varying with stand diversity at a relatively homogeneous site. We examined C flux with regard to influences of: (1) overstory richness and diversity; (2) biomass-based stand dominance of overstory tree species; and (3) soil nutrient pools.
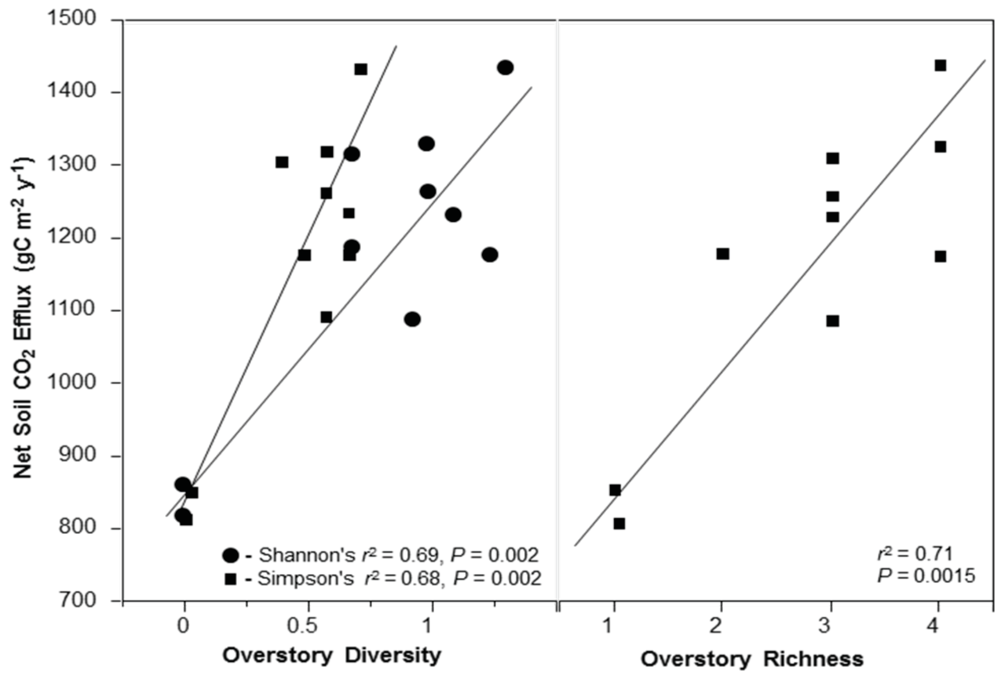
We prioritized these examinations in regards to four, more specific, hypotheses. First, we hypothesized aboveground productivity (ABI and ANPPtree) would increase with an increase in forest tree richness and diversity. Second, we hypothesized stands containing the N-fixing species, A. rubra, would have higher aboveground productivity (ABI, and ANPPtree) driven by high values in inorganic N pools. We expected lower productivity in sites dominated by slow-growing coniferous species such as Thuja plicata Donn ex D. Don and Tsuga heterophylla (Raf.) Sarg. Third, we hypothesized stands with higher stand diversity would also have higher soil CO2 efflux. And finally, if C flux predictably varies with stand diversity, then we should expect total standing C stocks to be higher where aboveground productivity is higher, as long as aboveground C uptake is not overcome by high soil CO2 efflux, and all sites have had a similar recovery time post-disturbance. This is important because sites with similar recovery times since disturbance are likely to have similar establishment dates and may be similarly aged. Thus with similarly ages stands we hypothesized C pools would increase with stand diversity and A. rubra presence.

2. Materials and Methods

2.1. Study Area

This study was conducted adjacent to the Puget Sound, Washington, USA in the Evergreen Ecological Observation Network, a long-term permanent plot network of 44 permanent ecological monitoring plots located throughout a 380 ha forest reserve owned and managed by The Evergreen State College. The ecosystem is a second-growth temperate forest that was clear-cut in 1937-39 using cable techniques. Our site has an average temperature of 10 °C and receives approximately 100 cm of annual rainfall [50]. All plots were located on similar Alderwood gravelly loam soils [51].
The forest overstory is dominated by a mixed canopy of P. menziesii and four primary codominant species: Acer macrophyllum Pursh, A. rubra, T. heterophylla and T. plicata, with an understory dominated primarily by Polystichum munitum (Kaulf.) C. Presl and Gaultheria shallon Pursh. The plot network was established in 2005 using a systematic 250 m spaced grid placed with a random start point using circular 20 m-diameter plots (
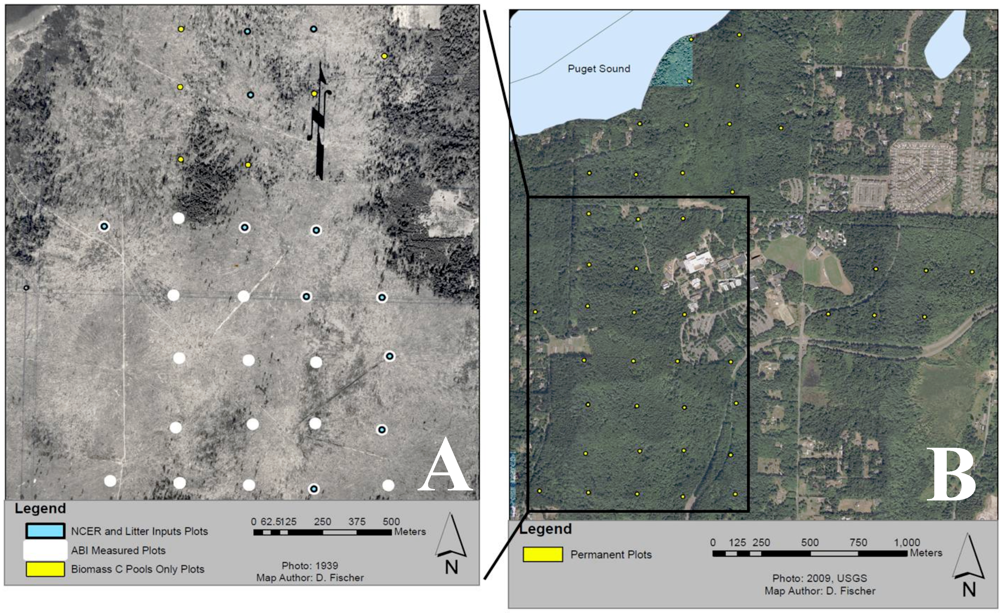
Figure 1).
Figure 1. Map of study area depicting circular 10 m radius permanent plots along a 250 m grid with a random starting point: (A) Historical (1939) photo of the study area showing part of a clear-cut which took place from 1937-39. Blue dots depict the subset of 11 plots measured for soil CO2 efflux and leaf litter, white dots depict the subset of 21 plots measured for aboveground biomass increment (ABI), and yellow dots depict 6 of the 44 plots measured for aboveground biomass pools only. (B) Locations of all 44 permanent plots measured for aboveground biomass pools only. For reference The Evergreen State College is located at the center of the image.
Diversity 04 00033 g001
For this study we utilize 44 plots to estimate C pools in live and dead standing biomass, coarse woody debris (CWD), and understory vegetation. A subset of 21 plots were used to measure aboveground biomass increment (ABI), sampled once in 2006 and again in 2008. These years were expected to be average growth years based on data from an on-site weather station [50]. A smaller subset of 11 plots was intensively measured between 2006–2008 for estimates of leaf litterfall and aboveground net primary productivity of trees (ANPPtree). Another subset of 10 intensive plots was independently selected in 2008 for the measurement of fine woody debris (FWD), and net soil CO2 efflux (see Section 2.7; Net Soil CO2 Efflux Rate). All intensive plots were chosen haphazardly from a subset of plots that could be determined to have similar site histories (similarly cleared) based on a 1939 orthophoto showing the last logging operation to take place at our study site.

2.2. Soil Nutrients

Variation in soil nutrient status could underlie any observed co-variation in forest diversity and C flux. In order to address potential variation in plot nutrient status, we analyzed cation exchangeable pools of mineral soil PO43-, K+, Ca2+, NH4+, NO3- from a spring 2011 survey of the intensively measured plots. Briefly, for measurement of soil cation exchangeable PO43-, K+, and Ca2+, we collected soils at 10 cm depths on north and south borders of each plot. Sieved (4 mm) soil samples were freeze-dried and powdered in a SPEX ball mill. Aliquots of 0.2 to 0.5 g of each soil were leached in 5 mL of 1M NH4Cl solution for 20–24 h at room temperature in an agitator to separate the cation-exchangeable fraction of ions (sensu Nezat et al. [52]). Solutions were centrifuged to separate the supernatant and the remainder of the sample was rinsed 2 times in DI water to quantitatively collect the NH4Cl leach. Leach solutions were analyzed for PO43-, K+, and Ca2+, by Inductively-coupled Plasma Mass Spectrometry (ICP-MS; Perkin-Elmer DRC-e). For inorganic soil N (NH4+, NO3), a 10 g aliquot of sieved (4 mm) soil was extracted in 100 ml of 2M KCl and hand-agitated (2 min) prior to leaching overnight (12 h; sensu Robertson et al. [53]). Suspensions were vacuum-filtered (grade 50 cellulose filter paper) and stored at 4°C until analyzed by University of Idaho Analytical Sciences Laboratory for colorimetric analysis utilizing flow injection analysis.

2.3. Changes in Aboveground Standing Carbon

To estimate net changes in aboveground C in forest plots, we rely on tree biomass estimation equations, and do not include sapling or understory biomass in changes of aboveground carbon stocks because trees dominate the system and aboveground portions of trees tend to reliably represent the majority of plant mass in most temperate forest ecosystems [48,54]. Changes in CWD C were also not included in calculation of aboveground C stocks as changes in CWD C are usually measured over decades rather than years (but see Section 2.4; Coarse and Fine Woody Debris). Death of trees and recruitment of new trees were accounted for on an individual tree basis as suggested in Clark et al. [48].
Aboveground tree biomass was estimated using independent allometric relationships based on stem diameter at 1.37 m (diameter at breast height; DBH) and tree height (HT). All trees within plot boundaries with DBH ≥ 5 cm were tagged and measured. We measured tree DBH in 2006 and again in 2008 at a tagged location on the tree trunk. Tree HT measurements were taken in 2007 and applied to both 2006 and 2008 allometric biomass equation estimates of tree mass. Measurement of tree HT was obtained using a laser range finder and clinometer, and validated using estimates of tree HT generated from aerial LiDAR and processed in the program FUSION [55,56]. For mass estimation, we used species-specific biomass estimation equations from published studies compiled in the BIOPAK software package [57,58]. We primarily used biomass equations from Standish et al. [57] with the exception of the equation for A. macrophyllum biomass. For this species we compiled an equation from Gholz [59] using summation of individual equations for five separate components of the tree: total foliage biomass, stem wood biomass, live branch biomass, dead branch biomass, and stem bark biomass. In instances where a tree species did not have an associated biomass equation, the biomass equation for A. rubra [57] was substituted since it produced allometric predictions intermediate to other equations. This substitution was applied to the species Salix scouleriana Barratt ex Hook., Frangula purshiana (DC.) Cooper, Corylus cornuta Marsh., Cornus nuttallii Audubon ex Torr. & A. Gray, and Ilex aquifolium L. Across all species, aboveground C was assumed to be 50% of plant biomass, which is a common assumption [48].
We analyzed changes in aboveground tree C pools using two distinct metrics that each account for ecosystem C flux with different limitations. First, ABI measures aboveground tree biomass increment C and was estimated using repeat measures of biomass (2006, 2008) according to the equation:
                       ABI = (Bt2 – Bt1)/T (1)
where Bt1 is the total aboveground tree biomass at time 1 (2006), Bt2 is total aboveground tree biomass at time 2 (2008), and T refers to the number of years over which data were taken (2). This metric focuses on live trees, relies on estimation of foliar mass based on stem dimensions, and does not account for foliar loss due to abscission (i.e., it only accounts for net changes in standing C without accounting for replacement of foliage produced and shed to the forest floor). This metric was available for most plots in our study because it relies on relatively simple field measurements.
Second, for the subset of 11 more intensively measured plots, we estimated ANPPtree by summing estimates of ABI with estimates of litterfall from litter traps. This metric provides a combined estimate of ANPP in trees through estimates of changes in aboveground tree woody increment, new foliar production, and foliar production that replaced foliage lost through litterfall. We collected litterfall using 50 cm diameter litter traps suspended 20 cm above the forest floor at plot center. Litterfall was collected monthly from November 2006 through November 2007. Following collection, litter was immediately dried at 70 °C for 72 h, sorted by species, and weighed to the nearest mg. While ABI was calculated as the average over two years (2006–2008), litterfall was estimated based on the 2006–2007 collection. Thus, ANPPtree estimates represent ABI averaged over two years and litterfall from the single year it was measured.

2.4. Coarse and Fine Woody Debris

Although not used for estimates of changes in C stocks over time, we measured CWD mass to estimate total plot aboveground C stocks (Table 1). A survey of coarse woody debris (CWD) was conducted in all plots between 2006–2008. We separate CWD into two categories, where all downed logs ≥10 cm in diameter are considered downed woody debris (DWD) and all standing dead tress ≥5 cm DBH are considered snags. All CWD falling into these two categories were tagged and measured in all plots [60] for estimation of total plot non-living C pool. Length (L) was measured on each piece of DWD and diameter was recorded at three points: base (Ab), middle (Am) and top (At) of each piece of DWD. When DWD extended beyond the plot, end measurements were made at the plot boundary. Decay classes for each species were estimated using a five class decomposition scale [61]. Dimension measurements were used with Newton’s formula to obtain volume for each piece of DWD [60]. We then used volumetric estimates combined with estimates of density and C content, based on decay stage, in order to provide estimates of DWD C. Density values were obtained from a table of mean density for decay classes of CWD in the Cascade-Temperate region [60] for the following species: P. menziesii, T. plicata, and T. heterophylla. Where a decay-class-sensitive density estimate could not be found for a species, a substitute density was used by selecting densities from decay classes of another species whose live tree bole densities closely matched published live tree bole density estimates for the species of concern.
Table 1. Stand characteristics and carbon (C) pools for measured plots *.
SnTPHSPHDWDPHTree CSnag CDWD CSap CFWD C1US CPlot C
12525.48143.31302.55148.0512.0114.860.068.62 (2)7.31182.29
25343.95343.95407.64148.7915.3712.80.169.15 (1)5.8182.92
313443.41210.68440.96236.955.4522.860.188.81 (4)3.89269.33
416491.64222.93423.97287.215.8421.720.178.01 (4)3.97318.91
57509.55200.18414.01286.554.7216.780.19n/a5.06321.792
61668.79127.3995.54154.3513.21.250.32n/a5.08182.692
Weighted Ave.469.02223.65412.57247.187.0819.480.178.524.51286.91
*Values represent averages within species richness (S) classes (1–6). Because number of plots (n) was variable among classes, averages are derived from among 1-16 individual plots. The average value (Ave.) for all plots measured is represented by the bottom row. TPH = trees per ha, SPH = snags per ha, DWDPH = downed woody debris (>10 cm diameter) per ha, Sap = sapling, FWD = fine woody debris (<10 cm diameter), US = understory. 1, FWD measured in a subset of 11 plots. Number of plots with richness is in parentheses. 2, Totals for plots with richness 5 and 6 given an assumed value of 8.52 Mg C ha1 for estimations of FWD. Value derived from an average of the 11 plots where FWD C was collected.
Snags were measured for DBH and HT. A five class decomposition score (similar to the CWD scale) was also estimated for all snags measured, and used as above for DWD. The Huber formula was used for snag volume [60]. Biomass C of each snag was calculated using species- and decay-class-specific density values similar to those used for calculation of DWD.
An estimation of fine woody debris (FWD; any woody debris <10 cm in diameter) was produced from locations adjacent to each of a subset of 10 intensive plots in the fall of 2008. Four 0.25 m2 sampling frames were placed just outside plot boundaries (to reduce plot disturbance) in four cardinal directions to determine C content of FWD of the forest floor. Woody debris <10 cm in diameter was collected, oven-dried at 70 °C for 72h, sorted, and weighed. As stated in Section 2.2, 50% of dry mass was assumed to be C. The four subplot values were averaged for an estimation of plot FWD C.

2.5. Saplings

A sapling survey was conducted in all plots to determine C storage of young trees and shrubs. Tree saplings <5 cm DBH and ≥1 m in HT were counted, while all shrubs <5 cm DBH and ≥2 m tall were counted. Trees and shrubs not meeting these minimum criteria were considered to be part of the understory community and were included in understory community sampling (see Section 2.6; Understory Community). Saplings were recorded for species and abundance. A random sampling of 40 saplings yielded a mean stem basal diameter at the litter surface (DBA) of approximately 2.5 cm. Based on this sampling each sapling was given a DBA of 2.5 cm for calculation of biomass using equations from the BIOPAK database [58]. While this assumption of similar biomass based on average sapling mass may be a source of error, sapling abundance contributed minimally to whole plot C estimates (<0.05%). Species that did not have an associated biomass equation were assigned a species closely related by genus, family, or morphology.

2.6. Understory Community

Understory vegetation (% cover) was measured in 2008 using 10 cm point-line intercepts along four 10 m transects from plot center to plot edge in cardinal directions. The mass of understory plants was determined using equations from the BIOPAK database [58]. Since understory community measurements were made only once during the study, measurements were used for estimates of plot C pools, but were not used for estimates of net changes in aboveground C pools.

2.7. Net Soil CO2 Efflux Rate

We measured net soil CO2 efflux in a subset of 11 intensively measured plots selected in 2008. Soil respiration was measured on the forest floor using a differential open system infrared gas analyzer with soil chamber attachment (ADC Bioscientific Ltd., Hertz, UK). In four evenly-stratified subplots per plot, 5-min measurements were taken monthly for a full year between January 2008 and January 2009. During spring and summer, 24-h measurements were conducted for assessment of diel patterns in soil CO2 efflux. For each 24-hour measurement, two plots were sampled every three hours. These measurements suggested a mild diel pattern with peak soil CO2 efflux from ~10:00–16:00, and all regular measurements were taken between these times for consistent measurement of soil CO2 efflux within daily temperature and moisture regimes.

2.8. Overstory Richness and Diversity

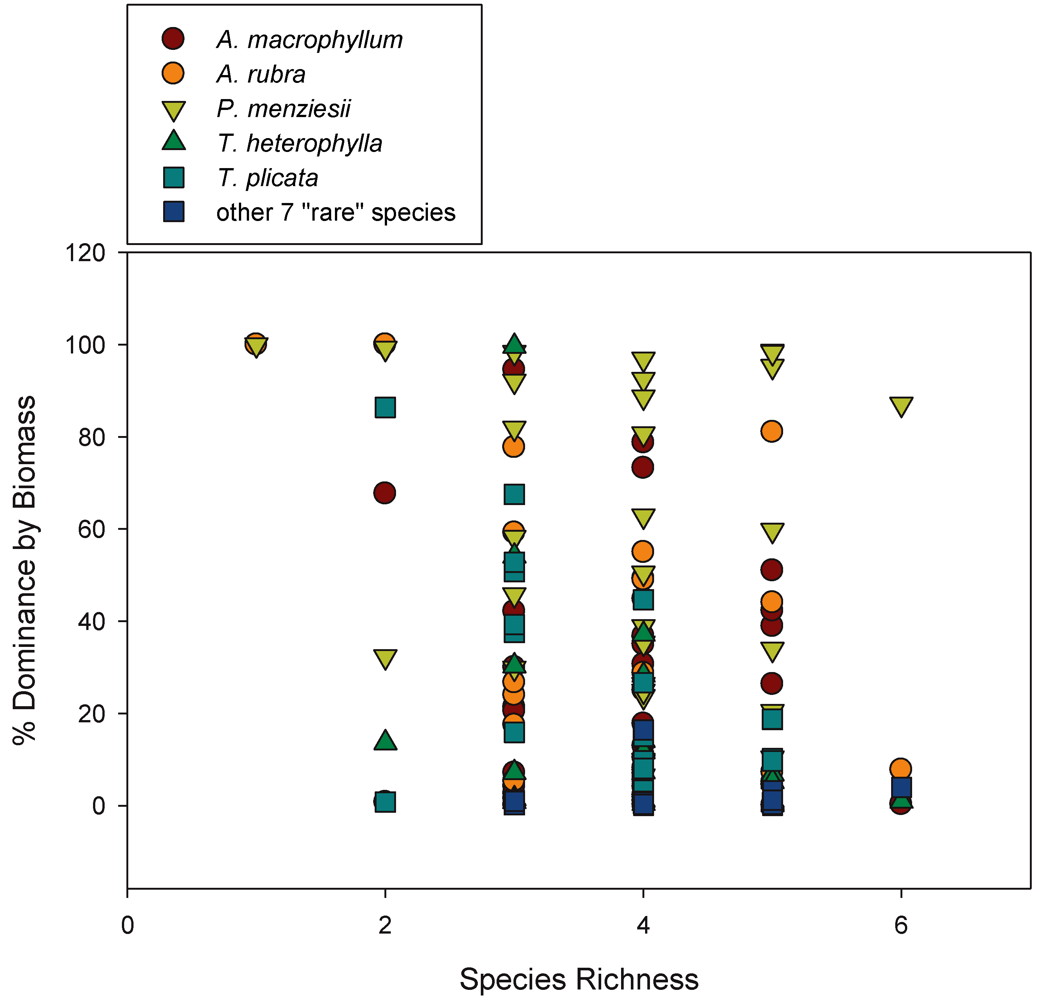
We classified species richness within plots in two ways: (1) Using just the five most dominant overstory species (P. menziesii, A. macrophyllum A. rubra, T. heterophylla, T. plicata), referred to as ‘Overstory Richness 5’ in tables and figures. This was done to observe patterns associated with abundant species that have a significant physical presence in plots, and to avoid patterns in richness associated with small, rare individuals. The five most dominant overstory species comprise 95.5% of all tagged trees and account for 99% of total tree biomass. Thus, dominant species were assumed to drive a majority of the productivity-diversity relationship; (2) Using all 12 overstory species that occur within plots (also including S. scouleriana, F. purshiana, I. aquifolium, Abies grandis [Douglas ex D. Don] Lindl., C. cornuta, C. nuttallii, and Picea sitchensis [Bong] Carrière], referred to as ‘Overstory Richness All’ in tables and figures. This was done to classify true plot tree richness so data could be analyzed with the influence of rare species. Any patterns related to richness or diversity in this study can be assumed to be based on random sampling, as this plot network is located throughout an even-aged forest using a stratified-random plot design. We included all 12 overstory species for both Shannon’s (H’) and Simpson’s (D) diversity indices calculated using the program PC-Ord [62]. We also constructed an index of community similarity among plots based on non-metric multidimensional scaling (NMS) ordination of our tree data using a single axis solution of ordinated data and 500 max iterations [62]. The final stress of this ordination was 47.7, with instability of 0.0005. This single axis-ordination gives a score (hereafter NMS community similarity) where communities that are more similar exhibit a similar score.

2.9. Statistical Analysis

Our work analyzing tree diversity and C can be summarized by three sets of analyses: (1) We conducted linear regression analyses between species diversity indices and the variables ABI, ANPPtree, and soil CO
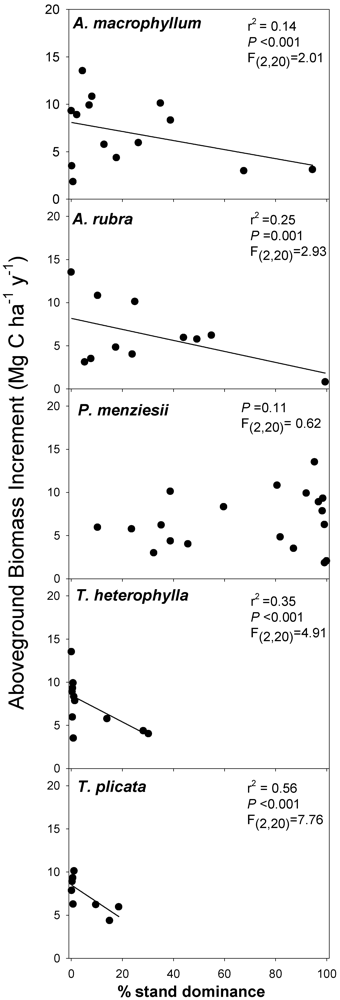
2 efflux; (2) Because hyper-productive species (e.g., the N-fixing species A. rubra) could be responsible for productivity-diversity relationships, we also assessed individual co–variation with C flux by conducting separate linear regressions of C flux/pool measures and individual biomass-based stand dominance estimates for each tree species in each plot. Our regressions examined individual tree species stand dominance relationships with ABI, ANPPtree, and soil CO2 efflux; (3) Finally, in order to further clarify which factors were better predictors than others, we conducted model selection analysis to compare single-factor models using ranked model selection criteria [63]. For this analysis, we compared models where C flux was predicted from each diversity index, % biomass dominance of all species individually, a model that combined all species, NMS community similarity, inorganic N measures, or an intercept only (null model). Briefly, our approach used Akaike’s Information Criterion, (adjusted for small sample size; AICc), model likelihood, computed weights of evidence (wi), and an “evidence ratio” computed from these variables, to rank multiple models. Each measure provided an index of the best model given the data, and the “evidence ratio” gives a “gambler’s odds” of the top model being the best model compared to other models. Models in the same set whose AICc differed by less than 2.0 where not considered statistically distinguishable, as is common [63]. This approach is considered less biased and less prone to error compared to other model ranking approaches like stepwise regression [63]. The approach favors more parsimonious models, and thus single factor models are generally selected over multivariate predictor models. Because we included soil N variables, this analysis was limited to only the plots in which soil N was measured (n = 8–11).
For exploratory examination of all other correlations among variables we used Pearson’s product-moment correlation analysis. All data which did not meet normality assumptions were transformed using log transformations, or arcsine square-root transformations in the case of percentage data. All analyses were conducted in JMP 8.0 (SAS Institute Inc. Cary, NC). An α = 0.05 was used to determine statistical significance.

3. Results

3.1. Species Diversity

We found significant positive relationships between aboveground biomass increment C flux (ABI) and overstory richness classified by the five most dominant overstory species (Figure 2) and all 12 tree species (Table 2). Similarly, in the 11 plots where tree aboveground net primary productivity C (ANPPtree) was measured we found significant positive relationships between ANPPtree and tree species richness of the five most dominant species (Figure 2) and all 12 species (Table 2). The metrics ABI and ANPPtree also showed significant positive relationships with H’ and D diversity indices (Table 2). In fact, in our model selection analyses (Table 3, Table 4, Table 5), H’ and D diversity indices were the best models predicting ANPPtree and ABI respectively. However, these “best” predictive models were rarely statistically distinguishable from other diversity indices, and for ABI, diversity models were not statistically distinguishable from the intercept-only (null) model. Thus, while diversity indices significantly predicted one quarter to one third of ABI in regressions, with the more-limited subset of plots in the model selection analysis (constrained by soil N measures), we could not distinguish these models from each other.
Figure 2. Positive relationships between Aboveground Biomass Increment carbon (ABI), Aboveground Net Primary Productivity of trees (ANPPtree), and Overstory Richness 5 which includes the five most dominant tree species; P. menziesii, A. macrophyllum, A. rubra, T. heterophylla, and T. plicata.
Diversity 04 00033 g002
Table 2. Regression coefficient and significance results for regression analyses of plot carbon flux and pool estimates versus diversity metrics *.
Tree C Snag C DWD C Plot C ABIANPPtreeSoil CO2 efflux
n = 44n = 44n = 44n = 44n = 21n = 11n = 11
Overstory Richness 50.18, 0.0040.6660.2490.1140.35, 0.0050.39, 0.0220.71, 0.002
Overstory Richness All0.0740.3640.8370.175, 0.0050.29, 0.0130.52, 0.0130.41, 0.034
Simpson’s D0.1310.0710.6220.1770.26, 0.0170.40, 0.0370.68, 0.002
Shannon’s H’0.1160.1110.7470.1930.30, 0.0110.46, 0.0220.69, 0.002
P. menziesii % dom.0.4000.183, 0.0040.7370.3260.0930.4040.123
A rubra % dom.0.0900.1700.1260.09, 0.0460.1740.5910.63, 0.004
T. plicata % dom.0.7210.1380.2690.7740.7340.9600.534
A. macrophyllum % dom.0.4480.5400.3270.4080.5480.5530.775
T. heterophylla % dom.0.7520.2400.7400.7990.4380.6580.659
*Values represent the r2 value, and the P-value from regression analysis for significant analyses (bold). For non-significant findings, only the p-value is shown. Overstory Richness 5 includes the 5 most dominant species, while Overstory Richness All includes all 12 species occurring within plots. Tree C represents estimated aboveground tree C for 2008 using all 44 plots. Snag and DWD C represent C pools in 2008 for snags and downed woody debris respectively. Plot C represents aboveground plot C for all 44 plots measured in 2008 including trees, snags, DWD, saplings and understory C. Net change in aboveground tree C is represented by aboveground biomass increment (ABI). The metric ANPPtree (aboveground net primary production of trees) accounts for ABI (averaged over 2006-2008) + average annual litterfall for 2007/2008.
Table 3. Model selection ranking * for the best models predicting aboveground biomass increment (ABI) in plots where N data were also available.
AICcnLik-Modelwi (~probabilities)Evid. Ratio
ABI
Simpson’s D59.90a 111.000.261.00
Shannon’s H’60.88ab 110.610.161.64
Intercept Only60.89ab 110.610.161.65
Overstory Richness 561.25b 110.510.131.97
Overstory Richness All63.27c 110.190.055.41
NH4+63.33c 110.180.055.56
NO3-64.18c 110.120.038.51
NMS Community Similarity64.41c 110.100.039.54
T. heterophylla % dom.64.57c 110.100.0310.35
NO3- + NH4+64.60c 110.100.0210.49
P. menziesii % dom.64.68c 110.090.0210.94
A. macrophyllum % dom.64.76c 110.090.0211.38
T. plicata % dom.64.78c 110.090.0211.50
A rubra % dom.64.82c 110.090.0211.74
All Species106.01d 110.000.001.03E + 10
* Models are ranked from the best (top) to worst (bottom) model based on low AICc values. Letter superscripts (a–c) are shared by models that are statistically indistinguishable from each other based on similar ΔAICc values [63]. All models used the variable listed in the row to predict the C flux indicated in bold along with an intercept value. An “Intercept” only model was also evaluated. The likelihood value predicts a likelihood of the best model given the factors evaluated, the weight of evidence indicates the amount of weight a given factor had in explaining variance compared to other models in the candidate set, and the evidence ratio gives a gambler’s odds or model comparison with the top model.
Table 4. Model selection ranking * for the best models predicting aboveground net primary productivity of trees (ANPPtree) in plots where N data were also available.
AICc nLik-Modelwi (~probabilities)Evid. Ratio
ANPPtree
Shannon’s H’47.46a 81.000.271.00
Simpson’s D48.01ab 80.760.201.32
Overstory Richness All48.07ab 80.740.201.36
Overstory Richness 548.19ab 80.690.191.44
Intercept Only49.56b 80.350.092.87
NH4+54.05c 80.040.0127.00
NMS Community Similarity54.73c 80.030.0138.02
A. macrophyllum % dom.54.88c 80.020.0140.83
P. menziesii % dom.54.99c 80.020.0143.19
A rubra % dom.55.04c 80.020.0144.31
T. plicata % dom.55.05c 80.020.0144.59
T. heterophylla % dom.55.16c 80.020.0146.98
NO3-55.16c 80.020.0147.14
NO3- + NH4+63.15d 80.000.002554.15
All Species133.75e 80.000.005.46E + 18
* Models are ranked from the best (top) to worst (bottom) model based on low AICc values. Letter superscripts (a-c) are shared by models that are statistically indistinguishable from each other based on similar ΔAICc values [63]. All models used the variable listed in the row to predict the C flux indicated in bold along with an intercept value. An “Intercept” only model was also evaluated. The likelihood value predicts a likelihood of the best model given the factors evaluated, the weight of evidence indicates the amount of weight a given factor had in explaining variance compared to other models in the candidate set, and the evidence ratio gives a gambler’s odds or model comparison with the top model.
Table 5. Model selection ranking * for the best models predicting net soil CO2 efflux in plots where N data were also available.
AICc nLik-Modelwi (~probabilities)Evid. Ratio
Net Soil CO2 Efflux
Simpson’s D42.18a 101.000.501.00
Shannon’s H’44.36b 100.340.172.97
Overstory Richness 544.66b 100.290.143.45
A rubra % dom.45.33b 100.210.104.82
Overstory Richness All46.23b 100.130.077.56
Intercept Only50.49c 100.020.0163.74
P. menziesii % dom.50.71c 100.010.0171.11
NMS Community Similarity53.12d 100.000.00237.68
T. plicata % dom.54.16d 100.000.00398.23
T. heterophylla % dom.54.42d 100.000.00454.17
NH4+54.50d 100.000.00472.71
NO3-54.68d 100.000.00516.76
A. macrophyllum % dom.54.78d 100.000.00542.62
NO3- + NH4+60.09e 100.000.007719.19
All Species101.49f 100.000.007.56E + 12
* Models are ranked from the best (top) to worst (bottom) model based on low AICc values. Letter superscripts (a-c) are shared by models that are statistically indistinguishable from each other based on similar ΔAICc values [63]. All models used the variable listed in the row to predict the C flux indicated in bold along with an intercept value. An “Intercept” only model was also evaluated. The likelihood value predicts a likelihood of the best model given the factors evaluated, the weight of evidence indicates the amount of weight a given factor had in explaining variance compared to other models in the candidate set, and the evidence ratio gives a gambler’s odds or model comparison with the top model.

3.2. Biomass-Based Stand Dominance

Because it has been hypothesized that biodiversity-ecosystem function relationships may be driven by single species (see Loreau et al. [21]), the five most biomass-dominant overstory species were selected for analysis of effects of individual tree species dominance on ABI, ANPPtree, overstory biomass C, and net soil CO2 efflux. We found that total biomass of the five dominant tree species within plots initially was not predictive of ABI or ANPPtree (P > 0.05; Table 2). However, when we re-analyzed these data for each species, discounting plots where each given species was absent (zero data not included), we found significant relationships for T. plicata, T. heterophylla and A. rubra and found a weak significant relationship for A. macrophyllum, where individual species biomass dominance in a stand (% dominance) provided predictions of ABI. Contrary to the expectations of hyper-productive species driving positive productivity-diversity relationships, the slopes of our stand dominance by ABI relationships were generally negative (Figure 3), suggesting that most plots were actually less productive when dominated by any single species. Only P. menziesii demonstrated a lack of a significant negative relationship between dominance and ABI when analyzed this way (P > 0.05; Figure 3).
In our model selection approach, diversity models were consistently more predictive than models based on dominance of individual species, models based on presence of all species, or a model based on community similarity among plots (Table 3, Table 4, Table 5). Where single-species biomass values were included as predictor variables for ABI and ANPPtree (Table 3, Table 4, Table 5), biomass dominance was consistently among the lower ranked predictive models. For example, the evidence ratio (Table 3, Table 4, Table 5) indicated that relative biomass of A. rubra (the N-fixing deciduous tree species) had between a 1:12 and a 1:44 odds of producing a better predictive model than the top ranked diversity indices, and the variable only accounted for between 1 and 3% of the explanatory weight (weights of evidence; wi) of all the variables we analyzed. Similarly, the models including all species biomass values or community similarity were generally low-ranked models. In combination, these results suggest that single productive species or predictable groupings of only a few species were unlikely to be driving diversity and aboveground C flux relationships in our study.

3.3. Net Soil CO2 Efflux

In accordance with our predictions of high C flux with increasing plot diversity, soil CO2 efflux demonstrated patterns similar to ABI and ANPPtree. Total growing season soil CO2 efflux demonstrated positive relationships with richness of both the five most dominant species, and all 12 tree species (Table 2). Positive relationships were also found for soil CO2 efflux predicted by H’ and D diversity indices (Figure 4; Table 2). When examining single species relationships, only % stand dominance of A. rubra demonstrated a significant relationship with soil CO2 efflux. This was a relatively strong negative relationship (r2 = 0.63; P < 0.004), where soil CO2 efflux declined as A. rubra presence increased in plots (Table 2). All other relationships between single species dominance and soil CO2 efflux were non-significant (P > 0.05; Table 2). In our model selection approach, the Simpson’s D diversity index was the best ranked model, and this variable had odds of 5:1 of being a better explanatory variable compared to A. rubra presence. Similar to results above, other single species, all-species combinations, or measures of community similarity were not strong predictors of this variable (Table 3, Table 4, Table 5).

3.4. Soil Nutrients

In our model selection approach we directly ranked models predicting C flux which contained inorganic N pools (Table 3, Table 4, Table 5). We consistently found that the inorganic N pools, NO3- and NH4+, and a combination model which included both, provided poorly ranked models in our candidate set, and they were always distinguishable from the better ranked models (Table 3, Table 4, Table 5). We also did not find any significant correlations among soil CO2 efflux values and measured soil nutrients (PO43, K+, Ca2+, NO3, NH4+; All P > 0.05; Table 6). Interestingly, we also did not find any correlations among NO3 or NH4+ and % dominance by A. rubra (P = 0.66 and 0.81 respectively; data not shown).
Figure 3. Influence of overstory stand dominance on overstory Aboveground Biomass Increment carbon (ABI). The five most dominant overstory species are represented (P. menziesii, A. macrophyllum, A. rubra, T. heterophylla, and T. plicata). Data is only shown for plots where each species is present (zero data excluded).
Diversity 04 00033 g003
Figure 4. Positive relationships between soil CO2 efflux and overstory diversity represented by Shannon’s and Simpson’s diversity indices (which includes all 12 overstory species (A)), and Overstory Richness 5 which includes the five most dominate tree species; P. menziesii, A. macrophyllum, A. rubra, T. heterophylla, and T. plicata (B); note that even though five species are represented, maximum species richness in the intensively measured plots was four.
Diversity 04 00033 g004
Figure 5. Percent dominance by biomass of individual species by species richness. Most species were represented evenly across richness categories.
Diversity 04 00033 g005
Table 6. Pearson Product Moment Correlation values and significance for C flux * versus mineral soil chemistry measures.
C flux/poolMineral Soil Chemistry PoolPearson Correlation CoefficientP-value
ABIPO43-–0.040.93
ABIK+–0.480.33
ABICa2+–0.060.91
ABI% C0.090.87
ABINO3-0.370.33
ABINH4+0.130.73
ABI% Moisture0.160.68
ANPPtreePO43-0.030.95
ANPPtreeK+-0.470.35
ANPPtreeCa2+-0.060.91
ANPPtree% C0.040.94
ANPPtreeNO3-0.520.19
ANPPtreeNH4+0.200.64
ANPPtree% Moisture0.540.17
Net Soil CO2 EffluxPO43-0.350.32
Net Soil CO2 EffluxK+–0.030.92
Net Soil CO2 EffluxCa2+0.290.41
Net Soil CO2 Efflux% C0.230.53
Net Soil CO2 EffluxNO3-0.400.25
Net Soil CO2 EffluxNH4+0.230.51
*ABI represents change in aboveground live carbon in trees, ANPPtree represents aboveground net primary productivity C in trees, and % moisture refers to gravimetric soil moisture.

3.5. Carbon Pools

Whole plot C pool estimates, measured in all 44 plots (Table 1), demonstrated a single weak but significant positive relationship with species richness for the five most dominant species, but interestingly total C pool values were not significantly related to H’ or D diversity indices (Table 2). When C pools in trees, DWD, and snags were examined independently (Table 1), only tree C was found to have a positive relationship (albeit a weak relationship; r2 = 0.18; P = 0.004) with richness of the five most dominant species (Table 2). All other relationships among these C pools and richness, H’ and D were non-significant (P > 0.05; Table 2). In all but two cases, relationships between tree, DWD, snag and plot C pools and % stand dominance by any single species were also not significant (Table 2). Snag C pools were significantly (albeit weakly) positively related to % dominance by P. menziesii, and total plot C was negatively (and very weakly) related to % dominance by A. rubra indicating the slight trend for A. rubra-dominated plots to have lower biomass C.

4. Discussion

4.1. Carbon Flux and Diversity

Our data suggest mild positive relationships among both C uptake (measured in aboveground biomass increment (ABI), and tree aboveground net primary productivity (ANPPtree)) and C release from soils with multiple indices of naturally occurring forest diversity. These findings are important for several reasons: (1) These data suggest positive relationships between productivity and diversity in a relatively homogeneous natural system [4,26,33]; (2) natural forest ecosystems may exhibit patterns in productivity-diversity relationships similar to previous grassland studies (e.g., [26]) even when far fewer species are dominant (5 in the current study vs. 16+ in experimental grassland studies); (3) these findings support a productivity-diversity relationship suggested by a recent analysis at the regional scale [4], and may potentially suggest that other regional analyses between productivity and diversity (e.g., [16]) may reflect diversity influences on productivity in addition to site productivity influences on tree diversity; and (4) that more productive forests may also release more C from soils. This last finding is especially important since it demonstrates another side of biodiversity-ecosystem function relationships, where more diverse systems may also release more C back into the atmosphere via belowground autotrophic respiration and decomposition processes (see Litton et al. [17] and Johnson et al. [49]).

4.2. Productivity-Diversity Relationships

Our results generally suggest increased productivity was associated with increases in overstory diversity. Both measures of aboveground productivity (ABI and ANPPtree) generally increased with increases in richness and diversity. While the highest regression coefficients came from relationships with richness and C flux (Figure 2), our model selection analysis indicated that this result may be indistinguishable from relationships with diversity indices such as Shannon’s H’ and Simpson’s D (Table 3, Table 4, Table 5). These findings show concordance among results related to species richness and indices where both species richness and evenness are taken into account (H’ and D). Though regression coefficients were generally not strong, any factor in a complex forest system that accounts for between one third to half of ecosystem carbon flux should be acknowledged.
Other studies in forested and non-forested ecosystems have suggested positive relationships between ecosystem productivity and richness of primary producers at the site level, and a curvilinear relationship when measurements are compared across sites of variable quality [16,25,26,27,28]. However, recent analyses of data spanning forests of the PNW, USA suggest that despite major differences in site characteristics, there is a general increase in productivity along species diversity gradients [4]. Earlier studies have also found correlations across continental scales between forest productivity and diversity [29]. Our data suggest that when larger regional variation in site quality is absent (i.e., with similar climate, relief, topography, parent material, soils, and time since disturbance in our ~400 ha site), productivity-diversity relationships are still apparent. Such findings are important because they demonstrate that patterns from more experimental systems (e.g., experimental grassland systems) may have relevance for natural forested ecosystems.
Additionally, our data suggest that it is possible to detect productivity-diversity relationships on a scale with relatively few species. While a six-species plot is locally diverse in a region characterized by forests dominated by single species (e.g. P. menziesii), this value for species richness is much lower than the 16 species mixtures common to previous grassland studies (e.g., reviewed in Loreau et al. [21]), and forests where previous forest diversity research has been conducted [16,30]. However, even in a gradient that ranges from one to six species, mild positive relationships between productivity and diversity were apparent in our study.

4.3. Possible Mechanisms Explaining Productivity-Diversity Relationships

It has been hypothesized that ecological niche complementarity (where intra-specific differences allow for complementary use of resources, [26]) provides one mechanism where higher productivity at higher diversity levels may occur due to an over-yielding effect [28]. An alternative mechanism suggests higher productivity in higher diversity plots could be explained by “sampling effect” [32], where there is a greater chance of a highly productive species being present in plots with greater species richness. Our data provide observational evidence that complementarity is more likely than sampling effects in our system. We were able to detect weak significant relationships between most species and the productivity index ABI. However, all significant relationships were negative, suggesting that as plots become dominated by a single species they generally became less productive. Thus, contrary to the expectations of sampling phenomena leading to a higher probability of including a hyper-productive species at high diversity levels, we found that plots were less productive as single-species dominance increased, even when observed through the lens of single potentially productive species.
Such a finding is highlighted by our results for A. rubra. Because of its N-fixing association with Frankia sp., A. rubra could drive productivity by increasing N availability. Nevertheless, we found no relationship between A. rubra and plot productivity (P > 0.05; Table 2). A. rubra was also not found to be our most productive species despite N-fixing traits (data not shown), and A. rubra presence consistently produced poorly-ranked predictive models compared to diversity metrics. Although our results in this respect are somewhat surprising, previous studies have found that A. rubra presence only leads to increased productivity in N-limited systems (e.g., [44]). Interestingly, measures of inorganic N pools were similarly non-effective in predicting C flux variation. It is possible that measures of N-mineralization may be more predictive of productivity than inorganic N pools. We also did not find any correlation between A. rubra presence and soil NO3 or NH4+. A. rubra may not have been a vital species determining C flux if N is not limiting. It is important to note that our one-time measures of NO3 and NH4+ do not necessarily reflect N-availability, since N-availability is best measured as N-mineralization over time rather than a one-time pool. Mechanistically, despite high volumetric presence in stands they dominate, declines in plot C in A. rubra-dominated stands (Table 2) might be due to its species-specific density, which is one of the lowest among five dominant tree species. The high N content of A. rubra might also encourage rapid vegetative decomposition and C release. We did not find any correlations, however, between inorganic soil N pools and soil CO2 efflux. If high vegetative N is driving patterns in decomposition and soil CO2 efflux, it does not necessarily result in high inorganic N soils.
Hyper-productive species combinations and consistent changes in plot composition could also be responsible for apparent relationships between productivity and diversity. For example, if a predictable combination of productive species dominate at high species richness values, a change in species composition, not diversity, might drive productivity. In our study, however, species were relatively haphazardly distributed among plots in richness categories (Figure 5). For example, P. menziesii, a dominant conifer, was represented by plots with high P. menziesii biomass across all richness categories (Figure 5). This species was especially prominent in our highest tree richness (6 species) plot, and interestingly this plot also had lower plot C than many of the 5-species plots with more even representation of species (Table 1). Similarly, a model containing biomass distribution of all species individually and a model based on community similarity, were both far less predictive than diversity models in our model selection analysis (Table 3, Table 4, Table 5). Thus, it seems unlikely that a few species or a predictable species combination drives our patterns.

4.4. Net Soil CO2 Efflux and Stand Diversity

Soil CO2 efflux is an important ecosystem process governing the return transfer to the atmosphere of roughly half of all C taken up by plants, and thus variation in this process due to tree diversity has widespread local and global implications. Our data suggest the potential that, in addition to higher C uptake, more diverse forests may also have higher rates of C release from soils. Soil CO2 efflux was significantly related to all indices of overstory diversity, and was not driven by the inclusion of any single overstory species, community similarity, or soil nutrient pools. Since more than half of soil CO2 efflux can be attributable to tree root respiration [64,65], these data suggest that a combination of heterotrophic and autotrophic responses in more diverse stands could lead to higher soil CO2 release. While our sample size was small and our regression coefficients were not always strong, our data compare favorably to measured rates of soil CO2 efflux from soils in other systems [66], and our data may show reduced variation since each plot was sub-sampled in four locations and averaged for every plot measurement.
Recent experimental work with grasslands species has shown that soil CO2 efflux was driven by plant community composition rather than diversity [49]. Other research has only rarely addressed soil CO2 efflux responses to plant species richness, and both positive [67,68] and non-significant effects [69] have been found. Nevertheless, in forested systems, responses of soil CO2 efflux to overstory diversity are not well-understood. Our data suggest that in PNW forests, significant relationships between soil CO2 efflux and diversity may exist and are worthy of further investigation. Further, lack of a relationship between dominance of any single species or community composition and soil CO2 efflux may be suggestive of complementarity effects [26]. From a phenological perspective this makes sense because soil CO2 efflux can be driven by autotrophic respiration [70], and tree species have long been understood to have variable and complimentary phenologies of root production [71]. Thus, for measures such as soil CO2 efflux that require continuous measurement throughout growing and non-growing seasons, complementarity in phenology may ensure continuity of tree root respiration and inputs to the soil microbial community realized as higher annual respiration. We did find interesting declines in soil CO2 efflux associated with A. rubra dominance, and this could be indicative of reduced C allocation belowground in an N-rich species. Our work documents patterns in naturally occurring systems which is a rare but important approach in biodiversity-ecosystem function research [33].

4.5. Carbon Pools

While our sites represented a large range in C pool values for trees, snags, and DWD (Table 1), we found few interesting relationships between forest tree diversity and total accumulated aboveground C pools (Table 2). These results could suggest that although aboveground C flux inputs can be generally higher in more diverse forests, C efflux out of the system, for example soil CO2 efflux, may counter higher C inputs resulting in relatively similar C pools. More productive species and species combinations may decay faster, and result in reduced C pools. Since our study did not holistically address the causes of the lack of relationship between diversity and C storage, these data highlight the need for future C flux research across diversity gradients which integrates C flux into and out of ecosystems above- and belowground.

4.6. Assumptions and Error

We made several assumptions in our methods which could be sources of error in our data, but are likely to wield a small effect on the magnitude of our measurements. For example, biomass estimates based on small diameter plots are likely to produce large variance due to the impact of rare large diameter trees, especially in mixed-age stands. This phenomenon might explain why we do not find any relationships between diversity and total C stock in our plots. Nevertheless, this may be less-problematic in our study as the forest is even aged. Additionally, while the assumption that all saplings had a DBA of 2.5 cm may be a source of error in calculation of plot C pool estimates, sapling abundance contributed minimally to whole plot C estimates (<0.05%). The biomass equation for A. rubra was substituted for the species S. scouleriana, F. purshiana C. cornuta, C. nuttalli, and I. aquifolium as these species did not have an available biomass equation on the BIOPAK database. While these substitutions may be also be source of error in our study, these trees consist of less than 4% of the total number of tagged trees and contributed less than 0.12% of total tree biomass, so their contribution to plot C pools and fluxes are minimal. Finally, it should be noted that our study design generated results that are correlative only, and so should be interpreted with caution.

5. Conclusion

Overall, our data demonstrate the significant potential for future studies testing predictable biodiversity-ecosystem function relationships in second-growth temperate forests. These data suggest: (1) more diverse overstories could also be more productive; (2) such relationships might not be predicable based on the dominance of any single species; and (3) biodiversity-ecosystem function relationships may also extend to soil CO2 efflux, where we found higher CO2 release with a more diverse overstory. Thus 70 years following a clear-cut, more diverse overstories were mildly more productive, but also released more C back to the atmosphere, potentially helping explain the lack of correlation between tree diversity and C pools.

Acknowledgements

This work was made possible by the Evergreen Field Ecology Lab, the academic programs IES–2005/6, IES 2006/7, Field Ecology 2006/8, and Temperate Rainforests 2007. Alison Styring and Paul Przybylowicz were both instrumental in establishing the initial plot network study design. For field and lab support we specifically thank Liam Mueller, Adam Martin, Alison Styring, Paul Przybylowicz, Rob Cole, Jora Rehm-Lorber, Kyle Galloway, Pat Babbin, Josh Brann, Jordan Erickson, Don Loft, Katherine Halstead, Christopher “Digger” Anthony, Margaret Pryor, Casey Broderick, Lindsey Wright, Emily Anderson, Eric Ordway, Rip Heminway, and Greg Stewart. The Evergreen State College Lab and Computer Applications Lab provided significant logistical support. We especially thank Lisa Ellsworth and Creighton Litton for helpful comments on earlier versions of this manuscript. Financial support has been provided by the Evergreen State College Foundation, Evergreen Sponsored Research, The Evergreen Fund for Innovation, and Microsoft Corporation.

References

  1. Schlesinger, W.H. Biogeochemistry: An Analysis Of Global Change; Academic Press: San Diego, CA, USA, 1997; p. 588. [Google Scholar]
  2. Field, C.B.; Behrenfeld, M.J.; Randerson, J.T.; Falkowski, P. Primary production of the biosphere: integrating terrestrial and oceanic components. Science 1998, 281, 237–240. [Google Scholar]
  3. Van Tuyl, S.; Law, B.E.; Turner, D.P.; Gitelman, A.I. Variability in net primary production and carbon storage in biomass across Oregon forests—An assessment integrating data from forest inventories, intensive sites, and remote sensing. Forest Ecol. Manag. 2005, 209, 273–291. [Google Scholar]
  4. Liang, J.; Buongiorno, J.; Monserud, R.A.; Kruger, E.L.; Zhou, M. Effects of diversity of tree species and size on forest basal area growth, recruitment, and mortality. Forest Ecol. Manag. 2007, 243, 116–127. [Google Scholar]
  5. Keeling, R.F.; Piper, S.C.; Heimann, M. Global and hemispheric CO2 sinks deduced from changes in atmospheric O2 concentration. Nature 1996, 381, 218–221. [Google Scholar]
  6. Fan, S.; Gloor, M.; Mahlman, J.; Pacala, S.; Sarmiento, J.; Takahashi, T.; Tans, P. A large terrestrial carbon sink in North America implied by atmospheric and oceanic carbon dioxide data and models. Science 1998, 282, 442–446. [Google Scholar]
  7. Carey, E.V.; Sala, A.; Keane, R.; Callaway, R.M. Are old forests underestimated as global carbon sinks? Glob. Change Biol. 2001, 7, 339–344. [Google Scholar]
  8. Giardina, C.P.; Coleman, M.D.; Binkley, D.; Hancock, J.E.; King, J.S.; Lilleskov, E.A.; Loya, W.M.; Pregitzer, K.S.; Ryan, M.G.; Trettin, C.C. The response of belowground carbon allocation in forests to global change. In Tree Species Effects on Soils: Implications For Global Change; Binkley, D., Menyailo, O., Eds.; Kluwer Academic: Dordrecht, The Netherlands, 2005; pp. 119–154. [Google Scholar]
  9. Lieth, H.F.H. Modeling the primary productivity of the world. In Primary Productivity of The Biosphere; Lieth, H.F.H., Whittaker, R.H., Eds.; Ecological Studies 14; Springer-Verlag: Berlin, Germany, 1975; pp. 237–284. [Google Scholar]
  10. Gholz, H.L. Environmental limits on aboveground net primary production, leaf area, and biomass in vegetation zones of the Pacific Northwest. Ecology 1982, 63, 469–481. [Google Scholar]
  11. Peterson, D.L.; Waring, R.H. Overview of the Oregon transect ecosystem research project. Ecol. Appl. 1994, 4, 211–225. [Google Scholar]
  12. Runyon, J.; Waring, R.H.; Goward, S.N.; Welles, J.M. Environmental limits on net primary production and light-use efficiency across the Oregon transect. Ecol. Appl. 1994, 4, 226–237. [Google Scholar]
  13. Turner, D.P.; Guzy, M.; Lefsky, M.A.; Van Tuyl, S.; Sun, O.; Daly, C.; Law, B.E. Effects of land use and fine-scale environmental heterogeneity on net ecosystem production over a temperate coniferous forest landscape. TELLUS B 2003, 55, 657–668. [Google Scholar]
  14. Law, B.E.; Turner, D.; Campbell, J.; Sun, O.J.; VanTuryl, S.; Ritts, W.D.; Cohen, W.B. Disturbance and climate effects on carbon stocks and fluxes across Western Oregon, USA. Glob. Change Biol. 2004, 10, 1429–1444. [Google Scholar]
  15. Boisvenue, C.; Running, S.W. Impacts of climate change on natural forest productivity–evidence since the middle of the 20th Century. Glob. Change Biol. 2006, 12, 1–21. [Google Scholar]
  16. Swenson, J.J.; Waring, R.H. Modeled photosynthesis predicts woody plant richness at three geographic scales across northwestern USA. Global Ecol. Biogeogr. 2006, 15, 470–485. [Google Scholar]
  17. Litton, C.M.; Raich, J.W.; Ryan, M.G. Review: Carbon allocation in forest ecosystems. Glob. Change Biol. 2007, 13, 2089–2109. [Google Scholar]
  18. Litton, C.M.; Giardina, C.P. Belowground carbon flux and partitioning: Global patterns and response to temperature. Funct. Ecol. 2008, 22, 941–954. [Google Scholar]
  19. Vogel, J.G.; Bond-Lamberty, B.P.; Schuur, E.A.G.; Gower, S.T.; Mack, M.C.; O’Connell, K.B.; Valentine, D.W.; Ruess, R.W. Carbon allocation in boreal black spruce forests across regions varying in soil temperature and precipitation. Glob. Change Biol. 2008, 14, 1503–1516. [Google Scholar]
  20. Odum, E.P. The strategy of ecosystem development. Science 1969, 164, 262–270. [Google Scholar]
  21. Loreau, M.; Naeem, S.; Inchausti, P.; Bengtsson, J.; Grime, J.P.; Hector, A.; Hooper, D.U.; Huston, M.A.; Raffaelli, D.; Schmid, B.; Tilman, D.; Wardle, D.A. Biodiversity and ecosystem functioning: current knowledge and future challenges. Science 2001, 294, 804–808. [Google Scholar]
  22. Fischer, D.G.; Hart, S.C.; LeRoy, C.J.; Whitham, T.G. Variation in belowground carbon fluxes along a Populus hybridization gradient. New Phytol. 2007, 176, 415–425. [Google Scholar]
  23. Lojewski, N.R.; Fischer, D.G.; Bailey, J.K.; Schweitzer, J.A.; Whitham, T.G.; Hart, S.C. Genetic basis of aboveground productivity in two native Populus species and their hybrids. Tree Physiol. 2009, 29, 1133–1142. [Google Scholar]
  24. Chapin, F.S.; Woodwell, G.M.; Randerson, J.T.; Rastetter, E.B.; Lovett, G.M.; Baldocchi, D.D.; Clark, D.A.; Harmon, M.E.; Schimel, D.S.; Valentini, R.; Wirth, C.; Aber, J.D.; Cole, J.J.; Goulden, M.L.; Harden, J.W.; Heimann, M.; Howarth, R.W.; Matson, P.A.; McGuire, A.D.; Melillo, J.M.; Mooney, H.A.; Neff, J.C.; Houghton, R.A.; Pace, M.L.; Ryan, M.G.; Running, S.W.; Sala, O.E.; Schlesinger, W.H.; Schulze, E.D. Reconciling carbon-cycle concepts, terminology, and methods. Ecosystems 2006, 9, 1041–1050. [Google Scholar]
  25. Tilman, D.; Wedin, D.; Knops, J. Productivity and sustainability influenced by biodiversity in grassland ecosystems. Nature 1996, 379, 718–720. [Google Scholar]
  26. Tilman, D.; Reich, P.B.; Knops, J.; Wedin, D.; Mielke, T.; Lehman, C. Diversity and productivity in a long-term grassland experiment. Science 2001, 294, 843–845. [Google Scholar]
  27. Naeem, S.; Thompson, L.J.; Lawler, S.P.; Lawton, J.H.; Woodfin, R.M. Declining biodiversity can affect the functioning of ecosystems. Nature 1994, 368, 734–737. [Google Scholar]
  28. Hector, A.; Schmid, B.; Beierkuhnlein, C.; Caldeira, M.C.; Diemer, M.; Dimitrakopoulos, P.G.; Finn, J.A.; Freitas, H.; Giller, P.S.; Good, J.; Harris, R.; Högberg, P.; Huss-Danell, K.; Joshi, J.; Jumpponen, A.; Körner, C.; Leadley, P.W.; Loreau, M.; Minns, A.; Mulder, C.P.H.; O'Donovan, G.; Otway, S.J.; Pereira, J.S.; Prinz, A.; Read, D.J.; Scherer-Lorenzen, M.; Schulze, E.D.; Siamantziouras, A.S.D.; Spehn, E.M.; Terry, A.C.; Troumbis, A.Y.; Woodward, F.I.; Yachi, S.; Lawton, J.H. Plant diversity and productivity experiments in European grasslands. Science 1999, 286, 1123–1127. [Google Scholar]
  29. Adams, J.M.; Woodward, F.I. Patterns in tree species richness as a test of the glacial extinction hypothesis. Nature 1989, 339, 699–701. [Google Scholar]
  30. Scherer-Lorenzen, M.; Körner, C. Forest diversity and function. In Temperate and Boreal Systems; Schulze, E.D., Ed.; Springer: Berlin, Germany, 2005; p. 400. [Google Scholar]
  31. Naeem, S.; Thompson, L.J.; Lawler, S.P.; Lawton, J.H.; Woodfin, R.M. Biodiversity and ecosystem functioning: Empirical evidence from experimental microcosms. Philos. T. Roy. Soc. B 1995, 347, 249–262. [Google Scholar]
  32. Aarssen, L.W. High productivity in grassland ecosystems: Effected by species diversity or productive species? Oikos 1997, 80, 183–184. [Google Scholar] [CrossRef]
  33. Duffy, J.E. Why biodiversity is important to the functioning of real-world ecosystems. Front. Ecol. Environ. 2009, 7, 437–444. [Google Scholar]
  34. Ellison, A.M.; Bank, M.S.; Clinton, B.D.; Colburn, E.A.; Elliott, K.; Ford, C.R.; Foster, D.R.; Kloeppel, B.D.; Knoepp, J.D.; Lovett, G.M.; Mohan, J.; Orwig, D.A.; Rodenhouse, N.L.; Sobczak, W.V.; Stinson, K.A.; Stone, J.K.; Swan, C.M.; Thompson, J.; von Holle, B.; Webster, J.R. Loss of foundation species: consequences for the structure and dynamics of forested ecosystems. Front. Ecol. Environ. 2005, 9, 479–486. [Google Scholar]
  35. Scott, N.A.; Binkley, D. Foliage litter quality and net N mineralization: Comparison across North American forest sites. Oecologia 1997, 111, 151–159. [Google Scholar]
  36. Binkley, D.; Menyailo, O. Tree Species Effects on Soils: Implications for Global Change; Springer: Dordrecht, The Netherlands, 2005; p. 358. NATO Science Series. [Google Scholar]
  37. Hart, S.C.; Binkley, D.; Perry, D.A. Influence of red alder on soil nitrogen transformations in two conifer forests of contrasting productivity. Soil Biol. Biochem. 1997, 29, 1111–1123. [Google Scholar]
  38. Bormann, B.T.; Cromack, K.; Russell, W.O. Influences of red alder on soils and long-term ecosystem productivity. In The Biology and Management of Red Alder; Hibbs, D.E., DeBell, D.S., Tarrant, R.F., Eds.; Oregon State University Press: Corvallis, OR, USA, 1994; pp. 47–56. [Google Scholar]
  39. Comeau, P.G.; Harper, G.J.; Biring, B.S.; Fielder, P.; Reid, W. Effects of red alder on stand dynamics and nitrogen availability (MOF EP1121.01). British Columbia Ministry of Forests and Range Research Branch: Victoria, B.C., Canada, 1997; Extension Note 76. [Google Scholar]
  40. Deal, R.L.; Harrington, C.A. Red alder: A state of knowledge. In USDA Forest Service General Technical Report; PNW-GTR-669; Pacific Northwest Research Station: Portland, OR, USA, 2006; p. 150. [Google Scholar]
  41. Tarrant, R.F. Stand development and soil fertility in a Douglas-fir red alder plantation. Forest Sci. 1961, 7, 238–246. [Google Scholar]
  42. Tarrant, R.F.; Miller, R.E. Accumulation of organic matter and soil nitrogen beneath a plantation of red alder and Douglas-fir. Soil. Sci. Soc. Am. ProC. 1963, 27, 231–234. [Google Scholar]
  43. Miller, R.E.; Murray, M.D. The effect of red alder on growth of Douglas-fir. In Utilization and Management of Alder; Briggs, D.G., DeBell, D.S., Eds.; USDA Forest Service General Technical Report PNW-FRES-70; USDA Forest Service: Washington, DC, USA, 1978; pp. 283–306. [Google Scholar]
  44. Binkley, D.; Sollins, P.; Bell, R.; Sachs, D. Biogeochemistry of adjacent conifer and alder-conifer stands. Ecology 1992, 73, 2022–2033. [Google Scholar]
  45. Van Breeman, N.; Finzi, A.C. Plant-soil interactions: Ecological aspects and evolutionary implications. Biogeochemistry-US 1998, 42, 1–19. [Google Scholar] [CrossRef]
  46. Spears, J.D.H.; Lajtha, K.; Caldwell, B.A.; Pennington, S.B.; Vanderbilt, K. Species effects of Ceanothus velutinus versus Pseudotsuga menziesii, Douglas-fir, on soil phosphorus and nitrogen properties in the Oregon Cascades. Forest Ecol. Manag. 2001, 149, 205–216. [Google Scholar]
  47. Selmants, P.; Hart, S.C.; Boyle, S.I.; Stark, J.M. Red alder (Alnus rubra) alters community-level soil microbial function in conifer forests of the Pacific Northwest, USA. Soil Biol. Biochem. 2005, 37, 1860–1868. [Google Scholar]
  48. Clark, D.A.; Brown, S.; Kicklighter, D.W.; Chambers, J.Q.; Thomlinson, J.R.; Ni, J. Measuring net primary production in forests: Concepts and field methods. Ecol. Appl. 2001, 11, 356–370. [Google Scholar]
  49. Johnson, D.; Phoenix, G.K.; Grime, G.P. Plant community composition, not diversity, regulates soil respiration in grasslands. Biol. Lett. 2008, 4, 345–348. [Google Scholar]
  50. TESC Scientific Computing Weather Station. 2011. Available online: http://scicomp.evergreen.edu/ (accessed on 22 March 2011).
  51. USDA Natural Resources Conservation Service. Web Soil Survey. USDA-Natural Resources Conservation Service: Washington, DC, USA, 2011. Available online: http://websoilsurvey.nrcs.usda.gov/ (accessed on 29 June 2011).
  52. Nezat, C.A.; Blum, J.D.; Klaue, A.; Johnson, C.E.; Siccama, T.G. Influence of landscape position and vegetation on long-term weathering rates at the Hubbard Brook Experimental Forest, New Hampshire, USA. Geochimica et Cosmochimica Acta 2004, 68, 3065–3078. [Google Scholar]
  53. Robertson, G.P.; Wedin, D.; Groffman, P.M.; Blair, J.M.; Holland, E.A.; Nadelhoffer, K.J.; Harris, D. Soil carbon and nitrogen availability. In Standard Soil Methods for Long-Term Ecological Research; Robertson, G.P., Ed.; Oxford University Press: New York, NY, USA, 1999; pp. 258–271. [Google Scholar]
  54. Cairns, M.A.; Brown, S.; Helmer, E.H.; Baumgardner, G.A. Root biomass allocation in the world’s upland forests. Oecologia 1997, 111, 1–11. [Google Scholar] [CrossRef]
  55. McGaughey, R.J.; Carson, W.W.; Reutebuch, S.E.; Andersen, H.E. Direct measurement of individual tree characteristics from LiDAR data. In Proceedings of the Annual ASPRS Conference, Denver, American Society of Photogrammetry and Remote Sensing, Bethesda, MD, USA, 2004.
  56. USDA Forest service. Available online: http://www.fs.fed.us/eng/rsac/fusion/ (accessed on 25 April 2010).
  57. Standish, J.T.; Manning, G.H.; Demaershalk, J.P. Development of biomass equations for British Columbia tree species. Inf. Rep. BC-X-264. Canadian Forestry Service, Pacific Forest Research Center: Victoria, BC, Canada, 1985; p. 48. [Google Scholar]
  58. Means, J.E.; Hansen, H.A.; Koerper, G.J.; Alaback, P.B.; Klopsch, M.W. Software for computing plant biomass—BIOPAK user’s guide. USDA Forest Service General Technical Report PNW-GTR-340. Pacific Northwest Research Station: Portland, OR, USA, 1994; p. 180. [Google Scholar]
  59. Gholz, H.L. Equations for estimating biomass and leaf area of plants in the Pacific Northwest. Forest Research Lab., Oregon State University, School of Forestry: Corvallis, OR, USA, 1979. [Google Scholar]
  60. Harmon, M.E.; Sexton, J. Guidelines for measurements of woody debris in forest ecosystems. Publications No. 2255. U.S. LTER Network Office, University of Washington: Seattle, WA, USA, 1996; p. 73. [Google Scholar]
  61. Maser, C.; Anderson, R.G.; Ralph, G.; Cromack, K.; Williams, J.T.; Martin, R.E. Dead and down woody material. In Wildlife Habitats in Managed Forests: The Blue Mountains of Oregon and Washington; Thomas, J.W., Ed.; US Forest Service: Washington, DC, USA, 1979; Volume No. 553, pp. 22–39. [Google Scholar]
  62. McCune, B.; Grace, J.B. Analysis of Ecological Communities; MjM Software: Gleneden Beach, OR, USA, 2002; p. 304. [Google Scholar]
  63. Burnham, K.P.; Anderson, D.R. Model Selection and Multimodel Inference; A Practical Information-Theoretic Approach; Springer-Verlag: New York, NY, USA, 2002; p. 488. [Google Scholar]
  64. Hanson, P.J.; Edwards, N.T.; Garten, C.T.; Andrews, J.A. Separating root and soil microbial contributions to soil respiration: A review of methods and observations. Biogeochemistry-US 2000, 48, 115–146. [Google Scholar] [CrossRef]
  65. Högberg, P.; Nordgren, A.; Buchmann, N.; Taylor, A.F.S.; Ekblad, A.; Högberg, M.; Nyberg, G.; Ottosson-Löfvenius, M.; Read, D.J. Large-scale forest girdling shows that current photosynthesis drives soil respiration. Nature 2001, 411, 789–792. [Google Scholar]
  66. Raich, J.W.; Schlesinger, W.H. The global carbon dioxide flux in soil respiration and its relationship to vegetation and climate. Tellus B 1992, 44, 81–99. [Google Scholar]
  67. Craine, J.M.; Wedin, D.A.; Reich, P.B. The response of soil CO2 flux to changes in atmospheric CO2, nitrogen supply and plant diversity. Glob. Change Biol. 2001, 7, 947–953. [Google Scholar]
  68. Zak, D.R.; Holmes, W.E.; White, D.C.; Peacock, A.D.; Tilman, D. Plant diversity, soil microbial communities and ecosystem function: Are there any links? Ecology 2003, 84, 2042–2050. [Google Scholar] [CrossRef]
  69. De Boeck, H.J.; Lemmens, C.M.; Vicca, S.; Van den Berge, J.; Van Dongen, S.; Janssens, I.A.; Ceulemans, R.; Nijs, I. How do climate warming and species richness affect CO2 fluxes in experimental grasslands? New Phytologist 2007, 175, 512–522. [Google Scholar] [CrossRef]
  70. Campbell, J.L.; Sun, O.J.; Law, B.E. Supply-side controls on soil respiration among Oregon forests. Glob. Change Biol. 2004, 10, 1857–1869. [Google Scholar]
  71. Lyr, H.; Hoffman, G. Growth rates and growth periodicity of tree roots. Int. Rev. Forest. Res. 1967, 2, 181–236. [Google Scholar]

