Abstract
Threatened species often exhibit low genetic diversity as a result of selective sweeps, historical bottlenecks, or persistent small population size. Whereas selective sweeps create localized reduction of variation at a chromosome, population bottlenecks result in the loss of rare alleles throughout the genome. Heterozygosity is lost more slowly and is severely impacted only when populations are small for an extended period of time. We test the hypotheses of selective sweep, historical bottleneck and persistently small population size to explain extremely low genetic diversity in the critically endangered Hawaiian monk seal (Monachus schauinslandi). Of 163 microsatellite loci isolated from the species’ genome, only 17 are polymorphic. Mapping 98 monomorphic and 12 polymorphic loci to 35 chromosomes throughout the dog genome, we reject the selective sweep hypothesis. Genotyping 2,423 Hawaiian monk seals at the 17 polymorphic loci plus a locus previously isolated from another pinniped species, we find evidence for a recent bottleneck (P = 0.04). This is consistent with historical records describing intense hunting in the 19th century; however, the bottleneck was not of sufficient severity and duration to explain the genome-wide depletion of genetic diversity (HO = 0.05; A = 1.1). Long-term population size restriction is a more likely explanation. Though at least two of the polymorphic loci appear to be candidates for selection, the low genetic diversity of the species may further threaten chances for survival of this critically endangered species in a changing world.
1. Introduction
Genetic variation is essential to population persistence as the raw material upon which natural selection acts. Threatened species are often characterized by low genetic diversity [1,2,3,4], further compromising their ability to adapt to environmental changes or to mount an effective immune response [5,6,7]. Over-exploitation, loss of habitat, climate change and other anthropogenic impacts have significantly reduced the size of many natural populations [8,9], depleting their genetic diversity and increasing their risk of extinction [10]. Temporary reductions in population size (i.e., population bottlenecks) result in the loss of rare alleles with little impact on heterozygosity [11,12,13]. Heterozygosity (H) is lost only when the effective population size (Ne) remains small for long periods of time (t) as described in the following equation [14]:
Ht = H0(1 − 1/2Ne)t
Genetic diversity may also be reduced by natural selection. Under positive directional selection for an allele (or purifying selection against all but one allele), fitness-related loci may become monomorphic. Physically linked loci (those located near the locus under selection) may also lose genetic variation in a process termed selective sweep or genetic hitch-hiking [15]. In such instances, the loss of variation is localized to a region on a chromosome (or chromosomes in more complex traits [16]), though there are mechanisms by which a selective sweep will impact an entire genome [14].
The critically endangered and endemic Hawaiian monk seal (Monachus schauinslandi) exhibits extremely low genetic diversity at all markers tested to date. The species exhibits alarming uniformity in MHC class I genes [17], which play an important role in the immune response of vertebrates [18,19]. Kretzmann et al. [20] describe only three mitochondrial haplotypes in 50 individuals. Gemmell et al. [21] survey 18 pinnipeds at 20 microsatellite loci and find the Hawaiian monk seal to have the lowest genetic diversity, with only three polymorphic loci. Its genetic diversity is even lower than that of the Mediterranean monk seal (M. monachus, polymorphic at 12 loci), of which only ~400 individuals remain [21]. Schultz et al. [22] identify only seven variable microsatellite loci of 143 isolated from the Hawaiian monk seal genome.
What has depleted the genetic diversity of the Hawaiian monk seal? A review of its history reveals several hypotheses. The species diverged from the Mediterranean monk seal and the now extinct Caribbean monk seal (M. tropicalis) 10–13 MYA [23,24]. Monk seals likely moved from the Atlantic to the Pacific via the tropical Central American Seaway; thus, colonization of the Hawaiian archipelago (Figure 1) may have occurred as early as 13 MYA or as late as 3.5 MYA, when the Isthmus of Panama emerged [23,24]. It is likely that few individuals colonized the Hawaiian archipelago, which required crossing the East Pacific Barrier, 4,000–7,000 km of uninterrupted deep water between the central Pacific and the Americas [25].
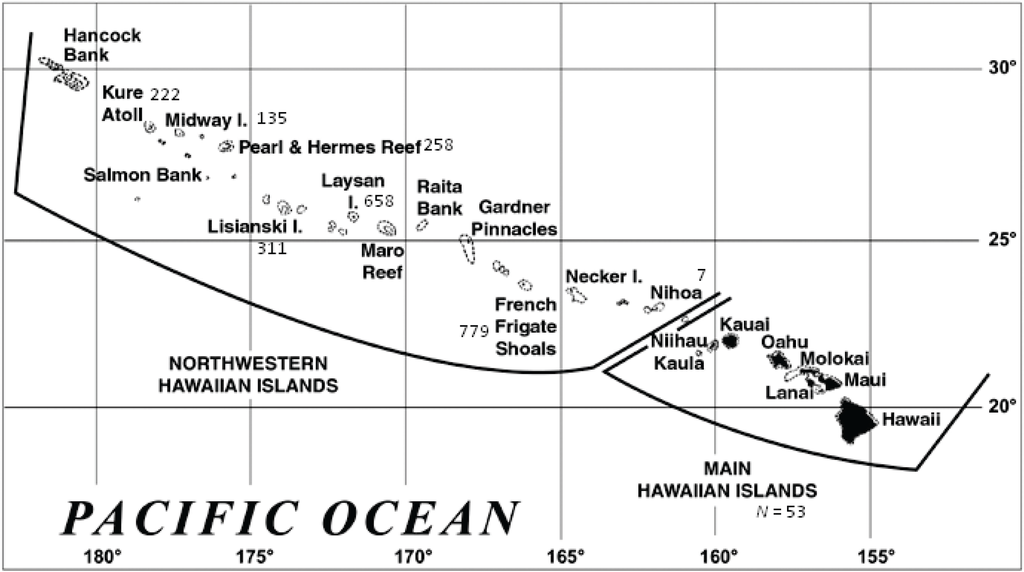
Figure 1.
The Hawaiian archipelago (www.noaa.gov). Numbers reflect the genetic sample size from each location.
We know little regarding the distribution or abundance of the species when the first Polynesians arrived at the Hawaiian archipelago, as early as 2,000 years ago [26]. While Hawaiians likely knew of ‘ilio-holo-i-ka-uaua (i.e., the dog that runs in the rough waters) prior to Western exploration of the archipelago [27], it is not mentioned in the Kumulipo, the Hawaiian chant of creation [28]. There is, however, mention of a rat running beside the waves (‘iole-holo-i-ka-uaua), as well as a train of walruses passing by milling about in the depths of the sea (O ke ka‘ina a palaoa e ka‘i nei, E kuwili o ha‘aha‘a i ka moana [29]). We are unaware of any traditional chant containing the species’ name, and monk seal remains have only been found at one archeological site, on the Big Island of Hawai‘i, radiocarbon dated to 1400–1750 AD [30].
No seals were documented in the main Hawaiian Islands (MHI) when the first Europeans arrived in the 18th century [31,32]. Sailing throughout the Northwestern Hawaiian Islands (NWHI) in 1805, the Russian explorer Lisianski provided the first written account of the species [33]. From 1805 to 1886, thousands of seals were killed for their meat, skins and oil by sealers and shipwrecked sailors (Table 1 [31,34]). Few were observed by the turn of the century [31], with the nadir of the bottleneck estimated to be a minimum of 23 individuals [19]. Though the population grew to perhaps a few thousand seals by 1958, less than 1,200 survive today [35].
Does the 19th century hunting-induced bottleneck (which lasted less than 100 years or approximately eight monk seal generations) account for the paucity of genetic variation? An alternate hypothesis is that chronic small population size reduced genetic diversity throughout the genome. Two explanations may account for this hypothesis: (1) the archipelago was colonized by a few individuals, and the species never grew larger than a few thousand seals; or (2) the first Polynesians to arrive in Hawai‘i quickly extirpated the seals from the MHI [31], with subsequent hunting restricting population growth and expansion for hundreds of years. Finally, genetic variation could have been lost in regions of the genome as a result of a selective sweep after the introduction of diseases from the first humans or the mammals they brought with them (e.g., dogs and rats). Here we further investigate genetic diversity in the Hawaiian monk seal. We evaluate hypotheses explaining the loss of variation including: selective sweep, population bottleneck and chronic small population size.

Table 1.
Nineteenth century hunting of the Hawaiian monk seals, summarized from Ragen, Table 1 [31].
| Year | Site | Vessel | Event | Seals taken |
|---|---|---|---|---|
| 1805 | Lisianski | Neva | Tour | 4 |
| 182? | NWHI | General Gates | Sealing | “all” |
| 1842 | Kure | Parker | Wrecked | ~60 |
| 1850 | Lisianski | Holder Borden | Wrecked | ? |
| 1850 | Pearl Hermes Reef | Rodolf | Tour | 10–12 |
| 1859 | French Frigate Shoals | Gambia | Sealing | 150 |
| 1859 | NWHI | Gambia | Sealing | 1,500 |
| 1870 | Midway, Kure | Saginaw | Wrecked | > 60 |
| 1886 | Laysan | General Siegel | Shark fishing | ? |
2. Results and Discussion
This study confirms previously described low genetic diversity in the Hawaiian monk seal [17,18,19,20]. Of 163 microsatellite loci isolated from the Hawaiian monk seal genome, we find only 17 to be polymorphic. From the first 143 loci analyzed, only seven are polymorphic [19], while 136 are monomorphic (Genbank Accession # GU206382–GU206527). After finding such low genetic diversity in our first attempt, we made our microsatellite selection criteria more stringent (17 or more repeats for dinucleotides and 11 or more for tetranucleotides) such that only longer repeat sequences were analyzed to increase the percentage of variable markers. Of the additional 20 loci isolated, ten are polymorphic (Table 2), six are monomorphic, two amplify multiple products and two are difficult to score (Genbank Accession # GU206362–GU206381). When all loci (monomorphic and polymorphic) are considered, genetic diversity is virtually depleted (HO = 0.05; A = 1.1).
We used the 17 polymorphic loci and a single locus isolated from the grey seal [36] to amplify DNA in 2,423 Hawaiian monk seals. We performed several quality checks on our dataset. There is a single discrepancy (a mis-scored allele) in 780 alleles (0.1% per allele error rate). We find no evidence for deviation from Mendelian inheritance, null alleles or large allele dropout. Though four of eighteen loci (Msc01, Msc10, Msc09 and Msc23) are significantly different from Hardy-Weinberg expectations at α = 0.05, none are significant after a sequential Bonferroni correction for multiple tests (P = 0.003). Nine pairs of loci (Msc01 × Msc03, Msc19; Msc03 × Msc04, Msc09, Msc13, Msc19; Msc04 × Msc05, Msc19; and Msc05 × Msc23) exhibit linkage disequilibrium at α = 0.05, but none are significant after a sequential Bonferroni correction (P = 0.0003). Furthermore, none of these are mapped to the same chromosome in the dog genome (Figure 2), though we were unable to map Msc03 and Msc13. We conclude that non-random association of alleles is not caused by physical linkage of loci but rather by chance and the small effective population size of this species (Ne = 369; 95% CI = 290−473).
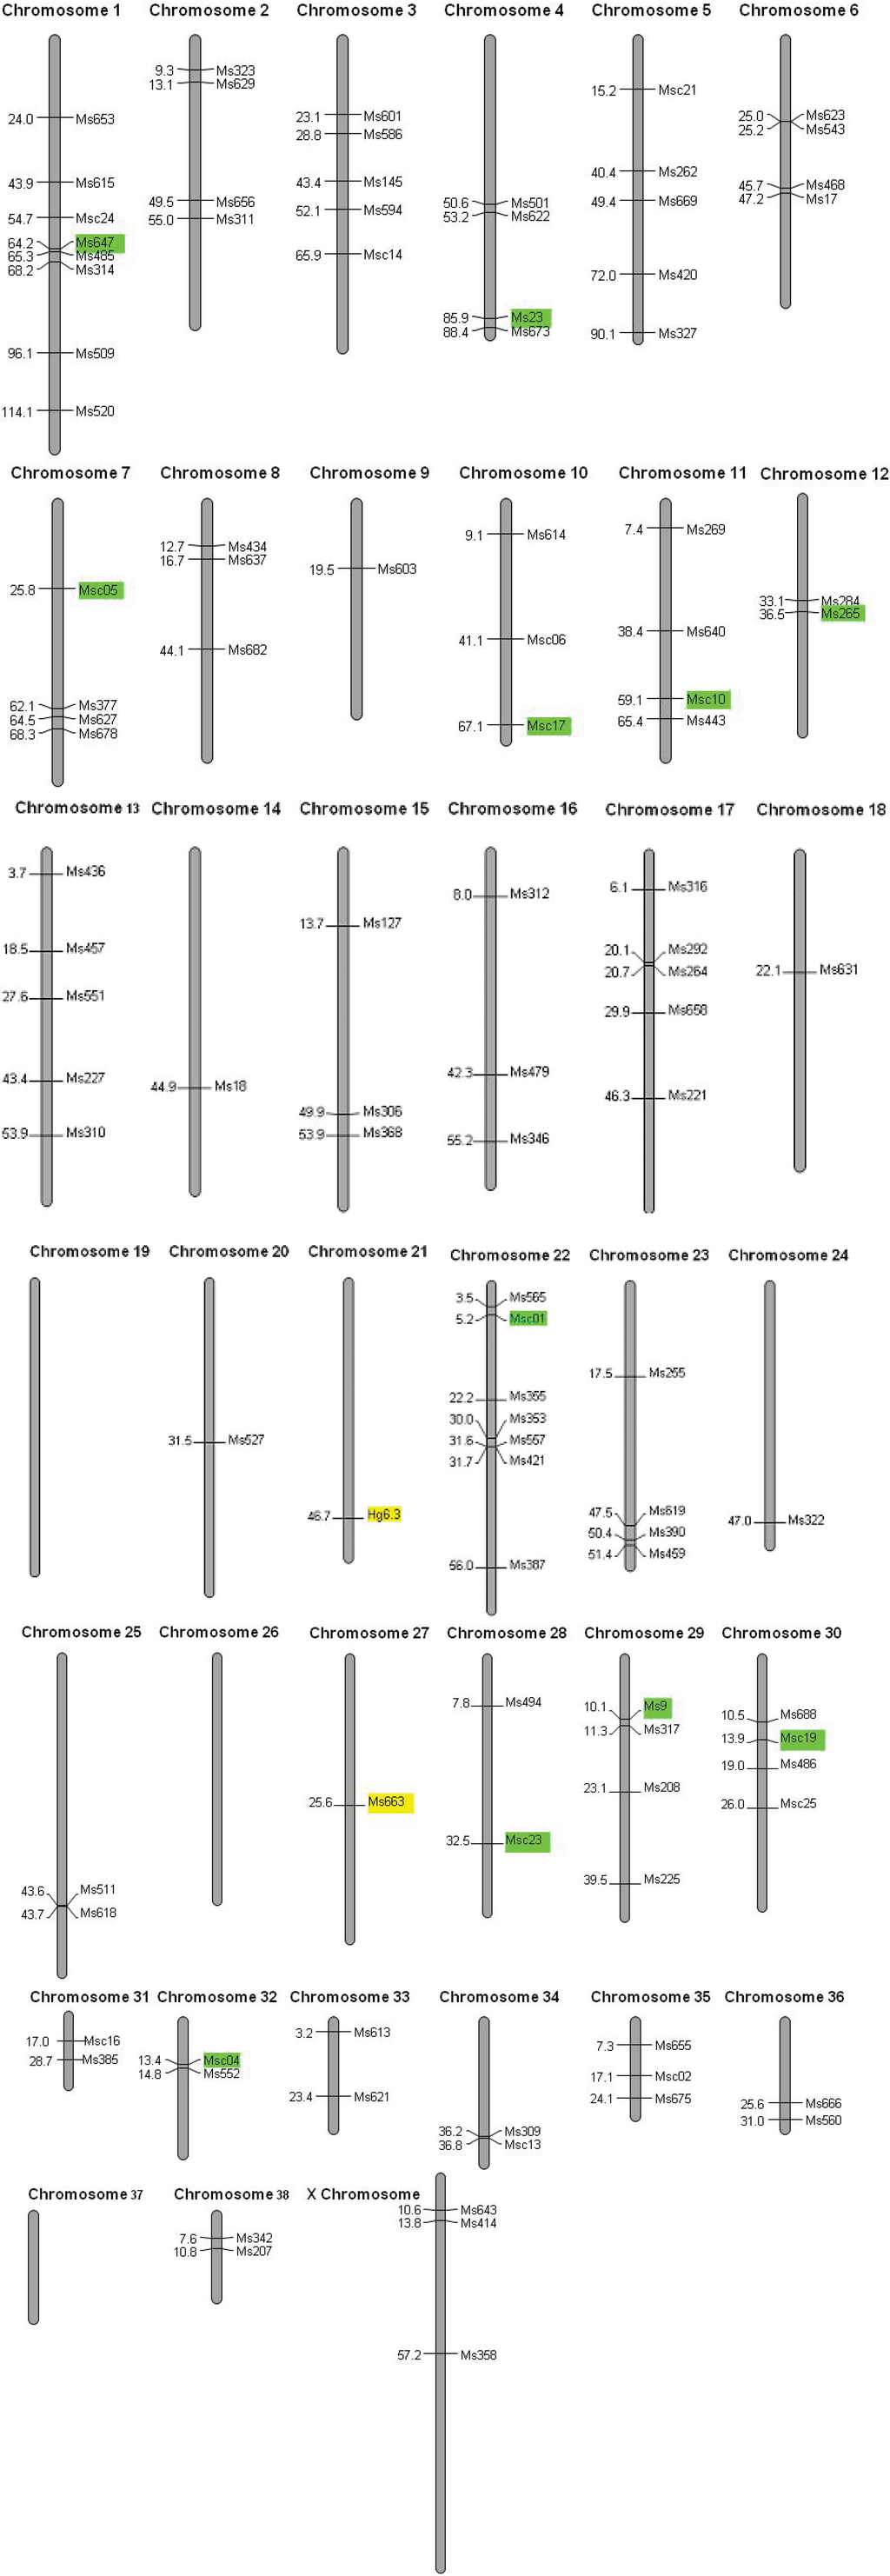
Figure 2.
Hawaiian monk seal microsatellites mapped onto the dog genome. Polymorphic microsatellites are color coded according to an FST outlier test for selection (yellow = balancing selection; green = neutral).
Table 2.
Polymorphic microsatellite loci, including the size of the alleles, observed (HO) and expected (HE) heterozygosities, number of alleles (A), and a test for a population bottleneck (DH/sd). We also include LOSITAN results, including the 95% confidence intervals (CI) for simulated FST values, given heterozygosity of the loci, and the probability (P) that the simulated FST < sample FST.
| Locus | Reference | Genbank # | Repeat motif | Primers | Size | HO | HE | A | DH /sd | CI | P |
|---|---|---|---|---|---|---|---|---|---|---|---|
| Msc01 | This study | GU206362 | (AC)18 | F: ATTTTAATTATGGGTTACTTTGAACC R: TCACCATTTAATGCATATGAGC | 161–167 | 0.47 | 0.49 | 3 | 0.13 | 0.004–0.033 | 0.962 |
| Msc03 | This study | GU206363 | (TG)21 | F: TGGTCTTTCTTAAGGCCAAG R: ATATGGAAGCAGCCCAAGTG | 126–136 | 0.70 | 0.71 | 5 | 1.14 | 0.007–0.025 | 0.999 |
| Msc04 | This study | GU206364 | (TATC)14 | F: CTTTAGTTTCCGGTGTTCAGTG R: CTCAGGGTTGTGAGTTCAAGC | 159–167 | 0.52 | 0.52 | 4 | 0.29 | 0.005–0.029 | 0.445 |
| Msc05 | This study | GU206365 | (GATA)11 | F: TGGTCTCAAGTTGGAGGATTG R: AAGCCATTGAGTGTGATGGAC | 198– 206 | 0.27 | 0.27 | 3 | −0.41 | 0.004–0.034 | 0.922 |
| Msc09 | This study | GU206366 | (CTAT)13 | F: GCCTGATTTGCCTCTTCTTC R: GCGTCAGAAAGACACAGGAG | 208–216 | 0.28 | 0.29 | 3 | −1.26 | 0.004–0.032 | 0.579 |
| Msc10 | This study | GU206367 | (TATC)13 | F: CCTCCATCGCTACCATCTTC R: TGAACGCAAGTGGATGAGTC | 141–149 | 0.47 | 0.48 | 3 | 0.07 | 0.004–0.033 | 0.903 |
| Msc13 | This study | GU206368 | (CA)20 | F: CACCTTTGGCTTCCAGTGTC R: ATTCGGTGGTGGCTTTTATG | 194–202 | 0.40 | 0.40 | 3 | −0.48 | 0.004–0.031 | 0.488 |
| Msc17 | This study | GU206370 | (GT)24 | F: GCAAGGAGAAGCTACAGAAGG R: CCCTGCTAACTGGTTTCTGC | 115– 119 | 0.50 | 0.51 | 3 | 0.93 | 0.003–0.036 | 0.483 |
| Msc19 | This study | GU206371 | (CTAT)11 | F: GGCTATTGGCCAACTGGTAG R: TTGGCCTGCTCCAATAAGAC | 118–138 | 0.24 | 0.24 | 4 | −3.68 | 0.004–0.035 | 0.166 |
| Msc23 | This study | GU206372 | (GATA)2 (GAT) (GATA)2 (GAT) (GATA)15 | F: GCTTCTCTGTTTCTATCTCAAATAAAT R: CTCCTTCCTGGCTGCTTATG | 160–168 | 0.48 | 0.50 | 3 | 0.14 | 0.004–0.031 | 0.841 |
| Ms9 | Schultz et al. 2009 | EU913766 | (GAAA)18 | F: CCAAAGCCTATTTCTTTCAATCC R: AGCAGAGGCCCTAAGACAGG | 297–317 | 0.67 | 0.68 | 6 | 0.42 | 0.006–0.027 | 0.334 |
| Ms15 | Schultz et al. 2009 | EU913767 | (CCTT)6 CCCT (CCTT)6 | F: CTGAATTCATGCTGTATCTTGG R: GTGCTTGGGACATGATGG | 203–315 | 0.54 | 0.56 | 3 | 1.27 | 0.006–0.030 | 0.514 |
| Ms23 | Schultz et al. 2009 | EU913768 | (GAAA)9 GGAA (GAAA)8 | F: CGCTTAGTGTGGAGTCACTTAGG R: GTGAGATGAATGCCCTTTGG | 340–370 | 0.76 | 0.78 | 9 | 0.43 | 0.008–0.024 | 0.584 |
| Ms265 | Schultz et al. 2009 | EU913769 | (GT)13 | F: GACTGGTAATTTACGCCCTACC R: AAGTGTTGGGTTGAAAATTGG | 158,162 | 0.50 | 0.49 | 2 | 0.80 | 0.004–0.032 | 0.311 |
| Ms504 | Schultz et al. 2009 | EU913763 | (AAG)24 | F: ATCAGCTATCAGGGGTAGGG R: GTCATTCCCTAGTGGTAAAGACTC | 308,326 | 0.28 | 0.29 | 2 | 0.94 | 0.004–0.033 | 0.394 |
| Ms647 | Schultz et al. 2009 | EU913765 | (TG)14 | F: GAACTCCAAACAGCCATTCC R: CCTGCTCCTTCTTTCTGATCC | 115,117 | 0.44 | 0.46 | 2 | 1.97 | 0.004–0.033 | 0.665 |
| Ms663 | Schultz et al. 2009 | EU913764 | (TC)11 | F: TCAACTTCTCAATTTAGGATTCACA R: GCAAAAAGGGATGAGCCATA | 290,294 | 0.31 | 0.31 | 2 | 1.13 | 0.004–0.033 | 0.002 |
| Hg6.3 | Allen et al. 1995 | G02092 | (GT)18 | F: CAGGGGACCTGAGTGCTTATG R: GACCCAGCATCAGAACTCAAG | 227,237 | 0.36 | 0.36 | 2 | 1.43 | 0.004–0.031 | 0.000006 |
The low genetic diversity could be the result of a selective sweep, a recent population bottleneck, or long-term small population size. In a selective sweep, directional selection would cause fitness-related loci to go to fixation; physically linked loci would likewise become fixed at a single allele, resulting in regional loss of genetic variation. We are able to map 110 of the 163 Hawaiian monk seal loci to the dog genome, indicating substantial sequence conservation in the two genomes (Figure 2). Each polymorphic locus is assigned to a different chromosome, and monomorphic loci are located on 35 of 38 chromosomes, supporting the long-term small population size hypothesis and arguing against a selective sweep.
Genetic diversity is low at all polymorphic loci (HO = 0.46; A = 3.4; Table 2). Allelic richness (measured at the minimum sample size of 1,787) ranges from two to nine alleles per locus. We find evidence for a recent bottleneck (P = 0.04), with the proportion of loci exhibiting heterozygosity excess larger than expected at equilibrium. In addition, the average standardized difference between observed and expected heterozygosity is significantly different from zero at most loci (i.e., DH/sd > 0) with the exceptions of Msc 5, 9, 13 and 19 (Table 2). These results are supported by historical documents describing the rapid decline of the species in the 19th century. The first written account of the Hawaiian monk seal dates from 1805, when Lisianski sailed to the Northwestern Hawaiian Islands (NWHI). Several references describe an abundance of seals [37,38,39], and decades of direct hunting for oil and skins and indirect hunting by shipwrecked sailors ensued (Table 1 [31,34]). By 1890, few seals were observed at any island [31,40].
The question remains whether this 19th century bottleneck was of sufficient severity and duration to nearly deplete the genetic diversity of the species. An effective population size of Ne = 2 for ten generations (Figure 3) is required to achieve the present level of heterozygosity (assuming an initial heterozygosity of HO = 0.75 [41]). While this is not impossible, it seems unlikely given that 1,500 seal skins were reportedly landed by the Gambia in 1859 [31] and that by 1958, 900 non-pup individuals were observed during NWHI beach counts [42]. Assuming the accuracy of the early reports, it is difficult to believe that the species was reduced to Ne = 2 for 130 years (given the current generation time of 13 years).
A more likely scenario is that heterozygosity had been reduced prior to the 19th century bottleneck. The first Polynesians arrived in Hawaii as early as 2,000 years ago [26] and may have extirpated the species from the main Hawaiian Islands [31]. Given that these islands are larger, with more beach area, the MHI may have once been the primary habitat for the Hawaiian monk seal, with the NWHI serving as peripheral habitat [32]. Persistent hunting of monk seals in the MHI for 2,000 years could have greatly reduced effective population size and genetic diversity. There are two documented records of Hawaiians killing monk seals for food, both occurring on the Big Island of Hawai‘i: the remains found at an upland agricultural site dating back to 1400–1750 [30], and the record of a seal that was towed ashore, killed and eaten in 1900 [43].
Alternatively, low genetic diversity could be a characteristic of this large, insular carnivore. Frankham [10] predicts that genetic diversity may be lowered by several factors, most of which describe the Hawaiian monk seal: small population size, restricted habitat, large body size, and island inhabitation. We calculate that the observed loss of heterozygosity could be explained by Ne = 200 for 1,000 generations (~13,000 years) or Ne = 500 for 2,500 generations (or 32,500 years). At population sizes greater than Ne = 500, microsatellite diversity is unlikely to be lost at a rate faster than it is replenished by mutation [44,45]. Mating systems may also have an impact on genetic diversity. Strong deviation from monogamy could result in lowered genetic diversity and effective population size; however, the Hawaiian monk seal does not appear to be haremic. Males compete to lie next to a female on the beach, eventually following her to sea to mate. As adult females are larger than males, it is presumed that they are able to exert mate choice and escape unwanted advances. Given the time required to “court” a female, it is likely that Hawaiian monk seals are either mildly polygynous or sequentially monogamous (i.e., males mating with a single female each season) though paternity analyses are required to test these hypotheses. The most likely scenario is that naturally low genetic diversity was reduced when the first Hawaiians extirpated seals from the MHI; it became severely depleted when 19th century sealing in the NWHI nearly drove the species to extinction.
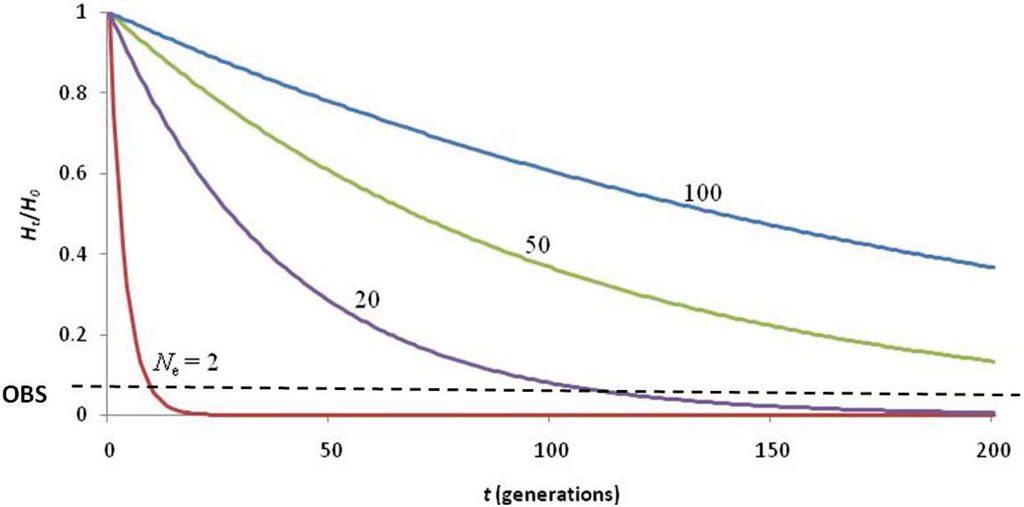
Figure 3.
Calculations describing the loss of heterozygosity (Ht/H0) over time (t) using various values of effective population size (Ne) to explain the low of genetic diversity (observed Ht/H0 = 0.067; black dashed line). The 19th century hunting induced bottleneck was not of adequate duration (< 10 generations) to deplete genetic diversity to such low levels, even if Ne = 2. Hunting of seals to Ne = 20–50 since the arrival of the first Hawaiians (~2,000 years ago) would have depleted heterozygosity to observed levels. The most likely scenario is that naturally low genetic diversity (due to being a large, insular carnivore) was reduced by extirpation of seals in the MHI upon arrival of the first Polynesians, and further depleted by extensive hunting of seals in the NWHI by Western sealers of the 19th century.
Natural selection is a weak force in small populations with little genetic diversity. Using an FST outlier test (LOSITAN [46]), we find that four of the 18 polymorphic loci are candidates for selection (Figure 4): Msc01, Msc03, Hg6.3 and Ms663. The two loci identified as candidates for balancing selection (Hg6.3 and Ms663) are also outliers using another multiple-population test for selection (DETSEL; data not shown). Microsatellite locus Hg6.3 was first isolated from the grey seal genome (Halichoerus grypus; [36]). It is polymorphic in 13 of 17 pinnipeds (though only one or two individuals were tested in the four “monomorphic” species [18]). At this locus, dead grey seal pups have significantly lower heterozygosity than surviving pups, suggesting a possible physical linkage to loci under balancing selection [47]. Likewise, a study of fitness and microsatellite diversity in stranded juvenile harp seals (Phoca groenlandica) indicates that the d2 estimates of Hg6.3 are higher in surviving individuals [48]. Locus Ms663 has not yet been utilized in any measures of pinniped fitness.
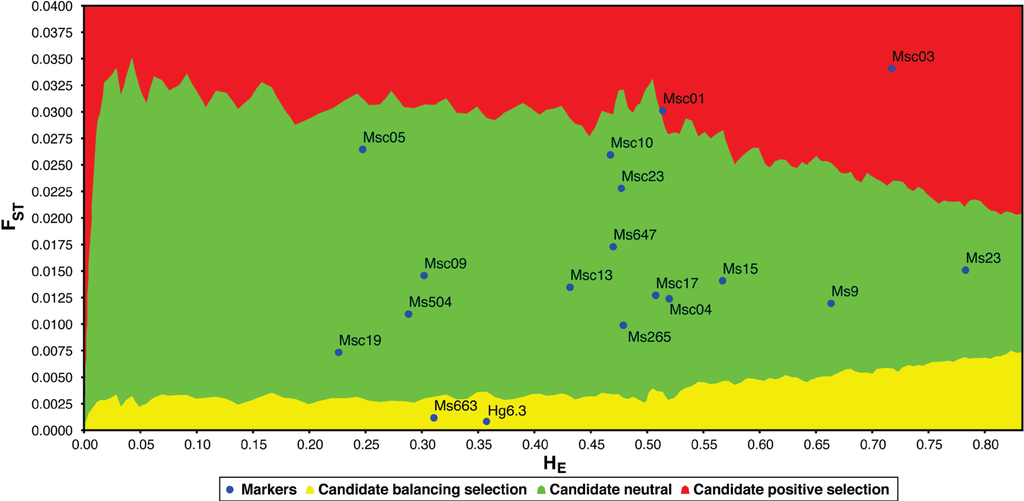
Figure 4.
Comparison of FST and heterozygosity (HE) in polymorphic loci to identify outliers and potential candidates for selection using LOSITAN [46]. Loci highlighted in yellow are candidates for balancing selection, whereas loci highlighted in red are candidates for positive selection (loci highlighted in green are selectively neutral).
3. Experimental Section
Samples for genetic analyses were collected from Hawaiian monk seals (N = 2,423) during annual population assessments (1983–2008) conducted at six subpopulations in the NWHI (Kure Atoll, Midway Atoll, Pearl and Hermes Reef, Lisianski Island, Laysan Island, and French Frigate Shoals), opportunistically in the main Hawaiian Islands (MHI) over the same time period, and from Nihoa in 2007 (Figure 1). The majority of the species (~85%) have been tagged with unique plastic tags [49]. The resulting tissue plugs were preserved in ethanol or a 20% dimethylsulfoxide saturated salt solution and extracted using DNeasy Blood and Tissue Kits (Qiagen, Hilden, Germany).
As described in Schultz et al. [22], we isolated microsatellite loci from the Hawaiian monk seal genome following the protocol of Glenn and Schable [50]. Genomic DNA was digested using AluI. Fragments containing microsatellite motifs were hybridized to biotinylated oligonucleotides and captured using magnetic beads (Dynal, Oslo, Norway). The fragments were amplified, ligated into a T-tailed vector, and used to transform α Select Gold Efficiency Competent Cells (Bioline, Randolph, MA). Recombinant clones were selected at random, amplified, and sequenced on an ABI 3730XL DNA Analyzer (Applied Biosystems, Foster City, CA) by Macrogen, Inc. (Seoul, South Korea). Of 624 positive clones, 470 contained microsatellite sequences. Primers were developed for 143 loci containing 10 or more microsatellite repeats and tested for polymorphism.
We contracted ecogenics GmbH (Zurich, Switzerland) to isolate additional microsatellite loci from the Hawaiian monk seal genome. An enriched library was made from size selected genomic DNA ligated into SAULA/SAULB-linker [51] and enriched by magnetic bead selection with biotinlabelled (GT)13, (CT)13, (GTAT)7 and (GATA)7 oligonucleotide repeats [52,53]. Of 562 recombinant colonies screened, 142 gave a positive signal after hybridization. Plasmids from 118 positive clones were sequenced. Given the previously described low genetic diversity of the species [19], primers were only designed for loci containing 17 or more repeats for dinucleotides and 11 or more for tetranucleotides (as opposed to the standard limit of 12 repeats for dinucleotides and 7 repeats for tetranucleotides). Primers were designed for 23 microsatellite inserts, of which 20 were tested for polymorphism.
Primers of polymorphic loci (including a single locus isolated from the grey seal [36]) were used to amplify Hawaiian monk DNA in two 6 μL multiplex PCRs: 1X PCR mix (Qiagen), 2 μM primer mix, and 30–50 ng genomic DNA. The PCR protocol consisted of 15 min initial denaturation at 95 °C, followed by 35 cycles of denaturation (94 °C, 30 s), annealing (60 °C, 30 s), and extension (72 °C, 30 s), with a final extension (72 °C, 30 min) to ensure the addition of a terminal adenine. Amplified products were run on an ABI 3100 Genetic Analyzer (Applied Biosystems) by the Core Facility at the Hawaii Institute of Marine Biology and scored using GENEMAPPER 4.0 (Applied Biosystems).
To ensure accuracy in scoring, 50% of individuals were independently scored twice. Error was estimated by duplicating analyses (from extraction to scoring) for 78 randomly chosen individuals. To test for Mendelian inheritance, we analyzed 10 known mother-pup pairs. PCR error as a result of null alleles and large allele dropout was tested in MICROCHECKER 2.2.3 [54]. Tests for Hardy-Weinberg equilibrium and linkage disequilibrium were conducted using FSTAT 2.9.3.2 [55].
Selective sweeps remove variation at loci under strong selection and at physically linked loci. To determine whether genetic diversity was lost at particular chromosomes (characteristic of a selective sweep) or throughout the genome (characteristic of persistently small population size), we attempted to map all microsatellite loci (N = 163) to the dog genome following Marshall et al. [56]. We used DNA sequences isolated from the Hawaiian monk seal genome which included microsatellite regions and the flanking regions containing the primer sequences. Repeat motifs of microsatellite sequences were masked using Repeatmasker [57], replacing the repeat motif with lower case letters in order to avoid spurious hits to dog tandem repeat regions. These microsatellite sequences were BLASTed against the dog genome (Ensembl; ftp://ftp.ensembl.org/pub/current_fasta/canis_familiaris/dna/). Settings for BLAST were ‘relaxed’ [58] to search ‘through’ the masked repeat region to provide a unique hit for each microsatellite. The proposed location in the dog genome was assigned to a microsatellite if it provided a unique hit at with an Expectation value (E value) of 1e−10 or lower. Where a locus provided multiple hits of at least 1e−10, it was unassigned unless the best hit had an E value at least 10 decimal places greater than the next best hit.
Analyzing all loci and only the polymorphic microsatellite loci, we calculated the number of alleles per locus (A), observed (HO) and expected (HE) heterozygosity using EXCEL MICROSATELLITE TOOLKIT 3.1 [59]. Current overall effective population size (Ne) was calculated in LDNe, a linkage disequilibrium method that provides unbiased estimates from a single sample with 95% confidence intervals (CI) calculated using jackknife methods [60]. To test the hypothesis of long-term small population size, we used the following equation:
Ht = H0(1 − 1/2Ne)t
We tested several hypotheses to account for the loss of heterozygosity (Ht/H0) over time (t generations). We assumed an average initial heterozygosity (H0 = 0.75) following similar analyses of the Mediterranean monk seal [41]. We plotted the loss of heterozygosity over a range of time (0–200 generations). Given that effective population size (Ne) is roughly a tenth of census size (N), we assumed a maximum Ne = 100 for the Hawaiian monk seal; we also tested the impact of an extreme bottleneck (Ne = 2).
We tested for a recent population bottleneck using the software BOTTLENECK 1.2.02 [61]. In a bottlenecked population, rare alleles are the first to be lost, lowering the mean number of alleles per locus. Heterozygosity is less affected, producing a transient excess in heterozygosity relative to that expected given the resulting number of alleles [62,63]. Because our loci do not appear to conform to the strict stepwise mutation model (SMM), we performed 5,000 iterations of the Wilcoxon signed-rank test with the infinite allele model (IAM) and two-phase mutation (TPM) model (90% stepwise and 10% multistep mutations; [64]).
We tested the polymorphic loci for patterns indicative of selection using LOSITAN [47], which evaluates the relationship between FST and expected heterozygosity (HE) to identify outlier loci. Theoretically, a shared demographic history should result in similar FST/ HE values for all loci; those that deviate may be candidates for selection [65,66,67]. Though the method assumes an island model of migration, it appears to be robust to non-equilibrium conditions, different mutation rates, population size and model of migration (e.g., stepping stone, isolation by distance and island; [66]). Therefore, we considered it to be more appropriate for this species than other tests for selection (e.g., excess heterozygosity, [68]; and excess alleles with intermediate frequencies, [69]) that may be confounded by the recent bottleneck or subsequent population expansion. We ran 95,000 simulations starting with a neutral mean FST using either the entire dataset (N = 2,423 seals) or all populations except for Nihoa due to small sample size (N = 7). To provide confidence in our ability to identify candidates for selection [70], we ran an additional locus outlier test. DetSel 1.0 identifies F (an estimate of identify by descent) outliers in pairs of populations [71]. We concluded that a particular locus was a candidate for selection if it was an outlier in all or most pairwise comparisons.
4. Conclusions
When loss of genetic diversity is extreme, sustained small population size is often the main reason [72]. We conclude that chronically small population size and a recent bottleneck depleted the genetic diversity of the Hawaiian monk seal. As a large, insular vertebrate, it is possible that the population size, and thus genetic diversity, of the Hawaiian monk seal has never been very high. Extirpation from the MHI by the first Hawaiians would have further reduced heterozygosity. Later, intensive, targeted sealing in the 19th century depleted genome-wide diversity to the current levels.
Fifty percent reduction in beach counts over the past 45 years and dismal future projections have prompted the International Union for Conservation of Nature (IUCN) to list the Hawaiian monk seal as Critically Endangered (Criteria A3ce+4ce), reflecting its extremely high risk of extinction in the wild [73]. Less than 1,200 individuals survive, and the species is currently declining at a rate of ~4% per year [35]. Mounting threats may further the decline. Climate change may result in reduced prey and habitat availability through lowered productivity and sea-level rise [74,75]. The growing presence of seals in the MHI will likely result in increased human-seal and dog-seal interactions, with greater potential for exposure to introduced infectious diseases [76]. The low genetic diversity described herein heightens concern regarding the future of the Hawaiian monk seal. Will the species be able to adapt to its changing environment? Will individuals be able to mount an effective immune response? The answers to these questions are unknown. Though we find two loci to be candidates for balancing selection, this cannot be interpreted as conclusive evidence for adaptive potential. Further research is required to determine whether the allelic variants at these loci are associated with differences in fitness among monk seals [77]. Given the recent bottleneck and declining population size, we must also evaluate inbreeding depression and heterozygosity-fitness correlations, tasks which are currently circumvented by the paucity of genetic diversity throughout the genome.
The Hawaiian monk seal is an ancient species that has survived hundreds to thousands of years of anthropogenic threat. It is now protected from hunting (through the Endangered Species Act and the Marine Mammal Protection Act), and its habitat in the NWHI is protected as the Papahānaumokuākea Marine National Monument. Population growth in the newly recolonized MHI indicates that there is potential for recovery of the species, but given our results, it must occur within the context of minimal genetic variation.
Acknowledgments
We thank J.D. Baker, B.W. Bowen, R.J. Toonen, C.L. Littnan, and F.A. Parrish for helpful comments on this manuscript. Thank you to N. Gemmell and J. Slate for initial microsatellite mapping and N. Gemmell, J. Slate and M. Kennedy for intellectual support to AJM. We are indebted to the numerous researchers who collected tissue plug samples for use in this study. Funding for this project was provided by the Papahānaumokuākea Marine National Monument, the Marine Conservation Biology Institute, and NOAA Fisheries. J.K.S was supported by an EPA STAR Fellowship (STAR-U916136) and an NSF IGERT Fellowship awarded to B. Wilcox (IGE05-49514) as a graduate student and by the SOEST Young Investigator Program as a post-doctoral researcher. This is contribution # 1389 from the Hawaii Institute of Marine Biology and contribution # 7939 from the School of Ocean and Earth Science and Technology at the University of Hawaii.
References
- Frankham, R. Conservation genetics. Annu. Rev. Genet. 1995, 29, 305–327. [Google Scholar] [CrossRef]
- Spielman, D.; Brook, B.W.; Frankham, R. Most species are not driven to extinction before genetic factors impact them. Proc. Natl. Acad. Sci. USA 2004, 101, 15261–15264. [Google Scholar] [CrossRef]
- Garner, A.; Rachlow, J.L.; Hicks, J.F. Patterns of genetic diversity and its loss in mammalian populations. Conserv. Biol. 2005, 19, 1215–1221. [Google Scholar] [CrossRef]
- Evans, S.R.; Sheldon, B.C. Interspecific patterns of genetic diversity in birds: correlations with extinction risk. Conserv. Biol. 2008, 22, 1016–1025. [Google Scholar] [CrossRef]
- Frankham, R.; Lees, K.; Montgomery, M.E.; England, P.R.; Lowe, E.H.; Briscoe, D.A. Do population size bottlenecks reduce evolutionary potential? Anim. Conserv. 1999, 2, 255–260. [Google Scholar]
- Frankham, R. Genetics and conservation biology. Comptes Rendus Biologies 2003, 326, 22–29. [Google Scholar] [CrossRef]
- Gaggiotti, O.E. Genetic threats to population persistence. Ann. Zool. Fennici. 2003, 40, 155–168. [Google Scholar]
- Shaffer, M.L. Minimum population sizes for species conservation. BioScience 1981, 31, 131–134. [Google Scholar] [CrossRef]
- Jackson, J.B.; Kirby, M.X.; Berger, W.H.; Bjorndal, K.A.; Botsford, L.W.; Bourque, B.J.; Bradbury, R.H.; Cooke, R.; Erlandson, J.; Estes, J.A.; Hughes, T.P.; Kidwell, S.; Lange, C.B.; Lenihan, H.S.; Pandolfi, J.M.; Peterson, C.H.; Steneck, R.S.; Tegner, M.J.; Warner, R.R. Historical overfishing and the recent collapse of coastal ecosystems. Science 2001, 293, 629–637. [Google Scholar] [CrossRef]
- Frankham, R. Relationship of genetic variation to population size in wildlife. Conserv. Biol. 1996, 10, 1500–1508. [Google Scholar]
- Nei, M.; Maruyama, T.; Chakraborty, R. The bottleneck effect and genetic variability in populations. Evolution 1975, 29, 1–10. [Google Scholar]
- Watterson, G.A. Allele frequencies after a bottleneck. Theor. Popul. Biol. 1984, 26, 387–407. [Google Scholar] [CrossRef]
- Cornuet, J.M.; Luikart, G. Description and power analysis of two tests for detecting recent population bottlenecks from allele frequency data. Genetics 1996, 144, 2001–2014. [Google Scholar]
- Amos, W.; Harwood, J. Factors affecting levels of genetic diversity in natural populations. Philos. Trans. R. Soc. London, Ser. B 1998, 353, 177–186. [Google Scholar] [CrossRef]
- Smith, J.M.; Haigh, J. The hitch-hiking effect of a favourable gene. Genet. Res. 1974, 23, 23–35. [Google Scholar] [CrossRef]
- Cavalli-Sforza, L.L. Population structure and human evolution. Proc. R. Soc. London, Ser. B 1966, 164, 362–379. [Google Scholar] [CrossRef]
- Aldridge, B.M.; Bowen, L.; Smith, B.R.; Antonelis, G.A.; Gulland, F.; Stott, J.L. Paucity of class I MHC gene heterogeneity between individuals in the endangered Hawaiian monk seal population. Immunogenetics 2006, 58, 203–215. [Google Scholar] [CrossRef]
- Zinkernagel, R.M. Associations between major histocompatibility antigens and susceptibility to disease. Annu. Rev. Microbiol. 1979, 33, 201–213. [Google Scholar] [CrossRef]
- Hedrick, P.W. Pathogen resistance and genetic variation at MHC loci. Evolution 2002, 56, 1902–1908. [Google Scholar] [CrossRef]
- Kretzmann, M.B.; Gilmartin, W.G.; Meyer, A.; Zegers, G.P.; Fain, R.; Taylor, B.F.; Costa, D.P. Low genetic variability in the Hawaiian monk seal. Conserv. Biol. 1997, 11, 482–490. [Google Scholar]
- Gemmell, N.J.; Allen, P.J.; Goodman, S.J.; Reed, J.Z. Interspecific microsatellite markers for the study of pinniped populations. Mol. Ecol. 1997, 6, 661–666. [Google Scholar]
- Schultz, J.K.; Baker, J.D.; Toonen, R.J.; Bowen, B.W. Extremely low genetic diversity in the endangered Hawaiian monk seal (Monachus schauinslandi). J. Hered. 2009, 100, 25–33. [Google Scholar]
- Fyler, C.A.; Reeder, T.W.; Berta, A.; Antonelis, G.; Aguilar, A.; Androukaki, E. Historical biogeography and phylogeny of monachine seals (Pinnipedia: Phocidae) based on mitochondrial and nuclear DNA data. J. Biogeog. 2005, 32, 1267–1279. [Google Scholar] [CrossRef]
- Arnason, U.; Gullberg, A.; Janke, A.; Kullberg, M.; Lehman, N.; Petrov, E.A.; Vainola, R. Pinniped phylogeny and a new hypothesis for their origin and dispersal. Mol. Phyl. Evol. 2006, 41, 345–354. [Google Scholar] [CrossRef]
- Briggs, J.C. Operation of zoogeographic barriers. Syst. Zool. 1974, 23, 248–256. [Google Scholar] [CrossRef]
- Stannard, D.E. Before the Horror: the Population of Hawai'i on the Eve of Western Contact; University of Hawaii Press: Honolulu, HI, USA, 1989. [Google Scholar]
- Svihla, A. Notes on the Hawaiian monk seal. J. Mammal. 1959, 40, 226–229. [Google Scholar] [CrossRef]
- Liliuokalani, Q. The Kumulipo: an Account of the Creation of the World according to Hawaiian Tradition; Lee and Shepard: Boston, MA, USA, 1897. [Google Scholar]
- Beckwith, M.W. The Kumulipo: a Hawaiian Creation Chant; University of Hawaii Press: Honolulu, HI, USA, 1981. [Google Scholar]
- Rosendahl, P.H. Aboriginal Hawaiian structural remains and settlement patterns in the upland archeological zone at Lapakahi, Island of Hawaii. Hawaiian Archaeol. 1994, 3, 14–70. [Google Scholar]
- Ragen, T. Human activities affecting the population trends of the Hawaiian monk seal. Am. Fish. Soc. Symp. 1999, 23, 183–194. [Google Scholar]
- Baker, J.D.; Johanos, T.C. Abundance of the Hawaiian monk seal in the main Hawaiian Islands. Biol. Conserv. 2004, 116, 103–110. [Google Scholar] [CrossRef]
- Lisiansky, U. A Voyage around the World in the Years 1803–1806 in the Ship Neva; John Booth: London, UK, 1814. [Google Scholar]
- Cobb, J.N. Commercial Fisheries of the Hawaii Islands; US Commission of Fish and Fisheries: Honolulu, HI, USA, 1902. [Google Scholar]
- Carretta, J.V.; Forney, K.A.; Lowry, M.S.; Barlow, J.; Baker, J.; Johnston, D.; Hanson, B.; Brownell, R.L.; Robbins, J.; Mattila, D.K.; Ralls, K.; Muto, M.M.; Lynch, D.; Carswell, L. Pacific Marine Mammal Stock Assessments: 2009; NOAA Technical Memorandum NMFS-SWFSC-414: LaJolla, CA, USA, 2009. [Google Scholar]
- Allen, P.J.; Amos, W.; Pomeroy, P.P.; Twiss, S.D. Microsatellite variation in grey seals (Halichoerus grypus) shows evidence of genetic differentiation between two British breeding colonies. Mol. Ecol. 1995, 4, 653–662. [Google Scholar] [CrossRef]
- Morrell, B. A Narrative of Four Voyages to the South Sea, North and South Pacific Ocean, Chinese Sea, Ethiopic and Southern Atlantic Ocean, Indian, and Antarctic Ocean, from the Year 1822 to 1831; J. & J. Harper: New York, NY, USA, 1832; pp. 215–219. [Google Scholar]
- Paty, J. Arrival of the Manuokawai—interesting account of her explorations. The Polynesian 1897, 388, 838–839. [Google Scholar]
- Brooks, N.C. Islands and reefs west-north-west of the Sandwich Islands, Pacific. Nautical Magazine 1860, 29, 499–504. [Google Scholar]
- Hiruki, L.M.; Ragen, T.J. A Compilation of Historical (Monachus Schauinslandi) Monk Seal Counts; NOAA Technical Memorandum, US Department of Commerce, 1992.
- Pastor, T.; Garza, J.C.; Allen, P.; Amos, W.; Aguilar, A. Low genetic variability in the highly endangered Mediterranean monk seal. J. Hered. 2004, 95, 291–300. [Google Scholar] [CrossRef]
- Kenyon, K.W.; Rice, D.W. Life history of the Hawaiian monk seal. Pac. Sci. 1959, 13, 215–252. [Google Scholar]
- Dill, H.R. Report of an expedition to Laysan Island in 1911. In Biological Survey Bulletin; US Department of Agriculture: Washington, DC, USA, 1912; Volume 42, p. 9. [Google Scholar]
- Franklin, I.R. Evolutionary change in small populations. In Conservation Biology: An Evolutionary-Ecological Perspective; Soule, M.E., Wilcox, B.A., Eds.; Sinauer Associates: Sunderland, MA, USA, 1980; pp. 135–150. [Google Scholar]
- Franklin, I.R.; Frankham, R. How large must populations be to retain evolutionary potential? Anim. Conserv. 1998, 1, 69–71. [Google Scholar] [CrossRef]
- Antao, T.; Lopes, A.; Lopes, R.J.; Beja-Pereira, A.; Beja-pereira, A.; Luikart, G. LOSITAN: workbench to detect molecular adaptation based on a FST-outlier method. BMC Bioinformatic 2008, 9, 1–5. [Google Scholar] [CrossRef]
- Bean, K.; Amos, W.; Pomeroy, P.P.; Twiss, S.D.; Coulson, T.N.; Boyd, I.L. Patterns of parental relatedness and pup survival in the grey seal (Halichoerus grypus). Mol. Ecol. 2004, 13, 2365–2370. [Google Scholar] [CrossRef]
- Kretzmann, M.; Mentzer, L.; DiGiovanni, R.; Leslie, M.S.; Amato, G. Microsatellite diversity and fitness in stranded juvenile harp seals (Phoca groenlandica). J. Hered. 2006, 97, 555–560. [Google Scholar] [CrossRef]
- Baker, J.D.; Thompson, P.M. Temporal and spatial variation in age-specific survival rates of a long-lived mammal, the Hawaiian monk seal. Proc. R. Soc. London Ser. B 2007, 274, 407–415. [Google Scholar] [CrossRef]
- Glenn, T.C.; Schable, N.A. Isolating microsatellite DNA loci. Methods Enzymol. 2005, 395, 202–222. [Google Scholar] [CrossRef]
- Armour, J.A.; Neumann, R.; Gobert, S.; Jeffreys, A.J. Isolation of human simple repeat loci by hybridization selection. Hum. Mol. Genet. 1994, 3, 599–605. [Google Scholar] [CrossRef]
- Gautschi, B.; Tenzer, I.; Mueller, J.P.; Schmid, B. Isolation and characterization of microsatellite loci in the bearded vulture (Gypaetus barbatus) and cross amplification in three Old World vulture species. Mol. Ecol. 2000, 9, 2193–2195. [Google Scholar] [CrossRef]
- Gautschi, B.; Widmer, A.; Koella, J. Isolation and characterization of microsatellite loci in the dice snake (Natrix tessellata). Mol. Ecol. 2000, 9, 2191–2193. [Google Scholar]
- Van Oosterhout, C.; Hutchinson, W.F.; Wills, D.P.; Shipley, P. Micro-checker: software for identifying and correcting genotyping errors in microsatellite data. Mol. Ecol. Notes 2004, 4, 535–538. [Google Scholar] [CrossRef]
- Goudet, J. FSTAT (version 1.2): a computer program to calculate F-statistics. J. Hered. 1995, 86, 485–486. [Google Scholar]
- Marshall, A.J.; Schultz, J.K.; Kennedy, M.A.; Slate, J.; Gemmell, N.J. Development of a predicted microsatellite map of the pinniped genome, with wider applicability to the Carnivora. Mol. Ecol. Res. 2010. in review. [Google Scholar]
- Smit, A.F.A.; Hubley, R.; Green, P. RepeatMasker Open 3.0. 1996–2004.
- Dawson, D.A.; Burke, T.; Hansson, B.; Pandhal, J.; Hale, M.C.; Hinten, G.N.; Slate, J. A predicted microsatellite map of the passerine genome based on chicken-passerine sequence similarity. Mol. Ecol. 2006, 15, 1299–1320. [Google Scholar] [CrossRef]
- Park, S.D.E. The Excel Microsatellite Toolkit; University of Dublin: Dublin, Ireland, 2001. [Google Scholar]
- Waple, R.S.; Do, C. LDNe: A program for estimating effective population size from data on linkage disequilibrium. Mol. Ecol. Res. 2008, 8, 753–756. [Google Scholar] [CrossRef]
- Piry, S.; Luikart, G.; Cornuet, J.M. BOTTLENECK: a computer program for detecting recent reductions in the effective population size using allele frequency data. J. Heredity 1999, 90, 502–503. [Google Scholar] [CrossRef]
- Cornuet, J.M.; Luikart, G. Description and power analysis of two tests for detecting recent population bottlenecks from allele frequency data. Genetics 1996, 144, 2001–2014. [Google Scholar]
- Luikart, G.; Cornuet. Empirical evaluation of a test for identifying recently bottlenecked populations from allele frequency data. Conserv. Biol. 1998, 12, 228–237. [Google Scholar] [CrossRef]
- Di Rienzo, A.; Peterson, A.C.; Garza, J.C.; Valdes, A.M.; Slatkin, M.; Freimer, N.B. Mutational processes of simple-sequence repeat loci in human populations. Proc. Natl. Acad. Sci. USA 1994, 91, 3166–3170. [Google Scholar]
- Lewontin, R.C.; Krakauer, J. Distribution of gene frequency as a test of the theory of the selective neutrality of polymorphisms. Genetics 1973, 74, 175–195. [Google Scholar]
- Beaumont, M.A.; Nichols, R.A. Evaluating loci for use in the genetic analysis of population structure. Proc. R. Soc. London Ser. B 1996, 263, 1619–1626. [Google Scholar] [CrossRef]
- Beaumont, M.A. Adaptation and speciation: what can FST tell us? Trends Ecol. Evol. 2005, 20, 435–440. [Google Scholar] [CrossRef]
- Watterson, G.A. The homozygosity test of neutrality. Genetics 1978, 88, 405–417. [Google Scholar]
- Tajima, F. Statistical method for testing the neutral mutation hypothesis by DNA polymorphism. Genetics 1989, 123, 585–595. [Google Scholar]
- Luikart, G.; England, P.R.; Tallmon, D.; Jordan, S.; Taberlet, P. The power and promise of population genomics: from genotyping to genome typing. Nat. Rev. Genetics 2003, 4, 981–994. [Google Scholar]
- Vitalis, R. DetSel 1.0: a computer program to detect markers responding to selection. J. Hered. 2003, 94, 429–431. [Google Scholar] [CrossRef]
- Frankham, R.; Ballou, J.D.; Briscoe, D.A. Introduction to Conservation Genetics; Cambridge University Press: Cambridge, UK, 2002. [Google Scholar]
- International Union for Conservation of Nature and Natural Resources. IUCN Red List of Threatened Species. Version 2009.2. Available online: http://www.iucnredlist.org (accessed August 2009).
- Baker, J.D.; Polovina, J.J.; Howell, E.A. Effect of variable oceanic productivity on the survival of an upper trophic predator, the Hawaiian monk seal, Monachus schauinslandi. Mar. Ecol. Prog. Ser. 2007, 346, 277–283. [Google Scholar] [CrossRef]
- Baker, J.D.; Littnan, C.L.; Johnston, D.W. Potential effects of sea level rise on the terrestrial habitats of endangered and endemic megafauna in the Northwestern Hawaiian Islands. Endang. Species Res. 2006, 4, 1–10. [Google Scholar]
- Littnan, C.L.; Stewart, B.S.; Yochem, P.K.; Braun, R. Survey for selected pathogens and evaluation of disease risk factors for endangered Hawaiian monk seals in the main Hawaiian Islands. EcoHealth 2006, 3, 232–244. [Google Scholar]
- Nachman, M.W.; Hoekstra, H.E.; D’Agostino, S.L. The genetic basis of adaptive melanism in pocket mice. Proc. Natl. Acad. Sci. USA 2003, 100, 5268–5273. [Google Scholar] [CrossRef]
© 2010 by the authors; licensee MDPI, Basel, Switzerland. This article is an Open Access article distributed under the terms and conditions of the Creative Commons Attribution license (http://creativecommons.org/licenses/by/3.0/).