Review

The Importance of Isotopic Turnover for Understanding Key Aspects of Animal Ecology and Nutrition

by
Wales A. Carter
1,*,
Ulf Bauchinger
2 and
Scott R. McWilliams
1
1
Department of Natural Resources Science, University of Rhode Island, Kingston, RI 02881, USA
2
Institute of Environmental Sciences, Jagiellonian University, 30-387 Kraków, Poland
*
Author to whom correspondence should be addressed.
Diversity 2019, 11(5), 84; https://doi.org/10.3390/d11050084
Submission received: 23 April 2019 / Revised: 19 May 2019 / Accepted: 24 May 2019 / Published: 26 May 2019
(This article belongs to the Special Issue Stable Isotopes in Ecological Research)

Abstract

:
Stable isotope-based methods have proved to be immensely valuable for ecological studies ranging in focus from animal movements to species interactions and community structure. Nevertheless, the use of these methods is dependent on assumptions about the incorporation and turnover of isotopes within animal tissues, which are oftentimes not explicitly acknowledged and vetted. Thus, the purpose of this review is to provide an overview of the estimation of stable isotope turnover rates in animals, and to highlight the importance of these estimates for ecological studies in terrestrial, freshwater, and marine systems that may use a wide range of stable isotopes. Specifically, we discuss 1) the factors that contribute to variation in turnover among individuals and across species, which influences the use of stable isotopes for diet reconstructions, 2) the differences in turnover among tissues that underlie so-called ‘isotopic clocks’, which are used to estimate the timing of dietary shifts, and 3) the use of turnover rates to estimate nutritional requirements and reconstruct histories of nutritional stress from tissue isotope signatures. As we discuss these topics, we highlight recent works that have effectively used estimates of turnover to design and execute informative ecological studies. Our concluding remarks suggest several steps that will improve our understanding of isotopic turnover and support its integration into a wider range of ecological studies.

1. Introduction

For more than thirty years, stable isotopes have been used as tools to address a wide range of questions in ecology, from elucidating key aspects of physiology and nutrition to tracking the movement of animals and defining the structure of biological communities [1,2,3]. The value of stable isotope-based tools has been demonstrated repeatedly throughout this period, leading to an exponential increase in their use: a Web of Knowledge search for the topic “stable isotope*” yields fewer than one hundred results from the 1970s and more than four thousand in each of the past three years. However, the successful use of stable isotope-based tools by ecologists requires careful consideration of the fundamental processes whereby stable isotopes are metabolized and incorporated into the animals and plants being studied [4,5,6,7]. In particular, the assimilation of dietary nutrients into the organism [2,8,9], the routing and fractionation of assimilated nutrients within the organism [6,10,11], and the rate of isotopic incorporation or turnover [12,13,14,15] all have substantial influence on the results and interpretation of isotope-based ecological studies. Failure to account for these factors can result in the misidentification of diet composition, incorrect estimates of the timing of movements and dietary shifts, and even the incorrect assessment of trophic position and community structure. Accordingly, considerable progress has been made in testing assumptions about assimilation, routing, and isotopic turnover in lab settings, a necessary step to ensure that those processes are properly accounted for in ecological studies [4,6]. Nevertheless, in spite of the work estimating the turnover rates of tissues in a wide range of taxa [16,17], the importance of turnover processes to whole-animal metabolism and isotopic signatures is often not explicitly recognized in studies using isotope-based tools. Therefore, the purpose of this review is to 1) illustrate how stable isotopes can be effectively used to estimate the turnover rates of animal tissues and key compounds within tissues, and 2) discuss the use and importance of isotopic turnover estimates for ecological and nutritional studies, with a particular focus on how metabolic physiology provides the foundation for these applications. The physiological mechanisms and ecological applications that we discuss here are broadly relevant to all stable isotope studies, including those in terrestrial, freshwater, and marine systems, regardless of the specific isotope(s) used. We also outline the potential future of isotopic turnover measurements and particular challenges that future studies may approach using this methodology.

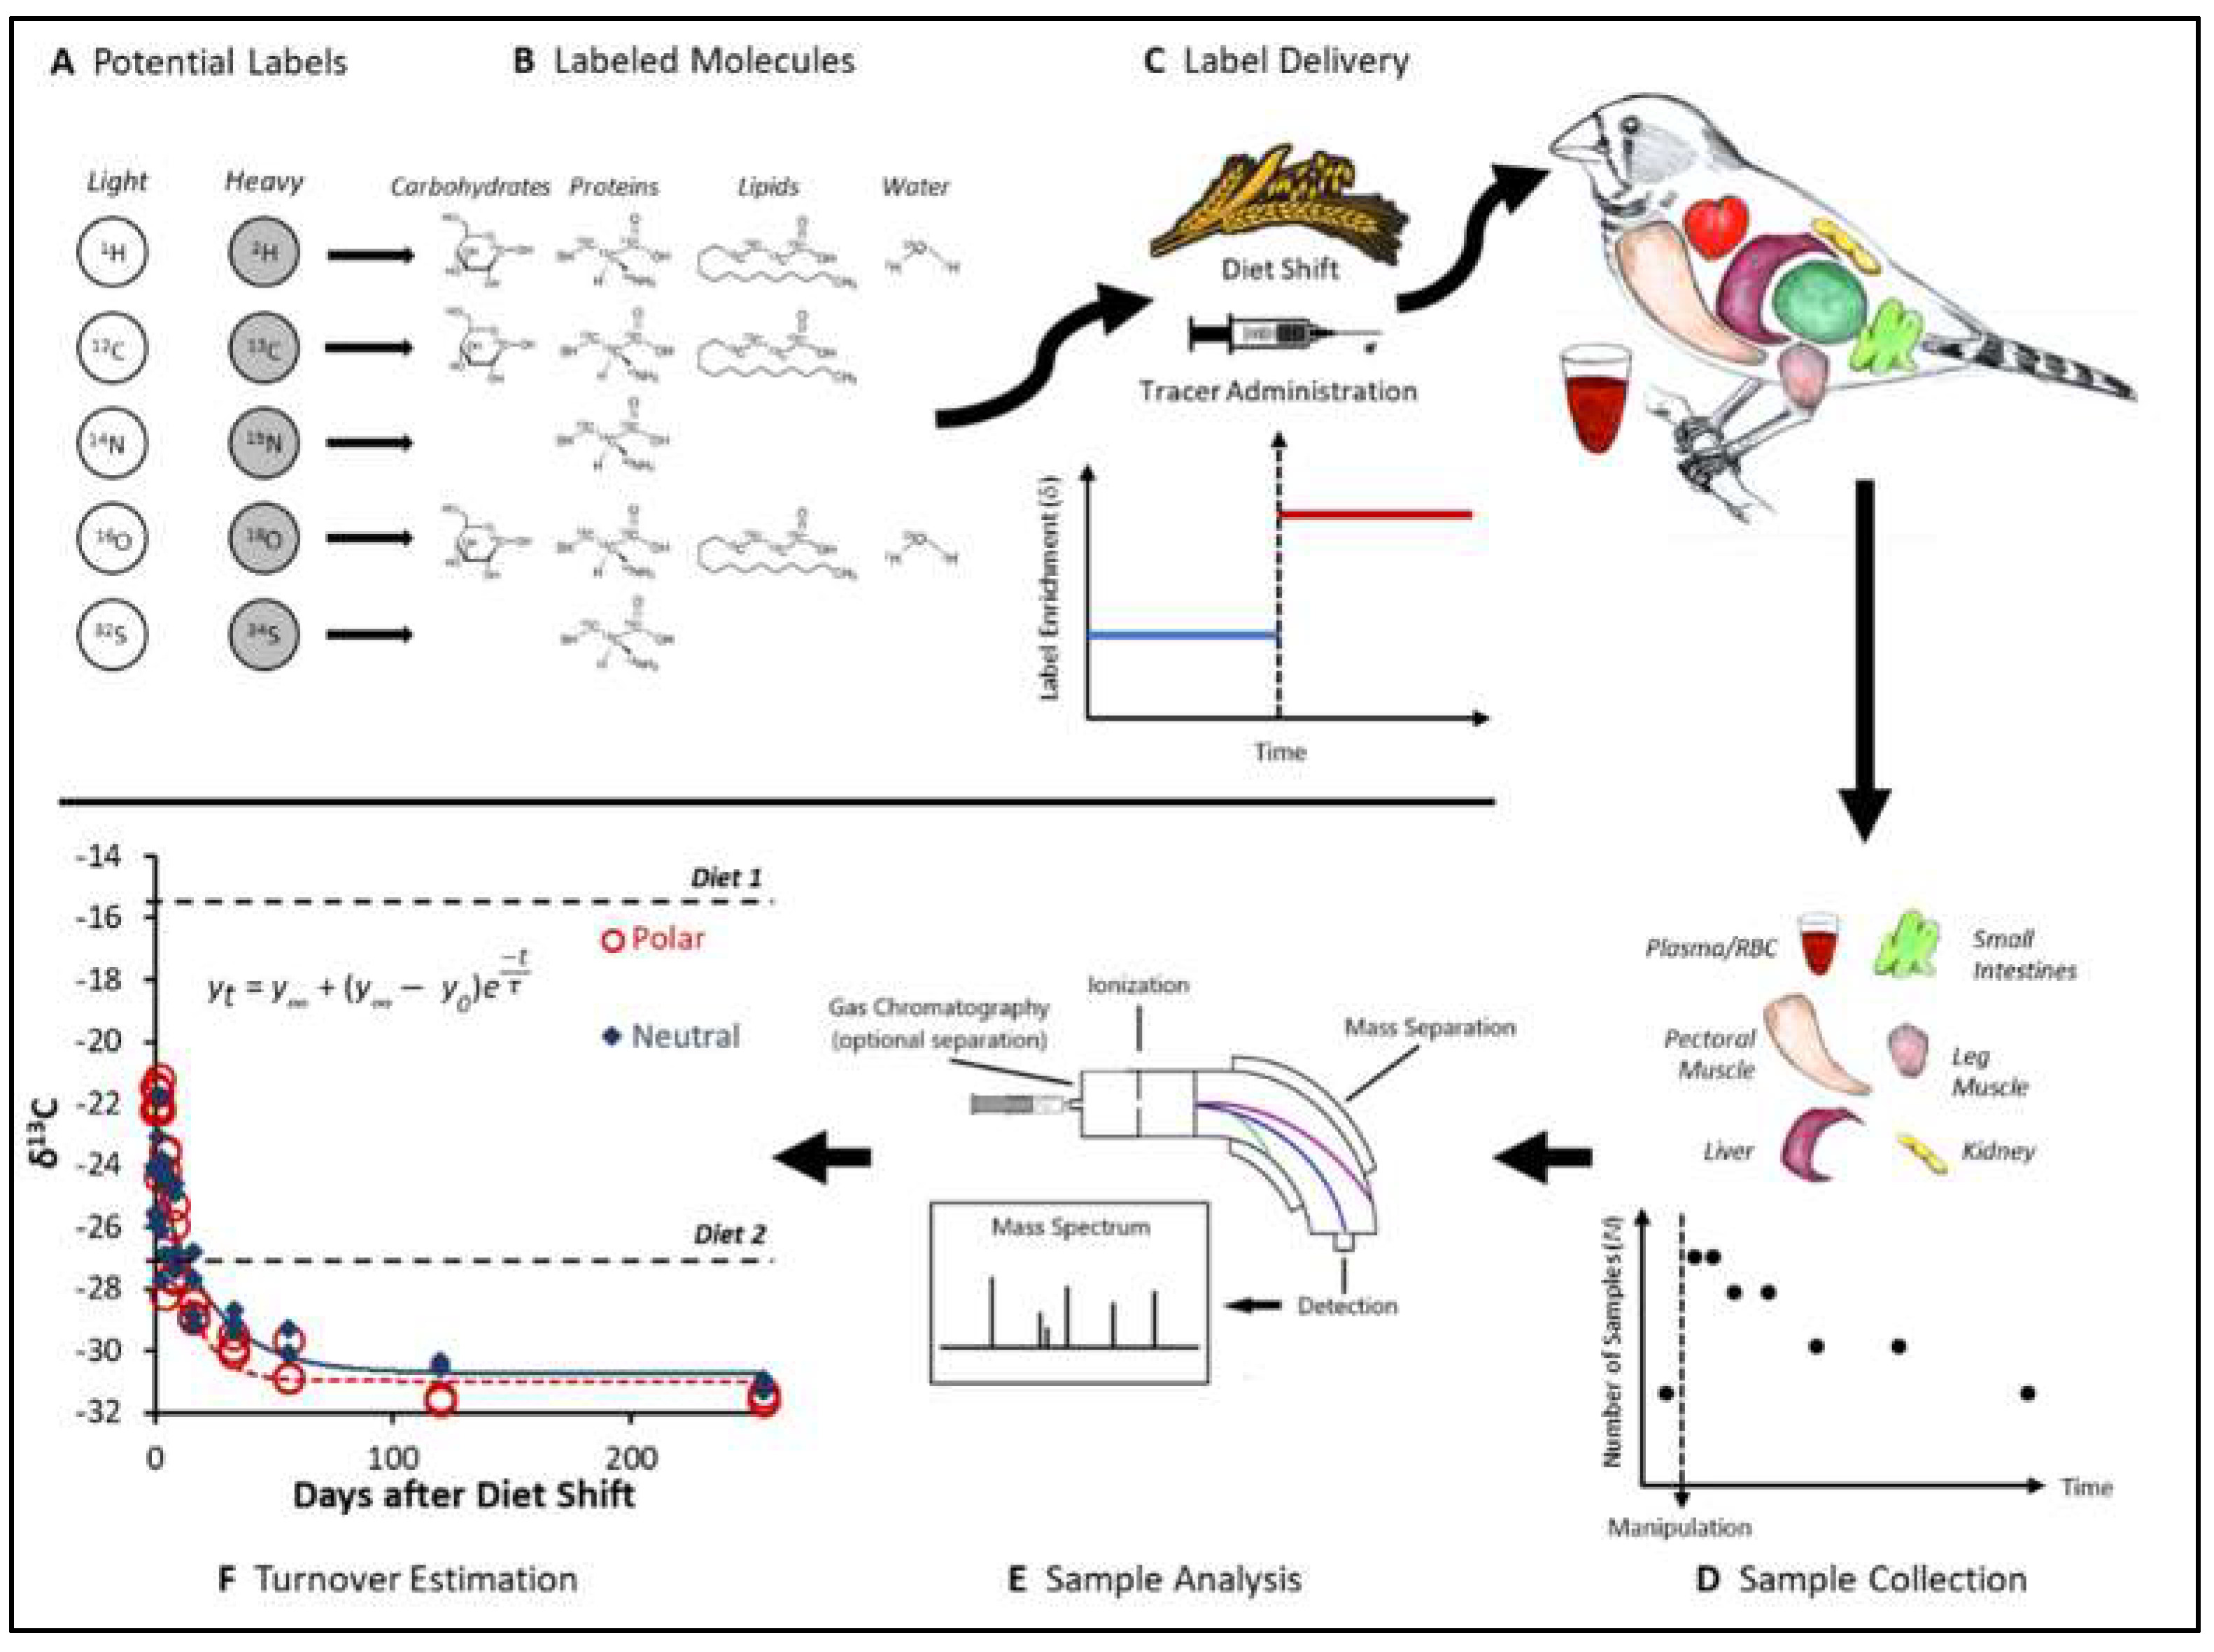
2. How to Measure Turnover Rates with Stable Isotopes: from Elements to Molecules

Estimating the turnover of a compound or tissue typically requires labeling the molecules of interest at one time and then tracking the concentration of those labels over time as the molecules are excreted, degraded, or converted into other forms and replaced with unlabeled molecules (Figure 1A). The isotopic turnover of a compound or tissue therefore involves labeling the constituent atoms of molecules of interest with traceable stable isotopes of the elements that make up the molecule. Theoretically, any element could be labeled and tracked, but for practical reasons most studies of isotopic turnover have focused on carbon, nitrogen, and hydrogen using the 13C, 15N, and 2H isotopes, respectively. Turnover rates have also been estimated for the 34S and 18O isotopes of Sulfur and Oxygen, respectively, but estimates for these elements have been far less common [17,18,19].
The isotopic label used in a given study should be chosen to match the compounds of interest in that study (Figure 1B). Carbon, as the defining constituent, can be used to label all organic molecules, making it the most relevant element for the majority of isotopic turnover studies. Hydrogen and oxygen are also applicable to most organic molecules found in animal tissues, and are also commonly used to measure the turnover of body water, which underlies the estimation of energy expenditure with doubly labeled water [20,21,22,23] as well as body composition with deuterium [24,25]. In contrast, nitrogen is restricted to amino and nucleic acids and sulfur is primarily found in the amino acids cysteine and methionine, making 15N and 34S most applicable to measuring the turnover of proteinaceous tissue. Thus, for studies focused on the turnover of bulk tissues, 13C will typically be the most straightforward label available.
Most studies, however, are interested in the turnover of more specific tissue components (e.g., proteins and fats, or amino acids and fatty acids), which requires either labeling those specific components or separating them prior to stable isotope analysis. Separating tissue samples into their macromolecular components can be readily achieved by isolating lipids and carbohydrates from protein components via lipid extraction [27,28,29] and cation exchange purification [30,31,32], respectively. Compounds of similar macromolecular classes can then often be separated by gas-chromatography [11,33,34,35]. Alternately, studies focused on protein turnover could label just that tissue component with 15N- or 34S-enriched amino acids. Even more specific labels can be created for any compound by positioning isotopically heavier atoms at specific positions within the molecule [36,37,38], although these may also require purification before analysis. In general, highly specialized labels will be most useful when the study is measuring the turnover of a small set of very specific compounds, and appears less beneficial as the scope of the study widens. For many ecological applications, whole-tissue or macromolecular turnover will be sufficient, whereas the turnover of specific compounds may be more important for nutritional and pharmacological studies.
Once an isotopic label has been chosen, the frequency, or enrichment, of that label needs to be manipulated, so that the rate of change over time can be measured (Figure 1C). Typically, this will involve either enriching or depleting the tissue(s) with the label and then reversing the enrichment/depletion to ensure that a large enough change occurs to be accurately and precisely measured. Large scale manipulations are usually most readily accomplished with complete shifts in diet. For example, tissue 13C concentration can be enriched by feeding animals diets based on C4 plants, or depleted with diets based on C3 plants, or enriched with marine diets and depleted with terrestrial diets [9,12,39,40,41,42,43]. Similarly, 15N can be enriched by using animal protein in diets, and depleted by using plant protein [9,40,44]. It may also be possible to manipulate tissue 2H by sourcing diets from different locations along the geographic 2H gradients [9,45,46]. Drinking water can also be spiked with 2H or 18O to produce whole-animal enrichment with those labels. For such large-scale diet manipulations, equilibrating animals with the initial diet is ideal to ensure that all tissues have a consistent and predictable isotope value, but this may not always be possible for tissues and species with very slow turnover rates. For more specific labels, direct administration is often applied with a dose of labeled molecules into the digestive tract by gavage or directly into the bloodstream or tissue by injection.
Previous studies and reviews have discussed the collection of tissue samples and the analysis of isotopic turnover data in great detail, and are excellent resources for those designing experiments [19,47,48,49]. Briefly, several particularly important considerations are the number and spacing of samples over time following manipulation of the isotopic label and the statistical model used to describe changes in isotopic enrichment. The goal of sampling is to precisely track changes in isotopic enrichment, so as many samples should be taken as possible. However, when the number of samples is limited, they should be concentrated in the period immediately following the diet shift or the administration of the label (Figure 1D). This spacing, usually following a geometric pattern (e.g., 0, 1, 2, 4, 8, etc.), ensures that more samples are taken when changes in isotopic enrichment are occurring most rapidly. Changes in isotopic enrichment are typically described and turnover rates estimated using exponential decay models (Figure 1F), with the most commonly used being first order kinetic models of the form:
y t   =   y   +   ( y   y 0 ) e t τ
or
y t   =   y   +   ( y   y 0 ) e λ t
where yt is the isotopic enrichment at time t, y is enrichment at equilibrium with the second diet in ‰, y0 is enrichment at the time of the diet shift in ‰, t is the time since the diet shift, and τ is the mean retention time of the isotope, which can be replaced with λ, the kinetic rate constant equal to 1/τ. Nevertheless, other options are possible, most notably multi-compartment models [47,50], and may be favored on either empirical grounds or for mechanistic reasons if it is known that multiple sources contribute to the isotopic makeup of a given tissue or pool of molecules. Another important consideration for studies focused on the turnover of specific compounds is the interconversion between different molecules. This interconversion can decouple isotopic labels from their original compounds and should be accounted for by either isolating the compounds of interest during analysis or by correcting the measured isotopic enrichment of samples for the rate of conversion to other forms [11,51,52].

3. The Dynamics of Stable Isotopes in Organisms: A Physiological Foundation of Ecological Applications of Stable Isotopes

Once the turnover rate of a compound, tissue, or tissue component has been measured, it can then be used to make inferences about the anabolic and catabolic processes that, in sum, produced those changes in composition. Moreover, comparisons across tissues or individuals can further enhance our understanding of organismal physiology, from cell-level processes to whole-animal metabolism, which in turn provides the foundation for the use of stable isotopes in ecological studies. Here, we discuss some of the important physiological findings of turnover rate studies including (1) differences among individuals with different metabolic rates and body masses, which informs the estimation of turnover rates by allometry, (2) repeatable differences among tissues, which underlie the use of isotopic clocks, and (3) the implications of turnover rates for nutrient supply and dietary requirements for nutrients and energy.

3.1. Considerations for Isotopic Diet Reconstructions: Variation in Turnover Among Individuals

From the early studies on isotopic turnover, the rate of energy metabolism was hypothesized to be a major determinant producing variation in tissue turnover rates across individuals [12,39,53]. The following thirty years of research on proteinaceous tissue, however, illustrate a slow and gradual shift away from the importance of quantitative metabolism (energy) to the hypothesis that the quality of metabolism (structural turnover) produces the variation among individuals. Three studies mark a turning point along that shift from quantity of energy to quality of structure, in that they performed experiments to test predictions based on the hypothesized positive association between energy metabolism and isotopic turnover in protein. The studies altered the energy use of birds through either the manipulation of ambient temperature [54,55] or flight exercise [55,56], and measured isotopic incorporation into blood (and other tissues in one study, [55]). Despite clear expectations, all three studies confirmed that energy metabolism was not the primary driver of isotopic turnover. Carleton and Martinez del Rio [54] first suggested that protein turnover rather than energy metabolism was the main driver of isotopic turnover. The evidence from these three studies revealed that the doubling of energy metabolism [54,55], as well as flying or not flying over extended time periods in a wind-tunnel [56], did not alter blood isotope turnover in three different songbird species. Direct support for protein turnover affecting isotopic turnover came from diet-switch studies of a songbird [57] and rats [58]. For example, yellow-vented bulbuls (Pycnonotus xanthopygos) fed a low-protein diet had slower rates of nitrogen incorporation into plasma and blood cells than birds fed a high-protein diet [57]. Comparable results were obtained on rats, for which the isotopic turnover of carbon and nitrogen for various organs increased by 20% and 30%, respectively, when fed a diet enriched with protein compared to a standard diet [58]. This evidence suggests that the rate of protein turnover rather than energy metabolism primarily determines the rate of lean tissue carbon turnover, although clearly more such studies on individuals with a broader variety of life histories are needed.
Although a consensus is forming that structural turnover rather than metabolic rate is the main driver of carbon isotope incorporation rates, there remains uncertainty, particularly for less studied isotopes, tissues, and taxa. Similar to the studies above, Storm-Suke et al. [59] found no effect of metabolic rate on the turnover of 2H in the red blood cells of Japanese quail (Coturnix japonica), but this remains one of the few studies to quantify deuterium turnover in animal tissue. In contrast, Colborne et al. [60] found opposing responses of 15N and 13C turnover in response to elevated temperature (and therefore metabolic rate) in baitfish (emerald shiners, Notropis atherinoides), which could be attributed to the involvement of different metabolic pathways for carbon and nitrogen or to differences in metabolism between endotherms and ectotherms [61,62,63]. Finally, studies of lipid turnover have observed effects of energy expenditure more regularly than those focused on protein [26,64,65], suggesting that differences in the metabolism of macromolecules may entail different relationships with energy use. While these are all interesting patterns, they are the result of comparatively few studies and should be further investigated in the future.
Besides such variation in isotope turnover among individuals of the same body mass, the allometry of isotope turnover across body sizes, and therefore across species, seems evident although the range of species for which such turnover rates are available needs to be expanded. Establishing how turnover scales with body mass, its allometry, for many tissues would greatly expand our ability to predict isotope turnover for animals across a much broader range of body sizes, and then use this to better understand key aspects of their ecology (e.g., trophic position [66]). Like so many other physiological and morphological features—including energy metabolism (for general review see [67,68])—isotopic turnover appears to be related to body mass. The allometry of isotopic turnover was first evaluated for avian whole blood [54] and specifically for the cellular fraction of blood [69]. Subsequent meta-analyses provide estimates of isotopic incorporation rates at the level of the whole organism, for specific taxonomic groups and for specific organs [16,17]. For example, Thomas and Crowther [16] used body mass and body temperature to predict rates of isotopic incorporation into tissues of a broad suite of endotherms and ectotherms. They found that whole-animal and muscle turnover rate scaled with body mass to the power of -0.19. Vander Zanden and colleagues [17] also found that turnover rates of many tissues across a variety of taxonomic groups scaled allometrically and discussed the implications of such allometry for ecological studies of food webs and trophic relationships. Empirical models such as these provide useful tools for estimating turnover rates for novel taxa. However, our current understanding of the allometry of isotopic turnover rates is far from complete and requires many more empirical studies of tissue turnover rate across a wider variety of species that differ broadly in body mass.

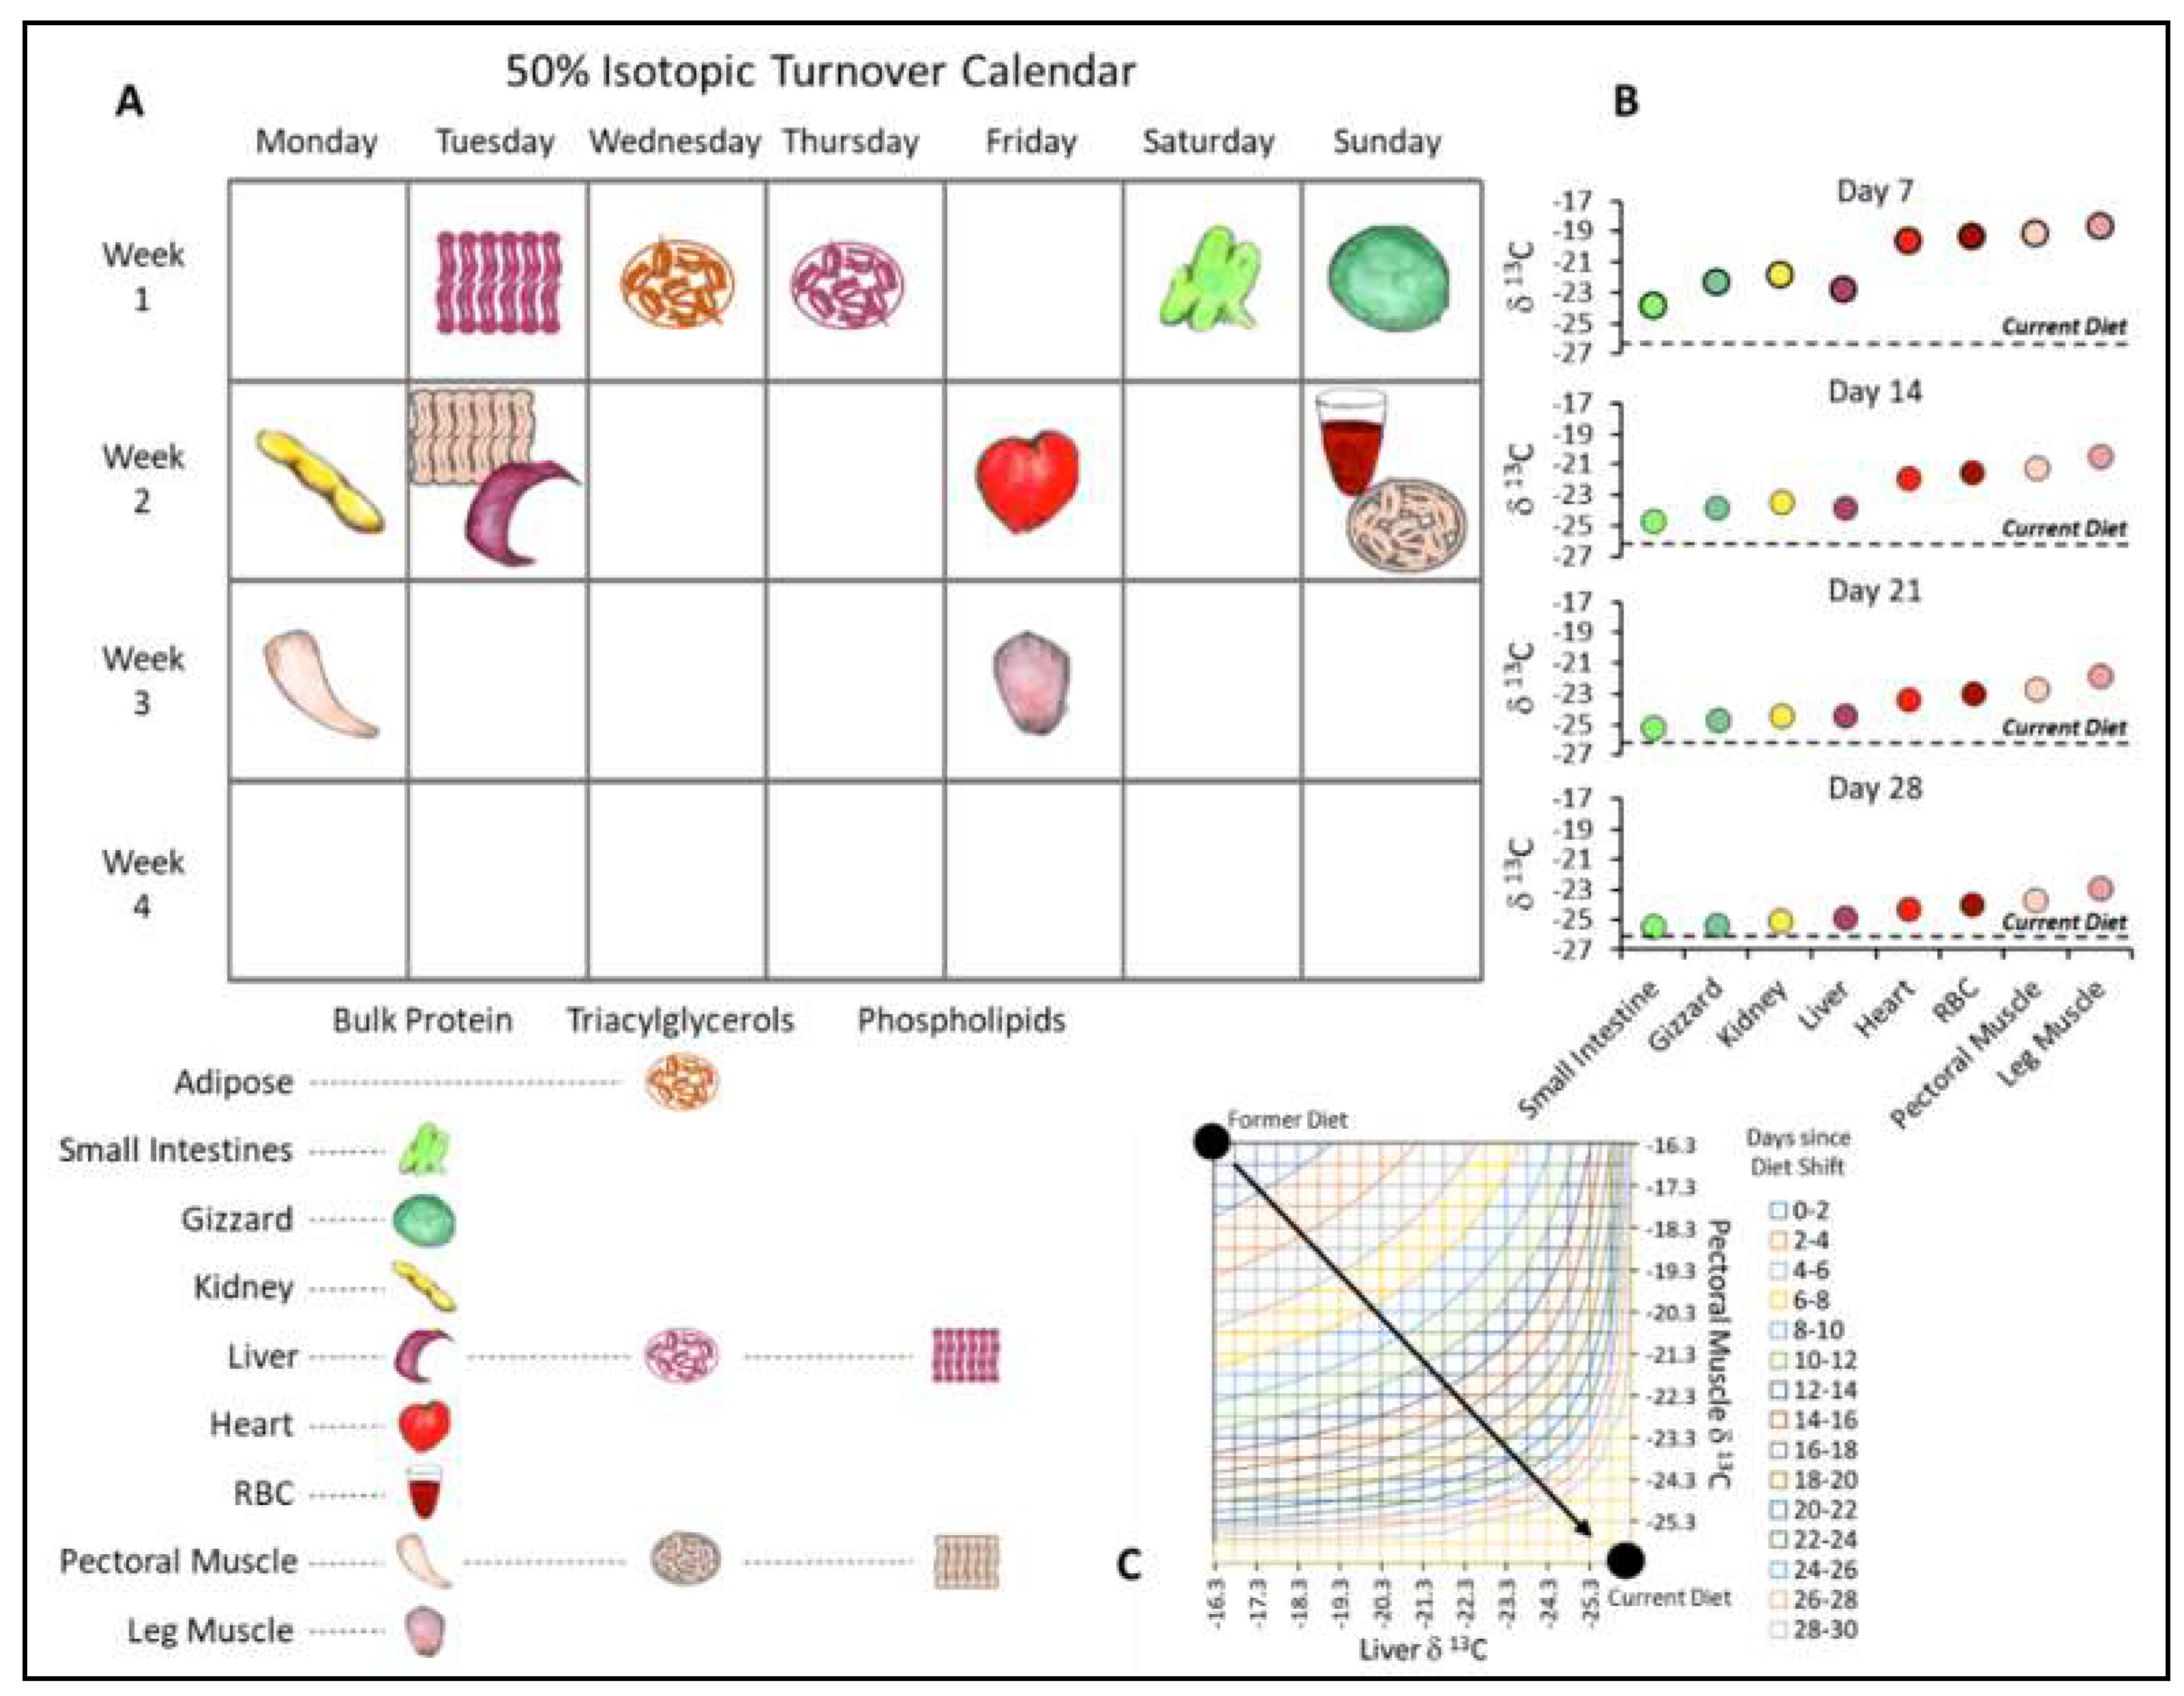
3.2. The Physiological Basis of Isotopic Clocks: Variation in Turnover among Tissues

Ecologists are often interested in determining the timing of shifts in resource (diet) use in relation to the phenology and availability of the resource. The isotopic value of a tissue, such as red blood cells and plasma, can be used to estimate the timing of these diet shifts, as a so-called ‘isotopic clock’, given certain conditions: (a) the turnover rate of the sampled tissue(s) (e.g., red blood cells, plasma) must be known, (b) resources must differ in their isotope value, (c) the resource shift should be relatively clean, meaning from one resource to another at a certain time, and (d) the timing of the tissue sampling must occur while carbon (or other elements) from the initial diet is still apparent in the tissue(s), and carbon from the new diet has adequate time to be incorporated [70]. Such conditions quite commonly occur, for example, in animals living in seasonal environments where seasonal changes in resources must be tracked by animals or the animals migrate to more benign environments with quite different resources. For example, yellow-rumped warblers (Dendroica coronata) that inhabit forests in the northern reaches of North America during the breeding season then migrate south to the coasts—those warblers that migrate to the east coast of North America feed almost exclusively on myrtle berries which have a uniquely negative carbon value (−28‰), which is quite different from their summer resources [71]. If one knows the turnover rate of a given tissue(s), and resources differ in their isotopic composition, then the timing of the resource shift (or how long yellow-rumped warblers have been on the coast consuming myrtle berries) can be determined. Podlesak et al. [71] non-destructively sampled blood, breath, feces, and feathers from many yellow-rumped warblers, and used the known differences in the turnover rate of these tissues to estimate within a few days the timing of each individual’s arrival to coastal New England.
Very few studies have quantified the turnover rates of multiple tissues within the same individuals (for review see [69]), but a few generalizations seem to be emerging. First, the differences in turnover between tissues (Figure 2A) are orders of magnitude larger than that caused by any whole-animal change in energy or protein metabolism. Second, although many more such studies are needed, the relative differences in turnover rate between organs seem consistent across at least the six species of birds that have been studied. Third, for those tissues that have been studied across a range of species of different body sizes, the turnover rate scales allometrically (see discussion in the previous section). Lastly, if such robust between-organ differences in turnover rate are confirmed with more studies, then this makes available quite a refined isotopic clock for estimating the timing of resource shifts in a wide variety of animals.
If energy metabolism does not explain the variation in turnover rate within a tissue, as discussed above, it seems also unlikely that energy expenditure explains variation between tissues within individuals. The few studies that have measured turnover rate in a variety of tissues confirm that turnover rate differences between tissues cannot be explained by variation in the energy expenditure of these tissues [72,73]. Splanchic organs like the liver and small intestine appear to have fast rates of isotopic incorporation, while muscles have slow rates and internal organs like the gizzard, kidney and heart arrange themselves in between. It appears that some tissues like the brain, bone and skin pose some issues in that they are either extremely slow in turnover rates and thus do not reach asymptotes in the respective studies, or the lack of fit is a result of large variation in the determinant of the isotopic incorporation [55,69]. Protein synthesis and degradation of the respective organ more likely determine the rate of isotopic incorporation than the simple energy turnover of the respective organ, as demonstrated through dietary manipulations (see above and [57,58,73]). Also, the study that employed manipulations of energy budget through both temperature manipulation and the manipulation of flight exercise with the goal to test for predicted associations between energy use and isotopic turnover (see section just above) sampled not only the blood but a variety of organs [55]. For example, flight and leg muscle represent tissues that undoubtedly differ in their use in response to thermoregulation or flight exercise, and thus their rate of energy transformation into physical work. However, flight muscle isotopic turnover did not differ between flight exercise treatment and control, a result comparable to that for the leg muscle, clearly not in use during flight. In contrast, temperature treatment resulted in differences in flight muscle carbon turnover, with faster turnover under cold treatment compared to warm temperature; leg muscle again revealed no difference. Flight muscle is the site for shivering thermogenesis, and thus a higher energy use for contraction since birds do not use uncoupling proteins. Energy use in an organ may thus still be linked to its turnover, but clearly this is not always the case. The contributions of the different metabolic processes to the organ specific rate of isotopic turnover requires cleverly designed experiments that manipulate certain metabolic processes and determine how this affects the turnover rate of multiple tissues.

3.3. Turnover and Diet Requirements

The isotopic turnover of a tissue in steady state involves both the removal of old molecules by catabolism, and their replacement with newer, isotopically distinct molecules [12,39,72]. Thus, estimates of catabolic turnover also represent the rate at which molecules need to be supplied to the tissue to maintain that steady state, which can then be used to make inferences about the supply of the compounds in question (Figure 3A). For example, estimates of lean tissue turnover are also representative of the rate of protein synthesis, which is in turn related to energy expenditure and minimum rates of non-essential amino acid synthesis and the dietary intake of essential amino acids [74,75]. Studies that thoroughly consider the implications of turnover rates for energetic and nutritional status are relatively uncommon, but several have pursued and demonstrated the utility of this method. For example, Mizrahy et al. [76] used the protein turnover rates estimated by Bauchinger and McWilliams [69] to calculate the rate of protein synthesis, and therefore the minimum amount of energy required to rebuild lean tissue after a fast that simulated in-flight starvation in blackcaps (Sylvia atricapilla). The contrast between that minimum requirement and the birds’ actual intake of energy then informed their conclusion that water availability influenced the recovery of tissues after the fast by affecting digestive efficiency.
A second example is the study by Carter et al. [65], which estimated the turnover rates of fatty acids in the membranes and lipid droplets of zebra finch (Taeniopygia guttata) pectoralis muscle. Certain polyunsaturated fatty acids (PUFAs) are essential or conditionally essential nutrients for vertebrates [77,78,79], so Carter et al. were then able to calculate minimum daily requirements for the essential n6 fatty acid linoleic acid, as well as minimum dietary concentrations. Although estimated requirements were higher on a per gram basis than for larger animals, the authors were able to conclude that many of the dietary items that wild songbirds encounter would meet those minimum levels. In contrast, the very slow turnover of the long-chain PUFAs arachidonic acid and docosahexaenoic acid led Carter et al. to conclude that very low dietary concentrations were required to maintain a steady composition of these functionally important fatty acids.
A final example is a 2016 study by Salini et al. [80], who measured the turnover of fatty acids in barramundi (asian seabass; Lates calcarifer). This study similarly found very low rates of turnover for long-chain PUFAs with correspondingly low maintenance requirements and concluded that the demand for these fatty acids was largely driven by deposition in tissues. Because deposition depends on growth, the authors also concluded that dietary requirements would be highest in younger, faster growing individuals. Although the scope of these studies does not extend to a comprehensive range of tissue components and dietary nutrients, they do effectively demonstrate the utility of turnover rates for understanding the digestive physiology and nutrition of animals.

4. The Use and Importance of Turnover Data for Isotopic Studies of Ecology and Nutrition

Stable isotope analysis has become a vital tool for studies seeking to characterize the diets of animals and the timing of diet shifts, and subsequently to use that data to infer the structure of ecological communities [1,81,82,83,84]. However, the successful use of stable isotopes in these applications depends on full consideration of the physiology that underlies the incorporation of isotopes into tissues, represented in measurements of turnover rates of compounds or tissues. Here, we discuss the influence of turnover rate measurements on diet reconstructions, isotopic clocks, and assessments of nutritional status in stable isotope studies.

4.1. Reconstructing Diets from Isotopic Signatures

Perhaps the most common use of stable isotope analysis in ecology is to identify the dietary items and the proportions in which they are consumed and assimilated by animals. Such diet reconstructions require that potential dietary items possess distinct isotopic signatures, whose influence on tissue isotope values can then be disentangled with Bayesian mixing models [2,7,85,86,87]. These or related statistical methods are necessary to account for uncertainty in the isotopic signatures and discrimination factors used as the basis for diet reconstructions. Differences in the isotopic signature of dietary items require differences in isotopic fractionation, which can result from physical processes (e.g., geographic 2H gradients) [9,45,46,88], metabolic pathways (e.g., C3 vs. C4 plant δ13C) [9,12,43], trophic level (e.g., plant vs. consumer δ15N) [9,40,44], or biome (e.g., marine vs. terrestrial δ13C and δ15N) [9,40,41,42]. Once diet has been established, that information can then be used to answer a wide range of ecological questions, including what resources are used by different species [13,89,90,91], where individuals move to acquire those resources [92,93,94,95], how energy and nutrients move among trophic levels [34,35,96,97], and how communities and biomes are linked by the flow of energy and nutrients [42,98,99,100]. The diversity and novelty of these applications contribute to the great popularity of stable isotope-based diet reconstruction methods.
However, the isotopic signature of tissues changes over time following diet shifts (Figure 2B), and differences in turnover among tissues and individuals mean that different samples may integrate the effect of diet over shorter or longer periods of time [1,15,47]. Integrated isotopic signatures impede the estimation of diet for a specific time point, while variability among samples can reduce the precision of diet reconstructions. The most common way to account for these changes in composition over time is to assume that the sampled tissues are in equilibrium with the diet and so consequently there are no changes over time to disrupt diet reconstruction [16,17]. It is critical for the reliability of dietary studies that these assumptions be validated, ideally with actual estimates of turnover rates in the study species, but with estimates from similar species or inferred by allometry if species-specific estimates are unavailable and impractical to obtain. It is particularly useful to consider the turnover rates of tissues in the focal species during the design phase of the study, as samples can then be chosen to represent diet at different time points in the past [1,47,101,102]. Tissues with fast turnover rates (e.g., plasma, liver) will represent the short-term diet whereas tissues with slow turnover rates (e.g., muscle, bone) will be more influenced by long-term diet, and inert tissues (e.g., hair, feather) will represent diet during the period when they were grown. Thus, considering the turnover rates of animal tissues not only improves the quality of diet reconstructions, but also expands the questions to which stable isotope analyses can be applied.
A few interesting examples will illustrate how the knowledge of turnover rates of different tissues from the same individuals helps to document resource use over time in animals. A recent study by Marques et al. [103] used stable isotope analysis of liver, muscle, and feather samples to reconstruct the diets of magellanic penguins (Spheniscus magellanicus) at several points throughout their annual cycle. Overall, they found a high reliance on the Argentine anchovy (Engraulis anchoita), but they also were able to reveal interesting changes over the course of the annual cycle and differences among adults and juveniles. Specifically, anchovy consumption was highest during the migratory/early wintering period, as indicated by muscle, but diets were more diverse in mid and late winter, as indicated by the liver, with notable consumption of silverside (Odontesthes argentinensis) and São Paulo squid (Doryteuthis sanpaulensis). Similarly, diet during the nestling/post-breeding period, as indicated by feathers, was also more diverse, with substantial contributions by the white shrimp (Peisos petrunkevitchi). Interestingly, diets diverged between adults and juveniles the least during the migratory/early wintering period, suggesting that adults use different resources compared to juveniles, except when dietary options are limited. This result again highlights the importance of the Argentine anchovy, their primary food source during that period, to magellanic penguins.
A second example of the effective selection of tissues on the basis of turnover is the recent study by Gómez et al. [104], in which they estimated changes in the trophic position of a migratory songbird, the gray-cheeked thrush (Catharus minimus), over its annual cycle. The authors collected whole-blood samples to represent diet shortly preceding capture during spring migration, claw samples to represent diet on wintering grounds, and feather samples to represent diet during the post-breeding period. By doing so, they were able to demonstrate that trophic level was lowest during spring migration, slightly higher on wintering grounds, and highest in the post-breeding period, which indicates a heavy reliance on fruits as opposed to insects during migration and a reversed trend on breeding grounds. This study was also notable for its use of compound-specific amino acid analysis to expand their ability to discriminate among dietary items, although without measurements of amino acid turnover it is unclear whether these reconstructions match the time frame assumed based on bulk-protein analysis. Nevertheless, both this and the previous study demonstrate the benefits of considering turnover during the design phase of stable isotope diet studies.
Alternately, in some circumstances it may be possible to use turnover rates to account for incomplete equilibration by algorithmically adjusting measurements of isotopic enrichment [23,105] or by applying corrections to the discrimination factors used to estimate diet [106,107,108]. However, this approach is computationally intensive and used infrequently. Meanwhile, many studies do not explicitly address the assumptions about turnover that underlie stable isotope-based diet reconstructions. In many cases, this omission may result from a lack of species and tissue-specific estimates of turnover and, until recently, the lack of broadly applicable empirical models for estimating turnover rates, such as those in [16]. Oftentimes, practical considerations also lead studies to focus on easily collected tissues like blood, hair, or feather, and to reconstruct diets using only one or a small set of tissues. In spite of these limitations, the consideration of turnover remains a critical part of diet reconstruction with stable isotopes, and should be carefully considered by future studies.

4.2. Pinpointing Dietary Shifts with Isotopic Clocks

When the isotopic composition of the diets for a given species is known, reliable differences in turnover between tissues, compounds, and isotopes can then be used to construct isotopic clocks that can then be used to calculate the timing of diet shifts (Figure 2A) [69,109,110,111]. The timing of diet shifts is, in turn, immensely valuable for reconstructing the movement and feeding behavior of individual animals. Assuming that turnover was estimated using a standard first-order kinetic equation (see above), it is simple to rearrange the equation to use the data from a single tissue to calculate the time since the diet shift. This rearranged equation takes the form:
t e s t =   τ   × ln ( y t   y ) ( y 0   y )
where test is the estimated time elapsed since the diet shift, τ is the mean retention time of the tissue or compound, yt is the isotopic enrichment of the tissue at the time of measurement, y0 is the enrichment at equilibrium with the initial diet, and y is the enrichment at equilibrium with the second diet. To produce more precise estimates of the time since the diet shift, estimates from different tissues can be averaged (Figure 2C) or different equations can be derived to directly incorporate data from multiple tissues [109]. Isotopic enrichment data for multiple tissues can also be used more generally to place the timing of a dietary shift by finding the tissue with the fastest turnover that is not at equilibrium with the current diet (Figure 2B).
With the recent development of empirical allometric models to estimate turnover rates for novel taxa [16], as well as the increasing number of studies that have experimentally measured turnover, isotopic clocks are becoming much more widely applicable. However, they remain most applicable to species that consume resources from a range of discrete habitats or have regular shifts in their diets, particularly species that migrate between isotopically distinct habitats or exploit seasonally available resources. For example, Moore et al. [112] used a combination of carbon and sulfur isotopic clocks to estimate the minimum amount of time that juvenile pacific salmon spent in an estuary situated between their freshwater spawning grounds and marine habitats where they spend the bulk of their life. By doing so, they demonstrated that salmon do use estuaries as stopover sites along their downstream migration and can accumulate substantial growth there, although the importance varied among species with chinook (Oncorhynchus tschawytscha) and pink salmon (O. gorbuscha) remaining the longest. The authors were also able to infer the existence of a unique estuarine fry life history stage in coho salmon (O. kisutch), based on the observation of a negative relationship between time spent in the estuary and body size. Finally, Moore et al. used a combination of isotopic clocks and genetic stock assessment to demonstrate population-specific differences in the use of estuaries by sockeye salmon (O. nerka), indicating within-species divergence in migratory strategies.
A similar example is a recent study by Catry et al. [113], in which they estimated the stopover lengths of a migratory shorebird, the dunlin (Calidris alpina), in the Tagus estuary of Portugal. In this case, they used carbon and nitrogen clocks for plasma and red blood cells to estimate the time since arrival at the stopover site, and linked the time since arrival to stopover length with a simulation approach. Using this method, Catry et al. estimated that dunlin spent an average of 7.5 days in the Tagus estuary during their spring migration from Mauritania to Iceland. Additionally, by combining this estimate of stopover duration with the ratio of migratory to wintering individuals in the estuary, and also with counts of the total number of dunlin on each day of the migratory period, the authors were able to estimate the total population of migratory individuals that used that stopover site. The resulting estimate of ~30,000 birds suggests that at least 4% of that population of dunlin uses this one site, which is key information for linking the migratory ecology of this species with conservation action.
A final example of the utility of isotopic clocks is a study conducted by Boggie et al. [114], in which the authors both estimated the timing of arrival by migratory sandhill cranes (Antigone canadensis) on wintering grounds in the Middle Rio Grande valley of New Mexico and their use of anthropogenic subsidies there. Using carbon isotopic clocks for liver and muscle, the authors estimated that, on average, this population of cranes arrived on the wintering grounds in early November and subsequently relied on corn grown on state and federal lands for approximately 60% of their diet, resources that would otherwise likely be acquired by foraging on agricultural land. Results such as these are essential to guide the actions taken by state and federal agencies to most efficiently manage wildlife populations and reduce human–wildlife conflicts. More broadly, this and the previous studies demonstrate the value of isotopic clocks for estimating the timing of animal movements and diet shifts, which can then be applied to answer a wide array of ecological questions.

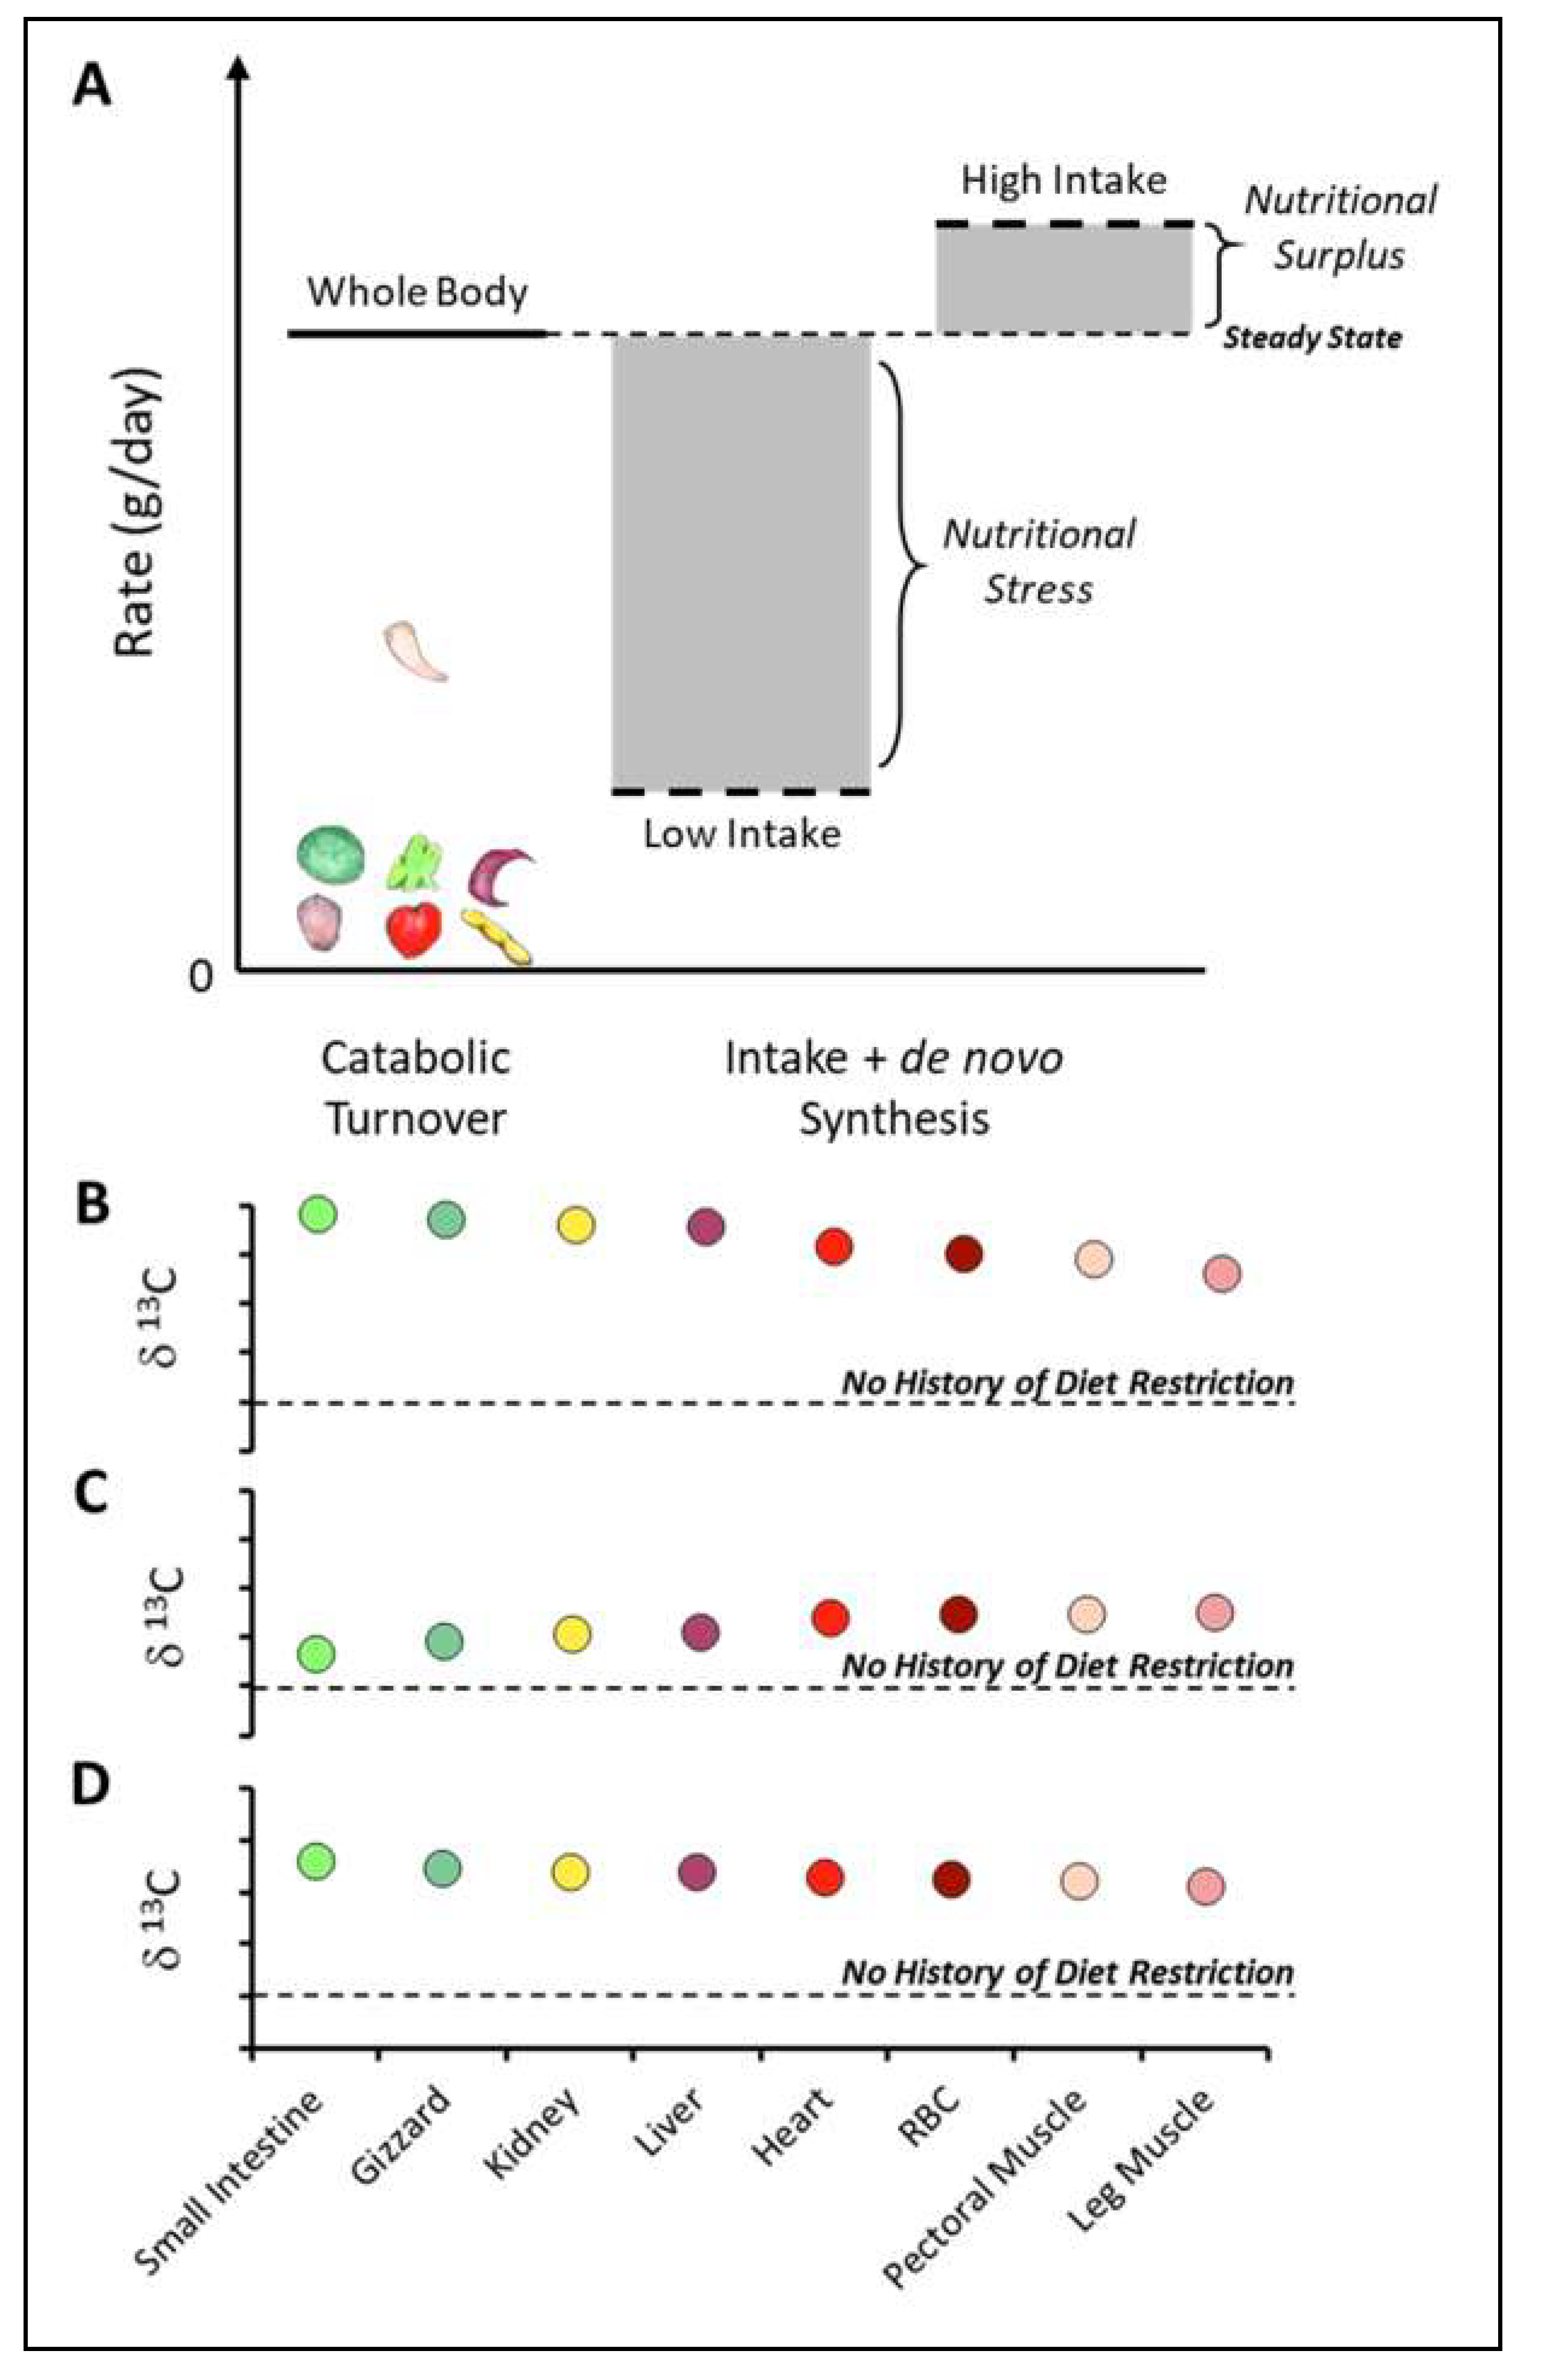
4.3. Inferring Past and Present Nutritional Status from Turnover and Isotopic Signatures

Nutrition is a key aspect of animal ecology, both as a motivational force guiding the behavior of individuals and as a link between habitat and behavior, individual fitness, and corresponding population-level effects. Correspondingly, assessments of the nutritional status of individuals are an important element of a wide range of ecological studies. Several methods have been developed that use stable isotopes to assess the nutritional status of animals, each with important connections to the turnover rates of isotopes.
First, there are methods that directly use turnover rates to estimate nutritional status. As described above, the catabolism and anabolism of tissue are balanced in animals at steady state, and so measurements of catabolic turnover in such animals are directly related to the supply of replacement molecules and minimum dietary requirements in the case of essential nutrients. A comparison of requirements with the actual intake of nutrients can therefore be used to assess the nutritional status of animals for whom turnover rates have been measured (Figure 3A). A related approach involves measuring the turnover of a stable isotope-labeled tracer as well as the overall balance of the tracer compound in the tissue of interest [115,116]. In this method, the disappearance of the tracer represents the rate of catabolism of the tissue containing the tracer compound, whereas the sum of the breakdown and the total balance represents the rate of tissue synthesis. Nutritional stress can then be inferred from higher rates of catabolism and lower rates of synthesis, and nutritional satiety can be inferred from balanced rates of catabolism and synthesis.
Alternately, it is possible to assess nutritional status by its effect on the isotopic composition of tissues. Food deprivation, in particular, typically results in elevated δ15N values in tissues, due to the preferential retention of the heavier isotope during repeated de- and trans- amination of amino acids [117,118,119,120,121,122]. Fasting also seems to be related to changes in the δ13C enrichment, but the observed effects have been much less consistent, with elevated δ13C in chicken (Gallus gallus) hemoglobin [123] and bonobo (Pan paniscus) urine [118], but mixed results in human hair [119,122], and no effect on the muscle or liver in ross’ geese (Chen rossii) [117]. Isotopic niche size is also related to nutritional status, typically expanding when animals encounter stressful environments such as limited resource availability, and retracting in benign environments [120,121,124]. For example, Karlson et al. [125] demonstrated that nutritional stress, parasite infestation, and toxin contamination all resulted in larger carbon–nitrogen isotope niches in the marine amphipod Monoporeia affinis, with nutritional stress producing the largest absolute change in isotopic niche space.
As with diet reconstructions, the use of isotopic signatures and niche space to assess nutritional status is facilitated by the consideration of the turnover rates of sampled tissues (Figure 3B). Specifically, the estimated timing of a period of nutritional stress will depend on the turnover rate of the sampled tissue, and estimates of turnover are necessary to test assumptions about timing and effectively design sampling protocols. Furthermore, studies that incorporate cross-tissue comparisons will usually be able to more accurately reconstruct timelines of nutritional state in their study taxa. However, most work linking isotopes and nutritional state, both methods directly incorporating and indirectly considering turnover, have thus far focused on humans (e.g., [116,120,121]), and so further development of these methods is likely necessary before they can be readily applied to a wide range of wild species and natural contexts.

5. The Future of Isotopic Turnover

Thus far, we have described the process and importance of estimating turnover rates for ecological studies that make use of stable isotope-based techniques. Below we briefly outline some of the future opportunities and challenges that isotopic turnover studies may face, including developing a more detailed mechanistic understanding of isotopic turnover, integrating isotope clock information about resource use with the direct tracking of movements, and adapting turnover-based methods in nutrition for use on wildlife.

5.1. What Mechanisms Drive the Turnover of Isotopes?

In the sections above we discussed how understanding variation in turnover rates among tissues, individuals, and species allows for more exact and effective diet reconstructions and isotopic clocks. It follows that a more precise knowledge of the mechanisms that contribute to such variation can further refine these ecological methods. Developing mechanistic models of turnover will be a particularly important step towards understanding the allometry of turnover and improving predictions of turnover rates derived from empirical models in novel taxa, thereby broadening their application to ecological studies. As we have described, there is already evidence suggesting that protein synthesis and degradation, rather than metabolic rate, are key mechanisms driving the turnover of non-lipid tissue components. Thus, while more studies are needed to verify this relationship, another important follow-up step is to integrate the knowledge of the regulation of protein synthesis with turnover rates. Specific topics of interest include 1) the links between isotopic and cellular or organelle turnover, perhaps contributing to rhythmic cycles of isotopic turnover or differences among tissues, 2) the relationship between the synthesis of specific proteins and isotopic turnover, and 3) the influence of dietary availability and the cycling of amino acids among tissues on isotopic turnover. Moving forward, it will also be important to ask similar questions about the turnover of other tissue components, particularly lipids, which may have different relationships with metabolism or among tissues than those of protein.

5.2. How Can Turnover Be Integrated with Tracking Technologies?

In recent years there have been tremendous advances in the number and sophistication of tracking technologies available to ecologists [126,127]. Since one of the major ecological applications of stable isotopes is for tracking the location and timing of animal movements, there is an excellent opportunity to cross-validate the results of these methods. A particularly important step is to test the precision of estimates of departure and arrival times estimated from stable isotope enrichment data with isotopic clocks. Moreover, by pairing movement histories with isotope data it may be possible to assess the effect of fasting and exercise on stable isotope signatures in a natural context. The combination of these effects with a greater mechanistic understanding of turnover could greatly refine stable isotope methods. Meanwhile, the ability to pair stable isotope data with movement data creates the possibility of more detailed analyses of resource use during large scale movements, such as diet selection at migratory stopover sites. These finer details are likely to be an important supplement to data collected from coarser tracking technologies, such as light-level geolocators, and may provide new insights into the motivations for animal movements.

5.3. How Can Turnover Inform Wildlife Nutrition Studies?

As we discussed above, methods that link isotopic turnover to diet requirements and nutritional state, or methods that infer past nutritional stress from isotopic signatures, have mostly been pursued in human contexts and will require some development before they can be reliably used to study the nutrition of wild animals. At a minimum, turnover rates of multiple tissues will need to be estimated and the isotopic signatures of nutritional stress will need to be established with greater confidence for a wider range of species. Subsequently, it will be necessary to empirically test the predictions for nutritional time series based on differences in turnover among tissues. As with ecological stable isotope methods, this process will be facilitated by a more detailed, mechanistic understanding of the drivers of turnover, which may elucidate any differences among tissues, individuals, and species. In addition to general mechanisms driving turnover, it will be important to clarify mechanisms specific to nutritional stress such as changes in routing and rates of de novo synthesis of tissue components. Investment in such challenges will further improve stable isotope-based assessments of nutritional state and history in ecological studies, thereby expanding our understanding of the motivations and success of animals.

Author Contributions

W.A.C. and S.R.M. conceptualized and W.A.C. created the initial outline of this review. All three authors contributed to the original draft and subsequent revisions.

Funding

This project was funded by U.S. National Science Foundation IBN-9984920 and IOS-0748349 (to S.R.M.), and the U.S. Dept. Agriculture grant no. 538748 (to S.R.M.), and the Polish National Science Centre grant number UMO-2015/19/B/NZ8/01394 (to U.B.).

Acknowledgments

We would like to thank those that made our studies on isotopic turnover in Zebra Finches possible, including Clara Cooper-Mullin, who collaborated on several projects, Barbara Pierce, who provided us with the birds used in those studies, Luke Douglas, Megan Grey, and Lara Kazo, who assisted with animal care, and Megan Skrip, who refined our animal care protocols. We are particularly indebted to Rick McKinney at the EPA Atlantic Ecology Division, Narragansett RI for his support with bulk isotope analyses. Corbinian Böhm provided the bird and organ sketches. Finally, we also thank our collaborators and technical gurus at the University of New Mexico Center for Stable Isotopes, including Seth Newsome, John Whiteman, Laura Burkemper, and Emma Elliott-Smith.

Conflicts of Interest

The authors declare no conflict of interest.

References

  1. Newsome, S.D.; Rio Martinez del, C.; Bearhop, S.; Phillips, D.L. A Niche for Isotope Ecology. Front. Ecol. Environ. 2007, 5, 429–436. [Google Scholar] [CrossRef]
  2. Inger, R.; Bearhop, S. Applications of stable isotope analyses to avian ecology. IBIS 2008, 150, 447–461. [Google Scholar] [CrossRef]
  3. Ben-David, M.; Newsome, S.D.; Whiteman, J.P. Lipid and amino acid composition influence incorporation and discrimination of 13 C and 15 N in mink. J. Mammal. 2012, 93, 399–412. [Google Scholar] [CrossRef]
  4. Gannes, L.Z.; O’Brien, D.M.; Martinez del Rio, C. Stable isotopes in animal ecology: Assumptions, caveats, and a call for more laboratory experiments. Ecology 1997, 78, 1271–1276. [Google Scholar] [CrossRef]
  5. Post, D.M. Using stable isotopes to estimate trophic position: Models, methods, and assumptions. Ecology 2002, 83, 703–718. [Google Scholar] [CrossRef]
  6. Martínez Del Rio, C.; Wolf, N.; Carleton, S.A.; Gannes, L.Z. Isotopic ecology ten years after a call for more laboratory experiments. Biol. Rev. 2009, 84, 91–111. [Google Scholar] [CrossRef] [PubMed]
  7. Wolf, N.; Carleton, S.A.; Martinez del Rio, C. Ten years of experimental animal isotopic ecology. Funct. Ecol. 2009, 23, 17–26. [Google Scholar] [CrossRef]
  8. Bearhop, S.; Waldron, S.; Votier, S.C.; Furness, R.W. Factors that influence assimilation rates and fractionation of nitrogen and carbon stable isotopes in avian blood and feathers. Physiol. Biochem. Zool. 2002, 75, 451–458. [Google Scholar] [CrossRef]
  9. Gannes, L.Z.; Martinez del Rio, C.; Koch, P. Natural abundance variations in stable isotopes and their potential uses in animal physiological ecology. Comp. Biochem. Physiol. 1998, 119, 725–737. [Google Scholar] [CrossRef]
  10. Podlesak, D.W.; McWilliams, S.R. Metabolic routing of dietary nutrients in birds: Effects of diet quality and macronutrient composition revealed using stable isotopes. Physiol. Biochem. Zool. 2006, 79, 534–549. [Google Scholar] [CrossRef] [PubMed]
  11. Newsome, S.D.; Wolf, N.; Peters, J.; Fogel, M.L. Amino acid δ13C analysis shows flexibility in the routing of dietary protein and lipids to the tissue of an omnivore. Integr. Comp. Biol. 2014, 54, 890–902. [Google Scholar] [CrossRef] [PubMed]
  12. Hobson, K.A.; Clark, R.G. Assessing avian diets using stable isotopes I: Turnover of 13C in tissues. Condor 1992, 94, 181–188. [Google Scholar] [CrossRef]
  13. Inger, R.; Ruxton, G.D.; Newton, J.; Colhoun, K.; Robinson, J.A.; Jackson, A.L.; Bearhop, S. Temporal and intrapopulation variation in prey choice of wintering geese determined by stable isotope analysis. J. Anim. Ecol. 2006, 75, 1190–1200. [Google Scholar] [CrossRef] [PubMed]
  14. Martínez del Rio, C.; Carleton, S.A. How fast and how faithful: The dynamics of isotopic incorporation into animal tissues. J. Mammal. 2012, 93, 353–359. [Google Scholar] [CrossRef]
  15. Davis, M.; Munoz, S.P. The temporal scale of diet and dietary proxies. Ecol. Evol. 2016, 6, 1883–1897. [Google Scholar] [CrossRef]
  16. Thomas, S.M.; Crowther, T.W. Predicting rates of isotopic turnover across the animal kingdom: A synthesis of existing data. J. Anim. Ecol. 2015, 84, 861–870. [Google Scholar] [CrossRef]
  17. Vander Zanden, M.J.; Clayton, M.K.; Moody, E.K.; Solomon, C.T.; Weidel, B.C. Stable isotope turnover and half-life in animal tissues: A literature synthesis. PLoS ONE 2015, 10, e0116182. [Google Scholar] [CrossRef]
  18. Hesslein, R.H.; Hallard, K.A.; Ramlal, P. Replacement of Sulfur, Carbon, and Nitrogen in Tissue of Growing Broad Whitefish (Coregonus nasus) in Response to a Change in Diet Traced by d34S, d13C, and d15N. Can. J. Fish. Aquat. Sci. 1993, 50, 2071–2076. [Google Scholar] [CrossRef]
  19. Cerling, T.E.; Ayliffe, L.K.; Dearing, M.D.; Ehleringer, J.R.; Passey, B.H.; Podlesak, D.W.; Torregrossa, A.M.; West, A.G. Determining biological tissue turnover using stable isotopes: The reaction progress variable. Oecologia 2007, 151, 175–189. [Google Scholar] [CrossRef]
  20. Lifson, N.; McClintock, R. Theory of use of the turnover rates of body water for measuring enery and material balance. J. Theor. Biol. 1966, 12, 46–74. [Google Scholar] [CrossRef]
  21. Visser, G.H.; Boon, P.E.; Meijer, H.A. Validation of the doubly labeled water method in Japanese Quail Coturnix c. japonica chicks: Is there an effect of growth rate? J. Comp. Physiol. B. 2000, 170, 365–372. [Google Scholar] [CrossRef] [PubMed]
  22. Speakman, J. Doubly Labeled Water: Theory and Practice; 1st ed.; Chapman and Hall: London, UK, 1997. [Google Scholar]
  23. Mitchell, G.W.; Guglielmo, C.G.; Hobson, K.A. Measurement of whole-body CO2 production in birds using real-time laser-derived measurements of hydrogen (δ2H) and oxygen (δ18O) isotope concentrations in water vapor from breath. Physiol. Biochem. Zool. 2015, 88, 599–606. [Google Scholar] [CrossRef] [PubMed]
  24. Karasov, W.H.; Pinshow, B. Changes in lean mass and in organs of nutrient assimilation in a long-distance passerine migrant at a springtime stopover site. Physiol. Zool. 1998, 71, 435–438. [Google Scholar] [CrossRef]
  25. McWilliams, S.R.; Whitman, M. Non-destructive techniques to assess body composition of birds: A review and validation study. J. Ornithol. 2013, 154, 597–618. [Google Scholar] [CrossRef]
  26. Carter, W.A.; Cooper-Mullin, C.; McWilliams, S.R. Turnover of muscle lipids and response to exercise differs between neutral and polar fractions in a model songbird, the Zebra Finch. J. Exp. Biol. 2018. [Google Scholar] [CrossRef] [PubMed]
  27. Folch, J.; Lees, M.; Stanley, G.H.S. A simple method for the isolation and purification of total lipides from animal tissues. J. Biol. Chem. 1957, 226, 497–509. [Google Scholar]
  28. Post, D.M.; Layman, C.A.; Arrington, D.A.; Takimoto, G.; Quattrochi, J.; Montaña, C.G. Getting to the fat of the matter: Models, methods and assumptions for dealing with lipids in stable isotope analyses. Oecologia 2007, 152, 179–189. [Google Scholar] [CrossRef]
  29. Bligh, E.G.; Dyer, W.J. A rapid method of total lipid extraction and purification. Can. J. Biochem. Physiol. 1959, 37, 911–917. [Google Scholar] [CrossRef]
  30. Palmer, J.K.; Brandes, W.B. Improvement in the reproducibility of the enzymatic analysis of sucrose in stored golden delicious apples. J. Agric. Food Chem. 1974, 22, 709–712. [Google Scholar] [CrossRef] [PubMed]
  31. Thiele, C.; Ganzle, M.G.; Vogel, R.F. Sample preparation for amino acid determination by integrated pulsed amperometric detection in foods. Anal. Biochem. 2002, 310, 171–178. [Google Scholar] [CrossRef]
  32. Yoo, H.; Stephanopoulos, G.; Kelleher, J.K. Quantifying carbon sources for de novo lipogenesis in wild-type and IRS-1 knockout brown adipocytes. J. Lipid Res. 2004, 45, 1324–1332. [Google Scholar] [CrossRef] [PubMed] [Green Version]
  33. Meier-Augenstein, W. Stable isotope analysis of fatty acids by gas chromatography–isotope ratio mass spectrometry. Anal. Chim. Acta 2002, 465, 63–79. [Google Scholar] [CrossRef]
  34. Budge, S.M.; Wooller, M.J.; Springer, A.M.; Iverson, S.J.; McRoy, C.P.; Divoky, G.J. Tracing carbon flow in an arctic marine food web using fatty acid-stable isotope analysis. Oecologia 2008, 157, 117–129. [Google Scholar] [CrossRef]
  35. Ishikawa, N.F. Use of compound-specific nitrogen isotope analysis of amino acids in trophic ecology: Assumptions, applications, and implications. Ecol. Res. 2018, 33, 1–13. [Google Scholar] [CrossRef]
  36. Levin, E.; Fane, B.; Davidowitz, G. Hawkmoths use nectar sugar to reduce oxidative damage from flight. Science 2017, 355, 733–735. [Google Scholar] [CrossRef] [PubMed] [Green Version]
  37. Jin, E.S.; Sherry, A.D.; Malloy, C.R. Interaction between the pentose phosphate pathway and gluconeogenesis from glycerol in the liver. J. Biol. Chem. 2014, 289, 32593–32603. [Google Scholar] [CrossRef]
  38. McCue, M.D. Tracking the oxidative and nonoxidative fates of isotopically labeled nutrients in animals. Bioscience 2011, 61, 217–230. [Google Scholar] [CrossRef]
  39. Tieszen, L.L.; Boutton, T.W.; Tesdahl, K.G.; Slade, N.A. Fractionation and turnover of stable carbon isotopes in animal tissues: Implications for d13C analysis of diet. Oecologia 1983, 57, 32–37. [Google Scholar] [CrossRef]
  40. Kelly, J.F. Stable isotopes of carbon and nitrogen in the study of avian and mammalian trophic ecology. Can. J. Zool. 2000, 78, 1–27. [Google Scholar] [CrossRef]
  41. Cloern, J.E.; Canuel, E.A.; Harris, D. Stable carbon and nitrogen isotope composition of aquatic and terrestrial plants of the San Francisco Bay estuarine system. Limnol. Oceanogr. 2002, 47, 713–729. [Google Scholar] [CrossRef]
  42. Chisholm, B.S.; Nelson, D.E.; Schwarcz, H.P. Stable-carbon isotope ratios as a measure of marine versus terrestrial protein in ancient diets. Science 1982, 216, 1131–1132. [Google Scholar] [CrossRef]
  43. DeNiro, M.J.; Epstein, S. Influence of diet on the distribution of carbon isotopes in animals. Geochim. Cosmochim. Acta 1978, 42, 495–506. [Google Scholar] [CrossRef]
  44. DeNiro, M.J.; Epstein, S. Influence of diet on the distribution of nitrogen isotopes in animals. Geochim. Cosmochim. Acta 1981, 45, 341–351. [Google Scholar] [CrossRef]
  45. Bowen, G.J.; West, J.B. Isotope landscapes for terrestrial migration research. In Terrestrial Ecology; Hobson, K.A., Wassenaar, L.I., Eds.; Elsevier: Amsterdam, The Netherlands, 2008; pp. 79–105. ISBN 9780123738677. [Google Scholar]
  46. Bowen, G.J.; Wassenaar, L.I.; Hobson, K.A. Global application of stable hydrogen and oxygen isotopes to wildlife forensics. Oecologia 2005, 143, 337–348. [Google Scholar] [CrossRef] [PubMed]
  47. Martínez Del Rio, C.; Anderson-Sprecher, R. Beyond the reaction progress variable: The meaning and significance of isotopic incorporation data. Oecologia 2008, 156, 765–772. [Google Scholar] [CrossRef] [PubMed]
  48. Cerling, T.E.; Bowen, G.J.; Ehleringer, J.R.; Sponheimer, M. The reaction progress variable and isotope turnover in biological systems. In Stable Isotopes as Indicators of Ecological Change; Dawson, T.E., Siegwolf, R.T.W., Eds.; Academic Press: New York, NY, USA, 2007; pp. 163–171. [Google Scholar]
  49. Carleton, S.A.; del Rio, C.M. Growth and catabolism in isotopic incorporation: A new formulation and experimental data. Funct. Ecol. 2010, 24, 805–812. [Google Scholar] [CrossRef]
  50. Carleton, S.A.; Kelly, L.; Anderson-Sprecher, R.; del Rio, C.M. Should we use one-, or multi-compartment models to describe 13C incorporation into animal tissues? Rapid Commun. Mass Spectrom. 2008, 22, 3008–3014. [Google Scholar] [CrossRef] [PubMed]
  51. Wolfrum, C.; Spener, F. Fatty acids as regulators of lipid metabolism. Eur. J. Lipid Sci. Technol. 2000, 102, 746–762. [Google Scholar] [CrossRef]
  52. Twining, C.W.; Lawrence, P.; Winkler, D.W.; Flecker, A.S.; Brenna, J.T. Conversion efficiency of α-linolenic acid to omega-3 highly unsaturated fatty acids in aerial insectivore chicks. J. Exp. Biol. 2018, 221, 1–8. [Google Scholar] [CrossRef]
  53. MacAvoy, S.E.; Arneson, L.S.; Bassett, E. Correlation of metabolism with tissue carbon and nitrogen turnover rate in small mammals. Oecologia 2006, 150, 190–201. [Google Scholar] [CrossRef]
  54. Carleton, S.A.; Martínez del Rio, C. The effect of cold-induced increased metabolic rate on the rate of 13C and 15N incorporation in house sparrows (Passer domesticus). Oecologia 2005, 144, 226–232. [Google Scholar] [CrossRef] [PubMed]
  55. Bauchinger, U.; Keil, J.; McKinney, R.A.; Starck, J.M.; McWilliams, S.R. Exposure to cold but not exercise increases carbon turnover rates in specific tissues of a passerine. J. Exp. Biol. 2010, 213, 526–534. [Google Scholar] [CrossRef] [Green Version]
  56. Hobson, K.A.; Yohannes, E. Establishing elemental turnover in exercising birds using a wind tunnel: Implications for stable isotope tracking of migrants. Can. J. Zool. 2007, 85, 703–708. [Google Scholar] [CrossRef]
  57. Tsahar, E.; Wolf, N.; Izhaki, I.; Arad, Z.; del Martínez, C. Dietary protein influences the rate of 15N incorporation in blood cells and plasma of yellow-vented bulbuls (Pycnonotus xanthopygos). J. Exp. Biol. 2008, 211, 459–465. [Google Scholar] [CrossRef] [PubMed]
  58. Braun, A.; Auerswald, K.; Vikari, A.; Schnyder, H. Dietary protein content affects isotopic carbon and nitrogen turnover. Rapid Commun. Mass Spectrom. 2013, 27, 2676–2684. [Google Scholar] [CrossRef] [PubMed]
  59. Storm-Suke, A.; Norris, D.R.; Wassenaar, L.I.; Chin, E.; Nol, E. Factors influencing the turnover and net isotopic discrimination of hydrogen isotopes in proteinaceous tissue: Experimental results using Japanese Quail. Physiol. Biochem. Zool. 2012, 85, 376–384. [Google Scholar] [CrossRef]
  60. Colborne, S.F.; Fisk, A.T.; Johnson, T.B. Tissue-specific turnover and diet-tissue discrimination factors of carbon and nitrogen isotopes of a common forage fish held at two temperatures. Rapid Commun. Mass Spectrom. 2017, 31, 1405–1414. [Google Scholar] [CrossRef]
  61. Kim, S.L.; del Rio, C.M.; Casper, D.; Koch, P.L. Isotopic incorporation rates for shark tissues from a long-term captive feeding study. J. Exp. Biol. 2012, 215, 2495–2500. [Google Scholar] [CrossRef] [Green Version]
  62. Murray, I.W.; Wolf, B.O. Tissue carbon incorporation rates and diet-to-tissue discrimination in ectotherms: Tortoises are really slow. Physiol. Biochem. Zool. 2012, 8500, 96–105. [Google Scholar] [CrossRef] [PubMed]
  63. Cloyed, C.S.; Newsome, S.D.; Eason, P.K. Trophic discrimination factors and incorporation rates of carbon- and nitrogen-stable isotopes in adult green frogs, Lithobates clamitans. Physiol. Biochem. Zool. 2015, 88, 576–585. [Google Scholar] [CrossRef]
  64. Foglia, T.A.; Cartwright, A.L.; Gyurik, R.J.; Philips, J.G. Fatty acid turnover rates in the adipose tissues of the growing chicken (Gallus domesticus). Lipids 1994, 29, 497–502. [Google Scholar] [CrossRef]
  65. Carter, W.A.; Whiteman, J.P.; Cooper-mullin, C.; Newsome, S.D.; Mcwilliams, S.R. Dynamics of individual fatty acids in muscle fat stores and membranes of a songbird and its functional and ecological importance. Physiol. Biochem. Zool. 2019, 92, 239–251. [Google Scholar] [CrossRef]
  66. Jennings, S.; Maxwell, T.A.D.; Schratzberger, M.; Milligan, S.P. Body-size dependent temporal variations in nitrogen stable isotope ratios in food webs. Mar. Ecol. Prog. Ser. 2008, 370, 199–206. [Google Scholar] [CrossRef]
  67. Glazier, D.S. Metabolic scaling in complex living systems. Systems 2014, 2, 451–540. [Google Scholar] [CrossRef]
  68. Glazier, D.S. Is metabolic rate a universal ‘pacemaker’ for biological processes? Biol. Rev. 2015, 90, 377–407. [Google Scholar] [CrossRef]
  69. Bauchinger, U.; McWilliams, S. Carbon turnover in tissues of a passerine bird: Allometry, isotopic clocks, and phenotypic flexibility in organ size. Physiol. Biochem. Zool. 2009, 82, 787–797. [Google Scholar] [CrossRef] [PubMed]
  70. Phillips, D.L.; Eldridge, P.M. Estimating the timing of diet shifts using stable isotopes. Oecologia 2006, 147, 195–203. [Google Scholar] [CrossRef]
  71. Podlesak, D.W.; McWilliams, S.R.; Hatch, K.A. Stable isotopes in breath, blood, feces and feathers can indicate intra-individual changes in the diet of migratory songbirds. Oecologia 2005, 142, 501–510. [Google Scholar] [CrossRef]
  72. Bauchinger, U.; McWilliams, S.R. Extent of phenotypic flexibility during long-distance flight is determined by tissue-specific turnover rates: A new hypothesis. J. Avian Biol. 2010, 41, 603–608. [Google Scholar] [CrossRef]
  73. Bauchinger, U.; McWilliams, S.R. Tissue-specific mass changes during fasting: The protein turnover hypothesis. In Comparative Physiology of Fasting, Starvation, and Food Limitation; McCue, M.D., Ed.; Springer: Berlin/Heidelberg, Germany, 2012; p. 430. [Google Scholar]
  74. Onodera, J.; Ohsumi, Y. Autophagy is required for maintenance of amino acid levels and protein synthesis under nitrogen starvation. J. Biol. Chem. 2005, 280, 31582–31586. [Google Scholar] [CrossRef]
  75. Demeyer, D.; Fievez, V. Is the synthesis of rumen bacterial protein limited by the availability of pre-formed amino acids and/or peptides? Br. J. Nutr. 2004, 91, 175–176. [Google Scholar] [CrossRef] [PubMed] [Green Version]
  76. Mizrahy, O.; Bauchinger, U.; Aamidor, S.E.; McWilliams, S.R.; Pinshow, B. Availability of water affects renewal of tissues in migratory blackcaps during stopover. Integr. Comp. Biol. 2011, 51, 374–384. [Google Scholar] [CrossRef]
  77. Klasing, K.C. Comparative Avian Nutrition; CAB International: Wallingford, UK, 1998; ISBN 9780851992198. [Google Scholar]
  78. Stevens, L. Avian Biochemistry and Molecular Biology, 1st ed.; Cambridge University Press: Cambridge, UK, 2004; ISBN 9780521612111. [Google Scholar]
  79. Twining, C.W.; Brenna, J.T.; Hairston, N.G.; Flecker, A.S. Highly unsaturated fatty acids in nature: What we know and what we need to learn. Oikos 2016, 125, 749–760. [Google Scholar] [CrossRef]
  80. Salini, M.J.; Poppi, D.; Turchini, G.M.; Glencross, B.D. Defining the allometric relationship between size and individual fatty acid turnover in barramundi Lates calcarifer. Comp. Biochem. Physiol.-Part A Mol. Integr. Physiol. 2016, 201, 79–86. [Google Scholar] [CrossRef] [PubMed]
  81. DeNiro, M.J. Stable Isotopy and Archaeology. Am. Sci. 1987, 75, 182–191. [Google Scholar]
  82. Hobson, K.A.; Clark, R.G. Assessing avian diets using stable isotopes II: Factors influencing diet-tissue frationation. Condor 1992, 94, 189–197. [Google Scholar] [CrossRef]
  83. Ben-David, M.; Flaherty, E.A. Stable isotopes in mammalian research: A beginner’s guide. J. Mammal. 2012, 93, 312–328. [Google Scholar] [CrossRef]
  84. Nielsen, J.M.; Clare, E.L.; Hayden, B.; Brett, M.T.; Kratina, P. Diet tracing in ecology: Method comparison and selection. Methods Ecol. Evol. 2018, 9, 278–291. [Google Scholar] [CrossRef]
  85. Phillips, D.L.; Inger, R.; Bearhop, S.; Jackson, A.L.; Moore, J.W.; Parnell, A.C.; Semmens, B.X.; Ward, E.J. Best practices for use of stable isotope mixing models in food-web studies. Can. J. Zool. 2014, 835, 823–835. [Google Scholar] [CrossRef]
  86. Phillips, D.L. Converting isotope values to diet composition: The use of mixing models. J. Mammal. 2012, 93, 342–352. [Google Scholar] [CrossRef]
  87. Layman, C.A.; Araujo, M.S.; Boucek, R.; Hammerschlag-peyer, C.M.; Harrison, E.; Jud, Z.R.; Matich, P.; Rosenblatt, A.E.; Vaudo, J.J.; Yeager, L.A.; et al. Applying stable isotopes to examine food-web structure: An overview of analytical tools. Biol. Rev. 2012, 87, 545–562. [Google Scholar] [CrossRef] [PubMed]
  88. Rubenstein, D.R.; Hobson, K.A. From birds to butterflies: Animal movement patterns and stable isotopes. Trends Ecol. Evol. 2004, 19, 256–263. [Google Scholar] [CrossRef]
  89. Hammer, B.T.; Fogel, M.L.; Hoering, T.C. Stable carbon isotope ratios of fatty acids in seagrass and redhead ducks. Chem. Geol. 1998, 152, 29–41. [Google Scholar] [CrossRef]
  90. Renfrew, R.B.; Hill, J.M.; Kim, D.H.; Romanek, C.; Perlut, N.G. Winter diet of Bobolink, a long-distance migratory grassland bird, inferred from feather isotopes. Condor 2017, 119, 439–448. [Google Scholar] [CrossRef] [Green Version]
  91. Asante, C.K.; Hobson, K.A.; Bond, A.L.; Jardine, T.D. Resource partitioning among five species of waterfowl (Anas spp.) at an autumn migratory stopover: Combining stable isotope and mercury biomarkers. Can. J. Zool. 2017, 95, 279–286. [Google Scholar] [CrossRef]
  92. Rubenstein, D.R.; Chamberlain, C.P.; Holmes, R.T.; Ayres, M.P.; Waldbauer, J.R.; Graves, R.; Tuross, N.C. Linking ranges wintering breeding and a migratory of songbird using stable isotopes. Science 2002, 295, 1062–1065. [Google Scholar] [CrossRef] [PubMed]
  93. Hill, J.M.; Renfrew, R.B. Migratory patterns and connectivity of two North American grassland bird species. Ecol. Evol. 2018, 9, 1–13. [Google Scholar] [CrossRef] [PubMed]
  94. Thomson, J.A.; Whitman, E.R.; Garcia-Rojas, M.I.; Bellgrove, A.; Ekins, M.; Hays, G.C.; Heithaus, M.R. Individual specialization in a migratory grazer reflects long-term diet selectivity on a foraging ground: Implications for isotope-based tracking. Oecologia 2018, 188, 429–439. [Google Scholar] [CrossRef] [PubMed]
  95. Steenweg, R.J.; Crossin, G.T.; Kyser, T.K.; Merkel, F.R.; Gilchrist, H.G.; Hennin, H.L.; Robertson, G.J.; Provencher, J.F.; Mills Flemming, J.; Love, O.P. Stable isotopes can be used to infer the overwintering locations of prebreeding marine birds in the Canadian Arctic. Ecol. Evol. 2017, 1–11. [Google Scholar] [CrossRef]
  96. Wang, S.W.; Budge, S.M.; Gradinger, R.R.; Iken, K.; Wooller, M.J. Fatty acid and stable isotope characteristics of sea ice and pelagic particulate organic matter in the Bering Sea: Tools for estimating sea ice algal contribution to Arctic food web production. Oecologia 2014, 174, 699–712. [Google Scholar] [CrossRef]
  97. Graham, C.; Oxtoby, L.; Wang, S.W.; Budge, S.M.; Wooller, M.J. Sourcing fatty acids to juvenile polar cod (Boreogadus saida) in the Beaufort Sea using compound-specific stable carbon isotope analyses. Polar Biol. 2014, 37, 697–705. [Google Scholar] [CrossRef]
  98. Wang, S.W.; Budge, S.M.; Iken, K.; Gradinger, R.R.; Springer, A.M.; Wooller, M.J. Importance of sympagic production to Bering Sea zooplankton as revealed from fatty acid-carbon stable isotope analyses. Mar. Ecol. Prog. Ser. 2015, 518, 31–50. [Google Scholar] [CrossRef]
  99. Careddu, G.; Letizia, M.; Calizza, E.; Carlino, P.; Bentivoglio, F.; Orlandi, L.; Rossi, L. Effects of terrestrial input on macrobenthic food webs of coastal sea are detected by stable isotope analysis in Gaeta Gulf. Estuar. Coast. Shelf Sci. 2015, 154, 158–168. [Google Scholar] [CrossRef]
  100. Larsen, T.; Ventura, M.; Andersen, N.; Brien, D.M.O.; Piatkowski, U.; Mccarthy, M.D. Tracing carbon sources through aquatic and terrestrial food webs using amino acid stable isotope fingerprinting. PLoS ONE 2013, 8, e73441. [Google Scholar] [CrossRef]
  101. Dalerum, F.; Angerbjorn, A. Resolving temporal variation in vertebrate diets using naturally occurring stable isotopes. Oecologia 2005, 144, 647–658. [Google Scholar] [CrossRef]
  102. Mizutani, H.; Fukuda, M.; Kabaya, Y. 13C and 15 N Enrichment factors of feathers of 11 species of adult birds. Ecology 1992, 73, 1391–1395. [Google Scholar] [CrossRef]
  103. Marques, F.P.; Cardoso, L.G.; Haimovici, M.; Bugoni, L. Trophic ecology of Magellanic penguins (Spheniscus magellanicus) during the non-breeding period. Estuar. Coast. Shelf Sci. 2018, 210, 109–122. [Google Scholar] [CrossRef]
  104. Gómez, C.; Larsen, T.; Popp, B.; Hobson, K.A.; Cadena, C.D. Assessing seasonal changes in animal diets with stable—isotope analysis of amino acids: A migratory boreal songbird switches diet over its annual cycle. Oecologia 2018, 187, 1–13. [Google Scholar] [CrossRef] [PubMed]
  105. Guidotti, S.; Jansen, H.G. Doubly Labelled Water analysis: Preparation, memory correction, calibration and quality assurance for d2H and d18O measurements over four orders of magnitudes. Rapid Commun. Mass Spectrom. 2013, 27, 1055–1066. [Google Scholar] [CrossRef]
  106. Gretebeck, R.J.; Schoeller, D.A.; Socki, R.A.; Davis-street, J.; Gibson, E.K.; Schulz, L.O.; Lane, H.W.; Randall, J.; Schoeller, D.A.; Rick, A.; et al. Adaptation of the doubly labeled water method for subjects consuming isotopically enriched water. J. Appl. Physiol. 1997, 82, 563–570. [Google Scholar] [CrossRef]
  107. Milakovic, B.; Parker, K.L. Quantifying carnivory by grizzly bears in a multi-ungulate system. J. Wildl. Manag. 2013, 77, 39–47. [Google Scholar] [CrossRef]
  108. Halley, D.J.; Minagawa, M.; Nieminen, M.; Gaare, E. Diet: Tissue stable isotope fractionation of carbon and nitrogen in blood plasma and whole blood of male reindeer Rangifer tarandus. Polar Biol. 2010, 33, 1303–1309. [Google Scholar] [CrossRef]
  109. Heady, W.N.; Moore, J.W. Tissue turnover and stable isotope clocks to quantify resource shifts in anadromous rainbow trout. Oecologia 2013, 172, 21–34. [Google Scholar] [CrossRef] [PubMed]
  110. Oppel, S.; Powell, A.N. Carbon isotope turnover in blood as a measure of arrival time in migratory birds using isotopically distinct environments. J. Ornithol. 2010, 151, 123–131. [Google Scholar] [CrossRef]
  111. Mohan, J.A.; Smith, S.D.; Connelly, T.L.; Attwood, E.T.; McClelland, J.W.; Herzka, S.Z.; Walther, B.D. Tissue-specific isotope turnover and discrimination factors are affected by diet quality and lipid content in an omnivorous consumer. J. Exp. Mar. Bio. Ecol. 2016, 479, 35–45. [Google Scholar] [CrossRef]
  112. Moore, J.W.; Gordon, J.; Carr-Harris, C.; Gottesfeld, A.S.; Wilson, S.M.; Russell, J.H. Assessing estuaries as stopover habitats for juvenile pacific salmon. Mar. Ecol. Prog. Ser. 2016, 559, 201–215. [Google Scholar] [CrossRef]
  113. Catry, T.; Lourenço, P.M.; Granadeiro, J.P. Quantifying population size of migrant birds at stopover sites: Combining count data with stopover length estimated from stable isotope analysis. Methods Ecol. Evol. 2018, 9, 502–512. [Google Scholar] [CrossRef]
  114. Boggie, M.A.; Carleton, S.A.; Collins, D.P.; Vradenburg, J.; Sroka, C.J. Using stable isotopes to estimate reliance on agricultural food subsidies and migration timing for a migratory bird. Ecosphere 2018, 9. [Google Scholar] [CrossRef]
  115. Rennie, M.J. An introduction to the use of tracers in nutrition and metabolism. Proc. Nutr. Soc. 1999, 58, 935–944. [Google Scholar] [CrossRef] [PubMed] [Green Version]
  116. Millward, D.J.; Smith, K. The application of stable-isotope tracers to study human musculoskeletal protein turnover: A tale of bag filling and bag enlargement. J. Physiol. 2019, 597, 1235–1249. [Google Scholar] [CrossRef]
  117. Hobson, K.A.; Alisauskas, R.T.; Clark, R.G. Stable-nitrogen isotope enrichment in avian tissues due to fasting and nutritional stress: Implications for isotopic analyses of diet. Condor 1993, 95, 388–394. [Google Scholar] [CrossRef]
  118. Deschner, T.; Fuller, B.T.; Oelze, V.M.; Boesch, C.; Hublin, J.; Mundry, R.; Richards, M.P.; Ortmann, S.; Hohmann, G. Identification of energy consumption and nutritional stress by isotopic and elemental analysis of urine in bonobos (Pan paniscus). Rapid Commun. Mass Spectrom. 2012, 26, 69–77. [Google Scholar] [CrossRef] [PubMed]
  119. Neuberger, F.M.; Jopp, E.; Graw, M.; Puschel, K.; Grupe, G. Signs of malnutrition and starvation—Reconstruction of nutritional life histories by serial isotopic analyses of hair. Forensic Sci. Int. 2013, 226, 22–32. [Google Scholar] [CrossRef] [PubMed]
  120. Reitsema, L.J. Beyond diet reconstruction: Stable isotope applications to human physiology, health, and nutrition. Am. J. Hum. Biol. 2013, 25, 445–456. [Google Scholar] [CrossRef] [PubMed]
  121. Reitsema, L.J. Laboratory and field methods for stable isotope analysis in human biology. Am. J. Hum. Biol. 2015, 27, 593–604. [Google Scholar] [CrossRef] [PubMed]
  122. Hatch, K.A.; Crawford, M.A.; Kunz, A.W.; Thomsen, S.R.; Eggett, D.L.; Nelson, S.T.; Roeder, B.L. An objective means of diagnosing anorexia nervosa and bulimia nervosa using 15N/14N and 13C/12C ratios in hair. Rapid Commun. Mass Spectrom. 2006, 20, 3367–3373. [Google Scholar] [CrossRef] [PubMed]
  123. Hatch, K.A.; Sacksteder, K.A.; Treichel, I.W.; Cook, M.E.; Porter, W.P. Early detection of catabolic state via change in 13C/12C ratios of blood proteins. Biochem. Biophys. Res. Commun. 1995, 212, 719–726. [Google Scholar] [CrossRef]
  124. Gorokhova, E. Individual growth as a non-dietary determinant of the isotopic niche metrics. Methods Ecol. Evol. 2018, 9, 269–277. [Google Scholar] [CrossRef]
  125. Karlson, A.M.L.; Reutgard, M.; Garbaras, A.; Gorokhova, E. Isotopic niche reflects stress-induced variability in physiological status. R. Soc. Open Sci. 2018, 5, 1–18. [Google Scholar] [CrossRef]
  126. Guilford, T.; Åkesson, S.; Gagliardo, A.; Holland, R.A.; Mouritsen, H.; Muheim, R.; Wiltschko, R.; Wiltschko, W.; Bingman, V.P. Migratory navigation in birds: New opportunities in an era of fast-developing tracking technology. J. Exp. Biol. 2011, 214, 3705–3712. [Google Scholar] [CrossRef]
  127. Alerstam, T. Optimal bird migration revisited. J. Ornithol. 2011, 152. [Google Scholar] [CrossRef]
Figure 1. The process of estimating the turnover of tissues and specific compounds in animals using stable isotopes. Commonly used isotopic labels (A) include heavy isotopes of hydrogen, carbon, nitrogen, oxygen, and sulfur, which are then applied to different compounds of interest (B). The enrichment of the labeled compound(s) in animal tissues is then manipulated (C) with either a shift in diet or the administration of a dose of uniquely labeled molecules, and then tissue samples (D) are collected over time following the manipulation. Tissue sampling is typically concentrated in the period immediately following the manipulation, when changes in tissue isotope enrichment are most rapid. Isotopic enrichment of tissues is then measured by mass spectrometry (E), which separates isotopes by mass and may be preceded by a gas chromatography step to distinguish between compounds of similar class. Finally, the rate of change in isotopic enrichment is estimated (F), typically by fitting a first-order kinetic model to the data (formula shown). Models of turnover are illustrated with a comparison of the carbon turnover of neutral and polar lipids in zebra finch flight muscle from Carter et al. [26]. Please see the text for more details.
Diversity 11 00084 g001
Figure 2. Differences in carbon turnover among zebra finch tissues and their application to isotopic clocks. The 13C half-lives of different tissues (A) are widely distributed over the course of a month, with 50% of liver phospholipids replaced in less than two days and 50% of leg muscle protein replaced in twenty days. Differences in turnover among tissues leads, in turn, to differences in the amount of time required for tissue isotopic enrichment to reach equilibrium with current diet (B). Duration of time required for ca. 95% of the carbon to be replaced (and hence be effectively in equilibrium with current diet) can be roughly estimated as 4.3 half-life in days (e.g., small intestine = 4.3 × 6 days = 26 days). Inset (C) depicts an isotopic clock using liver and pectoral muscle turnover rates to estimate the timing of a hypothetical dietary shift from δ13C = −16.3‰ to δ13C = −26.3‰. For example, a measured value of δ13C = -20.3‰ for both liver and pectoral muscles would indicate that a diet shift occurred 8–10 days ago. Data are from [26], [69], and unpublished data (Carter).
Diversity 11 00084 g002
Figure 3. Schematic illustrations of the influence of turnover on nutritional state and isotopic reconstructions of nutritional status. The balance between whole-body catabolic turnover rate (summed from individual tissue turnover rates denoted by tissue icons) and the rate of dietary intake, along with de novo synthesis, can be used to assess an individual’s nutritional status (A), with low intake leading to nutritional stress and high intake leading to a nutritional surplus. Differences in turnover rates among tissues lead to differing patterns of isotopic signatures in response to diet restriction (BD). Dotted lines in each panel are estimates of δ13C of tissues if no diet restriction occurred and birds were in complete equilibrium with diet. Pictured are hypothetical differences in zebra finch tissue δ13C following four weeks of diet restriction (B), a subsequent two weeks of ad libitum feeding (C), and a final week of diet restriction (D), assuming 13C enrichment during diet restriction. Relative differences in δ13C between tissues in the same individual(s) are indicative of diet restriction and its timing, given certain assumptions about the equilibrium with diet.
Diversity 11 00084 g003

