A Surfeit of Studies: What Have We Learned from All the Box Turtle (Terrapene carolina and T. ornata) Home Range Studies?

1
Department of Biology, Kutztown University of Pennsylvania, Kutztown, PA 19530, USA
2
Department of Biology, Hofstra University, Hempstead, NY 11549, USA
3
Academic Services, Brandeis University, Waltham, MA 02454-9110, USA
*
Author to whom correspondence should be addressed.
Diversity 2019, 11(5), 68; https://doi.org/10.3390/d11050068
Submission received: 31 March 2019
/
Revised: 18 April 2019
/
Accepted: 19 April 2019
/
Published: 28 April 2019
(This article belongs to the Special Issue Advances in the Biology and Conservation of Turtles)
Abstract
:Home range (HR) studies are a particularly common approach to investigations of animal habitat use, resource availability, and response to management manipulation such as relocations. Terrapene carolina (Eastern box turtle) and its sister taxon T. ornata (Ornate box turtle) are especially popular subjects of HR studies because they are relatively easily tracked. Terrapene HR studies have revealed a wide variation in HR sizes within and between populations, due to factors such as differences in ecoregion and analytical approach (e.g., minimum convex polygons, kernel analysis, bivariate normal, multivariate Ornstein–Uhlenbeck stochastic process, harmonic means). We performed a meta-analysis of the available literature, including unpublished work to avoid bias due to under-publication, to explore the causes for variation in HR size. We found 19 studies reporting T. carolina HR sizes and seven studies reporting T. ornata HR sizes; the resulting meta-analysis revealed patterns that are not visible in the individual studies. We found important differences between the species: female T. ornata had smaller HRs than males, whereas the opposite is true for T. carolina, and T. ornata HRs were influenced by ecoregion, while T. carolina HRs were not similarly influenced. Not surprisingly, we found that choice of analysis technique affected HR estimate; analyses using ellipses resulted in larger HR estimates than all the other techniques, while kernels were smaller than minimum convex polygons. Although not indicated by individual studies, our meta-analysis showed that the HRs of relocated T. carolina females were significantly larger than those of non-relocated females. Although the number of individual turtles in studies varied from three to 25, the sample size did not significantly affect HR size.
1. Introduction
Home range (HR) studies have a long, complex, and contentious history, in part because the concept of home range is attractive yet ambiguous. One of the earliest HR studies defined HR as “the area an individual uses to carry out its life functions” (e.g., feeding, mating, overwintering, etc.) [1]. This broad definition, along with the lack of a generally accepted subsequent narrowing of this definition, has led to a wide range of uses for the term HR, which is reflected in the varied methods that are used for calculating home ranges. For example, Kernohan et al. [2] described HR as an area where an individual is most likely to be present during a given period of time, which is a probability density also referred to as the utilization distribution (UD) [3]. Some studies attempt to include all the normal activities that subject animals perform in an annual cycle (e.g., [4,5]), while others explicitly integrate activities such as nesting forays [6].
HR studies necessarily involve numerous decisions regarding what exactly will be measured. The duration of animal movement studies typically span only a small portion of the individual’s life, and HR may change in size and location from season to season. That is, an individual may use different areas, each year, as the locations of available resources change. Animals that live in two different geographic locations (e.g., migratory birds) are often considered to have at least two “ranges”, and each one is very important to their survival and reproduction.
The lack of a clear definition, differences in what is actually measured, the variety of measurements and analytical techniques, and numerous other differences between studies makes comparisons of HRs between and among studies difficult. Most reviews (e.g., [7,8]) simply list HR studies and draw non-quantitative conclusions about the potential impacts of different factors, such as sampling methods, habitat quality, and age/sex of individuals tracked, on HR. However, a failure to decipher what can be learned from past research can result in new studies that simply repeat previous work, a failure to detect large scale patterns, and little progress overall.
Box turtles (Terrapene sp.) are appealing targets for such an analysis because they have been subjects of a large number of both published and unpublished HR studies. Their popularity as subjects of HR studies comes in part because (1) they are of conservation concern in much of their range (reviewed by Kimble et al. [9]), (2) they are conversely relatively common elsewhere, (3) they are terrestrial and have fairly small ranges, and thus (4) they are relatively easy to track using a variety of techniques (reviewed below). Box turtle HR studies include some of the earliest scientific studies of animal movements (e.g., [10,11]) and these predate the use of radio telemetry—which is commonly used today—by decades.
We chose to study Terrapene carolina (Eastern Box Turtle) and T. ornata (Western box turtle) because despite broadly similar habitat requirements, together they span a wide range of habitats, they are congeneric taxa—thus reducing phylogenetic conflicts—and because few HR studies have been conducted on the other members of the genus. Both are primarily terrestrial and omnivorous species, with highly domed shells and little sexual dimorphism. They are similar in size; T. carolina typically range from 11.5 to 15.2 cm in length and T. ornata are typically 10.0 to 12.5-cm long [12]. T. carolina is primarily a woodland species whose habitat ranges through much of the eastern United States from Maine to Florida and west into the eastern Great Plains. T. ornata typically inhabits more xeric, sandy soil prairie grasslands of the Great Plains.
Previous studies measuring Terrapene HRs have reported wide variation in HR sizes within and between populations, possibly due to factors such as differences in habitat, demography, and the life history of individuals being tracked. The HR of the males of some terrestrial turtle species are typically larger than females [13,14], presumably because they are seeking females. In contrast, female HR of some species may be larger (e.g., [15]), which is perhaps because of extended excursions for oviposition.
In the past, animal locations for Terrapene HR studies sometimes used the results of targeted searches for marked individuals, sometimes involving dogs or string trailers. These were mapped using compasses and measurements to mapped landmarks; the early radio telemetry studies predate high-accuracy portable Global Positioning System units. Some studies used a variety of these techniques. Terrapene HR studies in recent decades have nearly always used radio telemetry or GPS technology, permitting the collection of hundreds or thousands of locations. We wanted to test whether tracking technique affected HR size estimation.
Terrapene HR have been analyzed using a multitude of HR estimators, including minimum convex polygons (MCP), kernel analysis, bivariate normal, multivariate Ornstein–Uhlenbeck stochastic process (M.O.U), and harmonic means. They also have different sample sizes, all of which may contribute to differences in HR. Similar to studies of other herpetofauna, HR data on box turtles are often characterized by low sample sizes and high spatial autocorrelation in locations of repeated, heavy use, such as basking sites [16,17]. Harmonic mean and kernel density estimates of HR are especially sensitive to data with low sample size and autocorrelation, often inflating the HR estimate as compared to minimum convex polygon techniques [16,18,19,20]. However, MCP estimates lack information on centers of activity that other estimators provide, including kernel density, harmonic mean, and 95% ellipses.
Dodd [7] listed 10 T. carolina HR studies and nine T. ornata HR studies, but there has never been a systematic review, including all the studies with HR data, to quantitatively compare what is known about HR size for these well-studied species. We conducted a meta-analysis of data (Table S1) from these papers to quantify the effect of sex, latitude, sample size, tracking method, analysis method, and habitat on T. carolina and T. ornata HR size. We also considered the effects caused by relocation, which is a conservation technique that is often used with Terrapene.
2. Method—Meta-Analysis Outline
In 2014, we used a variety of approaches to locate studies that reported HR for either T. carolina or T. ornata. We used the terms and various combinations of the terms “terrapene”, “carolina”, “ornata”, “home range”, and “homerange” using Google Scholar. We obtained all papers cited as containing home range data from Dodd [7]. We also searched for PhD dissertations and master’s theses in the ProQuest Dissertations and Theses database, and searched for published papers that resulted from theses and dissertations. Where theses and dissertations were not published, we used the original studies. We examined the literature cited sections of all the studies that we found for additional studies.
We selected all the studies that reported HR for either adult T. carolina or adult T. ornata and provided a mean, variance, and sample size, or the data for which these could be calculated. For two studies [21,22], we emailed authors to clarify and supplement data. We used mean estimates of home range data as reported, or we calculated these from individual data as reported. Where other forms of variance were reported (e.g., standard error), we converted them to standard deviation for analysis. Study sites were found on Google Maps, and the GPS coordinates for each site were plotted in ArcMap. We used the Level II Ecoregion shapefiles (EPA.gov) [23] to identify the ecoregion for each study. Sex was used as reported: “male”, “female”, or “mixed” where sex specific data was not specified. We attempted to collect the appropriate data to test for the effect of length of study and number of locations/individual.
We also noted whether turtle locations were determined through radio telemetry, visual search, or string trailers. However, all the studies with appropriate data used radio telemetry, so this factor was left out of the analysis. We placed all the HR studies into one of four categories based on analytical technique: kernel (95% kernel), minimum convex polygon (minimum convex polygon, 95% minimum convex polygon, minimum area, minimum polygon, or convex polygon), ellipse (95% bivariate normal or 95% ellipse), and harmonic mean (harmonic mean or 95% harmonic mean). If a paper reported results for more than one gender, location, or analytical technique, we included all the HR estimates and controlled for non-independence by including a random term (Author/paper ID) in the model.
Meta-Analysis
All the calculations and statistical analyses were executed using functions included in the metafor package (version 2.0-0; [24]) of the R open-source software environment (version 3.4.1; [25]) within RStudio (version 1.0.153; [26]). We provide all the data, codes, and output used in this experiment as digital appendices [see Supporting Information]. We used the raw means, standard deviations, and sample sizes of Terrapene home range estimates that were extracted from the literature to calculate the sampling variance needed for weighting the outcomes in the meta-analysis. We used the measure = “MN” argument within the escalc() function for this purpose. Unlike many traditional meta-analytical effect sizes such as Hedge’s d or log odds, the raw mean home range (ha) is retained as the effect size response rather than a zero-centered and/or transformed response.
Using restricted maximum likelihood (REML) estimation in the function rma.mv(), we ran multi-level random-effects (MLRE) models to understand relationships between Terrapene HR sizes and intrinsic or extrinsic factors. Many factors (e.g., population genetics, researcher error, and climate) are more likely to be similar within than across experiments and locations. MLRE-type meta-analytical models are specifically designed to account for non-independence among effect sizes by allowing for the addition of a random term in the model [24,27]. We included “Author” as a random term in each model to account for the potential lack of independence among effect sizes derived from the same article and/or the same experimental infrastructure. Where appropriate, we used the glht() function in the multicomp package (version 1.4-8; [28]) to perform post hoc multiple comparisons using the Holm–Bonferroni method. Heterogeneity among effect sizes within datasets was assessed using the Q-statistic. Large Q values suggest that differences between effect sizes within a dataset do not estimate a common population mean, and thus could vary for reasons other than sampling error (e.g., due to some environmental factor; [29]). We tested for the significance of Q using a χ2 distribution.
We tested for publication bias using Egger’s regression test [30,31] by modifying the MLRE models to include the standard error of the effect sizes as a moderator. When the intercept of this regression test significantly deviates from zero, the overall relationship between the precision and size of studies included in the dataset is considered asymmetrical, and therefore biased [31]. We considered analyses to be biased if the intercept differed from zero at p = 0.10 (as in [30]).
Parameter estimates in meta-analyses, similar to other regression-based tests, are sensitive to outliers and influential data points. However, diagnostic tests for identifying—and rules for excluding—these types of cases are still evolving, particularly for multivariate/multi-level meta-analytical models [32]. We evaluated the sensitivity of our analyses as in Habeck and Schultz (2015) [33] by comparing fitted models with and without effect sizes that we defined as influential outliers. We considered influential outliers to be effect sizes with hat values (i.e., diagonal elements of the hat matrix) greater than twice the average hat value (i.e., influential) and standardized residual values exceeding 3.0 (i.e., outliers; [32,34,35]). Finally, we used the function lme in the package nlme (version 3.1-131.1; [36]) to test whether the sample size of experiments influenced Terrapene HR sizes.
3. Results
3.1. Data Set
We found 23 publications that reported T. carolina HR estimates, and eight publications that reported T. ornata HR estimates. Five of these did not report sufficiently detailed HR data. We extracted 72 Terrapene HR estimates (T. carolina = 50, T. ornata = 22) from the remaining 26 publications ([21,22,37,38,39,40,41,42,43,44,45,46,47,48,49,50,51,52,53,54,55,56,57,58,59,60]). The original experiments were conducted within 10 Level II ecoregions as defined by Omernik [61] and the U.S. Environmental Protection Agency. Only 42 (58.3%) of the HR estimates were from published studies, 22 (30.6%) were from unpublished undergraduate and master’s theses or PhD dissertations, and eight (11.1%) were from unpublished government agency reports. All the studies that met our criteria for HR mean, variance, and sample size, or the data for which these could be calculated, used radio telemetry as their tracking technique. We were unable to collect meaningful data to test for the effect of length of study or number of locations/individual because very few publications reported these data in sufficient detail.
3.2. Analysis
Previously reported T. carolina HR sizes ranged from 0.205 ha (males only, [54]) to 28.370 ha (mixed sexes, [50]), which is a factor difference of 138. The overall mean of the 50 studies, including those in which turtle sex was identified and those in which sex was not identified, was 7.54 ha (95% CI = 5.86 to 9.21 ha). Previously reported T. ornata HR sizes ranged from 0.825 ha (females only, [49]) to 19.097 ha (females only, [40]), which is a factor difference of 23. The overall mean of the 22 reports included was 4.94 ha (95% CI = 2.69 to 7.19 ha).
Home range size did not differ between T. carolina and T. ornata (Table 1). However, within species, home range size differed between males and females (Table 1). For T. carolina, the female home range was 27% larger than that of the males. For T. ornata, the female home range was 6% smaller than that of the males.
For T. carolina, HR size did not differ among ecoregions (Table 2). The HR size of T. ornata within the west-central semi-arid prairies and western Sierra Madre piedmont ecoregions differed from all other ecoregions (Table 3). HR size differed among home range estimator techniques. HR estimates calculated using the ellipse technique were larger than those calculated using all other techniques, and MCP estimates differed from kernel estimates (Table 4).
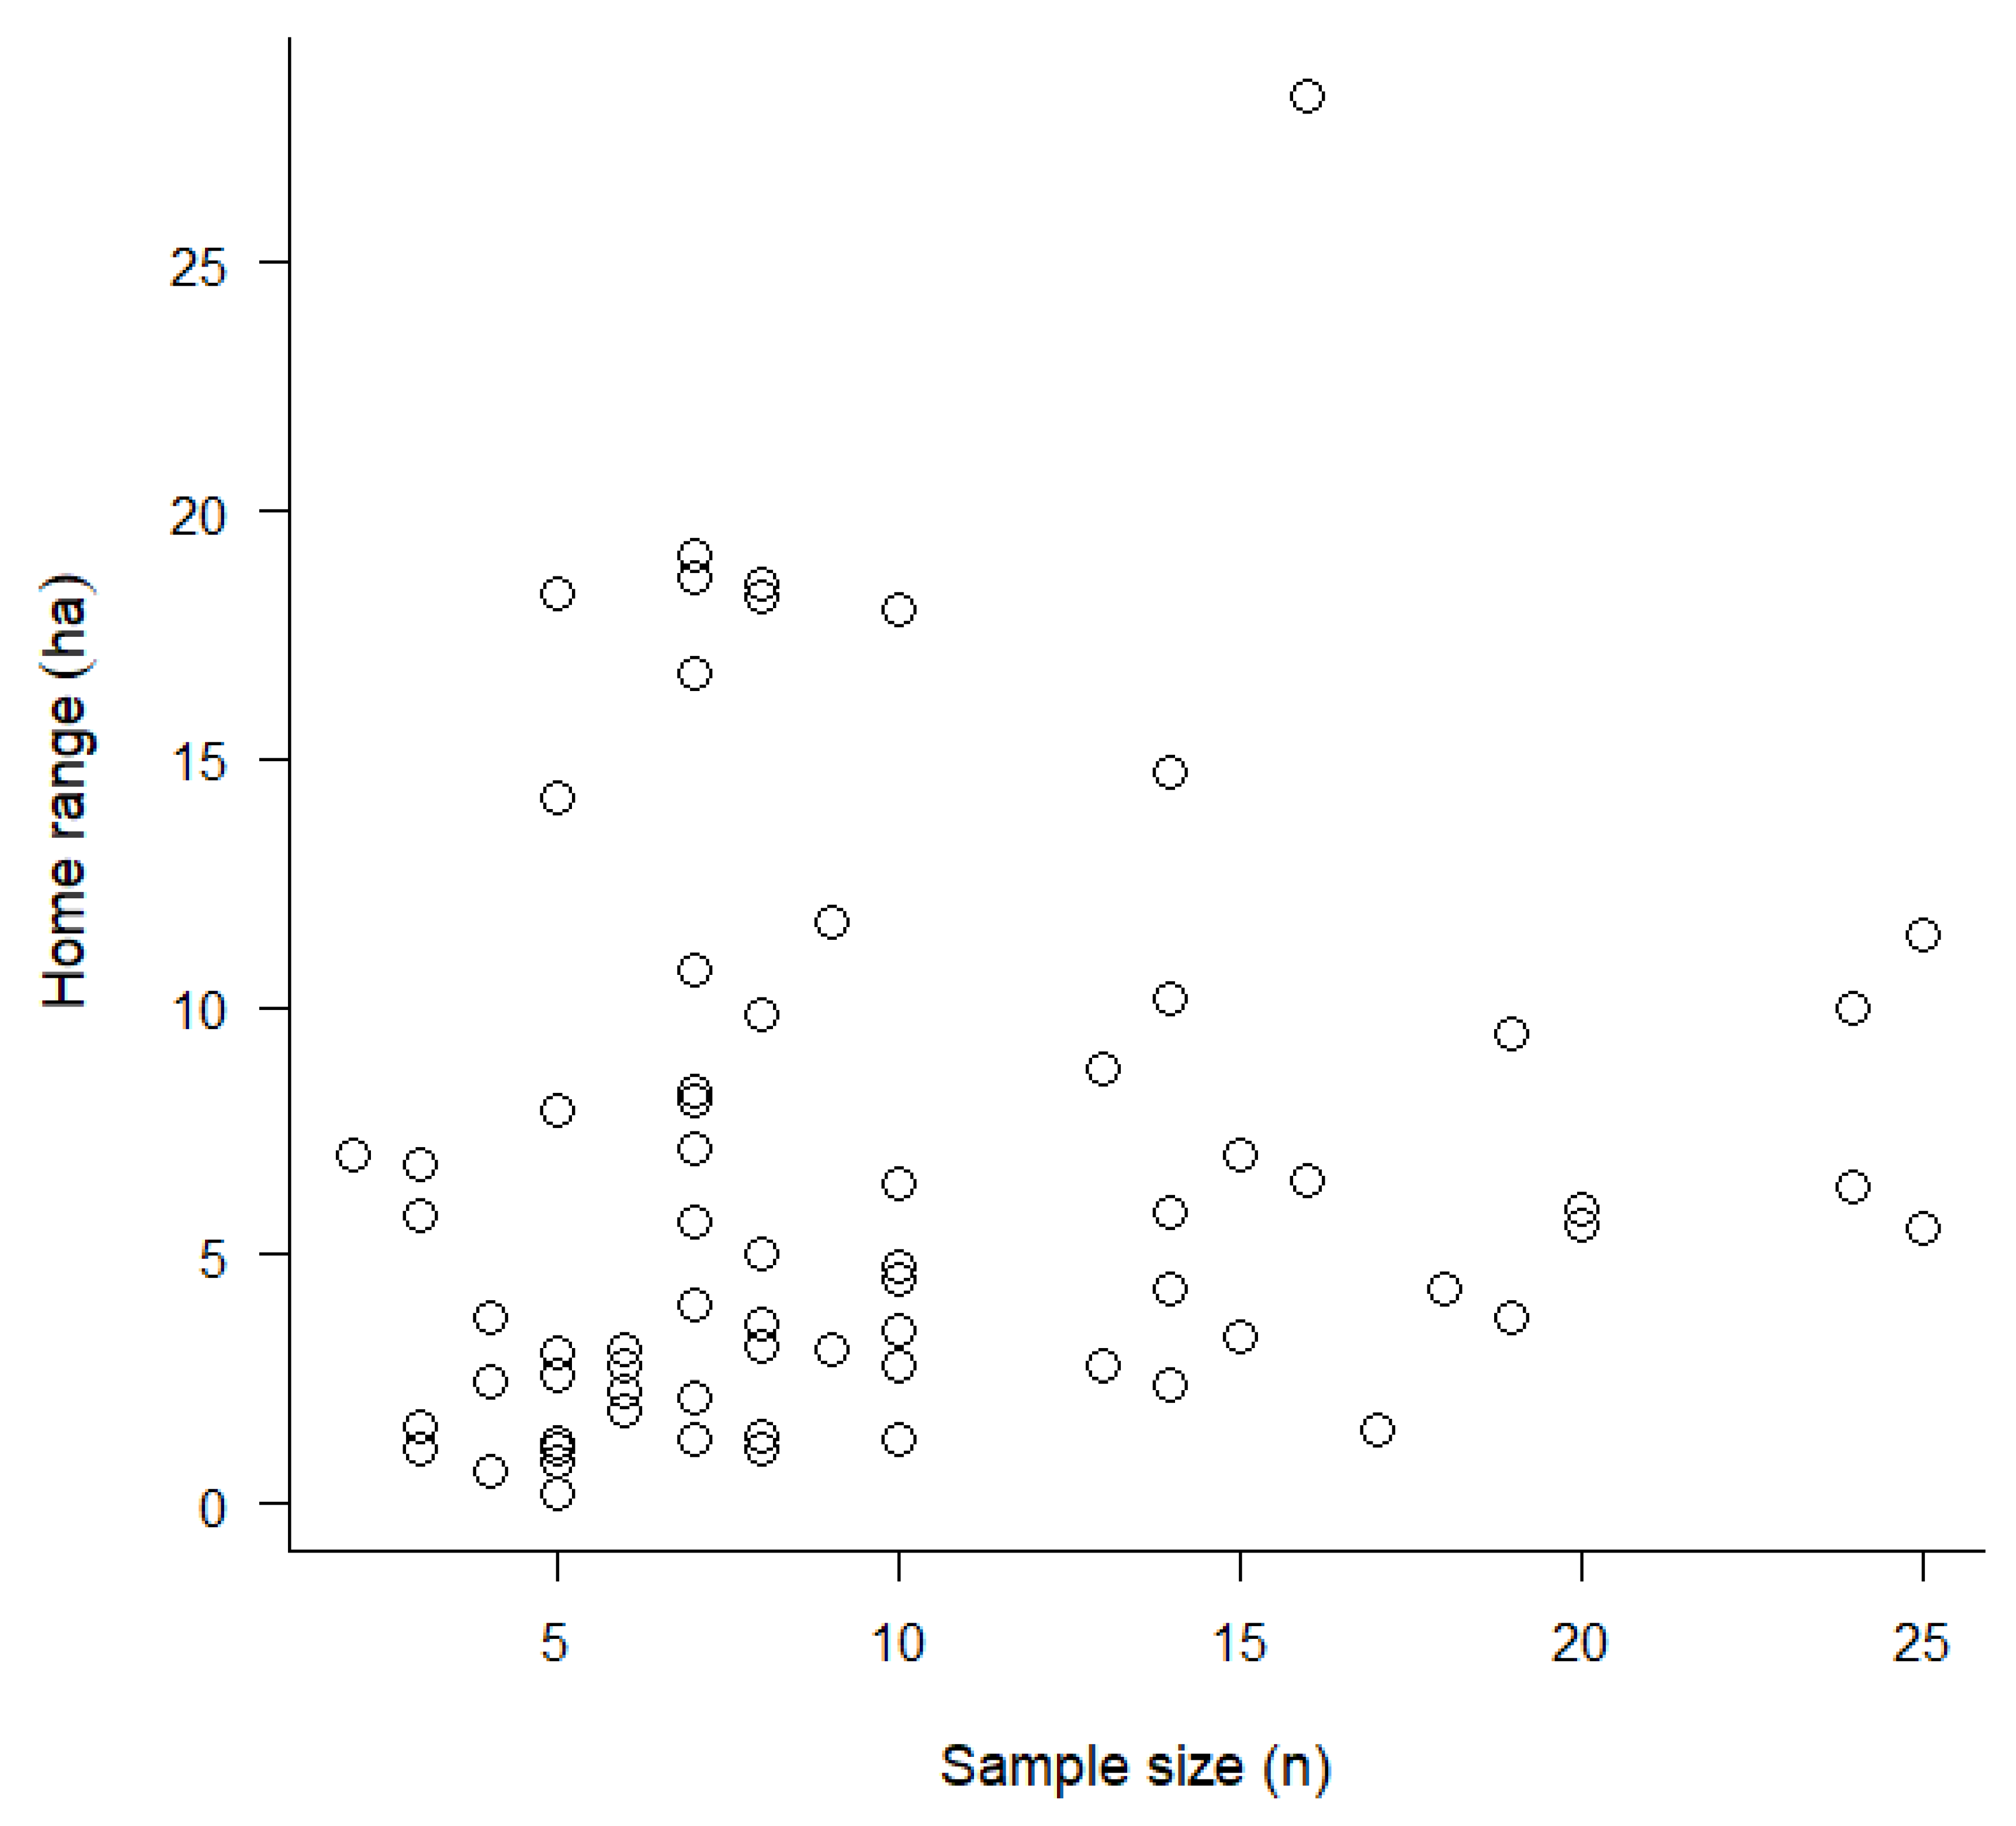
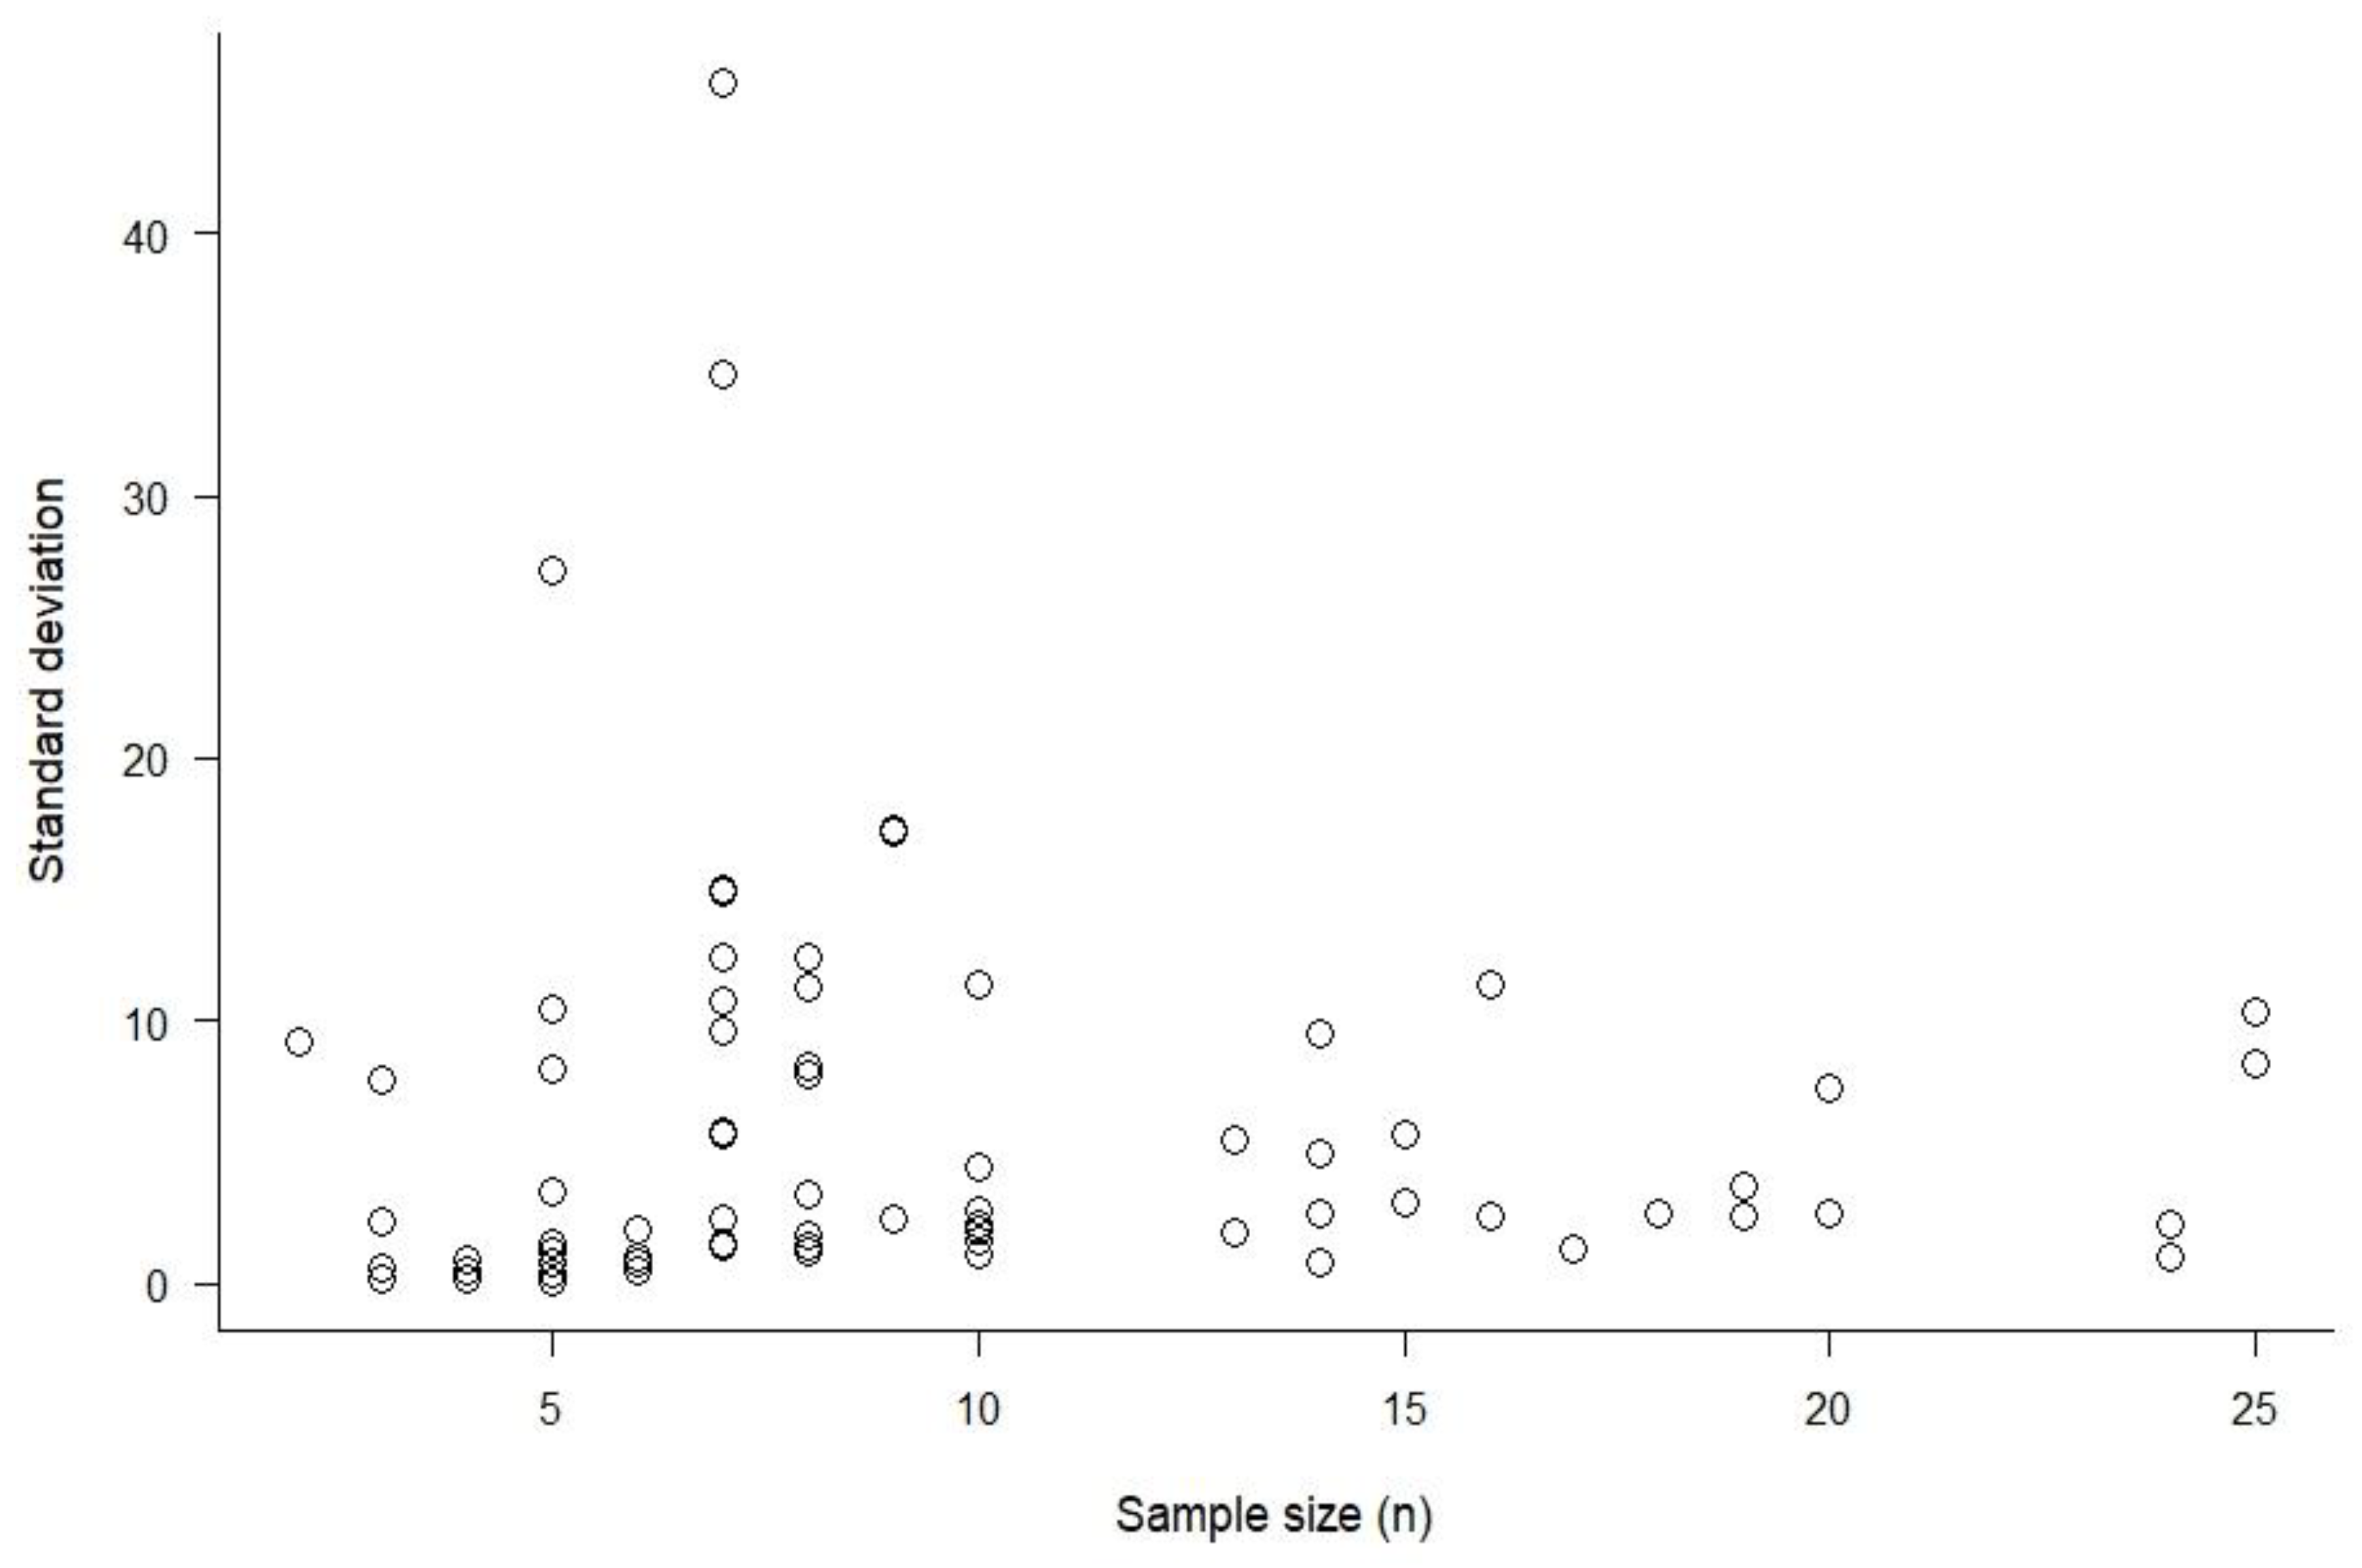
The number of turtles in studies varied from three to 25 individuals (mean = 9.85, s.d. = 7.54). The sample size in experiments did not influence either Terrapene HR size (t = 0.54, df = 45, p = 0.59, Figure 1) or the s.d. of HR (β = −0.061, t = −0.316, df = 45, p = 0.754, Figure 2).
Relocation status influenced HR size in T. carolina, and there were no appropriate data for T. ornata. Individuals that were relocated had a HR that was on average 50% larger than individuals that were not relocated (Table 5).
4. Discussion
4.1. HR of T. Carolina and T. Ornata
In agreement with our expectations, HR did not differ between T. carolina and T. ornata, which was due both to their similar mean HR values and to a wide HR variation within both species (Table 2). The sister taxa are ecologically similar, although adult T. carolina are typically slightly larger than T. ornata [12]. The species have broad differences in typical habitat: T. carolina primarily inhabits woodlands, and T. ornata primarily inhabits prairies. However, both are habitat generalists and broadly omnivorous. They are sympatric over eastern Texas and Oklahoma and parts of Missouri and Illinois, where they can be found in the same microhabitat and sometimes hybridize [62,63,64].
4.2. Do the HRs of Male and Female Terrapene Differ in size?
Males have larger HRs than females in many species of terrestrial turtles ([13], Lawson 2006); in some species, the female HR is larger (e.g., [15]), and in some species, there is no difference [65]. In contrast, some T. carolina HR studies have found that females have larger HRs than males (e.g., [54]), while others have found that males have larger HRs than females (e.g., [49]). Dodd [7] reviewed Terrapene HR studies and concluded that male and female Terrapene sp. HRs are “similar in size”. However, we found that within species, the HR size differed significantly between males and females (Table 2). In T. carolina, the average female HR was 27% larger than that of males, while for T. ornata, the average female home range was 6% smaller than that of males. This surprising difference between these closely related species has not been previously detected, and should be investigated where they are in sympatry and allopatry.
4.3. Is HR Influenced by Ecoregion?
Numerous researchers have found that the HRs of some species are influenced by resource availability (e.g., olive baboon (Papio anubis): Barton et al. [66]; grizzly bears (Ursus arctos): Edwards et al. 2013 [67]; African striped mice (Rhabdomys pumilio): Schoepf et al. 2015 [68]). Dodd [7] suggested that local resource levels and habitat structure might influence Terrapene HR. These data were not available to us, so we used ecoregions as crude proxies. While we found no significant difference in T. carolina HR among the five ecoregions they inhabit (Table 3), we note that the average T. carolina HR in the central USA plains ecoregion is 3.6 times larger than that of the ecoregion with the next highest average T. carolina HR. However, this unusually high HR is because of a single T. carolina HR study in the central USA plains ecoregion [58]. In contrast, the average T. carolina HR in the other four ecoregions was very similar.
In contrast, the average T. ornata HR size in the west-central semi-arid prairies and Western Sierra Madre piedmont ecoregions was significantly larger than that in the other four ecoregions for which we had data (Table 4). The mean HR for the west-central semi-arid prairies ecoregion was exceptionally large, 2.7 times larger than that of the western Sierra Madre piedmont ecoregion. This again was the result of a single HR study from that ecoregion [56].
4.4. How Does Choice of Analysis Technique Affect HR Estimate?
The analytical approaches that are used for HR size estimation have gone through numerous changes since Burt [1]. There has been vigorous discussion over the optimal approach to the analysis of individual location points (e.g., [20,69,70,71]). Since Terrapene have been the subjects of numerous HR studies since the 1920s, Terrapene HRs have been estimated using a wide variety of techniques. We combined Terrapene HR studies into four major categories (kernel, minimum convex polygon, ellipse, and harmonic mean), and found that HR studies that used ellipse techniques had significantly larger HRs than those that used any other techniques, and further, that MCP estimates indicated, on average, significantly larger HRs than kernel estimates (Table 5). These results show that studies using different HR analysis techniques cannot be combined in a single analysis without adjusting for these differences.
4.5. Does Sample Size Affect HR Size Estimation?
We hypothesized that sample size (number of turtles) would affect the HR size and the standard deviation of HR size, because small samples sizes can increase the relative effect of individuals with unusual HR. We found that differences in sample sizes among experiments did not influence mean HR size (Figure 1) or the standard deviation of HR sizes (Figure 2). This suggests that typical sample sizes (mean = 7.85 individuals) for Terrapene HR studies are adequate. We were unable to test for the effect of length of study and number of locations/individual because these data were rarely reported. This is unfortunate because, despite the relative ease of Terrapene HR studies, resource use could be optimized if these aspects of study design were better understood.
4.6. Do Relocated Terrapene Have Larger HR?
Studies of relocated turtles often attempt to test whether they have a HR size that is different from non-relocated turtles (e.g., [51,72,73,74]). Testing for this relationship is often difficult, because usually only small numbers of relocated individuals and resident individuals can be tracked in any single study. Typically, the HRs of both relocated and non-relocated turtles are highly variable, raising the probability of Type 2 errors. Meta-analysis can address both of these problems. We only found appropriate data for relocated T. carolina, which had considerably higher HR than those that had not been relocated. We recognize that this is a fairly crude analysis, because a better analysis would be to compare the HRs of relocated turtles to the HRs of local conspecifics that were not relocated. However, this test clearly shows a dramatic difference due to relocation, which is an effect that had not been shown consistently in the individual studies.
5. Conclusions
Individual HR studies of T. carolina and T. ornata contributed a more thorough understanding of the habitat use and behaviors of individuals within local populations. Combining these studies within a meta-analysis allowed us to reveal larger patterns in HR across T. carolina and T. ornata populations, and between these two species, patterns that were often not detected in individual studies. For example, meta-analysis revealed an increase in HR in relocated T. carolina compared to those not relocated. This analysis also revealed species-level differences regarding the influence of sex and ecoregion on Terrapene HR, with sex affecting the HR in both species but in opposite directions, and ecoregion playing a larger role in T. ornata HR than T. carolina HR. Furthermore, our meta-analysis revealed that while tracking technique (number of locations) did not affect HR, the HR estimators (MCP, ellipse, etc.) did affect HR. We note that we were unable to test whether the study length or number of locations/individual affected HR size; however, we suggest that the raw data from an unusually long-term study with very large sample sizes (e.g., [21,45]) or novel studies using current GPS-tracking technology create samples that vary frequently and with high accuracy (e.g., [75,76]) could be sub-sampled to address these questions, as well as to address important issues of spatial autocorrelation. As shown in this study, meta-analysis is a powerful tool that can detect large-scale patterns across studies and provide evidence for or against conclusions made about species within individual studies.
Supplementary Materials
The following are available online at https://www.mdpi.com/1424-2818/11/5/68/s1, Table S1: Turtle meta-analysis data and code.
Author Contributions
Conceptualization, M.P.F.; Formal analysis, C.W.H.; Investigation, M.P.F.; Writing—original draft, M.P.F., J.E.D. and R.L.B.; Writing—review & editing, C.W.H., M.P.F., J.E.D. and R.L.B.
Funding
This research received no external funding.
Conflicts of Interest
The authors declare no conflict of interest.
References
- Burt, W.H. Territoriality and home range concepts as applied to mammals. J. Mammal. 1943, 24, 346. [Google Scholar] [CrossRef]
- Kernohan, B.J.; Gitzen, R.A.; Millspaugh, J.J. Analysis of animal space use and movements. In Radio Tracking and Animal Populations; Millspaugh, J.J., Marzluff, J.M., Eds.; Academic Press: London, UK, 2001; pp. 126–164. [Google Scholar]
- Van Winkle, W. Comparison of several probabilistic home-range models. J. Wildl. Manag. 1975, 39, 118–123. [Google Scholar] [CrossRef]
- Jones, R.L. Home range and seasonal movements of the Turtle Graptemys flavimaculata. J. Herpetol. 1996, 30, 376. [Google Scholar] [CrossRef]
- Morrow, J.L.; Howard, J.H.; Smith, S.A.; Poppel, D.K. Home range and movements of the bog turtle (Clemmys muhlenbergii) in Maryland. J. Herpetol. 2001, 35, 68–73. [Google Scholar] [CrossRef]
- Arvisais, M.; Bourgeois, J.-C.; Daigle, C.; Jutras, J.; Lévesque, E.; Masse, D. Home range and movements of a wood turtle (Clemmys insculpta) population at the northern limit of its range. Can. J. Zool. 2002, 80, 402–408. [Google Scholar] [CrossRef]
- Dodd, C.K. North American Box Turtles: A Natural History; Oklahoma University Press: Norman, OK, USA, 2001. [Google Scholar]
- Lindeman, P.V. The Map Turtle and Sawback Atlas; University of Oklahoma Press: Norman, OK, USA, 2013. [Google Scholar]
- Kimble, S.J.A.; Rhodes, O.E., Jr.; Williams, R.N. Unexpectedly Low Rangewide Population Genetic Structure of the Imperiled Eastern Box Turtle Terrapene c. carolina. PLoS ONE 2014, 9, e92274. [Google Scholar] [CrossRef]
- Breder, R.B. Turtle trailing: A new technique for studying the life habits of certain Testudinata. Zoologica 1927, 9, 231–243. [Google Scholar]
- Nichols, J.T. Range and homing of individual box turtles. Copeia 1939, 1939, 125–127. [Google Scholar] [CrossRef]
- Powell, R.; Conant, R.; Collins, J.T. Peterson Field Guide to Reptiles and Amphibians of Eastern and Central North America, 4th ed.; Houghton Mifflin Harcourt: Boston, MA, USA, 2016. [Google Scholar]
- Lue, K.-Y.; Chen, T.-H. Activity, movement patterns, and home range of the yellow-margined box turtle (Cuora flavomarginata) in Northern Taiwan. J. Herpetol. 1999, 33, 590–600. [Google Scholar] [CrossRef]
- Lawson, D.P. Habitat use, home range, and activity patterns of hingeback tortoises, Kinixys erosa and K. homeana, in Southwestern Cameroon. Chelonian Conser. Biol. 2006, 5, 48–56. [Google Scholar] [CrossRef]
- Fasola, M.; Mazzotti, S.; Pisapia, A. Activity and home range of Testudo hermanni in Northern Italy. Amphibia-Reptilia 2002, 23, 305–312. [Google Scholar] [CrossRef]
- Row, J.R.; Blouin-Demers, G. Kernels are not accurate estimators of home-range size for herpetofauna. Copeia 2006, 2006, 797–802. [Google Scholar] [CrossRef]
- Harless, M.L.; Walde, A.D.; Delaney, D.K.; Pater, L.L.; Hayes, W.K. Sampling considerations for improving home range estimates of desert tortoises: Effects of estimator, sampling regime, and sex. Herpetol. Conserv. Biol. 2010, 5, 374–387. [Google Scholar]
- Worton, B.J. A review of models of home range for animal movement. Ecol. Model. 1987, 38, 277–298. [Google Scholar] [CrossRef]
- Boyle, S.A.; Lourenço, W.C.; Da Silva, L.R.; Smith, A.T. Home range estimates vary with sample size and methods. Folia Primatol. 2009, 80, 33–42. [Google Scholar] [CrossRef] [PubMed]
- Powell, R.A. Animal home ranges and territories and home range estimators. In Research Techniques in Animal Ecology: Controversies and Consequences; Boitani, L., Fuller, T.K., Eds.; Columbia University Press: New York, NY, USA, 2000; pp. 65–110. [Google Scholar]
- Farnsworth, S.D.; Seigel, R.A. Responses, movements, and survival of relocated box turtles during construction of the intercounty connector highway in Maryland. Transp. Res. Rec. J. Transp. Res. Board 2013, 2362, 1–8. [Google Scholar] [CrossRef]
- Sosa, J.A.; Perry, G. Site fidelity, movement, and visibility following translocation of Ornate box turtles (Terrapene ornata ornata) from a wildlife rehabilitation center in the high plains of Texas. Herpetol. Conserv. Biol. 2015, 10, 255–262. [Google Scholar]
- EPA. Environmental Protection Agency Ecoregions. 2018. Available online: https://www.epa.gov/eco-research/ecoregions (accessed on 30 March 2018).
- Viechtbauer, W. Conducting Meta-Analyses in R with the metafor Package. J. Stat. Softw. 2010, 36, 1–48. [Google Scholar] [CrossRef]
- R Core Team. 2015 R: A language and environment for statistical computing; R Foundation for Statistical Computing: Vienna, Austria, 2015; Available online: http://www.R-project.org/ (accessed on 11 October 2018).
- R Studio Team. 2016 R: A Language and Environment for Statistical Computing; R Foundation for Statistical Computing: Vienna, Austria, 2016; Available online: http://www.R-project.org/ (accessed on 11 October 2018).
- Nakagawa, S.; Santos, E.S.A. Methodological issues and advances in biological meta-analysis. Evol. Ecol. 2012, 26, 1253–1274. [Google Scholar] [CrossRef]
- Hothorn, T.; Bretz, F.; Westfall, P.; Heiberger, R.M.; Schuetzenmeister, A.; Scheibe, S. Package “Multcomp”. 2019. Available online: http://cran.stat.sfu.701ca/web/packages/multcomp/multcomp.pdf/ (accessed on 11 October 2018).
- Hedges, L.V.; Olkin, I. Statistical Methods for Meta-Analysis; Academic Press: Orlando, FL, USA, 1985. [Google Scholar]
- Egger, M.; Smith, G.D.; Schneider, M.; Minder, C. Bias in meta-analysis detected by a simple, graphical test. BMJ 1997, 315, 629–634. [Google Scholar] [CrossRef] [Green Version]
- Sterne, J.A.C.; Egger, M. Regression methods to detect publication and other bias in meta-analysis. In Publication Bias in Meta-Analysis: Prevention, Assessment, and Adjustments; Rothstein, H.R., Sutton, A.J., Borenstein, M., Eds.; John Wiley & Sons: Chichester, UK, 2005; pp. 99–110. [Google Scholar]
- Viechtbauer, W.; Cheung, M.W.-L. Outlier and influence diagnostics for meta-analysis. Synth. Methods 2010, 1, 112–125. [Google Scholar] [CrossRef] [PubMed]
- Habeck, C.W.; Schultz, A.K. Community-level impacts of white-tailed deer on understory plants in North American forests: A meta-analysis. AoB Plants 2015, 7, plv119. [Google Scholar] [CrossRef] [PubMed]
- Stevens, J.P. Outliers and influential data points in regression analysis. Psychol. Bull. 1984, 95, 334–344. [Google Scholar] [CrossRef]
- Aguinis, H.; Gottfredson, R.K.; Joo, H. Best-practice recommendations for defining, identifying, and handling outliers. Organ Methods 2013, 16, 270–301. [Google Scholar] [CrossRef]
- Pinheiro, J.; Bates, D.; DebRoy, S.; Sarkar, D.; R Core Team. nlme: Linear and Nonlinear Mixed Effects Models. R Package Version 3.1-137. 2018. Available online: https://CRAN.R-project.org/package=nlme (accessed on 11 October 2018).
- Madden, R.C. Home Range, Movements, and Orientation in the Eastern Box Turtle, Terrapene carolina carolina. Ph.D. Thesis, City University of New York, New York, NY, USA, 1975. [Google Scholar]
- Davis, M. Aspects of the Social and Spatial Experience of Eastern Box Turtles, Terrapene carolina carolina. Ph.D. Thesis, University of Tennessee, Knoxville, TN, USA, 1981. [Google Scholar]
- Bayless, J.W. Home Range Studies of the Eastern Box Turtle (Terrapene carolina carolina) Using Radio Telemetry. Master’s Thesis, George Mason University, Fairfax, VA, USA, 1984. [Google Scholar]
- Holy, L.L. Home Range, Homing Ability, Orientation and Navigational Mechanisms of the Western Box Turtle (Terrapene ornata) from Western Nebraska. Ph.D. Thesis, University of Nebraska—Lincoln, Lincoln, NE, USA, 1995. [Google Scholar]
- Trail, C.D. Natural History and Habitat Use of the Ornate Box Turtle Terrapene ornata ornata at a Mixed-Grass Prairie in Southwest Nebraska. Master’s Thesis, University Nebraska, Omaha, NE, USA, 1995. [Google Scholar]
- Nieuwolt, P.M. Movement, activity, and microhabitat selection in the western box turtle, Terrapene ornata luteola, in New Mexico. Herpetologica 1996, 52, 487–495. [Google Scholar]
- Kaye, D.R.J.; Walsh, K.M.; Ross, C.M. Seasonal movements and habitat preferences for the spotted turtle and eastern box turtle in Massachusetts. In Proceedings of the 2001 International Conference on Ecology and Transportation, Keystone, CO, USA, 24–28 September 2001; Irwin, C.L., Garrett, P., McDermott, K.P., Eds.; Center for Transportation and the Environment, North Carolina State University: Raleigh, NC, USA, 2001; pp. 66–82. [Google Scholar]
- Hall, D.H.; Steidl, R.J. Ecology and Conservation of Desert Box Turtles (Terrapene ornata luteola) in Arizona; Project No. I02003; Arizona Game and Fish Department: Phoenix, AZ, USA, 2003.
- Cook, R.P. Dispersal, home range establishment, survival, and reproduction of translocated eastern box turtles, Terrapene c. carolina. Appl. Herpetol. 2004, 1, 197–228. [Google Scholar] [CrossRef]
- Capitano, W. Home Range, Spatial Patterning and Reproductive Ecology of Female Eastern Box Turtles in a Long Island Population. Master’s Thesis, Hofstra University, Hempstead, NY, USA, 2005. [Google Scholar]
- Donaldson, B.M.; Echternacht, A.C. Aquatic Habitat Use Relative to Home Range and Seasonal Movement of Eastern Box Turtles (Terrapene carolina carolina: Emydidae) in Eastern Tennessee. J. Herpetol. 2005, 39, 278–284. [Google Scholar] [CrossRef]
- Lentz, J. Home Range and Habitat Preferences of Terrapene carolina carolina at Jug Bay Wetlands Sanctuary, Maryland; Technical Report; Jug Bay Wetlands Sanctuary: Lothian, MD, USA, 2005. [Google Scholar]
- Bernstein, N.P.; Richtsmeier, R.J.; Black, R.W.; Montgomery, B.R. Home range and philopatry in the ornate box turtle, Terrapene ornata ornata, in Iowa. Am. Midl. Nat. 2007, 157, 162–174. [Google Scholar] [CrossRef]
- Rittenhouse, C.D.; Millspaugh, J.J.; Hubbard, M.W.; Sheriff, S.L. Movements of translocated and resident three-toed box turtles. J. Herpetol. 2007, 41, 115–121. [Google Scholar] [CrossRef]
- Hester, J.M.; Price, S.J.; Dorcas, M.E. Effects of relocation on movements and home ranges of eastern box turtles. J. Wildl. Manag. 2008, 72, 772–777. [Google Scholar] [CrossRef]
- Quinn, D.P. A Radio-Telemetric Study of the Eastern Box Turtle (Terrapene carolina carolina): Home-Range, Habitat Use, and Hibernacula Selection in Connecticut. Ph.D. Thesis, Central Connecticut State University, New Britain, CT, USA, 2008. [Google Scholar]
- Baker, J.M. Home Range and Movement of the Eastern Box Turtle (Terrapene carolina) in East Central Illinois. Master’s Thesis, University of Illinois at Urbana-Champaign, Champaign, IL, USA, 2009. [Google Scholar]
- Aall, N.C. Influence of Season and Sex on Terrapene c. carolina (Eastern Box Turtle) Movements: An Observation of a Population in West Virginia. Master’s Thesis, Marshall University, Huntington, WV, USA, 2011. [Google Scholar]
- Currylow, A.F.; MacGowan, B.J.; Williams, R.N. Short-term forest management effects on a long-lived ectotherm. PLoS ONE 2012, 7, e40473. [Google Scholar] [CrossRef] [PubMed]
- Refsnider, J.M.; Strickland, J.; Janzen, F.J. Home range and site fidelity of imperiled ornate box turtles (Terrapene ornata) in northwestern Illinois. Chelonian Conser. Biol. 2012, 11, 78–83. [Google Scholar] [CrossRef]
- Samuelson, C.S. Movement Patterns in Resident and Translocated Three-Toed Box Turtles (Terrapene carolina triunguis). Master’s Thesis, The University of Texas at Tyler, Tyler, TX, USA, 2012. [Google Scholar]
- Wilson, S.D. Movement and Ecology of the Eastern Box Turtle (Terrapene carolina carolina) in a Heterogeneous Landscape. Master’s Thesis, Bowling Green State University, Bowling Green, OH, USA, 2012. [Google Scholar]
- Kapfer, J.M.; Muñoz, D.J.; Groves, J.D.; Kirk, R.W. Home range and habitat preferences of Eastern Box Turtles (Terrapene carolina Linnaeus, 1758) in the Piedmont Ecological Province of North Carolina (USA). Herpetol. Notes 2013, 6, 251–260. [Google Scholar]
- Greenspan, S.E.; Condon, E.P.; Smith, L.L. Home range and habitat selection in the eastern box turtle (Terrapene carolina carolina) in a longleaf pine (Pinus palustris) reserve. Herpetol. Conserv. Biol. 2015, 10, 99–111. [Google Scholar]
- Omernik, J.M. Ecoregions of the conterminous United States. Ann. Assoc. Am. Geogr. 1987, 77, 118–125. [Google Scholar] [CrossRef]
- Clark, H.W. On the occurrence of a probable hybrid between the eastern and western box turtles, Terrapene carolina and T. ornata, near Lake Maxinkuckee, Indiana. Copeia 1935, 1935, 148–150. [Google Scholar] [CrossRef]
- Grobman, A.B. The effect of soil temperatures on emergence from hibernation of Terrapene carolina and T. ornata. Am. Midl. Nat. 1990, 124, 366. [Google Scholar] [CrossRef]
- Cureton, J.C.; Buchman, A.B.; Deaton, R.; Lutterschmidt, W.I. Molecular analysis of hybridization between the box turtles Terrapene carolina and T. ornata. Copeia 2011, 2011, 270–277. [Google Scholar] [CrossRef]
- Wanchai, P.; Stanford, C.B.; Thirakhupt, K.; Thanhikorn, S. Home range of the impressed tortoise, Manouria impressa (Günther, 1882) at Phu Luang Wildlife Sanctuary, Loei Province, Thailand. Trop. Nat. Hist. 2012, 12, 165–174. [Google Scholar]
- Barton, R.; Whiten, A.; Strum, S.; Byrne, R.; Simpson, A. Habitat use and resource availability in baboons. Anim. Behav. 1992, 43, 831–844. [Google Scholar] [CrossRef]
- Edwards, M.A.; DeRocher, A.E.; Nagy, J.A. Home range size variation in female arctic grizzly bears relative to reproductive status and resource availability. PLoS ONE 2013, 8, e68130. [Google Scholar] [CrossRef]
- Schoepf, I.; Schmohl, G.; König, B.; Pillay, N.; Schradin, C. Manipulation of population density and food availability affects home range sizes of African striped mouse females. Anim. Behav. 2015, 99, 53–60. [Google Scholar] [CrossRef]
- Laver, P.N.; Kelly, M.J. A critical review of home range studies. J. Wildl. Manag. 2008, 72, 290–298. [Google Scholar] [CrossRef]
- Kie, J.G.; Matthiopoulos, J.; Fieberg, J.; Powell, R.A.; Cagnacci, F.; Mitchell, M.S.; Gaillard, J.-M.; Moorcroft, P.R. The home-range concept: Are traditional estimators still relevant with modern telemetry technology? Philos. Trans. Soc. B Biol. Sci. 2010, 365, 2221–2231. [Google Scholar] [CrossRef]
- Powell, R.A.; Mitchell, M.S. What is a home range? J. Mammal. 2012, 93, 948–958. [Google Scholar] [CrossRef] [Green Version]
- Lee, S.M. Repatriation and Health Assessment of Eastern Box Turtles (Terrapene c. carolina) at Caumsett State Park, New York. Master’s Thesis, Hofstra University, Hempstead, NY, USA, 2004. [Google Scholar]
- Tuberville, T.D.; Clark, E.E.; Buhlmann, K.A.; Gibbons, J.W. Translocation as a conservation tool: Site fidelity and movement of repatriated gopher tortoises (Gopherus polyphemus). Anim. Conserv. 2005, 8, 349–358. [Google Scholar] [CrossRef]
- Nussear, K.E.; Tracy, C.R.; Medica, P.A.; Wilson, D.S.; Marlow, R.W.; Corn, P.S. Translocation as a conservation tool for Agassiz’s desert tortoises: Survivorship, reproduction, and movements. J. Wildl. Manag. 2012, 76, 1341–1353. [Google Scholar] [CrossRef]
- Cochrane, M.M.; Brown, D.J.; Moen, R.A. GPS technology for semi-aquatic turtle research. Diversity 2019, 11, 34. [Google Scholar] [CrossRef]
- Thompson, D.G.; Swystun, T.; Cross, J.; Cross, R.L.; Chartrand, D.; Edge, C.B. Fine- and coarse-scale movements and habitat use by Wood Turtles (Glyptemys insculpta) based on probabilistic modeling of radiotelemetry and GPS-telemetry data. Can. J. Zool. 2018, 96, 1153–1164. [Google Scholar] [CrossRef]
Figure 1.
Raw mean HR estimates as a function of study sample size. The relationship was not significant (β = 0.077, df = 45, t = 0.542, p = 0.591).
Figure 1.
Raw mean HR estimates as a function of study sample size. The relationship was not significant (β = 0.077, df = 45, t = 0.542, p = 0.591).

Figure 2.
Standard deviation of the HR estimates as a function of study sample size. The relationship was not significant (β = –0.061, df = 45, t = –0.316, p = 0.754).
Figure 2.
Standard deviation of the HR estimates as a function of study sample size. The relationship was not significant (β = –0.061, df = 45, t = –0.316, p = 0.754).


Table 1.
Raw mean home range (HR) estimates with standard error (SE) and 95% confidence intervals (CI.L (=lower limit of confidence interval) and CI.U (=upper limit of confidence interval)) for T. carolina and T. ornata by species and sex, using only studies where turtle sex was identified. Superscript letters show within-species differences between females and males, based on Holm–Bonferroni pairwise post hoc comparisons.
| Species | HR Estimate | SE | CI.L | CI.U |
|---|---|---|---|---|
| T. carolina | ||||
| Overall | 4.50 | 0.83 | 2.88 | 6.12 |
| Female a | 4.82 | 1.24 | 2.40 | 7.24 |
| Male b | 3.80 | 1.24 | 1.37 | 6.22 |
| T. ornata | ||||
| Overall | 4.61 | 1.37 | 1.93 | 7.29 |
| Female a | 4.37 | 1.63 | 1.18 | 7.56 |
| Male b | 4.67 | 1.63 | 1.48 | 7.86 |
Table 2.
Raw mean HR estimates with standard error (SE) and 95% confidence intervals (CI.L and CI.U) for all T. carolina studies, by ecoregion.
Table 2.
Raw mean HR estimates with standard error (SE) and 95% confidence intervals (CI.L and CI.U) for all T. carolina studies, by ecoregion.
| Ecoregions | HR Estimate | SE | CI.L | CI.U |
|---|---|---|---|---|
| Central USA plains | 18.32 | 12.43 | −6.05 | 42.69 |
| Mississippi alluvial and southeast USA coastal plains | 4.64 | 1.71 | 1.29 | 8.00 |
| Mixed wood plains | 3.51 | 2.06 | −0.54 | 7.55 |
| Ozark/Ouachita-Appalachian forests | 2.04 | 1.53 | −0.96 | 5.05 |
| Southeastern USA plains | 5.16 | 0.91 | 3.37 | 6.95 |
Table 3.
Raw mean home range estimates with standard error (SE) and 95% confidence intervals (CI.L and CI.U) for all T. ornata studies by ecoregion. Superscript letters show differences among ecoregions, based on Holm–Bonferroni pairwise post hoc comparisons.
Table 3.
Raw mean home range estimates with standard error (SE) and 95% confidence intervals (CI.L and CI.U) for all T. ornata studies by ecoregion. Superscript letters show differences among ecoregions, based on Holm–Bonferroni pairwise post hoc comparisons.
| Ecoregions | HR Estimate | SE | CI.L | CI.U |
|---|---|---|---|---|
| Central USA plains a | 2.55 | 1.00 | 0.58 | 4.52 |
| Cold desert a | 1.58 | 1.02 | −0.42 | 3.57 |
| South-central semi-arid prairies s | 2.32 | 1.01 | 0.35 | 4.30 |
| Temperate prairies a | 0.86 | 0.99 | −1.08 | 2.79 |
| West-central semi-arid prairies b | 18.81 | 3.02 | 12.90 | 24.72 |
| Western Sierra Madre piedmont c | 6.97 | 1.01 | 5.00 | 8.94 |
Table 4.
Raw mean home range estimates with standard error (SE) and 95% confidence intervals (CI.L and CI.U) for all Terrapene studies by HR technique. Superscript letters show differences among estimators, based on Holm–Bonferroni pairwise post hoc comparisons. MCP: minimum convex polygons.
Table 4.
Raw mean home range estimates with standard error (SE) and 95% confidence intervals (CI.L and CI.U) for all Terrapene studies by HR technique. Superscript letters show differences among estimators, based on Holm–Bonferroni pairwise post hoc comparisons. MCP: minimum convex polygons.
| HR Calculation Technique | HR Estimate | SE | CI.L | CI.U |
|---|---|---|---|---|
| Ellipse a | 8.29 | 0.91 | 6.50 | 10.08 |
| Harmonic mean b | 4.13 | 0.83 | 2.50 | 5.75 |
| Kernel bc | 3.48 | 0.72 | 2.08 | 4.88 |
| MCP bd | 4.59 | 0.70 | 3.21 | 5.96 |
Table 5.
Raw mean home range estimates with standard error (SE) and 95% confidence intervals (CI.L and CI.U) for T. carolina by relocation status. Superscript letters show differences among estimators.
Table 5.
Raw mean home range estimates with standard error (SE) and 95% confidence intervals (CI.L and CI.U) for T. carolina by relocation status. Superscript letters show differences among estimators.
| Relocated | HR Estimate | SE | CI.L | CI.U |
|---|---|---|---|---|
| Yes a | 6.13 | 0.80 | 4.56 | 7.70 |
| No b | 4.07 | 0.67 | 2.76 | 5.38 |
© 2019 by the authors. Licensee MDPI, Basel, Switzerland. This article is an open access article distributed under the terms and conditions of the Creative Commons Attribution (CC BY) license (http://creativecommons.org/licenses/by/4.0/).
Share and Cite
MDPI and ACS Style
Habeck, C.W.; Figueras, M.P.; Deo, J.E.; Burke, R.L. A Surfeit of Studies: What Have We Learned from All the Box Turtle (Terrapene carolina and T. ornata) Home Range Studies? Diversity 2019, 11, 68. https://doi.org/10.3390/d11050068
AMA Style
Habeck CW, Figueras MP, Deo JE, Burke RL. A Surfeit of Studies: What Have We Learned from All the Box Turtle (Terrapene carolina and T. ornata) Home Range Studies? Diversity. 2019; 11(5):68. https://doi.org/10.3390/d11050068
Chicago/Turabian StyleHabeck, Christopher W., Miranda P. Figueras, Jean E. Deo, and Russell L. Burke. 2019. "A Surfeit of Studies: What Have We Learned from All the Box Turtle (Terrapene carolina and T. ornata) Home Range Studies?" Diversity 11, no. 5: 68. https://doi.org/10.3390/d11050068
Note that from the first issue of 2016, this journal uses article numbers instead of page numbers. See further details here.