Article

Latitudinal and Cross-Shelf Patterns of Size, Age, Growth, and Mortality of a Tropical Damselfish Acanthochromis polyacanthus on the Great Barrier Reef

by
Michael J. Kingsford
1,*,
David Welch
2 and
Mark O’Callaghan
1
1
Marine Biology and Aquaculture, College of Science and Engineering and ARC Centre of Excellence for Coral Reef Studies, James Cook University, Douglas Qld 4811, Australia
2
C2O Pacific, Port Vila, Vanuatu
*
Author to whom correspondence should be addressed.
Diversity 2019, 11(5), 67; https://doi.org/10.3390/d11050067
Submission received: 29 March 2019 / Revised: 17 April 2019 / Accepted: 23 April 2019 / Published: 26 April 2019

Abstract

:
Patterns of age and growth of a sedentary damsel fish Acanthochromis polyacanthus were tested over a latitudinal range of approximately 10 degrees (1200 km) on the Great Barrier Reef (GBR), Australia. Within latitudes, these patterns were also compared on reefs in distance strata (inner, mid, and outer) across a continental shelf that ranged in width from 52 to 128 km. Although variation in length-max (SLMAX), growth, age-max (AMAX), and the von Bertalanffy metrics of Linf and K were found within and among latitudes, the greatest variation in some demographic characteristics was found among distance strata across the shelf regardless of latitude. Fish were always relatively smaller at inner shelf reefs and grew more slowly when compared to mid and outer shelf reefs; this was true regardless of the color morph of fish. The oldest fish collected was 11 years old, and there was no consistent variation in age-max among distances from shore. On outer reefs, there was a negative linear relationship with age-max and latitude. This “tropical gradient” of age only explained 34% of the variation; furthermore, this was not found when only the oldest group of fish was considered (top 10%). Fish only reached an age-max of six years on the southernmost reefs. There was a trend for a smaller Linf with latitude but it was not significant and Linf did not vary predictably with water temperature. The sampling of marine protected areas (MPAs) and fished zones did not confound the resultant patterns in that fish were not consistently larger or older in MPAs or fished zones. Instantaneous mortality rates were 0.245–0.685; they were highest at inner reefs and also showed no consistent MPA-related patterns. Our study suggested that the mid and outer shelf waters of the GBR appeared best suited for growth of A. polyacanthus. In conclusion, the position on continental shelves dominated other geographical patterns and needs to be considered in spatial models of growth. We suggest that local environmental conditions such as turbidity and the quality and quantity of plankton likely have a strong influence on distance across the shelf-based demographic patterns of planktivores.

1. Introduction

Patterns of age, growth, and mortality are critical to understanding the population dynamics of fishes. These patterns are influenced by internal factors such as genetics and related physiological tolerances [1], as well as environmental factors [2,3]. Furthermore, growth and mortality can be influenced by fishing effort (e.g., growth compensation [4]) and related variation in fishing effort in and out of marine protected areas (MPAs) [5].
Environmental factors are often correlated with demographic characteristics. There are a number of models that relate to latitude and sea water temperature. Tropical gradient models (TGM) state that one or a combination of age-max, length-max, growth, and growing season decrease from low latitude to high latitudes [1,2,6]. This pattern closely aligns with the temperature size rule (TSR) where reduced growth rate correlates with a drop in temperature [7]. It is of course assumed that temperature drops with latitude, although this may vary in accuracy with the latitudinal range studied and oceanography. The TSR aligns with “metabolic theory”, where metabolic rate varies with temperature, and this in turn can have a strong influence on demographic patterns such as age, growth, and mortality [8]. In some cases, a TGM pattern can be found for growth whilst length to infinity can increase with latitude [7]. Counter gradient models (CGM) state that age-max (AMAX), length-max, or growth will increase from low latitude to high latitude (e.g., References [6,9]). In the case of some surgeon fishes, age-max increases with a decrease in temperature but, due to variation in oceanography, does not increase as predictably with latitude [10]. Bergmann’s rule and James’s rule refer to an increase in body size with latitude [11,12]. At some spatial scales, regional differences in demographics were not found to vary predictably over many degrees of latitude (e.g., 12°, Cromileptes altivelis [13]). For any correlative study, it is often challenging to provide a strong case for any of these patterns without sampling a wide latitudinal range and having multiple sampling sites.
The Great Barrier Reef (GBR) is about 2000 km long; accordingly, it covers a broad latitudinal range of approximately 14°. Furthermore, the width of the continental shelf ranges from 60 km to 300 km wide. A concern is that latitudinal variation could be confounded by differences among distance strata across the shelf. It is well documented that there is more variation in the patterns of abundance of and species richness of fishes cross-shelf than over distances of hundreds of kilometers latitudinally [14,15,16,17]. Moreover, with distance across the continental shelf, there will be differences in environmental drivers that include level of exposure and coastal processes such as riverine runoff and related sediment loads [18,19], and on the outer shelf proximity to upwelling [20]. Furthermore, it is highly likely that these factors could also have a great influence on the supply of planktonic food. These processes could have an great influence on patterns of size/age and growth [15] that are independent of latitude. Gust et al. [21] demonstrated such differences for the size max, growth, and mortality for some species of scarids and one acanthurid at replicate reefs positioned mid shelf or outer shelf on the GBR. This was also found by Taylor et al. [22] who argued that the level of disturbance cross-shelf can affect the nutritional ecology and timing of sex change in scarids.
The level of protection of reefs from fishing can also have an impact on demographic metrics and mortality that could confound the interpretation of broad spatial patterns. Protection generally results in greater abundance, as well as larger and older fish [23,24,25]. Furthermore, a high abundance of predatory fishes could affect patterns of abundance of prey and the size/age and growth characteristics of reef-based populations (e.g., Reference [5]). Kingsford and Hughes [26] found great differences in size maxima and von Bertalanffy characteristics of fish across the shelf, where fish from inner reefs were much smaller. However, this project did not test for variation in demographic characteristics with latitude. Here, we add multiple latitudes to these data and consider the potentially confounding effects of levels of marine protection.
The objective of this study was to compare the demographic characteristics of Acanthochromis polyacanthus over a latitudinal range of ~10 degrees (about 1200 km) and make robust comparisons with distance across the continental shelf of the GBR at each latitude. Where geomorphology allowed, we sampled replicate reefs at multiple distance strata from the shore (inner, mid, and outer shelf). The specific aims of this study were to (1) describe patterns of size, age, and growth of reef-based populations of A. polyacanthus with latitude and within and among sampling strata at different distances from the shore; (2) where possible, compare demographic patterns with detailed temperature records; (3) calculate the instantaneous mortality rates (Z) of populations of A. polyacanthus with latitude and within and among distance strata; (4) test a hypothesis that the level of marine protection could confound broad-scale spatial patterns.
Acanthochromis polyacanthus was an ideal species for the study of patterns of size, age, and growth, as it is found over a broad latitudinal range on most reefs at inner, mid, and outer distances across the continental shelf [14,27]. The distribution and abundance of the species, therefore, allowed for high spatial resolution of the aforementioned patterns. The species is also not targeted, where selective fishing could affect patterns of size and age. A. polyacanthus is highly sedentary in that they are protected in a brood by adults once the eggs hatch [28]. Once they leave, the broad breeding pairs are established, and they rarely venture more than 10s of meters during their lives. Environmental influence on growth, therefore, would be highly localized as no broad-scale movements are undertaken. The documented age maximum of the species is 11 years [26].

2. Materials and Methods

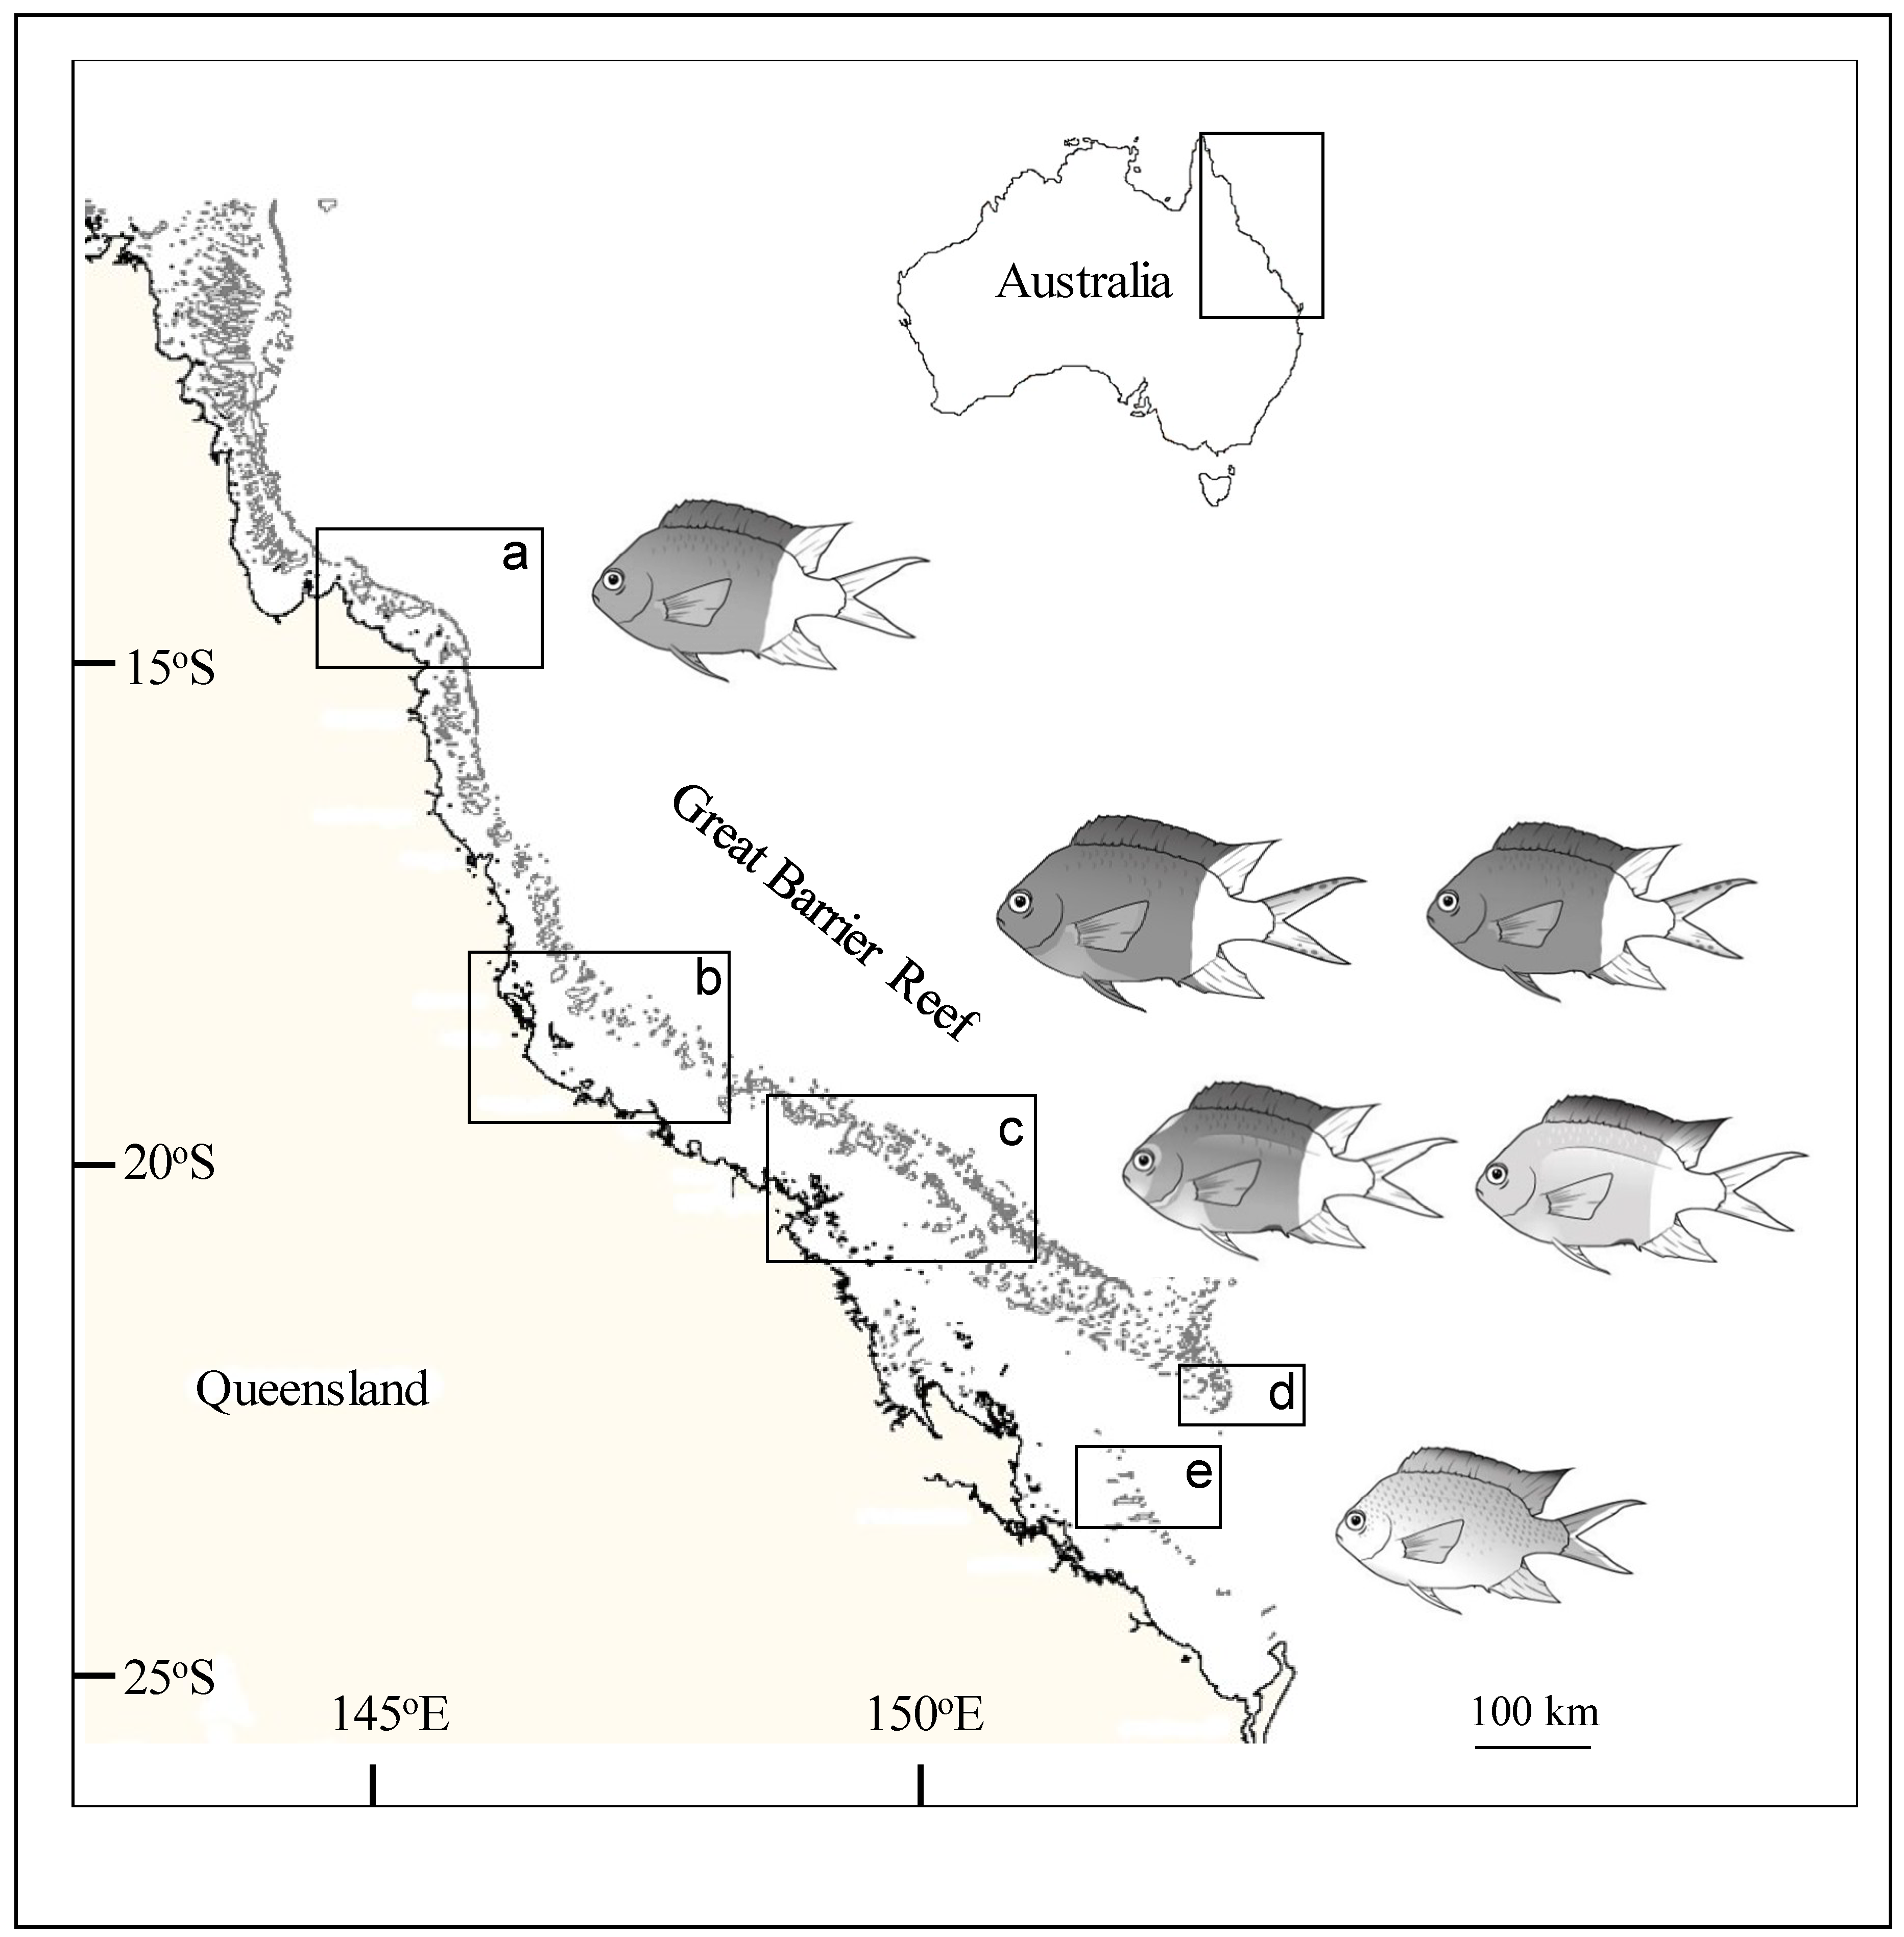
2.1. Study Sites and Sampling Design

Spatial variation in the demographics of cross-shelf populations of A. polyacanthus was determined using a partially hierarchical sampling design. Individuals of a wide range of sizes were collected from two or three sites (separated by 100s of meters within a reef) from two or three replicate reefs within each of three distance strata (inner, mid, and outer shelf) spanning the width of the continental shelf at three latitudes, Lizard Island, Townsville, and the Whitsundays (Townsville data are from Reference [26]). Variation in fish demographics over a broader latitudinal range was achieved by sampling additional outer shelf reefs located in the Swains, and the Capricorn section in the GBR (Figure 1, Table 1). At each site, a minimum of 40 fish were collected by scuba divers using hand spears from 2001–2006 (Table 1). All fish were collected at depths of 5 to 15 m.
The color morph of fish was recorded at each sample site. Although Acanthochromis polyacanthus is considered as single species on the GBR [27,28], there is variation in color morphs by latitude and, in some cases, with distance from shore (see References [28,29]). At some latitudes of the GBR, A. polyacanthus were of the same color morph (e.g., Lizard, Figure 1), while more than one color morph was found at other latitudes (Whitsundays). Accordingly, we were careful to note the color morph of A. polyacanthus by distance from shore and latitude in case incipient speciation could explain some of the differences in demographic characteristics that were found. In our study, we found that fish were of the same color by reefs within distances and latitude.
Some latitudinal gradient models predict that temperature has a great influence on variation in the size of organisms [30]. Sea water temperature generally drops with an increase in latitude, but complex oceanography [20] can confound this simple assumption. Although we did not have loggers at all reefs, TinytagII temperature loggers were used to collect these data at the northern and southern extremes of our study area and at a mid-latitude (Townsville). Loggers were deployed at 10 and 30 m deep (encompassing the depth range that fish were collected) at outer reefs of each latitude over a period of two years. The environmental gradient of temperature with latitude with was as follows: sea water temperatures were up to 4 °C lower in the Capricorn Bunker Group in the winter and about 2 °C cooler in the summer when compared with Lizard. Furthermore, temperatures were about 1 °C lower on outer reefs of the Townsville latitude in the winter and similar in the summer when compared with Lizard (Figure S2, Supplementary Materials).

2.2. Processing of Samples

All fish were measured to the nearest mm (standard length, SL). Sagittal otoliths were extracted, cleaned in Milli-Q water to remove the sagittal membrane and allowed to dry overnight. One otolith from each fish was then sectioned using a Gemmasta GF4 Faceting Machine using a 1200-grit diamond disc and Crystal bond thermoplastic glue.

2.3. Analysis of Growth Increments

The opaque zones visible in the internal structure of the otolith were counted along a radius from the primordium to the outer edge of the largest sagittal lobe of the otolith using a compound microscope (Leica DMLB) and white incident light source. Alternating translucent and opaque increments were interpreted as annuli. This was previously validated by Kingsford and Hughes [26]. Sections were coded and examined in random order, and the opaque increments were counted on two occasions by the same observer separated by four days. Counts of annuli were compared between these two occasions in order to assess the confidence that could be placed in the interpretation of the otolith structure. If increment counts differed, then the otoliths were re-examined. If, following a third reading, agreement was not reached, then the otolith was not included in the analysis; 6.6% of otoliths were rejected on this basis (n = 186 fish). Fish that could not be aged were still included in the results relating to standard length only.

2.4. Analyses of Size and Age

Firstly, we present data on largest sizes and greatest ages of fish at different spatial scales, then patterns of growth and finally mortality. The initial hypotheses we tested focused on spatial variation in maximum standard length (SLMAX) and maximum age (AMAX). Because maxima only depend on one fish, we also determined spatial patterns of the oldest age (top 10%) and largest fish in terms of SL (top 10%). We did not estimate the minimum size of age of 10% of local populations as this would have required a detailed time series from all reefs, as estimates of this type are highly prone to inaccuracy due to variation in recruitment. In contrast to fish that live from 6–11 years, accurate maxima can be obtained, and it is these data we present.
Multiple analyses were completed to test for spatial patterns in size, age, growth, and mortality. All analyses using ANOVA were done according to Underwood [31]. Data were analyzed for homogeneity with Cochran’s tests. Sample size for ANOVAs was determined by the smallest n at a reef, as a balanced design (i.e., even replication) reduces the chances of Type 1 error [31]. Data were tested for normality, in the case of SLMAX 10%, the data were still heterogeneous after transformation; because ANOVA is robust to heterogeneity, we continued with the analysis using raw data. Linear relationships between latitude and demographic variables were done with least-square regressions.
Analysis 1—do demographic characteristics vary among distance strata and is this consistent among latitudes? Spatial patterns for the top 10% of fish by length and age were tested using balanced ANOVA designs as follows: a partially hierarchical design tested for differences among distances from shore (factor distance, three levels: inner, mid, and outer) and among latitudes (factor latitude, three levels: Lizard Island, Townsville, and Whitsunday). At each orthogonal combination of latitude and distance, we sampled fish from two reefs; accordingly, the factor reef was nested in the L × D interaction, where distance (D) and latitude (L) were treated as fixed factors and reef as random.
In Analysis 1, we did find significant differences in demographic characteristics across the shelf.
Analysis 2—do demographic characteristics vary among latitudes over a range of 10 degrees? So that distance and latitude were not confounded, Analysis 2 was done only on outer reefs. Furthermore, to increase latitudinal coverage in addition to Lizard Island, Townsville, and Whitsunday, samples were taken from the Swains and the Capricorn Bunkers (Table 1). A fully hierarchical design was used for Analysis 2 (factor latitude, five levels as above) and there were two reefs nested in each latitude (n = 7 fish). Latitude and reef were treated as random factors.
Analysis 3—does the GBR marine zoning plan, consisting of fully fished and unfished reefs, confound our interpretation of spatial patterns of age and size? For this analysis, we selected fished and unfished reefs that were in close proximity. We defined pairs of reefs as “locations” with the two different treatments of zones (factor zone, fixed). Suitable locations were available at inner and outer distances from shore (factor distance); there were two locations at each distance and, therefore, “location” was nested in distance (factor location (distance)). Distance was treated as a fixed factor and location as random.
For Analysis 4, it was hypothesized that the size max (SLMAX 10%) of fish would vary between latitudes with different temperature regimes (Figure S2, Supplementary Materials). Robust seasonal data on temperature were only available for an outer reef at Lizard, Townsville, and One Tree Island. A fully hierarchical design was used with the factors of latitude (a = 3) and reefs within latitudes (b = 3).

2.5. Growth

It was hypothesized that patterns of growth would vary with distance from the coast and between different latitudes. Growth was described using the von Bertalanffy growth function (VBGF) which provided the best fit to size-at-age data when compared with estimates of the Schnute growth function [32].
The von Bertalanffy expression for length at age t (Lt), as a function of time is
Lt = Linf [1 − eK ( tto)],
where Lt is the length at age t (years), Linf is the mean asymptotic standard length, K is the rate at which the growth curve approaches Linf, and to is the age at which the fish have a theoretical length of zero. The parameter to was constrained to −0.05 to take into account the approximate size of A. polyacanthus at hatching (5 mm [26]). Kingsford and Hughes [26] demonstrated that variation in growth for A. polyacanthus off Townsville on the GBR was greater among distance strata than within distance strata. Accordingly, we tested the robustness of this pattern among the regions where all distance strata could be sampled.
The spatial hierarchy of growth patterns were visualized using the Kimura method [33]; from this, we generated cross-sections of the approximate 95% confidence regions around Linf and K, by constraining length at to to a common value by fitting a VBGF to all size-at-age data for the curves being compared.
For Analysis 5, it was hypothesized, based on the von Bertalanffy growth curves, that size at age would vary by distance and latitude. Accordingly, we selected fish aged two and three, as these were the fastest growing stages of A. polyacanthus prior to reaching Linf. Data were pooled by reefs within combinations of latitude (Lizard, Townsville, Whitsundays) and distance (inner mid and outer); factors were treated as fixed. The orthogonal ANOVA also provided a testable interaction between distance and latitude.

2.6. Mortality

The instantaneous rate of mortality (Z) was calculated using log-linear regression analyses of age–frequency datasets for A. polyacanthus populations from each reef sampled [34]. This method assumes that recruitment is consistent over time at each reef. The natural logarithm of the number of fish sampled from each age class was compared with their corresponding age. Year classes to the left of the age–frequency mode were excluded from the analysis because our sampling technique was biased against small A. polyacanthus. Fish greater than 60 mm were collected representatively, i.e., as they were encountered. The slope of the regression line between year classes estimated the instantaneous mortality rate (Z) as follows:
Z = F + M,
where F is fishing mortality and M is natural mortality [21]. Since there is not a fishery for A. polyacanthus on the GBR, F is equal to zero and, therefore, Z estimates natural mortality only. Annual survival rate (ASR) estimates were then calculated according to the equation S = e−Z [35] and are presented as percentages. Data from each site were pooled for each reef because, in many cases, sample sizes were too small to provide reliable estimates of mortality at the site level. Similarities in mortality rates among replicate reefs within distance strata allowed pooling of data at the strata level so that comparisons of mortality between shelf positions could be made.

3. Results

3.1. Color Morphs

The color morph of A. polyacanthus varied by latitude and on some occasions with distance within a latitude (Figure 1; color images are given in Figure S1, Supplementary Materials). Fish collected consistently had the brown and white color morph for the Lizard latitude; at the Townsville latitude, they were also brown and white, although at inner reefs they were brown and white with a gold-yellow chin. At the Whitsundays, there was more variation in color across the shelf; at the inner Whitsundays, fish were a brown and white color with a purple/blue vent, a gold-yellow chin, and a similarly colored head. In contrast, at mid and outer reefs, fish had a pale greenish anterior and white posterior with a purple/blue vent. In contrast, at the Swains and Capricorn/Bunker group, fish were a slate-gray with darker highlights on the distal end of scales and on the edges of the fins. The colors we identified align with those described by Planes and Doherty [29], but we identified some additional color variates at the inner distance for Townsville and the Whitsundays.

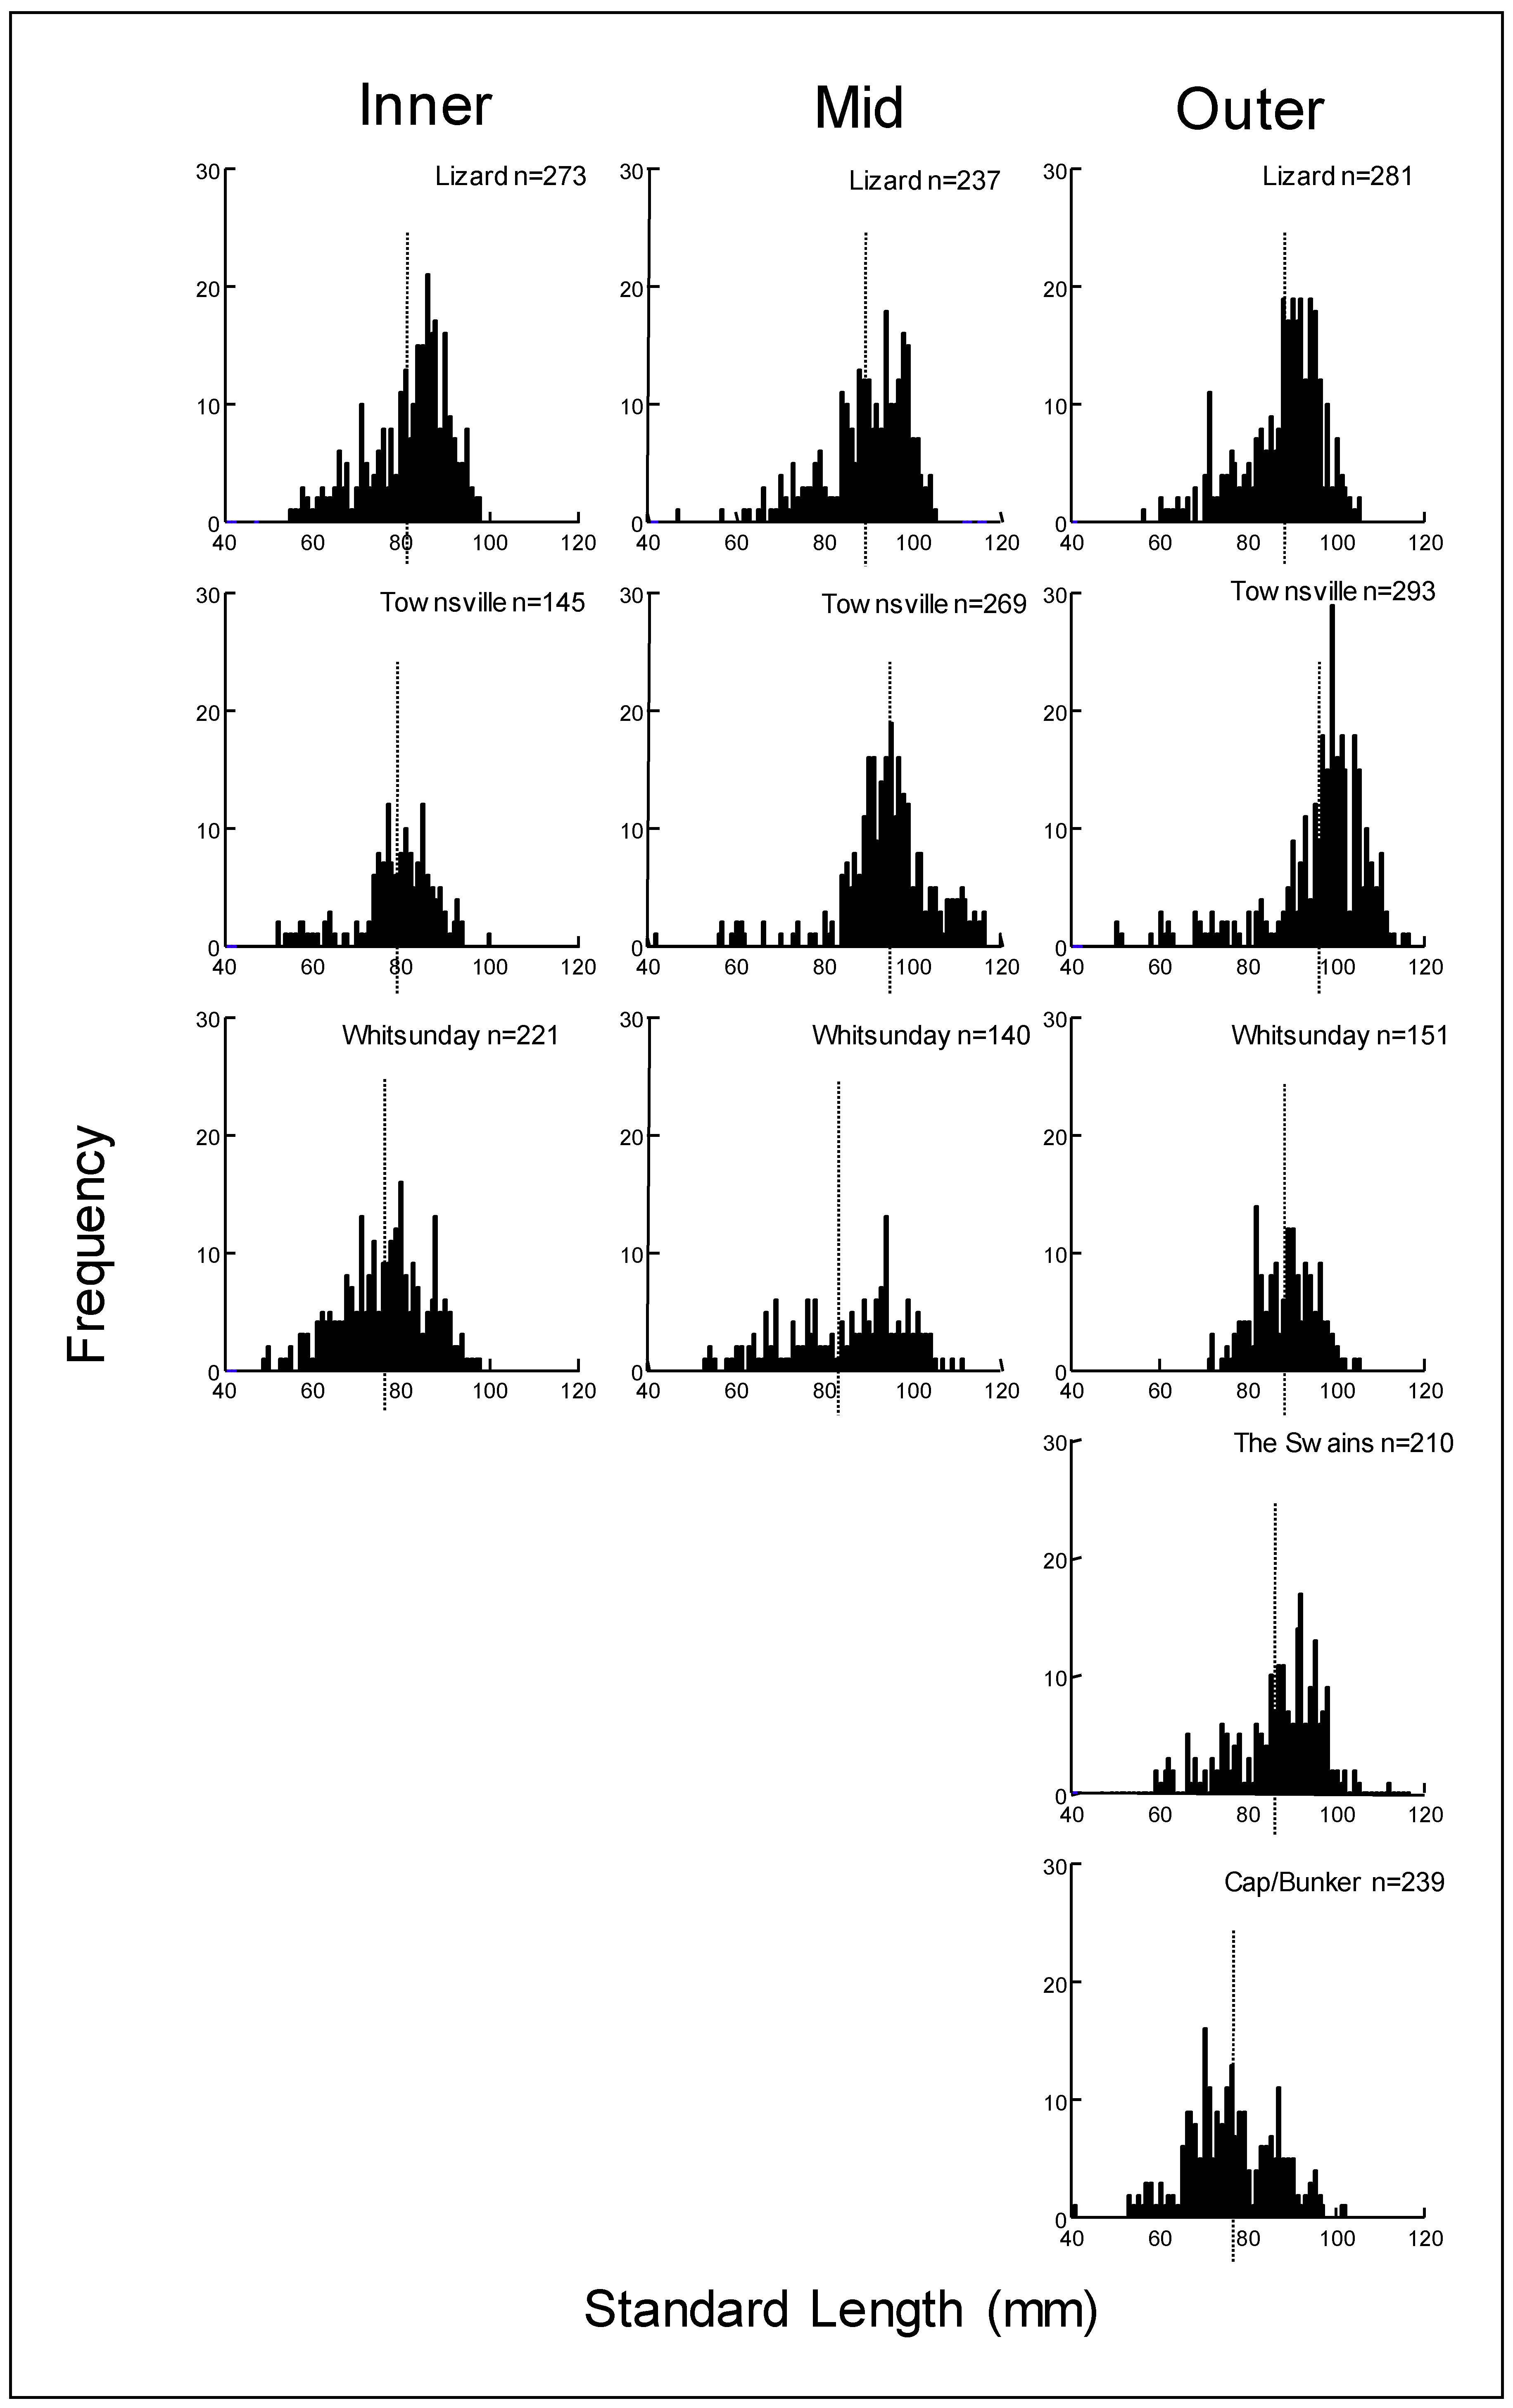
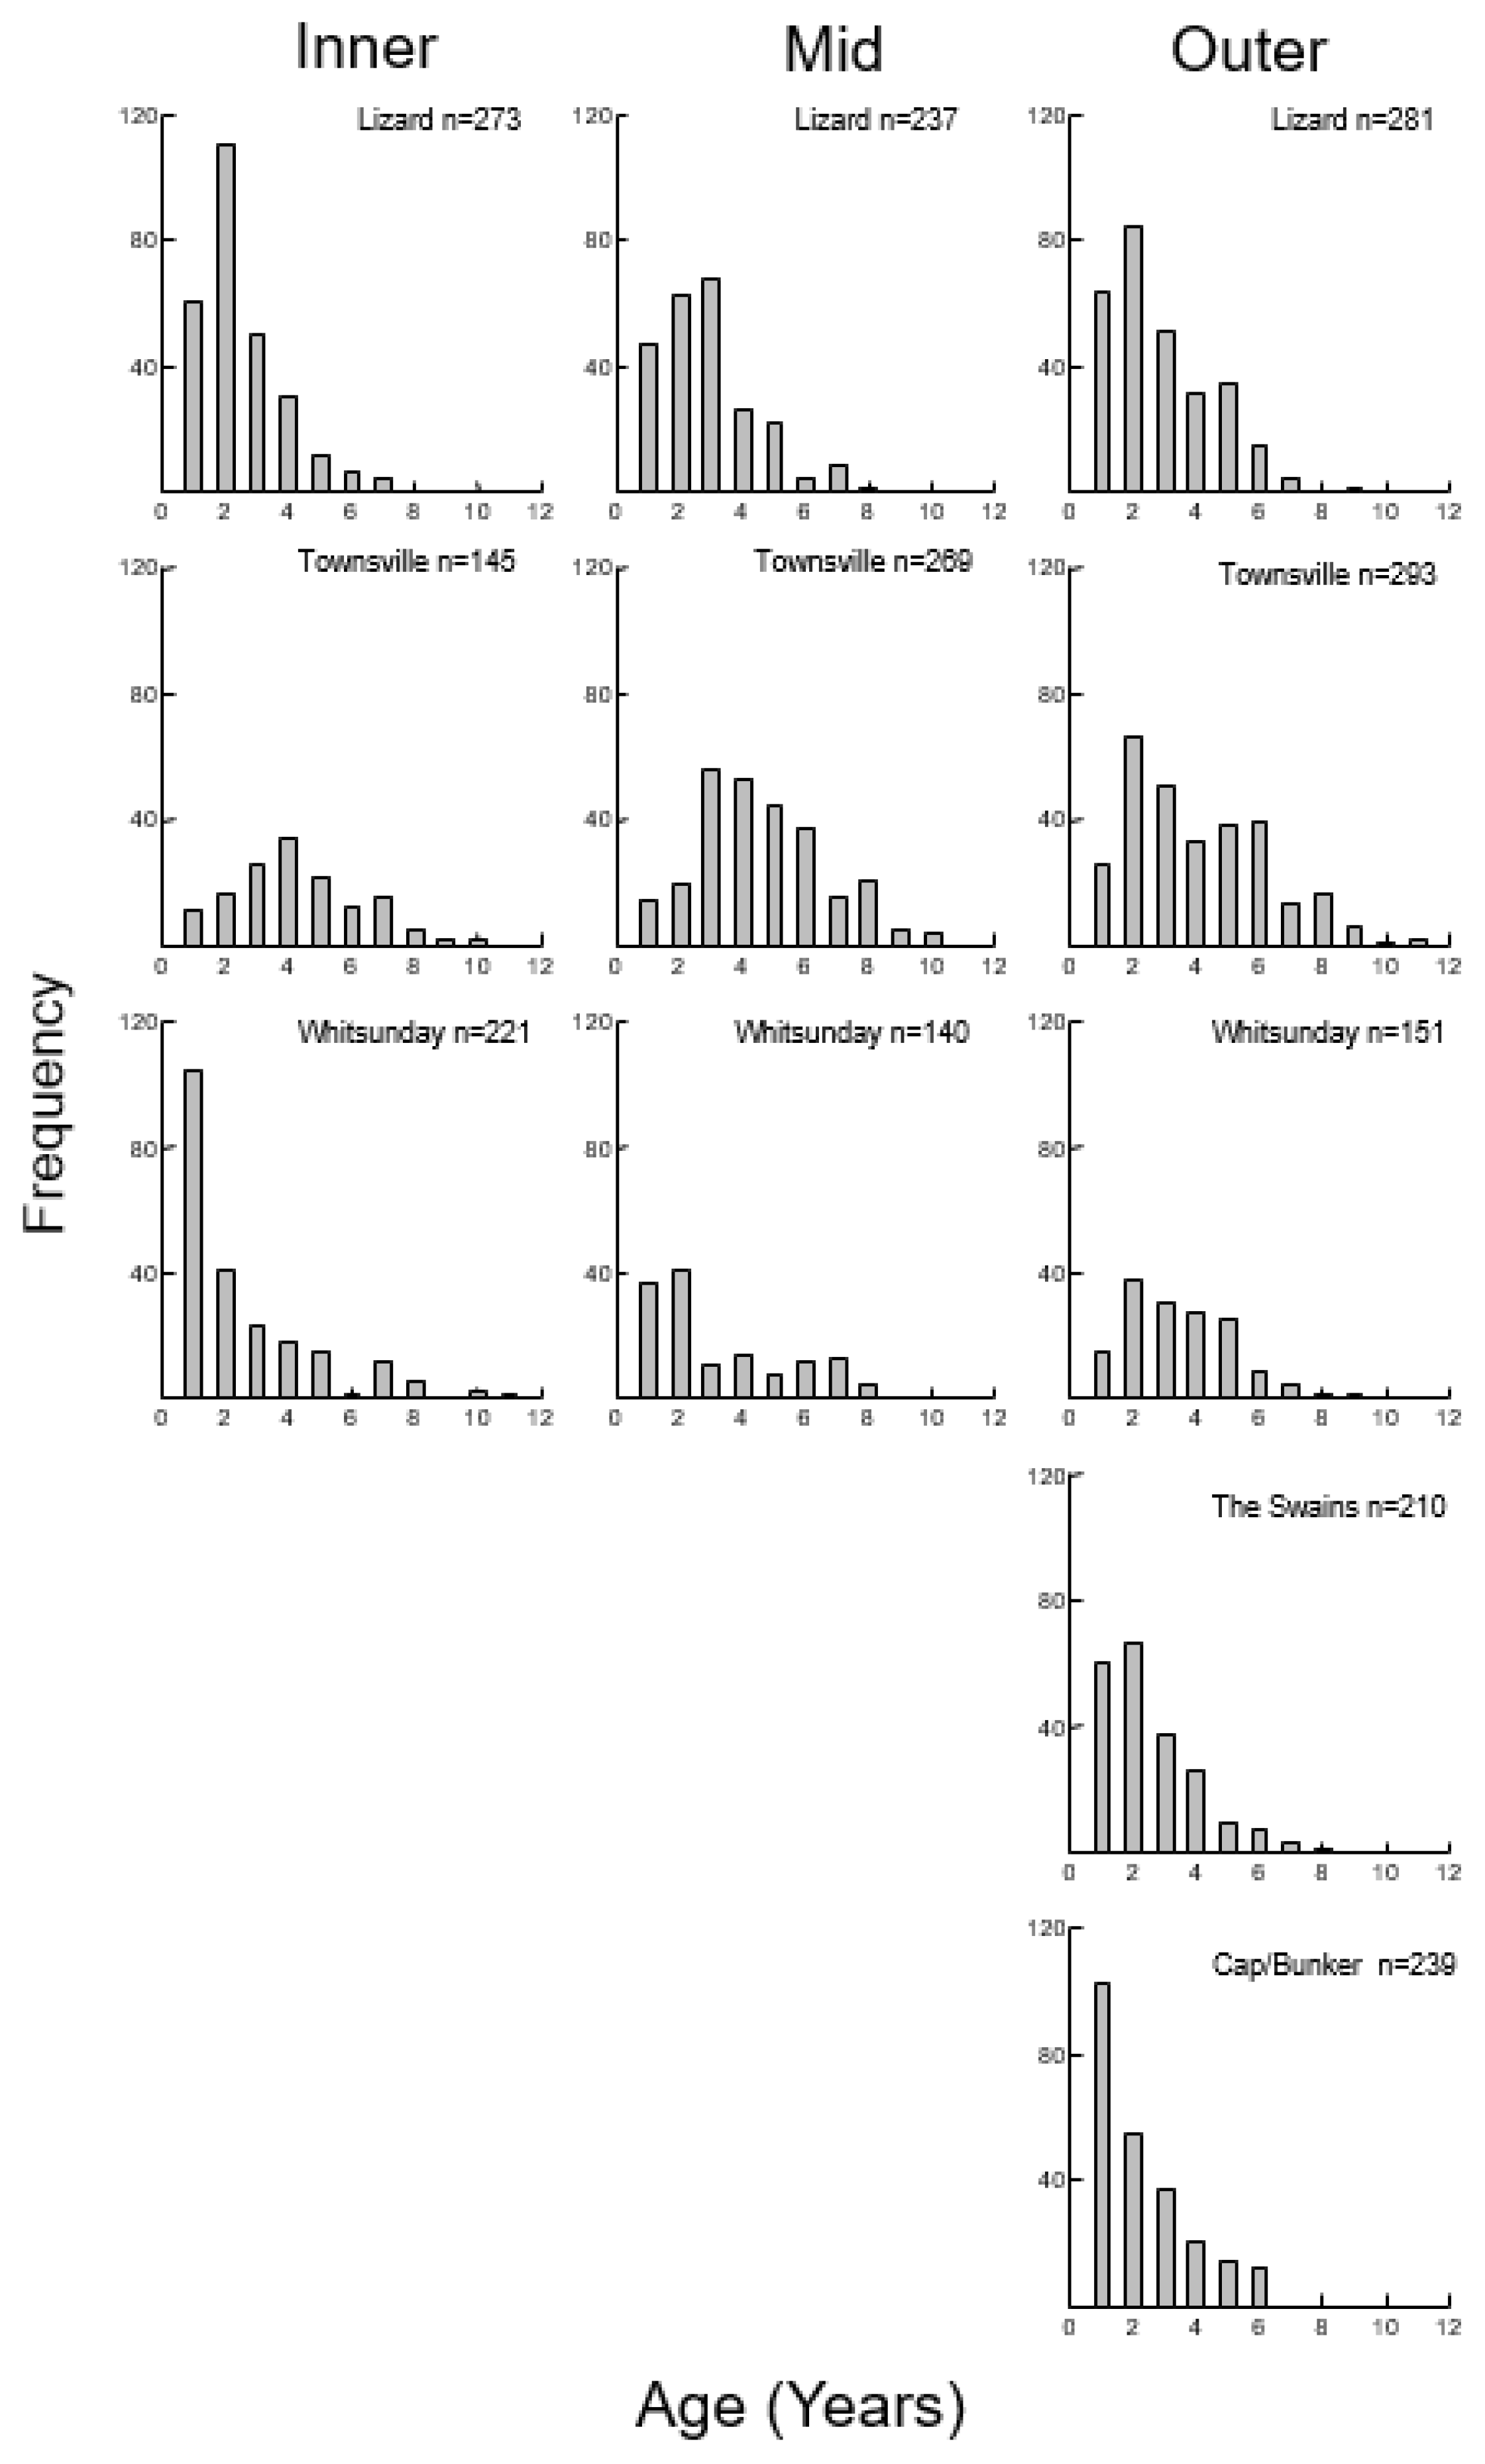
3.2. Size, Age, and Growth
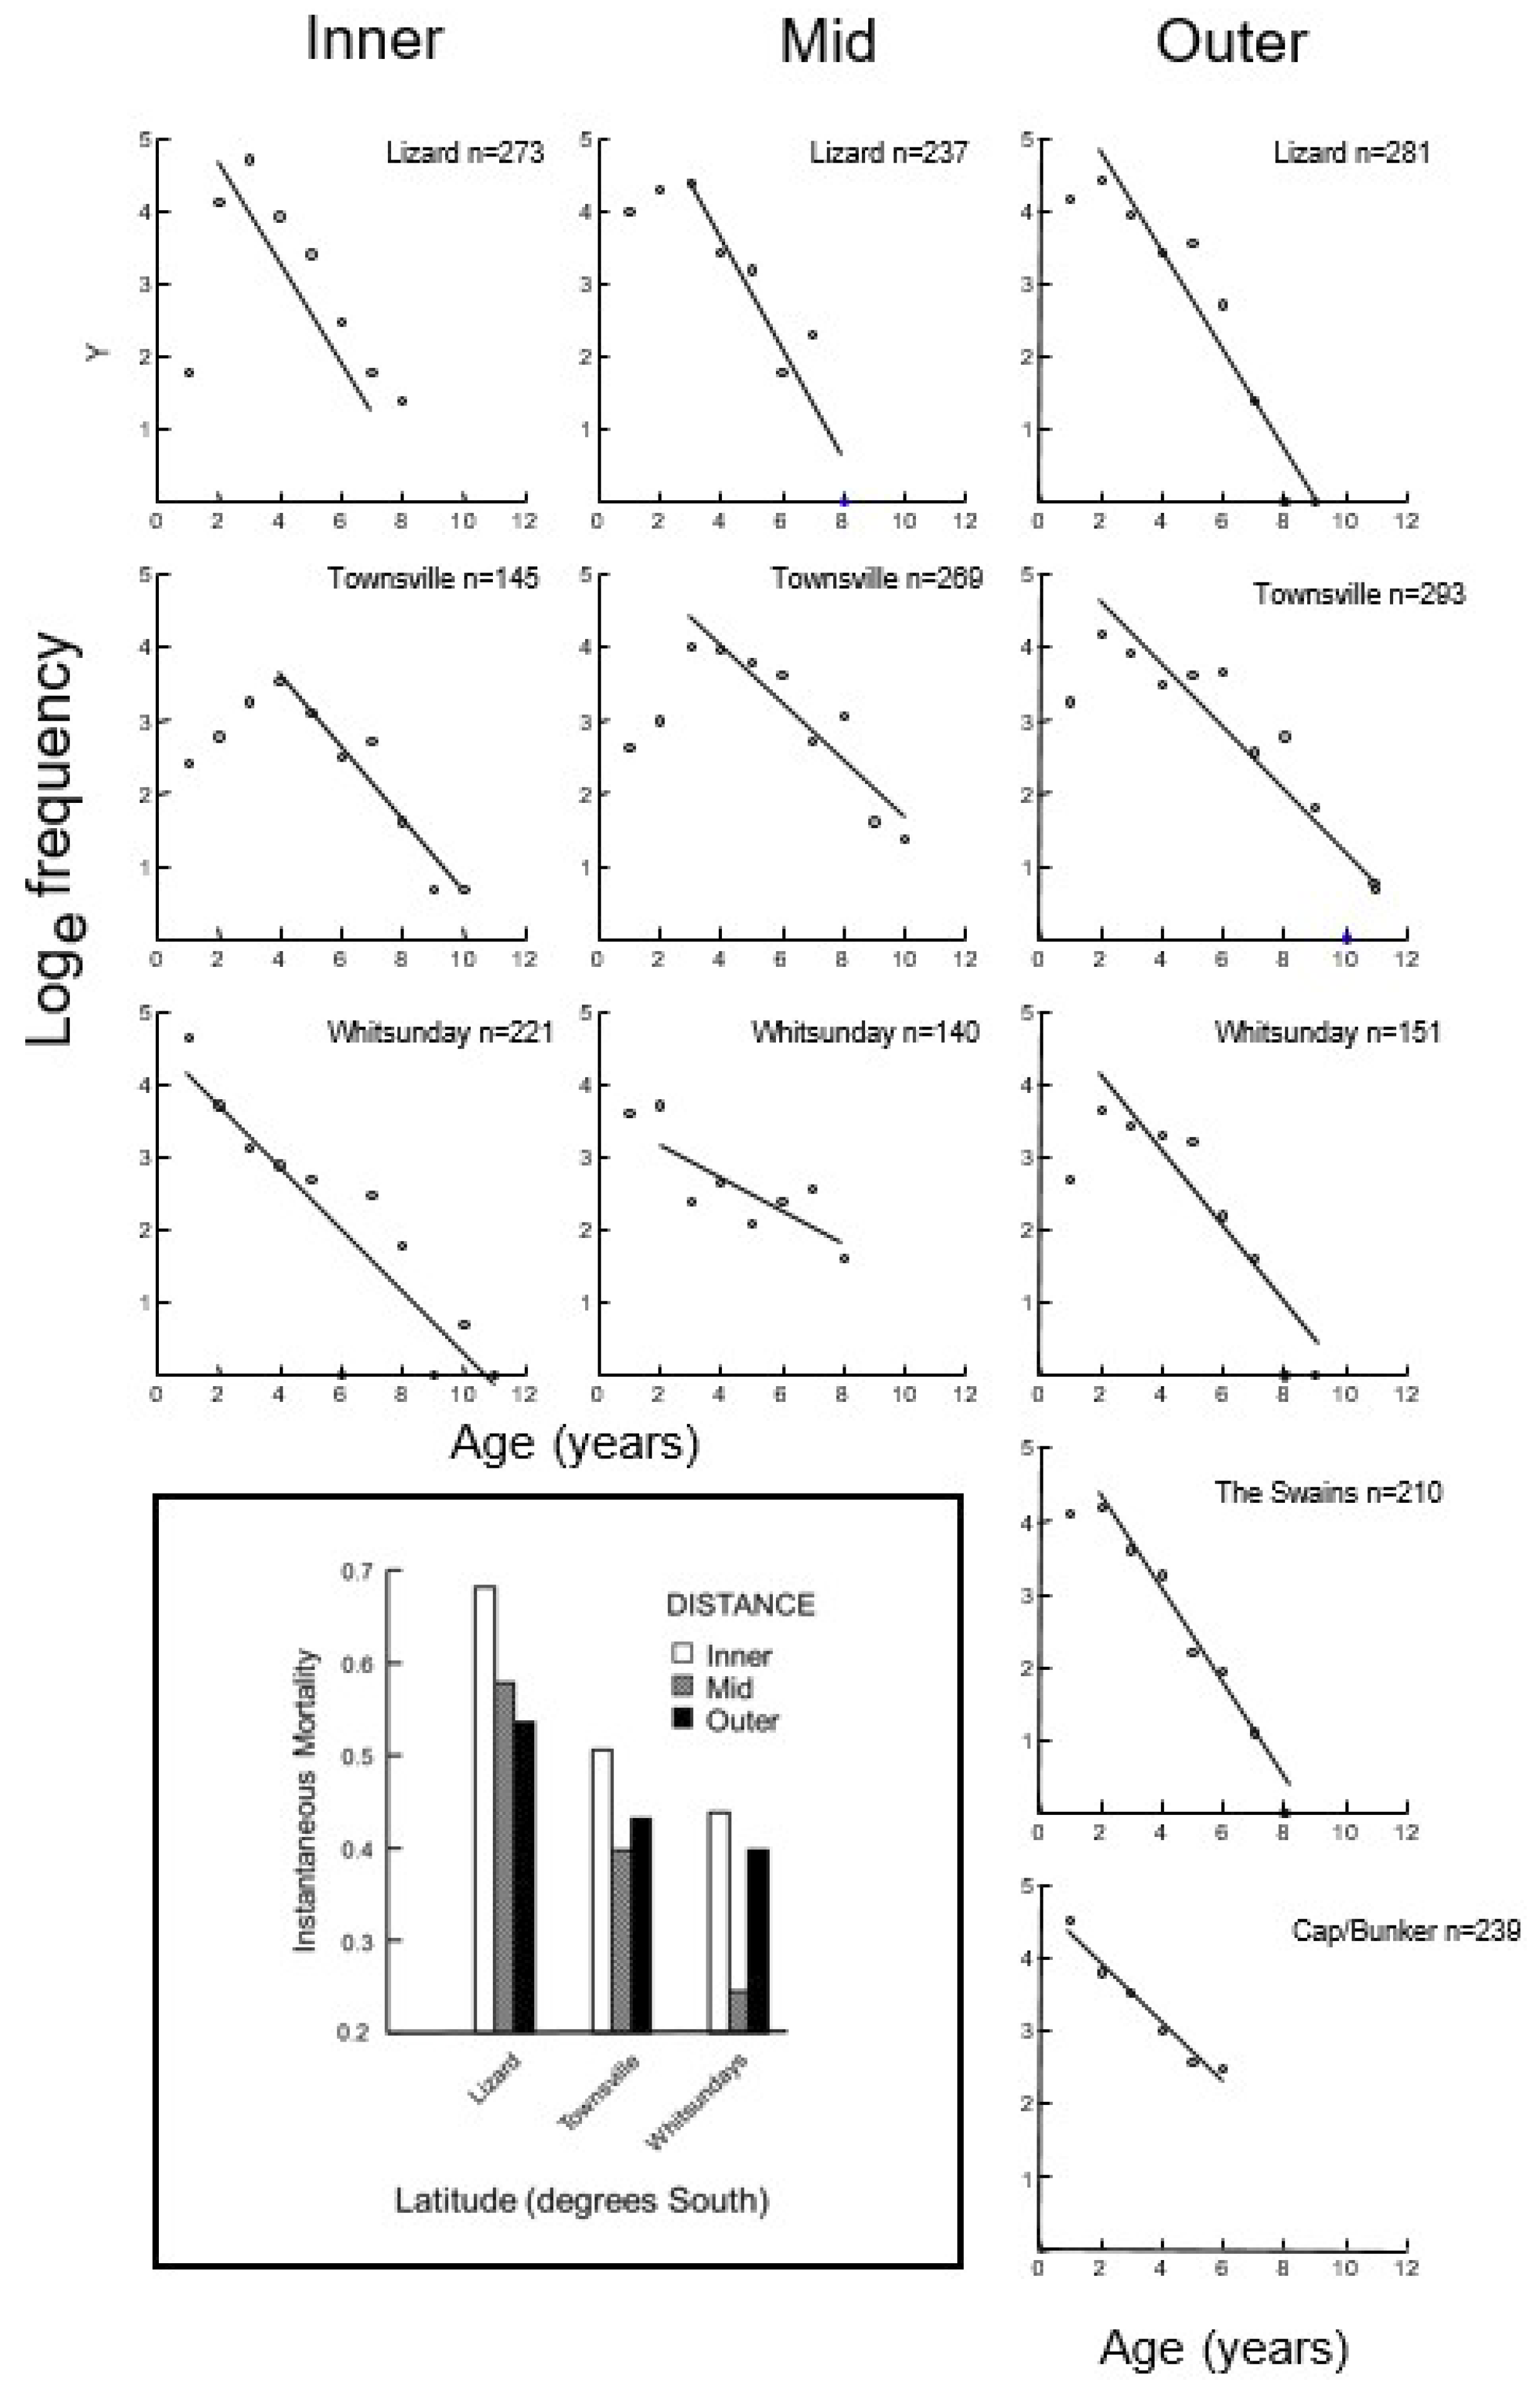
There were consistent patterns of length frequency and maximum length (SLMAX) across the continental shelf at the three latitudes (Figure 2, Table 2). Fish were generally shorter at all inner reefs and it was rare for fish to be over 95 mm SL. In contrast, A. polyacanthus were over 100 mm SL at mid and outer reefs, where this was most obvious at the Townsville latitude (max lengths of fish were 6–20 mm shorter at inner reefs when compared to maxima recorded at mid and outer reefs). SLMAX of the largest 10% of fish showed a similar trend to SLMAX. Although there was a clear pattern for the largest fish on reefs to be small at inner strata, a significant interaction between distance and latitude indicated that the magnitude of differences varied between inner reefs and those at mid and outer strata (Table 3). The differences across the shelf were least obvious on reefs of the Lizard Island latitude and were greatest at reefs of the Townsville latitude. Local variation in growth between reefs within distance strata was also found (reef (L × D), Table 3), but this did not obscure the broad differences found across the shelf.
Among outer reefs at different latitudes, the only clear pattern was that the size max of A. polyacanthus was at greatest at outer reefs off Townsville. Although 29% of the variation in SL 10% was explained by latitude this factor was not significant (Table 4). Fifty-eight percent of the variation was explained by differences, on a scale of kilometers to 10s of kilometers, between reefs within latitudes, and only 13% at the level of replication. When the SLMAX 10% of fish was considered, there was no relationship between SL and latitude. Furthermore, there were no significant linear relationships between SL max or SLMAX 10% and latitude for fish from all latitude and nested reefs (n = 13); in both cases, ANOVA indicated that the slopes for these linear comparisons were not significantly different from zero.
We had some evidence from outer reefs that temperature was not the only driver of patterns of SL with latitude as both SLMAX and SLMAX 10% were larger at Townsville (116/110 SL) when compared to fish at Lizard (105/102 SL), but sea water temperatures were similar between these latitudes or about a degree warmer at Lizard during the winter (Figure S2, Supplementary Materials). In contrast, SLMAX/SLMAX 10% was similar at Lizard and the Capricorn Bunker group (102/93), where the latter was up to 4 °C cooler (Figure S2, Supplementary Materials). Differences in SLMAX10 were significant among these three latitudes (df = 2, 7; F = 12.2; p < 0.01) and among three reefs within latitudes (df = 6, 27; F = 23.6; p < 0.001).
There was no evidence for variation in AMAX or age 10% for A. polyacanthus at reefs across the shelf and this was consistent at all three latitudes (Figure 3, Table 2, Analysis 1 Table 3). The average age for the oldest 10% (AMAX 10%) was greater at all distances cross-shelf, and this resulted in significant differences among latitudes (Table 3). At broad spatial scales of 10 degrees of latitude, the AMAX of A. polyacanthus at outer reefs was greatest at Lizard, Townsville, and the Whitsundays (range 9–11 years, eight years at the Swains), while no fish was older than six years at the Capricorn Bunker Group. Twenty-one percent of variation in the age of fish was explained by differences between latitudes, but despite this trend, the factor latitude was not significant. There were significant differences between reefs within latitudes, but greatest variation was found at the residual level (63%, Analysis 2, Table 4). There was a significant negative linear relationship between AMAX and latitude (tropical gradient) that explained 34% of the variation; the ANOVA for slopes was significantly different from zero (Figure 4). Rather than a strong counter gradient, the relationship was strongly influenced by highest values of AMAX on Townsville and Whitsundays reefs.
In some cases, replicate reefs within distance strata had different levels of protection, but this did not influence the broad patterns we described for age or size (Table 5). For example, the two inner reefs (Pandora, Havannah; one green, one blue) had a similar SLMAX to each other, but both reefs had much smaller fish than the two outer reefs with different zones where the fish were much larger (Barnett Patches and Myrmidon). Inner reefs at Lizard had a very similar AMAX regardless of zone, as did the two outer reefs compared in the Capricorn Bunker group. Changes in rank were detected for largest and oldest fish by zone, indicating that there was no consistent pattern that could be explained by level of protection (Table S1, Supplementary Materials). There were also no consistent differences in von Bertalanffy parameters between zones in any of the pairs of fished and unfished zones (Table S2, Supplementary Materials). In all cases, the unfished zones were in place for close to the AMAX of A. polyacanthus or twice that.
Acanthochromis polyacanthus grew quickly to Linf at two to three years old (Figure 5). The Linf of fishes at different distances across the shelf concurred with our comparisons of length frequency in that Linf was consistently smallest at inner reefs regardless of latitude. The confidence ellipses shown in the Kimura plots also showed consistently smaller Linf for fish from inner reefs (Figure 6). The effect size was always greatest for inner versus mid and outer reefs (Figure 6A). The rate at which fish grew to Linf (K, Table 2; Figure 5) was highly variable and no consistent patterns were detected either across the shelf or when comparison were made among the five latitudes with outer reefs. There was no significant correlation between K and latitude for 13 reefs over the full latitudinal range of the study (10 degrees); ANOVA indicated the slope of the relationship was not significantly different from zero.
Length at age varied with position across the shelf and it was clear that, although fish from all reefs grew quickly to Linf by about three years old, growth rate to that of L varied with position on the shelf (Figure 5, Table S3, Supplementary Materials). For example, fish cross-shelf at the Townsville latitude at age two were about 71 mm SL compared to 86 and 93 mm SL at mid and outer shelf reefs. By age three, fish were on average 79 mm SL at inner reefs, and 97 and 100 mm SL, respectively, at mid and outer shelf reefs. Significant differences in size at age were detected with distance from shore, and this was true for fish aged two and three (Table S4, Supplementary Materials). There was a consistent pattern of smallest sizes at ages two and three years near shore at all latitudes; however, the magnitude of size differences between inner reefs and those at mid and outer shelf positions varied with latitude, and this resulted in a significant interaction between the factors shelf and latitude (Table S1, Supplementary Materials).

3.3. Mortality

Instantaneous mortality rates ranged from 0.69 at Lizard, inner to 0.245 at Whitsundays, mid (Table 2, Figure 7). Mortality rates were consistently higher at inner shelf reefs (Figure 7). This pattern was also apparent from age–frequency, where the representation of fish greater than four years old was relatively low when compared to mid and outer reefs at the same latitude (Figure 3). Although there was a strong trend for mortality rates to drop with latitude among outer reefs (13 reefs), this relationship was not significant (ANOVA for slopes). The relationship was largely derailed by high mortality rates that were detected at the Swains. When all instantaneous mortality relationships were considered, they explained 41% to 65% of the variation in these relationships. The dependency of the relationships on young and small fish under three years old varied among reefs, but there was no consistency with latitude or distance that could have confounded the conclusions relating to spatial differences.

4. Discussion

The robustness of this study is in the spatial resolution by distance from shore and latitude that is hard to achieve. In short, we could sample large numbers of fish and that allowed us to test hypotheses relating to distance across the shelf and with latitude. The data are unequivocal in that distance across the continental shelf of the GBR had a substantial influence on the growth and size of A. polyacanthus. The findings of this study concur with our earlier study that focused on one latitude, that of Townsville [26]. There is only one other study we are aware of that addresses cross-shelf variation in demographics. Gust et al. demonstrated differences in the demographic characteristics of scarids between mid and outer shelf reefs of the GBR [21]. In this study, significant differences in Linf, growth, and mortality were found. Of course, fish have to be found over the full extent of the GBR or similar geomorphological features for distance across the shelf to be an issue. For many species, they may only be found at one or two distance strata (e.g., Reference [14]), and the danger of confounding latitudinal trends with differences among distances across the shelf would be minimized.
We sampled 11 reef positions over a distance of 1200 km and ~10 degrees of latitude; based on this, we could test hypotheses concerning variation in demographic characteristics with latitude. Even with this unusually high spatial resolution, few latitudinal gradients were detected. In contrast, gradients were detected for other species over a similar spatial range for size, growth, and AMAX (e.g., References [11,36]). For example, Cappo et al. [11] found that the body size of Lutjanus johnii increased with latitude (counter gradient) on the GBR and, therefore, distance from the equator, which concurred with James’s rule. In contrast, we often only found differences between latitudes on a spatial scale of a few hundreds of kilometers, but not between reefs separated by over 1000 kilometers. For example, one of the greatest differences in size max was found from between the two northernmost latitudes, Lizard and Townsville. These locations are bathed in similarly warm waters; thus, perhaps at this spatial region, local factors such as the supply of planktonic food may play a major role on patterns of growth as at least one of our offshore reefs, Myrmidon reef, is well known for upwelling [37,38].
We found variation between reefs within a latitude, both for the largest and oldest fish. Fry and Milton [39] also found variation in demographic metrics within a location that “made it difficult to detect differences with latitude”. They did, however, find variation in Lutjanus malabaricus in size and age over a broad longitudinal range (western to eastern Australia). In contrast to the small-scale variation we found, Williams et al. [40] did not detect differences the growth and AMAX of Lethrinus miniatus among reefs within locations. However, there were differences among regions separated by hundreds of kilometers or up to four degrees; these patterns were consistent when they were compared five years later [41]. Variation in demographics among reefs within a latitude may be due to factors such as the density of conspecifics, availability of prey, and predatory regimes. Ong et al. [42] examined differences in otolith increment spacing, as a proxy for growth, between Lutjanus bohar populations at the same latitude from the west coast of Australia. They argued that the differences they found in local factors such as oceanography and ecological differences were the primary drivers of differences in demographics. Our findings across the continental shelf of the GBR and big differences in SLMAX at some reefs such as Myrmidon (Townsville) align with this view.
Although most of the latitudinal trends we tested for SL, growth, and age were not significant (tropical gradient), we did find a variable, but significant negative relationship between the AMAX of A. polyacanthus and latitude. Piddocke et al. [12] also found a negative relationship between AMAX and temperature and growth for Lutjanus argentimaculatus. There was no relationship for A. polyacanthus between growth and L (K) with latitude. Although seasonal cycles in temperature between 14 and 24° south (S) were about four degrees (Figure S2, Supplementary Materials), greatest latitudinal differences were found between Lizard and Townsville latitudes where seasonal temperature cycles were similar. Latitude is clearly a rough proxy for a temperature gradient given the complexities of oceanography [10]. We also found that SLMAX was similar at the latitudinal extremes in our study where seasonal difference in temperature were greatest; this does not align with the temperature size rule [7]. Of course, differencs in growth may manifest at the more extreme ends of the temperature and food availablilty spectrum. For example, experiments on A. polyacanthus demonstrated that the growth potential of fish can be inhibited regardless of how much food is available at high temperatures (e.g., 31 °C [43]).
The consistency of the relatively small size of fish at inner reefs of the GBR suggests some similarity of the biophysical drivers influencing growth and size maxima. Shallow waters of the GBR can get very warm in the summer and this area is notorious for coral bleaching when reefs further from shore are below the bleaching threshold of 31 °C [44]. It is highly likely that the growth potential of A. polyacanthus can be inhibited at these times, as shown experimentally [43]. Sediment loads are generally higher on inshore reefs [45] and this could reduce the intake of food of a planktivore [46]. We also have some evidence from unpublished plankton samples that the abundance of small plankton (i.e., copepodites etc. retained by a 100-micron mesh) is about one-quarter that of mid and outer reefs. Combinations of these factors, therefore, are most likely drivers for the patterns we found. Furthermore, the patterns are unequivocal because we had an orthogonal design with distance across the shelf and three latitudes that showed similar patterns.
Our findings concur with other studies showing that variation in environmental conditions within a latitude can have a strong influence on demographic characteristics and, in some cases, this variation can be a great as some purported “gradient models” [3]. For example, similarly, Gust et al. [21] and Taylor et al. [22] found differences in size, age maxima, and the timing of sex change in scarids among distances across the shelf of the GBR over a narrow latitudinal range. Gillanders [47] also found great differences in patterns of growth of a large subtropical labrid over spatial scales of kilometers. These studies further emphasize the importance of local factors in determining demographic characteristics. It is possible that tropical gradient models and metabolic theory models are more robust among similar reef habitats such as the oceanic environments studied by Robertson et al. [48]. In contrast, the complexity of a long and wide reef mosaic such as the GBR adds numerous other factors that can influence the demography of fishes.
Mortality may also have a role in the distance across the shelf patterns that we found (e.g., Reference [21]). Mortality rates were consistently highest at inner reefs, and the numbers of fish over four years old were less inshore when compared to mid and outer reefs. Interestingly, the AMAX of inner reefs was similar to mid and outer; it is just that few fish reached ages over 7 years. Accordingly, mortality alone does not explain the patterns in age maxima that we found with distance across the GBR. There can be temporal variation in mortality rates [41], and this is highly likely where the size of pulses in recruitment alter values of Z. The methods for calculating instantaneous mortality assume even recruitment among years. However, this is unlikely to alter the consistency of the pattern of highest mortalities near shore, although more information on temporal patterns of recruitment among distance strata would help resolve this issue.
Although there was a strong trend for mortality rates to drop with latitude, this was not significant. The relationship was largely derailed by high mortality rates that were detected at the Swains. Similarly, no clear latitudinal trend in mortality was found by Williams et al. [40] for Lethrinus miniatus.
Although A. polyacanthus is still considered a single species [27], the variation in coloration that is well known suggests that insipient speciation is likely. It was concluded by Planes and Doherty [29] that fish from the Capricorn Bunker Group and the Swains are in a different genetic clade (Clade 3) to those from Lizard Island to the Whitsundays (Clade 2). Furthermore, these differences could justify separation into two species with another clade for remote reefs in the Coral Sea (Clade 1). A contributing factor to variation in demographic parameters could relate to genetic differences [1,49]. Despite being categorized in different clades, there was considerable overlap in K and Linf for fish from Lizard Island and the Swains (Figure 6). Furthermore, the patterns among distance strata we found were robust regardless of latitude and color morph. Fish were always smallest inshore, for example, at Lizard, where all fish were the brown and white color morph (Figure S1a, Supplementary Materials). At Townsville and more clearly at the Whitsundays, two morphs were found, but fish were always smallest at the inner distance (Figure S1b, Supplementary Materials).
A concern for many aging studies that deal with commercial species such as lutjanids and lethrinids is that natural patterns, be they by distance across the shelf or latitude, can be confounded by differences in fishing pressure that could affect differences in SLMAX, Linf, AMAX, and of course mortality (i.e., a combination of fishing mortality F and natural mortality M [4]). In contrast, the small damselfishes in this study are not subject to a fishery and they do not attract much attention from the aquarium trade. Furthermore, although top-down effects from large predators have the potential to alter density of small prey and affect mortality rates, inverse relationships between the numbers of predators and numbers of prey were detected when comparisons were made between marine sanctuary zones and fish areas at the same latitude [5]. Furthermore, Gust et al. [21] concluded that a contributing factor to differences in AMAX between distance strata was driven by predation, which was two times higher at outer reefs. However, we found no evidence for such patterns in our study.

5. Conclusions

In conclusion, we found that demographic characteristics of A. polyacanthus varied greatly across the continental shelf of the Great Barrier Reef; this pattern was consistent within three latitudes. SLMAX was smallest and growth slowest at inner reefs, and mortality rates were also greatest at this distance; these patterns were consistent regardless of the color morph of fish. A comparison among outer reefs over 10° of latitude detected a tropical gradient of decreased AMAX with an increase in latitude. No other latitudinal trends in Linf, K, and age were detected, but there was significant variation in LMAX and AMAX between outer reefs at the same latitude. No strong temperature effect on SLMAX with latitude was detected. The zoning plan of the GBR did not confound our conclusions in that fish were not consistently larger or older in MPAs or fished zones. We suggest that local environmental factors had the greatest effect on patterns of size and growth, and this should be considered in latitude-based gradient models of fish demographic characteristics.

Supplementary Materials

The following are available online at https://www.mdpi.com/1424-2818/11/5/67/s1: Figure S1: Color morphs of A. polyacanthus; Figure S2: Temperature data at each outer reef at three latitudes; Table S1: Partially hierarchical ANOVA, testing for differences among distances across the shelf and zone (MPA and fished); Table S2: Reef status comparison of age and growth parameters; Table S3: Mean size of A. polyacanthus at ages two and three; Table S4: Three-factor ANOVA; factors: distance and latitude with the response variable SL for fish aged two and three.

Author Contributions

M.J.K. designed the study, collected the fish with coauthors, contributed to the analyses, and drafted the manuscript. M.O. collected the fish with other coauthors, aged fish from otoliths, contributed to the presentation of data, and edited the manuscript. D.W. collected the fish with other coauthors and contributed to the analyses.

Funding

The project was funded by an ARC Grant to M.J.K.

Acknowledgments

We would like to thank J. Hughes, K Arbouin, and the crew of the R.V. Orpheus and M.V. Melantre for field assistance during this study. We also thank the anonymous referees for constructive advice in revising the manuscript. Thanks to Jacqui Stuart for the exquisite images of fish. This is a contribution from Orpheus Island Research Station, One Tree Island Field Station, and the Reef and Ocean Ecology Laboratory at James Cook University.

Conflicts of Interest

The authors declare no conflicts of interest.

References

  1. Conover, D.O.; Brown, J.J.; Ehtisham, A. Countergradient variation in growth of young striped bass (Morone saxatilis) from different latitudes. Can. J. Fish. Aquat. Sci. 1997, 54, 2401–2409. [Google Scholar] [CrossRef]
  2. Boehlert, G.W.; Kappenman, R.F. Variation of growth with latitude of two species of rock fishes (Sebastes pinniger and S. diploproa) from the North Eastern Pacific Ocean. Mar. Ecol. Prog. Ser. 1980, 3, 1–10. [Google Scholar] [CrossRef]
  3. Trip, E.L.; Choat, J.H.; Wilson, D.T.; Robertson, D.R. Inter-oceanic analysis of demographic variation in a widely distributed Indo-Pacific coral reef fish. Mar. Ecol. Prog. Ser. 2008, 373, 97–109. [Google Scholar] [CrossRef] [Green Version]
  4. Hilborn, R.; Walters, C.J. Quantitative Fisheries Stock Assessment; Chapman & Hall: London, UK, 1992. [Google Scholar]
  5. Boaden, A.E.; Kingsford, M.J. Predators drive community structure in coral reef fish assemblages. Ecosphere 2015, 6, 1–33. [Google Scholar] [CrossRef]
  6. Houde, E.D. Comparative growth, mortality, and energetics of marine fish larvae-temperature and implied latitudinal effects. Fish. Bull. 1989, 87, 471–495. [Google Scholar]
  7. Atkinson, D. Temperature and Organism Size: A Biological Law for Ectotherms. In Advances in Ecological Research; Begon, M., Fitter, A.H., Eds.; Academic Press Ltd-Elsevier Science Ltd.: London, UK, 1994; Volume 25, pp. 1–58. [Google Scholar]
  8. Brown, J.H.; Gillooly, J.F.; Allen, A.P.; Savage, V.M.; West, G.B. Toward a metabolic theory of ecology. Ecology 2004, 85, 1771–1789. [Google Scholar] [CrossRef]
  9. Yamahira, K.; Conover, D.O. Intra-Vs. interspecific latitudinal variation in growth: Adaptation to temperature or seasonality? Ecology 2002, 83, 1252–1262. [Google Scholar] [CrossRef]
  10. Choat, J.H.; Robertson, D.R. Age-Based Studies on Coral Reef Fishes. Coral Reef Fishes: Dynamics and Diversity in a Complex Ecosystem; Academic Press: San Diego, CA, USA, 2002. [Google Scholar]
  11. Cappo, M.; Marriott, R.J.; Newman, S.J. James’s rule and causes and consequences of a latitudinal cline in the demography of John’s Snapper (Lutjanus johnii) in coastal waters of Australia. Fish. Bull. 2013, 111, 309–324. [Google Scholar] [CrossRef]
  12. Piddocke, T.P.; Butler, G.L.; Butcher, P.A.; Stewart, J.; Bucher, D.J.; Christidis, L. Age and growth of mangrove red snapper Lutjanus argentimaculatus at its cool-water-range limits. J. Fish Biol. 2015, 86, 1587–1600. [Google Scholar] [CrossRef]
  13. Williams, A.J.; Davies, C.R.; Mapstone, B.D.; Currey, L.M.; Welch, D.J.; Begg, G.A.; Ballagh, A.C.; Choat, J.H.; Murchie, C.D.; Simpfendorfer, C.A. Age-based demography of humpback grouper Cromileptes altivelis: Implications for fisheries management and conservation. Endanger. Species Res. 2009, 9, 67–79. [Google Scholar] [CrossRef]
  14. Williams, D.M. Patterns of distribution of fish communities across the central Great Barrier Reef lagoon. Coral Reefs 1982, 1, 35–43. [Google Scholar] [CrossRef]
  15. Williams, D.M.; Russ, G.; Doherty, P.J. Reef Fish: Large scale distribution and recruitment. Oceanus 1986, 29, 76–82. [Google Scholar]
  16. Russ, G. Distribution and abundance of herbivorous grazing fishes in the central Great Barrier Reef. I. Levels of variability across the entire continental shelf. Mar. Ecol. Prog. Ser. 1984, 20, 23–34. [Google Scholar] [CrossRef]
  17. Williams, D.M.; Hatcher, A.I. Structure of fish communities on outer slopes of inshore, midshelf and outer shelf reefs of the Great Barrier Reef. Mar. Ecol. Prog. Ser. 1983, 10, 239–250. [Google Scholar] [CrossRef]
  18. Furnas, M.J. Catchments and Corals: Terrestrial Runoff to the Great Barrier Reef; Australian Institute of Marine Science: Townsville, Australia, 2003.
  19. Bainbridge, Z.T.; Wolanski, E.; Alvarez-Romero, J.G.; Lewis, S.E.; Brodie, J.E. Fine sediment and nutrient dynamics related to particle size and floc formation in a Burdekin River flood plume, Australia. Mar. Pollut. Bull. 2012, 65, 236–248. [Google Scholar] [CrossRef]
  20. Wolanski, E. Oceanographic Processes of Coral Reefs: Physical and Biological Links in the Great Barrier Reef; CRC Press: Boca Raton, FL, USA, 2001. [Google Scholar]
  21. Gust, N.; Choat, J.H.; Ackerman, J.L. Demographic plasticity in tropical reef fishes. Mar. Biol. 2002, 140, 1039–1051. [Google Scholar]
  22. Taylor, B.M.; Brandl, S.J.; Kapur, M.; Robbins, W.D.; Johnson, G.; Huveneers, C.; Renaud, P.; Choat, J.H. Bottom-up processes mediated by social systems drive demographic traits of coral-reef fishes. Ecology 2018, 99, 642–651. [Google Scholar] [CrossRef]
  23. Russ, G.R.; Alcala, A.C. Effects of intense fishing pressure on an assemblage of coral reef fish. Mar. Ecol. Prog. Ser. 1989, 56, 13–27. [Google Scholar] [CrossRef]
  24. Babcock, R.C.; Shears, N.T.; Alcala, A.C.; Barrett, N.S.; Edgar, G.J.; Lafferty, K.D.; McClanahan, T.R.; Russ, G.R. Decadal trends in marine reserves reveal differential rates of change in direct and indirect effects. Proc. Natl. Acad. Sci. USA 2010, 107, 18256–18261. [Google Scholar] [CrossRef] [PubMed] [Green Version]
  25. Williamson, D.H.; Russ, G.R.; Ayling, A.M. No-take marine reserves increase abundance and biomass of reef fish on inshore fringing reefs of the Great Barrier Reef. Environ. Conserv. 2004, 31, 149–159. [Google Scholar] [CrossRef]
  26. Kingsford, M.J.; Hughes, J.M. Patterns of growth, mortality and size of a tropical damselfish Acanthochromis polyacanthus across the continental shelf of the Great Barrier Reef. Fish. Bull. 2005, 103, 561–573. [Google Scholar]
  27. Allen, G.R. Damselfishes of the World; Mergus: Melle, Germany, 1991. [Google Scholar]
  28. Allen, G.R. Damselfishes of the South Seas; TFH Publications: Neptune Cuty, NJ, USA, 1975. [Google Scholar]
  29. Planes, S.; Doherty, P.J.; Bernardi, G. Strong genetic divergence among populations of a marine fish with limited dispersal, Acanthochromis polyacanthus, within the Great Barrier Reef and the Coral Sea. Evolution 2001, 55, 2263–2273. [Google Scholar] [CrossRef] [PubMed]
  30. Atkinson, A.; Siegel, V.; Pakhomov, E.; Rothery, P. Long-term decline in krill stock and increase in salps within the southern ocean. Nature 2004, 432, 100–103. [Google Scholar] [CrossRef] [PubMed]
  31. Underwood, A.J. Experiments in Ecology: Their Logical Design and Interpretation Using Analysis of Variance; Cambridge University Press: Cambridge, UK, 1997. [Google Scholar]
  32. Schnute, J. A versatile growth model with statistically stable parameters. Can. J. Fish. Aquat. Sci. 1981, 38, 1128–1140. [Google Scholar] [CrossRef]
  33. Kimura, D.K. Likelihood methods for comparison of von Bertalanffy growth curves. Fish. Bull. 1980, 77, 765–776. [Google Scholar]
  34. Pauly, D. Population dymanics in tropical waters. ICLARM Stud. Rev. 1984, 8, 1–325. [Google Scholar]
  35. Ricker, W.E. Computation and Interpretation of Biological Statistics of Fish Populations; Department of the Environment: Canberra, Australia, 1975.
  36. Kritzer, J.P. Variation in the population biology of stripey bass Lutjanus carponotatus within and between two island groups on the Great Barrier Reef. Mar. Ecol. Prog. Ser. 2002, 243, 191–207. [Google Scholar] [CrossRef] [Green Version]
  37. Walther, B.D.; Kingsford, M.J.; McCulloch, M.T. Environmental Records from Great Barrier Reef Corals: Inshore versus Offshore Drivers. PLoS ONE 2013, 8, 11. [Google Scholar]
  38. Kingsford, M.J.; Hughes, J.M.; Patterson, H.M. Otolith chemistry of the non-dispersing reef fish Acanthochromis polyacanthus: Cross-shelf patterns from the central Great Barrier Reef. Mar. Ecol. Prog. Ser. 2009, 377, 279–288. [Google Scholar] [CrossRef]
  39. Fry, G.C.; Milton, D.A. Age, growth and mortality estimates for populations of red snappers Lutjanus erythropterus and L. malabaricus from northern Australia and eastern Indonesia. Fish. Sci. 2009, 75, 1219–1229. [Google Scholar] [CrossRef]
  40. Williams, A.J.; Davies, C.R.; Mapstone, B.D.; Russ, G.R. Scales of spatial variation in demography of a large coral-reef fish - an exception to the typical model? Fish. Bull. 2003, 101, 673–683. [Google Scholar]
  41. Williams, A.J.; Mapstone, B.D.; Davies, C.R. Spatial patterns in cohort-specific mortality of red throat emperor, Lethrinus miniatus, on the Great Barrier Reef. Fish Res. 2007, 84, 328–337. [Google Scholar] [CrossRef]
  42. Ong, J.J.L.; Rountrey, A.N.; Marriott, R.J.; Newman, S.J.; Meeuwig, J.J.; Meekan, M.G. Cross-continent comparisons reveal differing environmental drivers of growth of the coral reef fish, Lutjanus bohar. Coral Reefs 2017, 36, 195–206. [Google Scholar] [CrossRef]
  43. Munday, P.L.; Kingsford, M.J.; O’Callaghan, M.D.; Donelson, J.M. Elevated temperature restricts growth potential of the coral reef fish Acanthochromis polyacanthus. Coral Reefs 2008, 27, 927–931. [Google Scholar] [CrossRef]
  44. Hughes, T.P.; Kerry, J.T.; Baird, A.H.; Connolly, S.R.; Dietzel, A.; Eakin, C.M.; Heron, S.F.; Hoey, A.S.; Hoogenboom, M.O.; Liu, G.; et al. Global warming transforms coral reef assemblages. Nature 2018, 556, 492–496. [Google Scholar] [CrossRef]
  45. Wolanski, E.; Richmond, R.; McCook, L.; Sweatman, H. Mud, marine snow and coral reefs-The survival of coral reefs requires integrated watershed-based management activities and marine conservation. Am. Sci. 2003, 91, 44–51. [Google Scholar] [CrossRef]
  46. Wenger, A.S.; Johansen, J.L.; Jones, G.P. Increasing suspended sediment reduces foraging, growth and condition of a planktivorous damselfish. J. Exp. Mar. Biol. Ecol. 2012, 428, 43–48. [Google Scholar] [CrossRef]
  47. Gillanders, B.M. Comparison of growth rates between estuarine and coastal reef populations of Achoerodus viridis (Pisces: Labridae). Mar. Ecol. Prog. Ser. 1997, 146, 283–287. [Google Scholar] [CrossRef]
  48. Robertson, D.R.; Ackerman, J.L.; Choat, J.H.; Posada, J.M.; Pitt, J. Ocean surgeonfish Acanthurus bahianus. I. The geography of demography. Mar. Ecol. Prog. Ser. 2005, 295, 229–244. [Google Scholar] [CrossRef]
  49. Vigliola, L.; Meekan, M.G. Size at hatching and planktonic growth determine post-settlement survivorship of a coral reef fish. Oecologia 2002, 131, 89–93. [Google Scholar] [CrossRef]
Figure 1. Location of latitudes sampled for Acanthochromis polyacanthus on the Great Barrier Reef (GBR) with inserts indicating latitudinal positions as follows: Lizard (a), Townsville (b), Whitsunday (c), Swains (d), and Capricorn/Bunker (e). Outlines of the color morphs of Acanthochromis polyacanthus by latitude are provided; larger images in color are provided in Figure S1 (Supplementary Materials).
Diversity 11 00067 g001
Figure 2. Length–frequency distributions for A. polyacanthus collected from the 11 positions on the GBR (reefs pooled within distances). The mean for each histogram is presented as a dotted line.
Diversity 11 00067 g002
Figure 3. Age–frequency distributions for A. polyacanthus collected from the 13 reefs pooled within distances at each latitude.
Diversity 11 00067 g003
Figure 4. The relationship between age max (AMAX) and latitude for A. polyacanthus from 13 outer reefs only. Collections from all reefs are included in this analysis with a minimum of 66 fish (range 66–155) collected at any one reef (n = 13 reefs). R2 = 0.34, ANOVA for slopes, F1,11 = 5.74; p < 0.03.
Diversity 11 00067 g004
Figure 5. Von Bertalanffy growth curves for A. polyacanthus collected with distance across the shelf and with latitude (reefs pooled within distances at each latitude).
Diversity 11 00067 g005
Figure 6. Kimura plots showing 95% confidence ellipses for the parameters K (growth coefficient) and L (mean asymptotic length) for (A) latitudes with inner mid and outer collection reefs and (B) latitudes where collections where only made at outer reefs.
Diversity 11 00067 g006
Figure 7. Age-based instantaneous mortality rates for A. polyacanthus collected with distance across the shelf and with latitude (reefs pooled within distances and latitude). The lower left panel presents instantaneous mortality by distance for each of the three latitudes sampled in this orthogonal combination.
Diversity 11 00067 g007
Table 1. Location and numbers of Acanthochromis polyacanthus collected from September 2001 to January 2006. The Townsville samples are those of Kingsford and Hughes [26]. Reefs are underlined if they were marine protected areas (MPAs); otherwise, they are reefs where fishing was allowed. * No Name reef was only used for Analysis 4.
LatitudeShelfTotal nReefnDates Collected
LizardInner278Martin162Nov 2004
Linnet116Nov 2004
Mid237Eagle Islet99Dec 2001
North Direction Is.57Dec 2001
MacGillivray111Dec 2001
Outer336Yonge 155Dec 2001
Day 138Dec 2001
No Name*43Dec 2001
TownsvilleInner156Havannah Island70Sep 2001
Orpheus Island41Sep 2001
Pandora45Sep 2001
Mid 286Britomart88Oct 2001
Bramble105Oct 2001
Slashers93Oct 2001
Outer298Barnett Patches116Oct 2001
Pith100Oct 2001
Myrmidon82Oct 2001
WhitsundayInner232Hook Island105Sep 2003
South Mole 127Sep 2003
Mid 173Line84Sep 2003
Net 89Sep 2003
Outer169Elizabeth79Sep 2003
Ellen90Sep 2003
SwainsOuter218Hixson Cay82Jan 2006
Sweetlips70Jan 2006
Sandshoe66Jan 2006
Cap/BunkerOuter256One Tree Island97Jan/Feb 2002
Lamont73Jan/Feb 2002, Feb 2006
Heron Island86Jan/Feb 2002
Table 2. Parameters from von Bertalanffy growth models and instantaneous mortality on the fishes collected from different distances across the shelf and latitude strata. The age max (AMAX; in years) and standard length max (SLMAX; in mm) are provided, as well as mean age and size for the top 10% of fish. ASR = annual survival rate; LAT = latitude.
LatitudeShelfLAT (°S)nLinfKT0Mortality m(r2)ASR (%)AMAXMean Age 10%SLMAXMean SL 10%
Lizard IslandInner14°27388.641.38−0.040.681 (0.61)5175.99894
Mid14°23794.531.52−0.040.578 (0.52)4786.0105102
Outer14°28193.131.55−0.040.536 (0.54)5095.8105100
TownsvilleInner18°14582.011.06−0.060.506 (0.55)60108.010092
Mid18°26997.851.06−0.050.398 (0.47)67108.5120112
Outer18°293101.161.16−0.040.432 (0.65)65118.3116110
WhitsundaysInner19°22183.171.77−0.040.438 (0.35)65117.69892
Mid19°14094.961.14−0.050.245 (0.55)8087.4111104
Outer19°15190.401.64−0.030.398 (0.41)5696.610499
SwainsOuter22°21094.051.45−0.040.617 (0.64)5185.7112100
Capricorn BunkerOuter23°23980.841.58−0.040.414 (0.49)6665.510293
Table 3. Results of Analysis 1, a partially hierarchical ANOVA, testing for differences among three distances across the shelf and three latitudes; fish were sampled at two reefs for each combination of the main factors (n = 4 fish per reef); dependent variable was standard length top 10% (SLMAX 10%) or age top 10% (AMAX 10%). Distance and latitude were tested as fixed factors and site as random. C = Cochran’s test for homogeneity of the data, k = 18, df = 3, * p < 0.05; *** p < 0.001; ns = not significant.
SL 10%
C = 0.21, ns
Age 10%
C = 0.14, ns
Source of variationdfMSFMSF
Latitude215.70.3518.019.6 ***
Distance2874.419.3 ***1.431.55
L × D4264.55.8 *5.05.4 *
Reef (L × D)945.210.3 ***0.921.15
Residual604.4 0.79
Table 4. Results of Analysis 2, a nested ANOVA, testing for differences among five latitudes with two reefs nested per latitudes (n = 7); dependent variables were standard length top 10% and age top 10%. Variance components describe the variation contributed to each factor as a percentage. The denominator MS for latitude is Reef (Lat) and that of Reef (Lat) is the residual; * p < 0.05; *** p < 0.001.
SLMAX 10%AMAX 10%
Source of variationdfMSVariance Component %MSVariance Component %
Latitude4486.7 ns2912.95 ns21
Reef(Lat)5247.3 ***584.67 *15
Residual607.9131.7664
Table 5. The influence of marine protection from fishing on demographic characteristic of Acanthochromis polyacanthus. Summary statistics for both SL and age data are presented as mean (standard error; SE) range. Three-way partially hierarchical ANOVAs are presented for the factors distance (D), zone (Z), D × Z, location(distance) and location(distance × Z in Table S2 (Supplementary Materials); significant factors are listed here. Factor zone: treatments marine protected area (MPA) and fished. Details of von Bertalanffy parameters by reef and zone are provided in Table S2 (Supplementary Materials).
(a) The top 10% by size (SLMAX 10%); the factor location (Distance × Z) was significant.
DistanceLatitudeMPAFished
Inner (Location 1)Lizard95.3 (0.7) 397.5 (1.3) 6
Inner (Location 2)Townsville87.5 (0.9) 491.5 (0.6) 3
Outer (Location1)Townsville111.3 (1.3) 5113 (1.1) 5
Outer (Location 2)Capricorn Bunker82 (0.9) 499 (1.5) 6
(b) The top 10% of fish by age (AMAX 10%); the interaction Distance × Zone was significant.
DistanceLatitudeMPAFished
Inner (Location 1)Lizard6 (0) 06.8 (1) 2
Inner (Location 2)Townsville6.8 (0.3) 17.8 (1) 2
Outer (Location 1)Townsville9.5 (0.6) 39 (0.7) 3
Outer (Location 2)Capricorn Bunker6 (0) 06 (0) 0

