<?xml version="1.0" encoding="UTF-8"?>
<!DOCTYPE article PUBLIC "-//NLM//DTD Journal Publishing DTD v2.3 20070202//EN" "journalpublishing.dtd">
<article xmlns:xlink="http://www.w3.org/1999/xlink" xml:lang="en" article-type="research-article">
<front>
<journal-meta>
<journal-id journal-id-type="publisher-id">ijms</journal-id>
<journal-title>International Journal of Molecular Sciences</journal-title>
<abbrev-journal-title>Int. J. Mol. Sci.</abbrev-journal-title>
<issn pub-type="epub">1422-0067</issn>
<publisher>
<publisher-name>Molecular Diversity Preservation International (MDPI)</publisher-name></publisher></journal-meta>
<article-meta>
<article-id pub-id-type="publisher-id">ijms-09-00638</article-id>
<article-categories>
<subj-group>
<subject>Full Research Paper</subject></subj-group></article-categories>
<title-group>
<article-title>Specific siRNA Targeting the Receptor for Advanced Glycation End Products Inhibits Experimental Hepatic Fibrosis in Rats</article-title></title-group>
<contrib-group>
<contrib contrib-type="author">
<name><surname>Xia</surname><given-names>Jin-Rong</given-names></name></contrib>
<contrib contrib-type="author">
<name><surname>Liu</surname><given-names>Nai-Feng</given-names></name><xref ref-type="corresp" rid="c1-ijms-09-00638">*</xref></contrib>
<contrib contrib-type="author">
<name><surname>Zhu</surname><given-names>Nai-Xun</given-names></name></contrib>
<aff id="af1-ijms-09-00638">Department of Gastroenterology, Zhong Da Hospital, Southeast University, Nanjing 210009, China</aff></contrib-group>
<author-notes>
<corresp id="c1-ijms-09-00638">
<label>*</label>Author to whom Correspondence should be addressed; Email:
<email>liunf@seu.edu.cn</email></corresp></author-notes>
<pub-date pub-type="epub">
<day>24</day>
<month>4</month>
<year>2008</year></pub-date>
<pub-date pub-type="collection">
<month>4</month>
<year>2008</year></pub-date>
<volume>9</volume>
<issue>4</issue>
<fpage>638</fpage>
<lpage>661</lpage>
<history>
<date date-type="received">
<day>13</day>
<month>1</month>
<year>2008</year></date>
<date date-type="rev-recd">
<day>17</day>
<month>4</month>
<year>2008</year></date>
<date date-type="accepted">
<day>22</day>
<month>4</month>
<year>2008</year></date></history>
<copyright-statement>© 2008 by MDPI</copyright-statement>
<copyright-year>2008</copyright-year>
<abstract>
<p>Receptor for advanced glycation end products (RAGE) was studied in different stages of carbon tetrachloride induced hepatic fibrosis (HF), and effect of its gene silencing in the HF development was evaluated in rats. Silencing RAGE expression by specific siRNA effectively suppressed NF-κB activity, hepatic stellate cell activation, and accumulation of extracellular matrix proteins in the fibrotic liver, and also greatly improved the histopathology and the ultrastructure of liver cells. These effects may be partially mediated by the inhibition on IκBα degradation. RAGE gene silencing effectively prevented liver from fibrosis, therefore it offers a potential pharmacological tool for anti-HF gene therapy.</p></abstract>
<kwd-group>
<kwd>Receptor for advanced glycation end products (RAGE)</kwd>
<kwd>small interfering RNA (siRNA)</kwd>
<kwd>hepatic stellate cells (HSCs)</kwd>
<kwd>hepatic fibrosis (HF)</kwd>
<kwd>gene therapy</kwd></kwd-group></article-meta></front>
<body>
<sec sec-type="intro">
<title>1. Introduction</title>
<p>Hepatic fibrosis (HF) is a stress response to chronic liver injury, including hepatocyte injury along with inflammatory response and its subsequent tissue remodeling [<xref ref-type="bibr" rid="b1-ijms-09-00638">1</xref>–<xref ref-type="bibr" rid="b2-ijms-09-00638">2</xref>]. Consequently, a large amount of extracellular matrix (ECM) proteins, mainly including type I and III collagen, forms fibrotic scars in liver parenchyma. The activation of hepatic stellate cells (HSCs) and their transition to myofibroblasts (MFs), which express alpha-smooth muscle actin (α-SMA), and the upregulated expression of type I and III collagen genes are the pivotal processes in HF [<xref ref-type="bibr" rid="b3-ijms-09-00638">3</xref>–<xref ref-type="bibr" rid="b4-ijms-09-00638">4</xref>].</p>
<p>Several cell membrane receptors, cytokines, and growth factors as well as extracellular matrix components regulate HSCs/ MFs migration, proliferation, and apoptosis. Of these, the receptor for advanced glycation end products (RAGE) plays a key role in liver fibrogenesis, because it is involved in the spreading and migration of activated HSCs/MFs [<xref ref-type="bibr" rid="b5-ijms-09-00638">5</xref>]. Previous studies have shown that the repertoire of ligands of RAGE, a member of the immunoglobulin superfamily of cell surface molecules, includes advanced glycation end products (AGEs), amyloid fibrils, amphoterins and S100/calgranulins [<xref ref-type="bibr" rid="b6-ijms-09-00638">6</xref>]. And RAGE is a signal transduction receptor for AGEs [<xref ref-type="bibr" rid="b7-ijms-09-00638">7</xref>]. Interaction of RAGE with AGEs induces oxidant stress, triggers the generation of reactive oxygen species (ROS), and initiates a cascade of signal transduction events involving, at least in part, NF-κB, p21ras, p44/p42 mitogen-activated protein kinases, ERK1/2 kinase, and NAPH oxidase [<xref ref-type="bibr" rid="b8-ijms-09-00638">8</xref>, <xref ref-type="bibr" rid="b9-ijms-09-00638">9</xref>]. In vitro and in vivo studies confirmed that AGE-RAGE interaction resulted in the generation of thiobarbituric acid reactive substances (TBARS), increased the level of mRNA of heme oxygenase-1, enhanced nuclear translocation of NF-κB, and increased endothelial expression of vascular cell adhesion molecule-1 (VCAM-1) and endothelial permeability [<xref ref-type="bibr" rid="b9-ijms-09-00638">9</xref>]. Therefore, RAGE plays an important role in regulating the cell adhesion and cytokine signaling pathways.</p>
<p>Overexpression of RAGE has been observed in renal and peritoneal fibrosis induced by AGEs as well as during the activation of HSCs and the transition of HSCs to MFs [<xref ref-type="bibr" rid="b5-ijms-09-00638">5</xref>,<xref ref-type="bibr" rid="b10-ijms-09-00638">10</xref>,<xref ref-type="bibr" rid="b11-ijms-09-00638">11</xref>]. It is reported that there are elevated levels of serum AGEs in patients with liver cirrhosis (LC) [<xref ref-type="bibr" rid="b12-ijms-09-00638">12</xref>–<xref ref-type="bibr" rid="b14-ijms-09-00638">14</xref>]. In addition, a preliminary report indicated that blockade of RAGE by means of soluble RAGE or F(ab’)2-fragments of IgG directed against RAGE, amphoterin, or S100, respectively, resulted in a considerable improvement of the liver function and accelerated regeneration after 85% hepatectomy [<xref ref-type="bibr" rid="b15-ijms-09-00638">15</xref>].</p>
<p>Nuclear factor κB (NF-κB), a heterodimer composed of p65 and p50 in most conditions, has been shown to be predominantly localized in the cytoplasm in the absence of activating factors. NF-κB is tightly regulated by the interaction with IκB, the inhibitor of NF-κB [<xref ref-type="bibr" rid="b16-ijms-09-00638">16</xref>]. Stimulation of cells with inflammatory cytokines, such as tumor necrosis factor alpha (TNF-α) and interleukin-1, induces the phosphorylation and degradation of IκB, resulting in the nuclear accumulation of NF-κB and the altered expression of specific genes such as TNF-α, IL-8 and adhesion molecules [<xref ref-type="bibr" rid="b17-ijms-09-00638">17</xref>]. It is believed that IκBα is the key subunit of IκB, because of its powerful inhibition effect on NF-κB via its quick disaggregation and degradation [<xref ref-type="bibr" rid="b16-ijms-09-00638">16</xref>]. NF-κB plays an important role in HSCs survival. Inhibition of the NF-κB/IκB pathway enhances the spontaneous recovery of established fibrosis [<xref ref-type="bibr" rid="b18-ijms-09-00638">18</xref>,<xref ref-type="bibr" rid="b19-ijms-09-00638">19</xref>]. Oakley et al.[<xref ref-type="bibr" rid="b19-ijms-09-00638">19</xref>] found that the inhibitor of κB kinase suppressor sulfasalazine stimulates hepatic myofibroblast apoptosis and recovery from fibrosis both in vitro and in vivo. Bierhaus et al. [<xref ref-type="bibr" rid="b20-ijms-09-00638">20</xref>] confirmed that the binding of AGEs to RAGE on vascular endothelial cell surface enhanced the mRNA and protein levels of NF-κB p65, and increased the sustained activation of NF-κB.</p>
<p>Although previous studies have demonstrated that RAGE is closely involved in renal and peritoneal fibrosis, the activation of HSCs, and the nuclear translocation of NF-κB, the exact role of RAGE in the development of hepatic fibrosis remains unclear. The aim of this study was to investigate the effect of RAGE specific siRNA expressed by the recombinant plasmid on the expression of RAGE, NF-κB (p65), IκBα, α-SMA and type I collagen in rat hepatic fibrosis model. These information could shed light on the possible mechanisms of the actions of RAGE.</p></sec>
<sec sec-type="materials|methods">
<title>2. Materials and Methods</title>
<p>Mouse HSC-T6 cell line was donated by Professor Scott L. Friedman of Mount Sinai School of Medicine, USA. The vector pGCsi-U6/neo/GFP was purchased from Genscript Corporation (NJ, USA). Fetal calf serum and LipofectAMINE™ 2000 transfection reagent kit were from Invitrogen Life Technoligies (CA, USA). DNA reagent kit and Trizol reagent were from Qiagen (CA, USA). Real time PCR reagent kit was from TaKaRa Bio, Inc (Kyoto Japan). Prestained protein molecular weight marker was purchased from Fermentas Life Sciences (Harrington, CA, USA). BCA protein assay reagent kit was from Pierce Biotechnology, Inc (Rockford, USA). Anti-mouse RAGE monoclonal antibody was from R &amp; D Systems (CytoLab Ltd, USA). Anti-mouse NF-κB monoclonal antibody, anti-rat IκBα polyclonal antibody, anti-mouse α-SMA monoclonal antibody, anti-goat type I collagen polyclonal antibody, anti-β-actin monoclonal antibody, HRP-labelled rabbit anti-mouse IgG and HRP-labelled rabbit anti-goat IgG were from Santa Cruz Biotechnology (CA, USA). KCTM electro-chemiluminescent reagent kit was purchased from KangChen Biological Engineering Ltd. (Shanghai, China).</p>
<sec>
<title>2.1 Preparation of specific siRNA targeting RAGE</title>
<p>Rat RAGE mRNA (GeneBank number: NM-053336.1) was used as the target sequence. An RNA design software (<ext-link xlink:href="http://www.ambion.com/techlib/misc/siRNAfinder.html" ext-link-type="uri">http://www.ambion.com/techlib/misc/siRNAfinder.html</ext-link>) was applied to model the secondary structures of rat RAGE mRNA. Three siRNA targets (nt 417–437, 221–241 and 534–54) were tested in this study. The beginning point was at nt 100 and the targets were in the RNA code loop with 45–0% GC contents. Three pairs of 21 nt siRNA sequence were designed in accordance with target sequence and its complementary sequence (Specificity of sequence was confirmed by BLAST). Then they were further converted into short RNA oligonucleotide sequences that can form hairpin structure. Restriction enzyme points of <italic>Bam</italic>H I and <italic>Hin</italic>d III and the hairpin structure sequence of 9 bp loop were added to the two ends of the sequence. The final oligonucleotides were named as R1, R2 and R3, respectively.
<list list-type="simple">
<list-item>
<p>– Sequence of R1 (targeting RAGE mRNA 417–437): sense chain is:</p></list-item>
<list-item>
<p>5’-GATCCCAAGCCGGAAATTGTGAATCCTTTCAAGAGAAGGATTCACAATTTCCGGCTTTTTTTGGAT-3’ and antisense chain is</p></list-item>
<list-item>
<p>5’-AGCTATCCAAAAAAAGCCGGAAATTGTGAATCCTTCTCTTGAAAGGATTCACAATTTCCGGCTTGG-3’</p></list-item>
<list-item>
<p>– Sequence of R2 (targeting RAGE mRNA 221–241): sense chain is</p></list-item>
<list-item>
<p>5’-GATCCCAAGGACTGAAGCTTGGAAGGTTTCAAGAGAACCTTCCAAGCTTCAGTCCTTTTTTTGGAT-3’ and antisense chain is</p></list-item>
<list-item>
<p>5’-AGCTATCCAAAAAAAGGACTGAAGCTTGGAAGGTTCTCTTGAAACCTTCCAAGCTTCAGTCCTTGG-3’</p></list-item>
<list-item>
<p>– Sequence of R3 (targeting RAGE mRNA 534–554): sense chain is</p></list-item>
<list-item>
<p>5’-GATCCCCACCTCTGATTCCTGATGGCTTCAAGAGAGCCATCAGGAATCAGAGGTTTTTTGGAAA-3’ and antisense chain is</p></list-item>
<list-item>
<p>5’-AGCTTTTCCAAAAAACCTCTGATTCCTGATGGCTCTCTTGAAGCCATCAGGAATCAGAGGTGGG-3’</p></list-item></list></p>
<p>The restricted enzyme sites of <italic>Bam</italic>H I and <italic>Hin</italic>d III, and the hairpin structure sequence were also added to the two ends of another pair of code non-specific siRNA oligonucleotide sequence (not homologous to rat RAGE mRNA confirmed by BLAST). It was named as C.
<list list-type="simple">
<list-item>
<p>– Sequence of C: sense chain is</p></list-item>
<list-item>
<p>5’-GATCCCCAATTCCAGTGGCCATCGTATTCAAGAGATACGATGGCCACTGGAATTTTTTTA-3’ and antisense chain is</p></list-item>
<list-item>
<p>5’-AGCTTAAAAAAATTCCAGTGGCCATCGTATCTCTTGAATACGATGGCCACTGGAATTGGG-3’</p></list-item></list></p>
<p>Gene fragments R1, R2, R3 and C were synthesized using 2’-O-ACE-RNA phosphoramidites (Shanghai Biotechnology Ltd), deprotected and annealed according to the manufacturer's instructions.</p></sec>
<sec>
<title>2.2 Construction of specific siRNA expression vectors</title>
<p>The plasmid pGCsi-U6/Neo/GFP was first linearized by restriction enzyme digestion at <italic>Bam</italic>H I and <italic>Hin</italic>d III sites, and then re-connected with the annealed double-stranded DNA fragments R1, R2 and R3, respectively. Thus the RAGE specific siRNA expression vector, pGCsi-R1, pGCsi-R2 and PGCsi-R3 were constructed. The non-specific siRNA expression vector pGCsi-C was constructed as the control.</p></sec>
<sec>
<title>2.3 Cell culture and transfection</title>
<p>HSC-T6 cells were seeded in 24-well plates one day before transfection. Cells were cultured in 0.5 ml high glucose DMEM medium and then placed in an incubator with 5% CO<sub>2</sub> at 37 °C for 24 h. When the confluence of the cells reached 70%–80%, the medium was replaced with 400 μl serum-free DMEM each well. RAGE siRNA expression vectors (pGCsi-R1, pGCsi-R2 and pGCsi-R3) were transfected into HSC-T6 cell line individually at the final concentrations of 0.25, 0.5 and 1.0 nM, respectively, with lipofectamine. The untreated HSC-T6 cells were the blank and the cells transfected with pGCsi-C were the control. Total RNA was extracted and the RAGE mRNA level was determined by real-time quantitative PCR after incubation for 48 h. The specific siRNA expression vectors with the maximum efficiency to inhibit the expression of RAGE gene were selected and transfected into exponentially growing HSC-T6 cells, with the untreated HSC-T6 cells as the blank and cells transfected with pGCsi-C as the control. The cells were collected after incubation for 24, 48 and 72 h, respectively, and the total RNA was extracted. Efficiency of RAGE gene silencing was assessed by real time quantitative PCR. The RAGE protein was extracted and determined by Western blot analysis after incubation for 24 h.</p></sec>
<sec>
<title>2.4 Observation of cell transfection under a fluorescence microscope</title>
<p>HSC-T6 cells were seeded in 6-well plates one day before transfection. The cells were cultured and transfected as described above. The untreated cells were the blank. For the pGCsi-R1 transfected group, pGCsi-R1 vector DNA and liposome LipofectAMINE™ 2000 were 1 μg and 4 μl, respectively. After transfection for 48 h, the cells were either analyzed by flow cytometry (ELITE, Beckman Co.) after washing with phosphate-buffered saline (PBS) and fixed in ethanol at 4 °C for 30 min or observed under an Olympus BX-50 fluorescence microscope using a 20× objective after the cells were suspended in PBS for 20 min and seeded on a glass slide.</p></sec>
<sec>
<title>2.5 Animal model and protocol</title>
<p>Six-week-old male Sprague-Dawley (SD) rats weighing 250±30g were purchased from the Shanghai Laboratory Animal Center of the Chinese Academy of Science. They were housed with a 12/12 h dark/light cycle with water and standard chow diet ad libitum. Twenty-four rats in group A were randomly divided into two subgroups. One was the normal control group1 (NC1, n=6), in which the rats were injected intraperitoneally with refined olive oil (2 ml/kg) twice a week for 6 weeks; the other one was the fibrosis model group 1 (FM1, n=18) with 50% CCl<sub>4</sub> (2 ml/kg, CCl<sub>4</sub>/olive oil=1:1) injected twice a week for 6 weeks. All 18 rats in this group were sacrificed at 2 (FM1-2W), 4 (FM1-4W) and 6 (FM1-6W) weeks after CCl<sub>4</sub> injection with 6 rats each time, respectively. Thirty-three rats in group B were randomized into 4 subgroups: the normal control group 2 (NC2, n=6), fibrosis model group 2 (FM2, n=9), the pGCsi-R1 group (n=9) and the pGCsi-C group (n=9). The NC2 group received intraperitoneal injection of olive oil at 2 ml/kg body weight, twice a week for 6 weeks. The FM2 group, pGCsi-R1 group and pGCsi-C group received intraperitoneal injection of 50% CCl<sub>4</sub> (2 ml/kg, CCl<sub>4</sub>/olive oil=1: 1) twice a week for 6 weeks. Simultaneously, the FM2 group was injected with 300 μl PBS via the tail vein once a week for 6 weeks. The pGCsi-R1 group and pGCsi-C group were injected with pGCsi-R1 and pGCsi-C, respectively, at 0.3 mg/kg with lipofectamine in 300 μl Opti-MEM1 (Invitrogen) once a week for 6 weeks. All rats were sacrificed 3 days after the final injection of CCl<sub>4</sub>. To confirmed the expression and efficacy of RAGE siRNA in the rat liver, RAGE siRNA levels were determined by Northern blot analysis with a [α-<sup>32</sup>p]dCTP-labled probe specific for sense chain of R1 encoded RAGE siRNA.</p></sec>
<sec>
<title>2.6 Histological examination</title>
<p>Continuous sections of the liver tissues were prepared for pathological examination with the hematoxylin-eosin (H-E) staining method and the Sirius red staining method. Two pathologists independently examined the slides under a light microscope (Olympus, Tokyo, Japan). The severity of the inflammation activity and fibrosis in liver were graded according to Knodell HAI evaluation system and Ishak modified systems [<xref ref-type="bibr" rid="b21-ijms-09-00638">21</xref>–<xref ref-type="bibr" rid="b22-ijms-09-00638">22</xref>]. Inflammatory activity grading and fibrosis staging were recorded in five random fields, and the mean value was taken.</p></sec>
<sec>
<title>
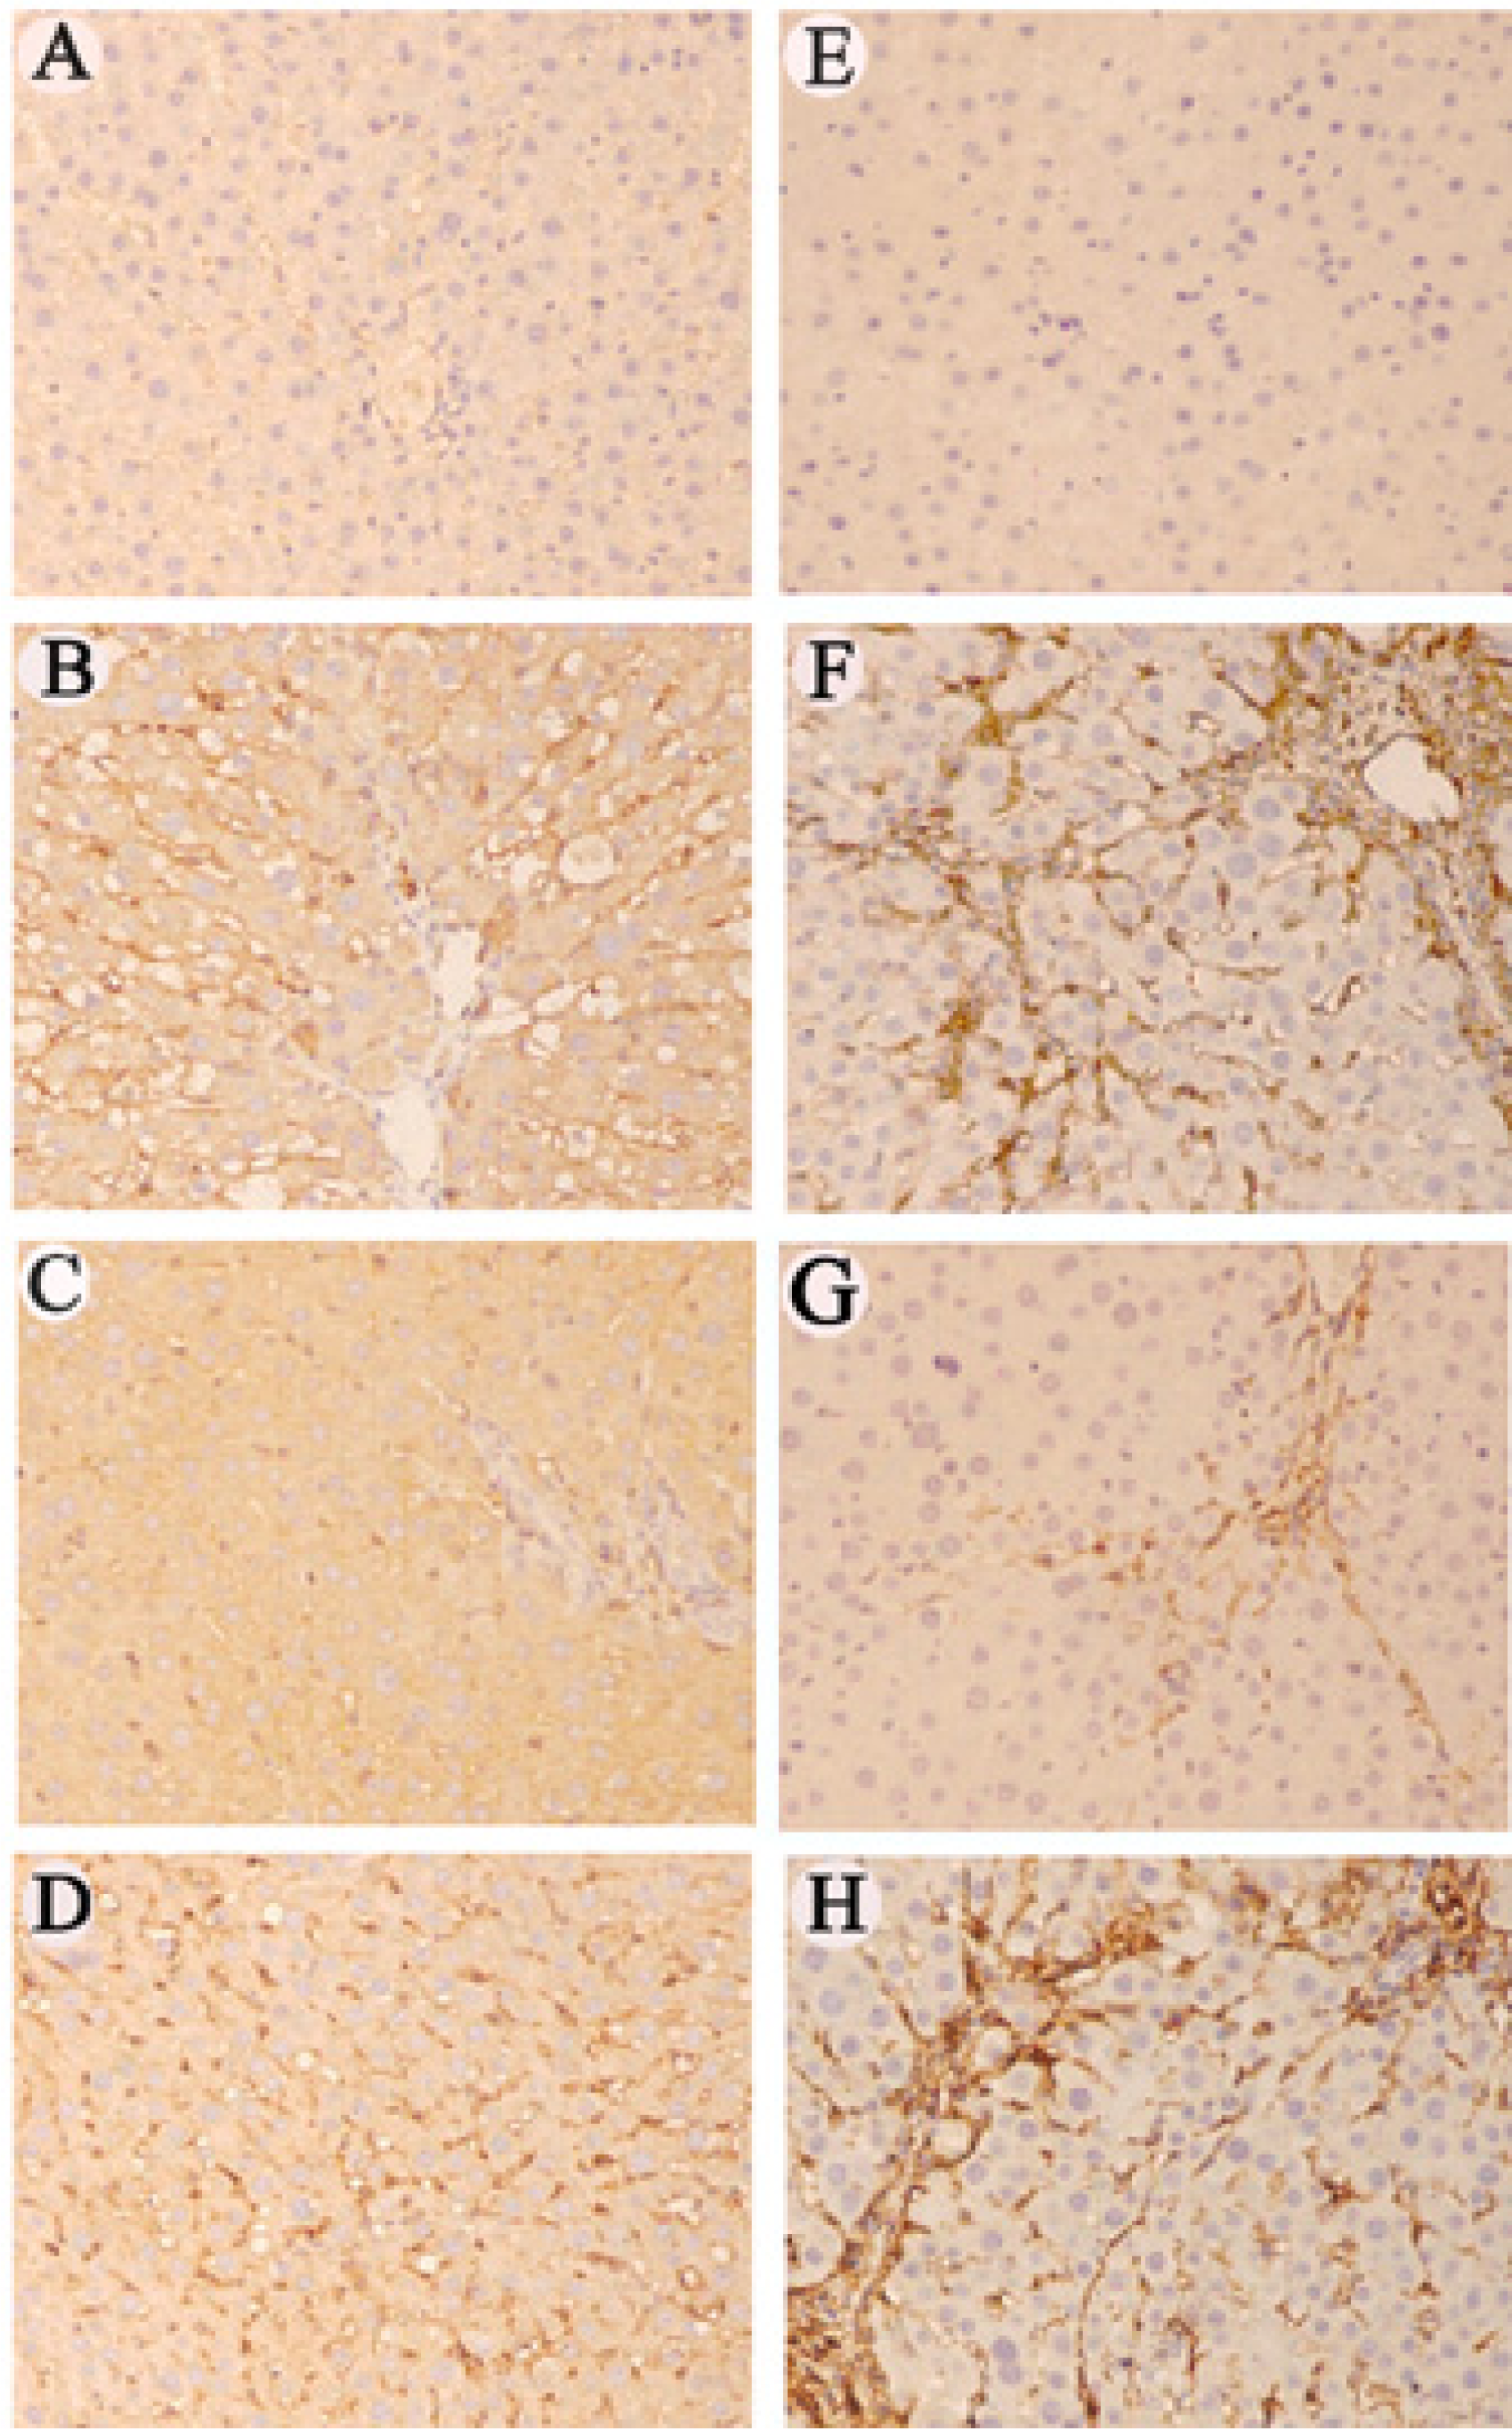
2.7 Immunohistochemical staining of RAGE and α-SMA</title>
<p>Expression of markers was detected using the streptavidin-peroxidase (SP) method. Briefly, after tissue sections were deparaffinized and dehydrated in decreasing concentrations of ethanol, they were incubated with 3% hydrogen peroxide in methanol for 10 min to block the endogenous peroxidase activity. Slides were then heated in a microwave oven to 98 °C for 10 min for antigen retrieval. Following a 10-min blocking step with PBS containing 10% normal goat serum, the sections were incubated with anti-mouse RAGE or α-SMA monoclonal antibody at a dilution of 1:100 for 1 h at 37 °C. After treating with HRP-labeled rabbit anti-mouse IgG and 50 μl streptavidin-peroxidase solutions for 30 min each at 37 °C, the slides were developed with DAB and counterstained with hematoxylin. The slide treated with PBS instead of the primary antibody was used as the negative control, and the known positive sections were used as the positive control. Immunohistochemical results for RAGE and α-SMA were quantitatively analyzed with an image analysis software (Imagepro Plus 6.0). Positive staining area and IOD (Intergrated Optical Density) were measured in five random fields (×200 power) of each section. AOD (Average Optical Density) was used as the index of quantitative analysis.</p></sec>
<sec>
<title>2.8 Transmission electron microscopy</title>
<p>Liver specimens were fixed with 25 g/L glutaraldehyde in 0.1 M cacodylate buffer. After being washed with cacodylate buffer, the specimens were fixed with 10 g/L osmium tetraoxide, dehydrated with ethanol, washed with propylene oxide and embedded in epoxy. Ultrathin sections were prepared and stained with uranyl acetate and lead citrate for transmission electron microscopy examination (TEM, H-800, Japan).</p></sec>
<sec sec-type="methods">
<title>2.9 Biochemical analysis of serum</title>
<p>Blood samples were obtained from cardiac cavity. Serum was collected from the blood samples by centrifugation at 10,000 g for 8 min at 4 °C. The levels of alanine aminotransferase (ALT), albumin (ALB) and total bilirubin (TBIL) in serum were measured using Beckman LX20 autoanalyzer (Beckman Coulter Inc, Fullerton, CA, USA). The levels of hyaluronic acid (HA), procollagen type III (PCIII) and laminin (LN) in serum were determined by radioimmunoassay [<xref ref-type="bibr" rid="b23-ijms-09-00638">23</xref>–<xref ref-type="bibr" rid="b25-ijms-09-00638">25</xref>].</p></sec>
<sec>
<title>2.10 Total RNA extraction and quantitative real-time PCR assay</title>
<p>The total RNA was extracted from the rat liver or HSC-T6 cells with Trizol reagent in accordance with the manufacturer's instructions. RNA purity and concentration were determined by agarose gel electrophoresis and a BioPhotometer (Eppendorf AG, Hamburg, Germany). Two micrograms of total RNA was converted into cDNA using the ExScript RT reagent kit (TakaRa, Kyoto, Japan). Quantitative real-time PCR was performed on a LightCycler PCR instrument (ABI7700, USA), using SYBR Green as the detection fluorophore. Every 25 μl reaction mixture consisted of 1 μl of cDNA, 0.2 μl of Taq polymerase (Promega), 0.625 μl of 10 x SYBR Green (Molecular Probes), and 1 μl of 10 μM forward and reverse primers for RAGE; (Forward primer sequence: 5’-CAGGGTCACAGAAACCGG-3’; Reverse primer sequence: 5’-ATTCAGCTCTGCACGTTCCT-3’). PCR thermocycle parameters were as follows: 2 min at 95 °C, and 40 cycles of 15 s at 95 °C, 20 s at 58 °C, and 20 s at 72 °C. The specificity of amplification product was confirmed by melting curve analysis of the reaction products by using SYBR Green. A single band with the expected size was confirmed by 1.5% agarose gel electrophoresis and ethidium bromide staining. External standards were prepared by serial dilutions (1:102 to 107) of cDNA from the normal rat liver. Quantitative real-time PCR was conducted at least for three times, including a no-template control as a negative control. The housekeeping gene beta-actin (β-actin) was used as an internal control, and specific gene expression was normalized with the expression level of β-actin.</p></sec>
<sec sec-type="methods">
<title>2.11 Northern blot analysis</title>
<p>The total RNA was extracted from the rat live as described above. Northern blot analysis was performed as described by Fehrenbach <italic>et al</italic> [<xref ref-type="bibr" rid="b5-ijms-09-00638">5</xref>]. Briefly, ten micrograms of total RNA from each sample were separated by electrophoresis in a 1.2% denaturing agarose gel, transferred to Hybond-N membrane (Amerisham, NJ, USA). Blots were hybridized with [α-<sup>32</sup>p]-labeled cDNA probes of RAGE, α-SMA, NF-κB, Collagen type I or sense chain of R1 encoded RAGE siRNA (The probes were radioactively labeled with α-<sup>32</sup>p-dCTP by random priming method). Kodak RX films were then exposed to the membrane at –80 °C. As an internal standard, the blots were rehybridized with a cDNA probe specific for β-actin.</p></sec>
<sec sec-type="methods">
<title>2.12 Western blot analysis</title>
<p>Cells or tissue proteins were extracted into modified RIPA buffer (50 mM Tris-HCL, pH 7.5, 150 mM NaCl, 1% NP-40, 0.1% SDS, 0.5% deoxycholate, 1 mM EDTA, and 2 mg/L Leupetin) containing 1 mM phenylmethylsulfonyl fluoride. The protein content was determined using the bicinchoninic acid (BCA) method. Proteins (50 μg) were separated by electrophoresis on a 10% gradient SDS-polyacrylamide gel and transferred to PVDF membranes. The membranes were respectively hybridized (incubated) with primary mouse monoclonal antibodies against rat RAGE, NF-κB, α-SMA, β-actin, rat polyclonal antibody against human IκBα and goat polyclonal antibody against human type I collagen (1:10000) for 3 h. After washing, the membranes were hybridized with HRP-labeled rabbit anti-mouse IgG (1:5000) or HRP-labeled rabbit anti-goat IgG secondary antibodies (1:5000), and developed by KCTM electrochemiluminescent reagent kit (KangChen, China). Band intensities were measured and protein signals were normalized with the β-actin levels.</p></sec>
<sec>
<title>2.13 Electrophoretic mobility shift assay (EMSA)</title>
<p>Nuclear proteins of the liver tissue were extracted as described previously [<xref ref-type="bibr" rid="b26-ijms-09-00638">26</xref>]. ESMAs were performed as described by Li <italic>et al</italic> [<xref ref-type="bibr" rid="b27-ijms-09-00638">27</xref>]. Briefly, six micrograms of nuclear proteins was incubated with 100 pg of a <sup>32</sup>P-labeled probe containing the NF-κB consensus site (5’-AGTTGAGGGGACTTTCCCAGGC-3’) in a buffer containing 10 mM EDTA, 1 M NaCl, 20 mM MgCl<sub>2</sub>, 10 mM dithiothreitol, 0.2 M Tris–HCl, pH 7.5, 25% [v/v] glycerol, 2 ng/μl poly(dI–dC)-poly(dI–dC) for 20 min at room temperature. Supershift experiments were performed by incubating 1 μg NF-κB p65 antibody in the binding reaction mixture for 1 h at 4 °C before the addition of the <sup>32</sup>P-labeled oligonucleotide probe to start the binding reaction. In competition experiments, the nuclear extract was incubated with a 100-fold molar excess of the appropriate unlabeled competitor oligonucleotides. Electrophoresis was carried out on 6% nondenaturating polyacrylamide gels at 100 V for 3 h. The gel was dried under vacuum and exposed to Kodak RX film for 2 days at –80 °C. All experiments were repeated at least three times.</p></sec>
<sec sec-type="methods">
<title>2.14 Statistical analysis</title>
<p>Data are expressed as the mean± standard deviation. Statistical analysis was performed with SPSS statistical software package (version 13.0) using one-way analysis of variance (ANOVA) or the Kruskal-Wallis test as appropriate. A value of P&lt;0.05 was considered statistically significant.</p></sec></sec>
<sec sec-type="results">
<title>3. Results</title>
<sec>
<title>
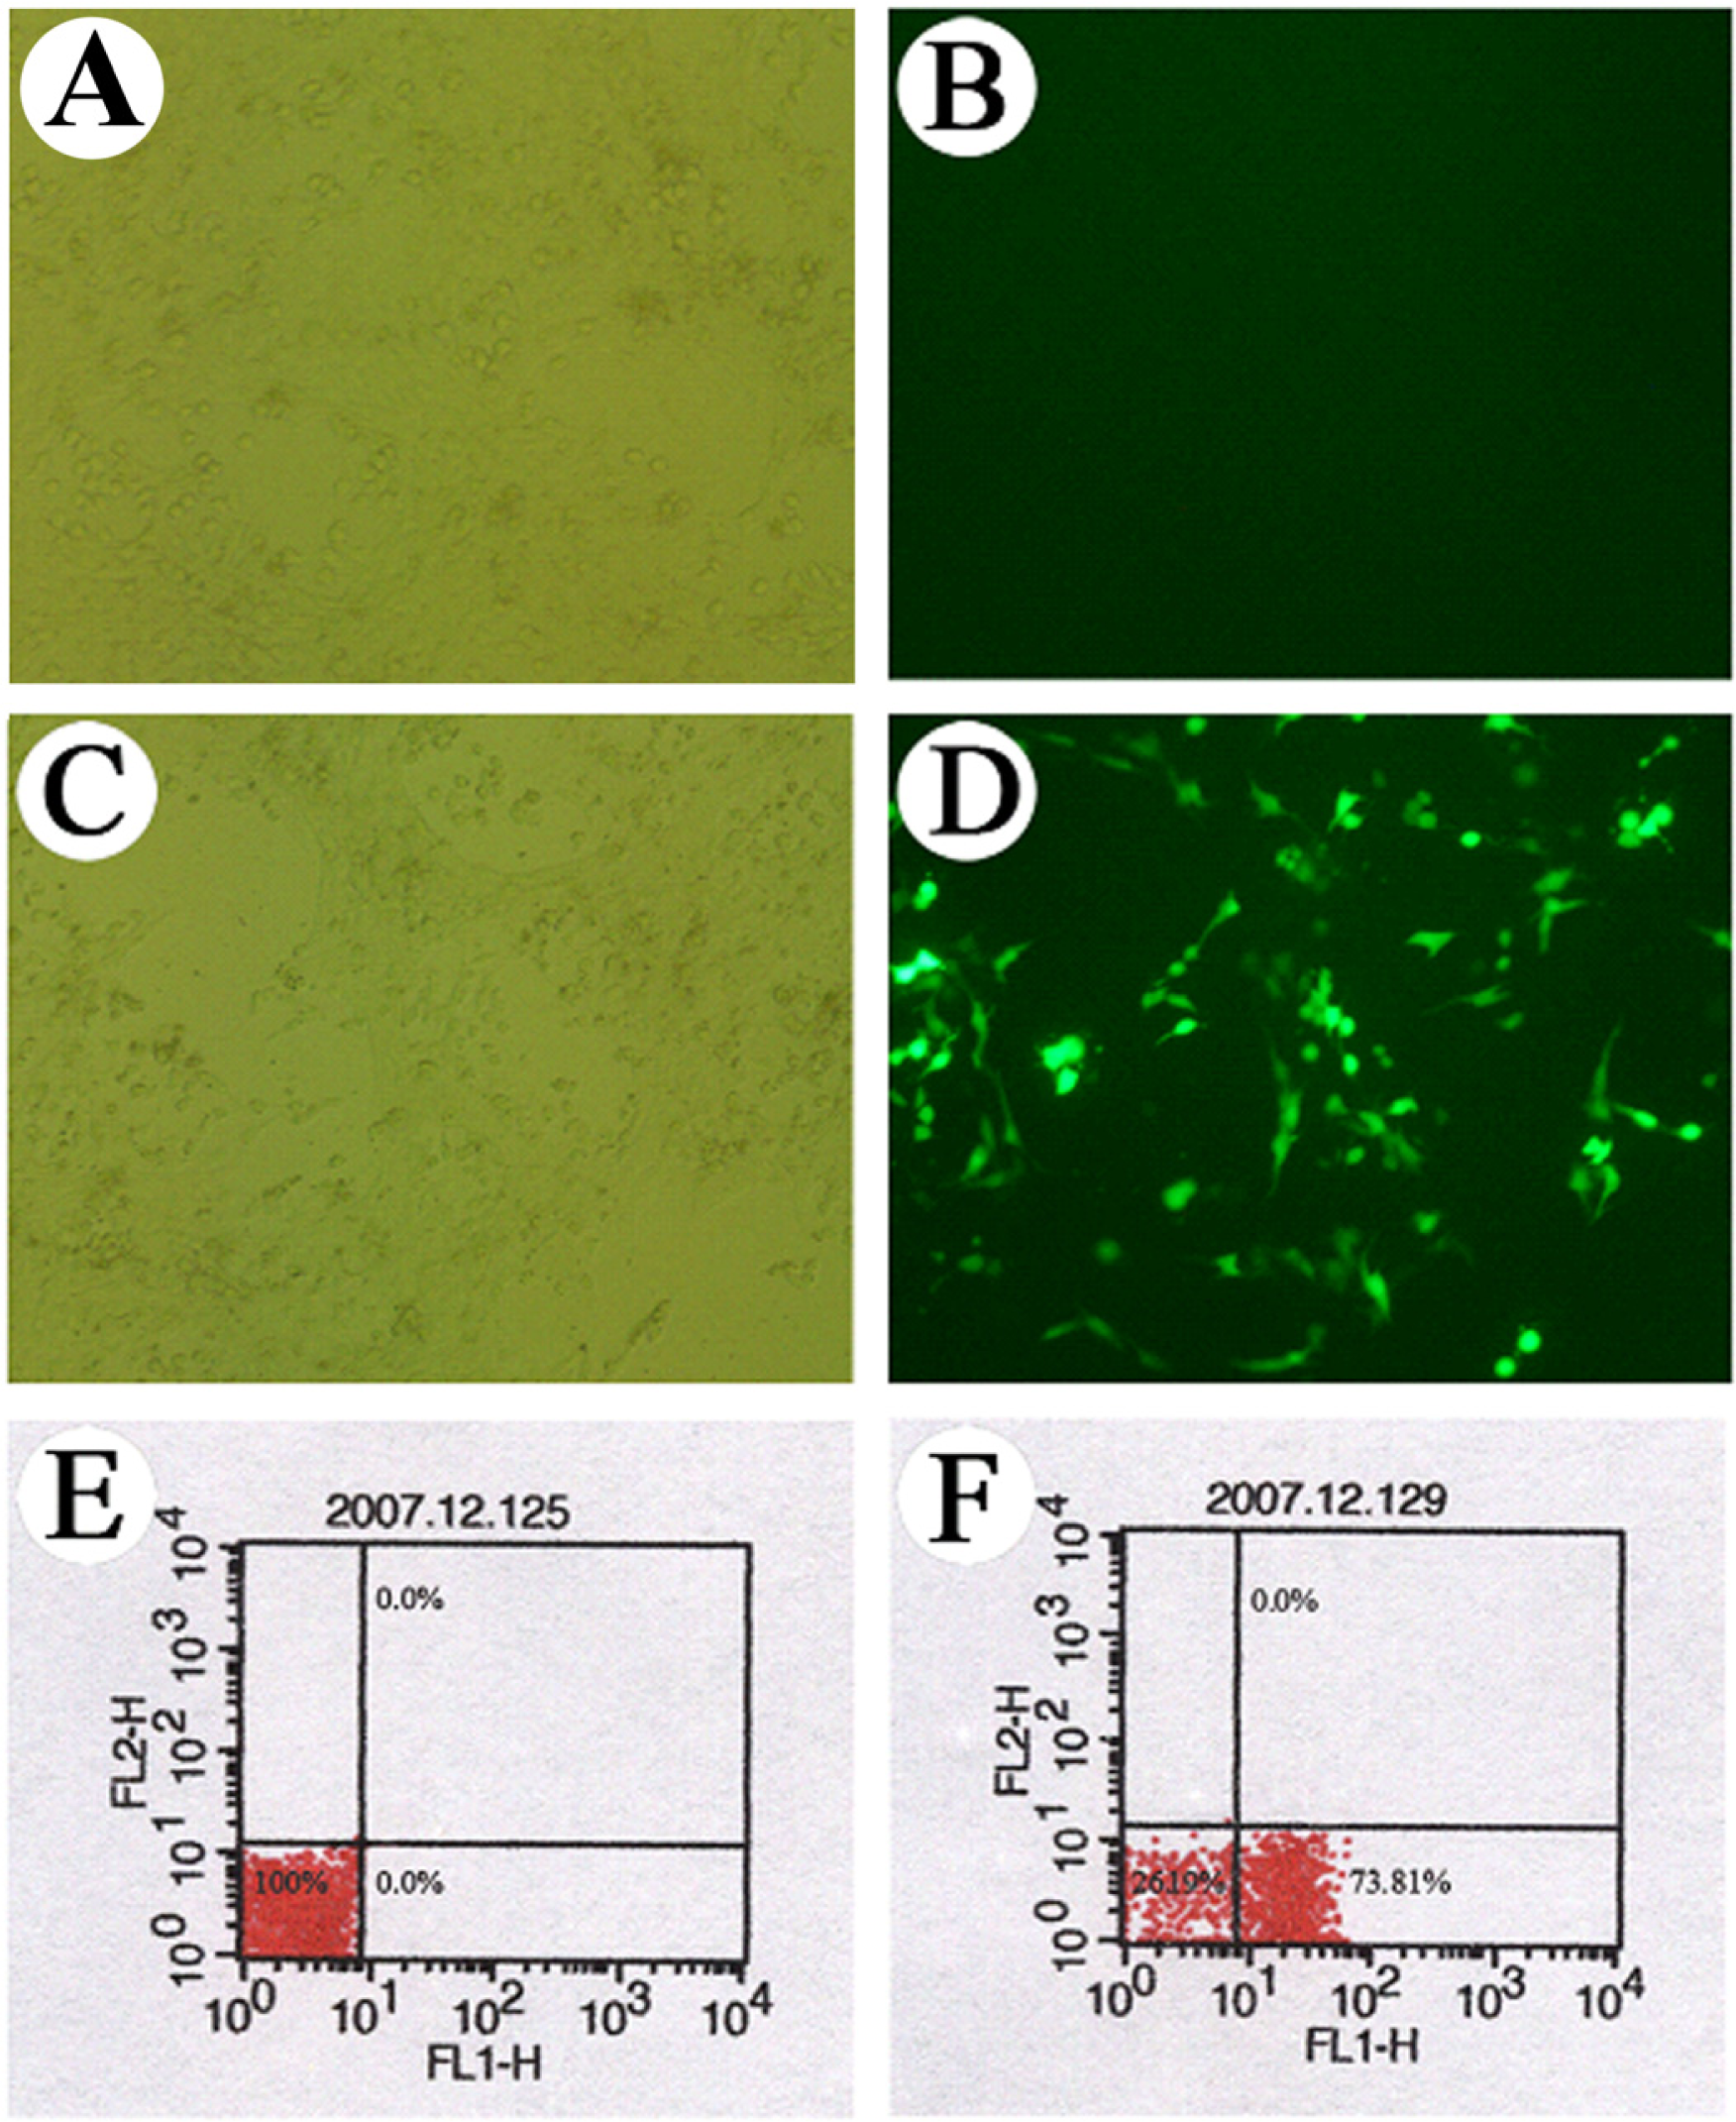
3.1 Observation of the GFP expression in the transfected cells</title>
<p>The vector of PGCsi-R1 carrying the green fluorescent protein gene (GFP) is a tracing carrier for siRNA expression. In transfected HSC-T6 cells, the transfection efficiency can be judged by the amount of the GFP. Forty-eight hours after transfection, bright GFP fluorescence was observed in the pGCsi-R1-treated cells, but not in the non-treated (blank) cells. The results from fluorescence microscopy (<xref ref-type="fig" rid="f1-ijms-09-00638">Figure 1A–D</xref>) and flow cytometry (<xref ref-type="fig" rid="f1-ijms-09-00638">Figure 1E–F</xref>) indicated that 73.81%±7.2% of the cells had taken up pGCsi-R1 and were GFP fluorescence positive 48 h after pGCsi-R1 transfection. The results showed that pGCsi-R1 was efficiently transfected into HSC-T6 cells.</p></sec>
<sec>
<title>
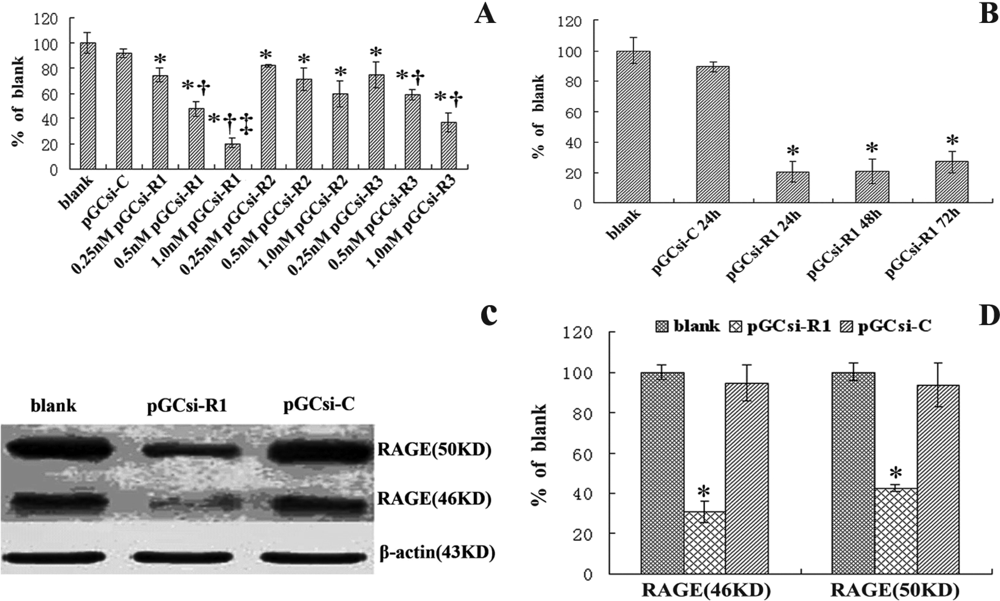
3.2 Effect of RAGE specific siRNA on RAGE expression in HSC-T6 cells</title>
<p>Compared with the untreated HSC-T6 cells (blank) and the cells treated with pGCsi-C (control), expression of RAGE mRNA was significantly down-regulated in the HSC-T6 cells treated with pGCsi-R1 (<italic>P</italic>&lt;0.05–0.01), pGCsi-R2 (<italic>P</italic>&lt;0.05), and pGCsi-R3 (<italic>P</italic>&lt;0.05–0.01). The levels of RAGE mRNA decreased in a concentration dependent manner within 0.25–1.0 nM. Particularly, the largest decrease was observed with pGCsi-R1 at 1.0 nM (<xref ref-type="fig" rid="f2-ijms-09-00638">Figure 2A</xref>). The expression of RAGE mRNA was down-regulated by 79.46%±3,5% (<italic>P</italic>&lt;0.01), 78.96%±7.94% (<italic>P</italic>&lt;0.01) and 73.11%±6.89% (<italic>P</italic>&lt;0.01) in the HSC-T6 cells treated with pGCsi-R1 at 24, 48 and 72 h, respectively, compared with the control. But the inhibition of RAGE mRNA expression showed no time differences from 24 to 72 h (<italic>P</italic>&gt;0.05) (<xref ref-type="fig" rid="f2-ijms-09-00638">Figure 2B</xref>).</p>
<p>The RAGE protein in the liver has two forms with different molecular weights, 50 kDa and 46kDa. This organ-specific heterogeneity may be due to posttranslational modification like glycosylation at the extracellular domain of RAGE or proteolytic cleavage during total protein extraction [<xref ref-type="bibr" rid="b5-ijms-09-00638">5</xref>]. The expressions of 50 kDa and 46kDa RAGE protein in the HSC-T6 cells treated with 1.0 nM pGCsi-R1 for 24 h were markedly down-regulated by 43.91%±1.18% (<italic>P</italic>&lt;0.01) and 36.33%±0.78% (<italic>P</italic>&lt;0.01), respectively, compared with the control at 24 h posttransfection (<xref ref-type="fig" rid="f2-ijms-09-00638">Figure 2C–D</xref>). These results indicated that RAGE siRNA expressed by pGCsi-R1 effectively inhibited RAGE gene and protein expression.</p></sec>
<sec>
<title>
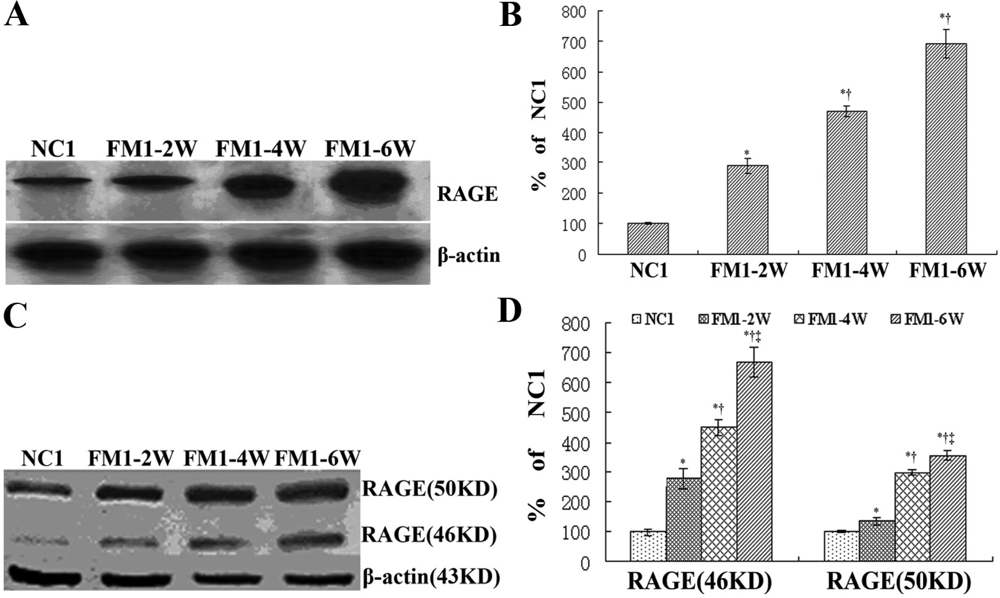
3.3 RAGE expression in the process of hepatic fibrosis</title>
<p>The architecture of hepatic lobules in the rats of the control (NC1) group was intact and there was no fibroplasia and inflammatory cell infiltration. The fibroplasia gradually increased and there were mild necrosis and fatty degeneration of hepatocytes in the rats of the FM1-2W group (hepatic fibrosis induction by CCl<sub>4</sub> for 2 weeks). In the rats of the FM1-6W group (hepatic fibrosis induction by CCl<sub>4</sub> for 6 weeks), the lobules of the liver were separated and surrounded by the collagen fibers, which resulted in apparent pseudo-lobules. And there were severe necrosis and fatty degeneration of hepatocytes that were widespread in the pseudo-lobules and extensive inflammatory cell infiltration in the stroma, exhibiting typical pathological changes in the development of hepatic fibrosis or liver cirrhosis (<xref ref-type="fig" rid="f3-ijms-09-00638">Figure 3A–H</xref>).</p>
<p>As shown in <xref ref-type="fig" rid="f4-ijms-09-00638">Figure 4A–D</xref>, the expression levels of RAGE mRNA and protein were very low in the NC1 group and were increased gradually in the FM1-2W group (<italic>P</italic>&lt;0.05) and the FM1-4W group (<italic>P</italic>&lt;0.01). And their levels were significantly higher in the FM1-6W group than in the NC1 group (<italic>P</italic>&lt;0.01). These results indicated a potential correlation between RAGE expression levels and the progression of hepatic fibrosis.</p></sec>
<sec>
<title>
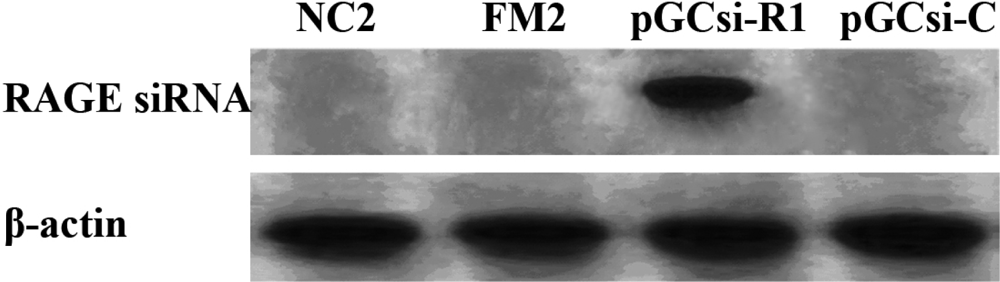
3.4 Expression of RAGE siRNA in the rat liver</title>
<p>We examine whether RAGE siRNA was expressed in the rat liver by Northern blot analysis using a probe specific for sense chain sequence of R1 encoded RAGE siRNA. As shown in <xref ref-type="fig" rid="f5-ijms-09-00638">Figure 5</xref>, a transcript of 21 bp was detectable in the pGCsi-R1 transfected rat liver, while that was absent in the untransfected NC2, FM2 and the pGCsi-C transfected rat liver, respectively. These results demonstrated that delivery of pGCsi-R1 to liver cells was realized with lipofectamine method intravenously and RAGE siRNA was expressed in the rat liver cells.</p></sec>
<sec>
<title>
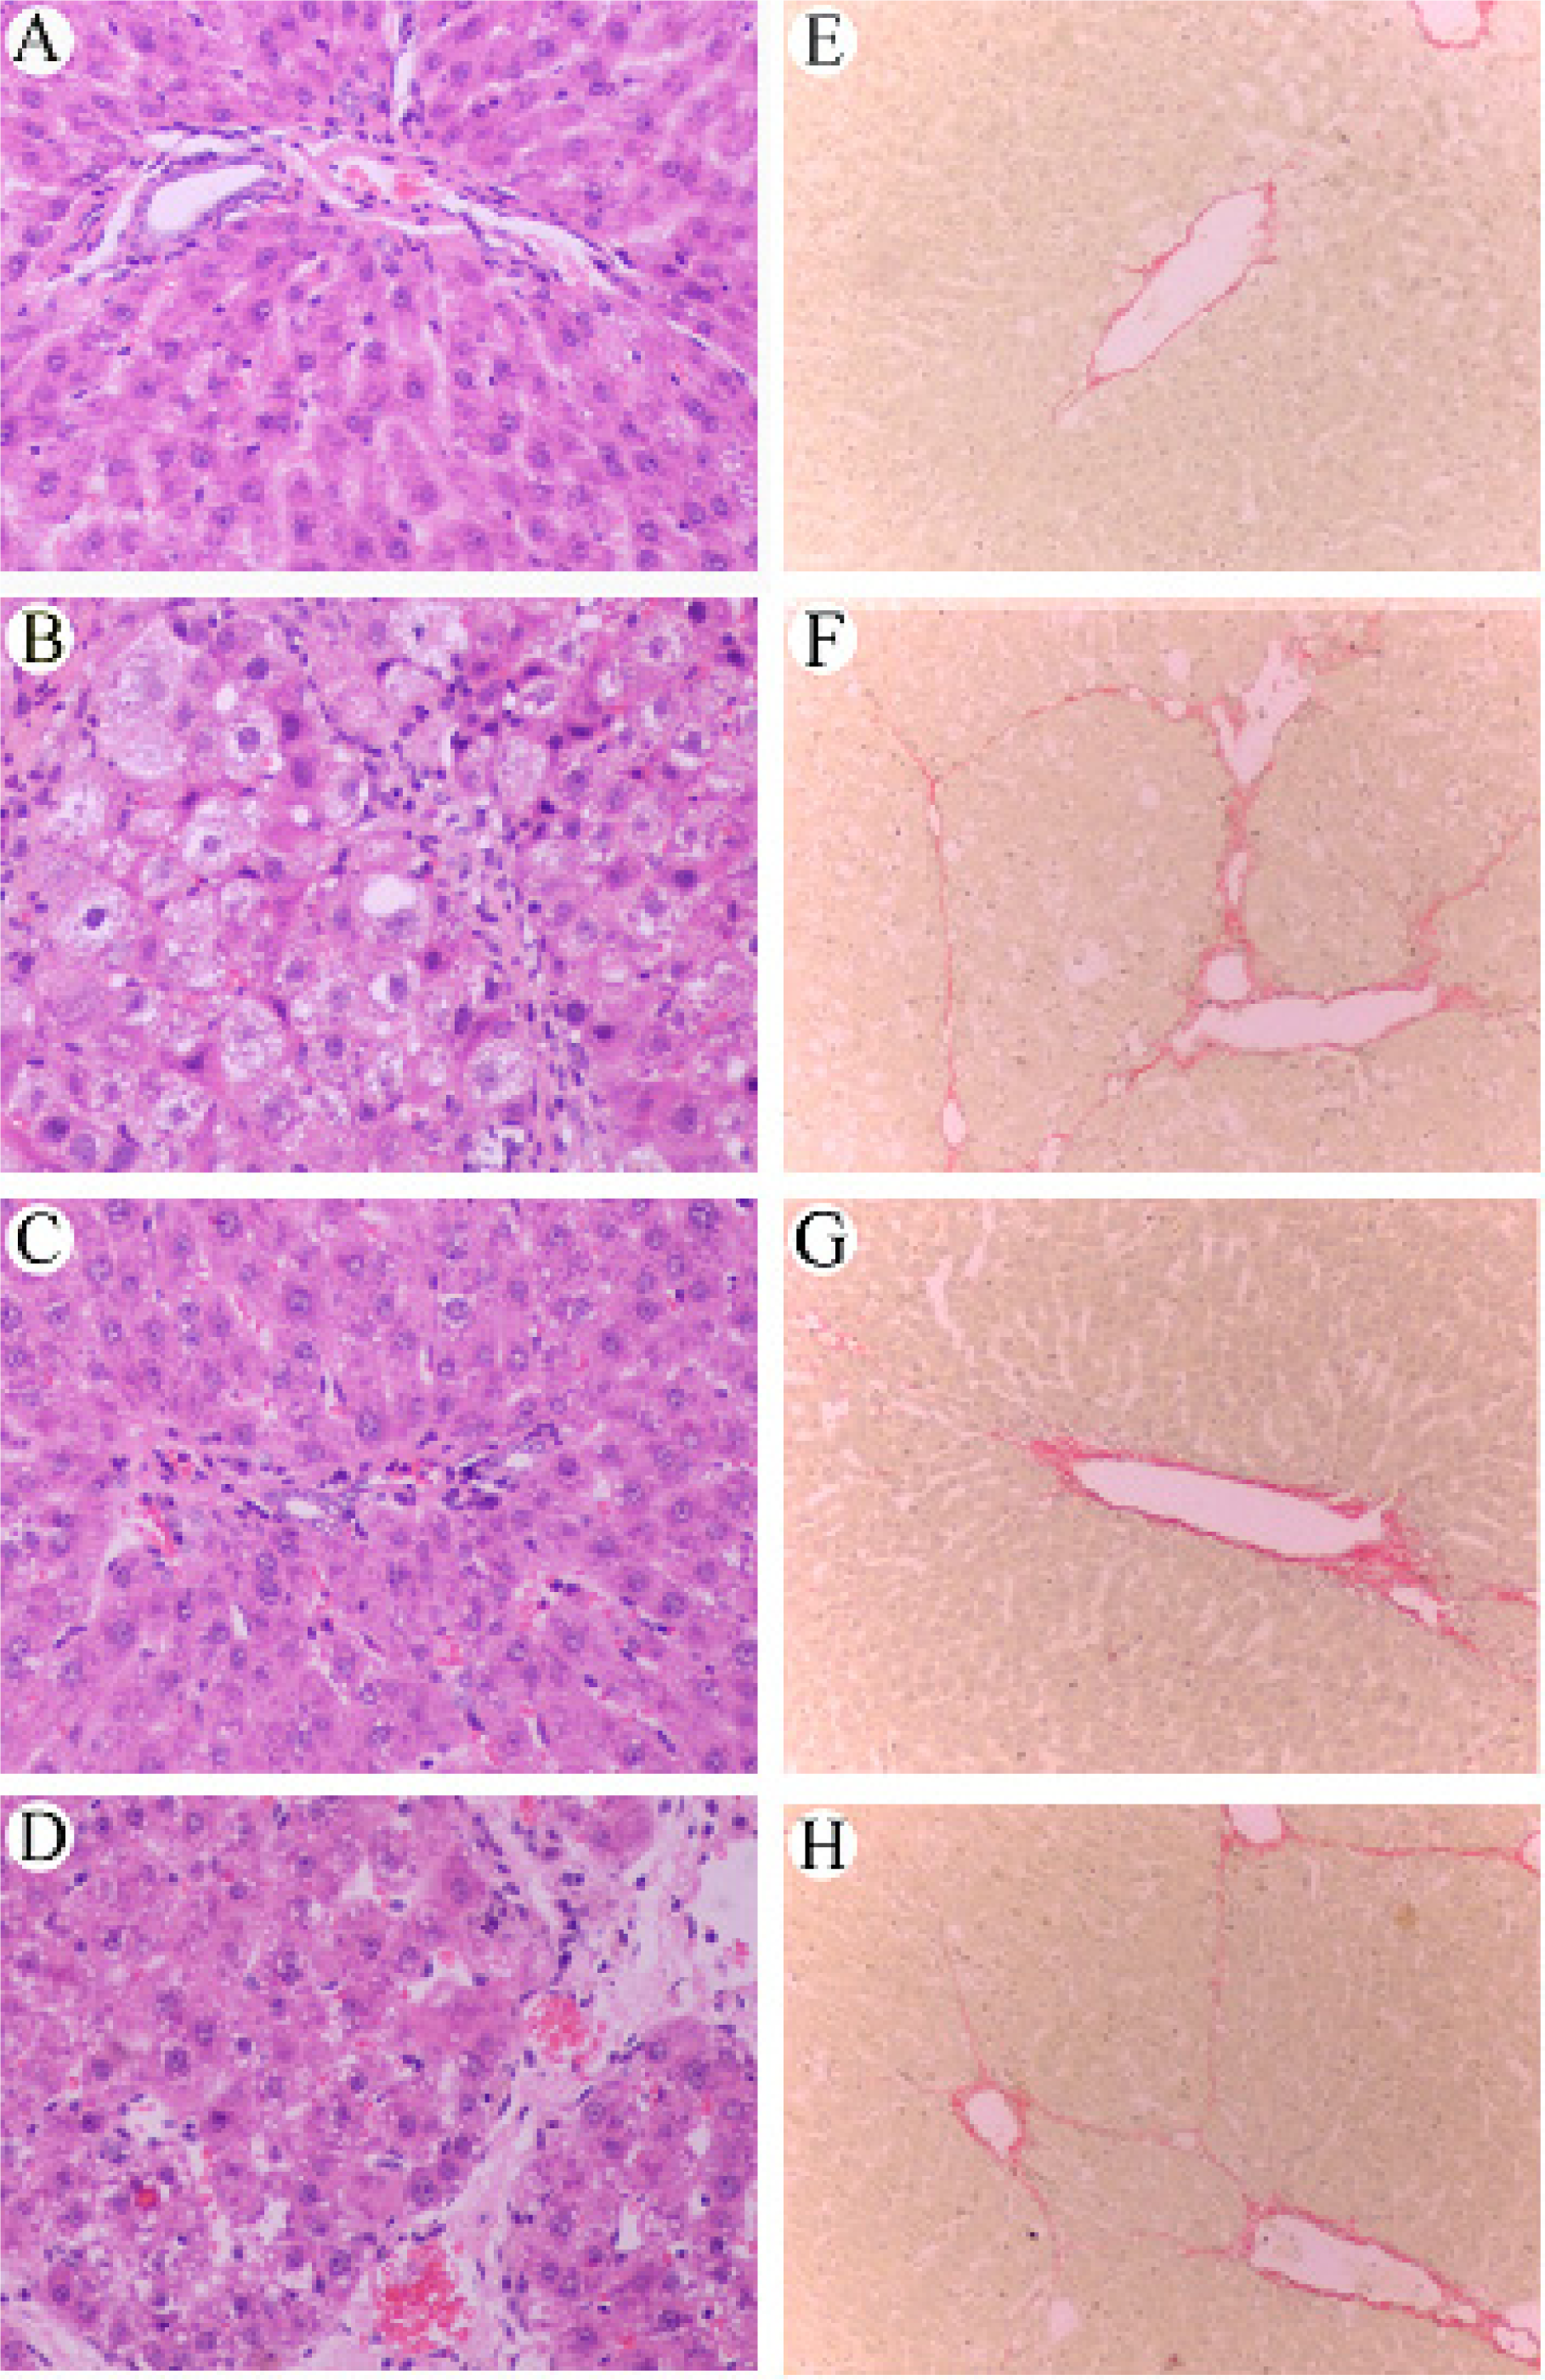
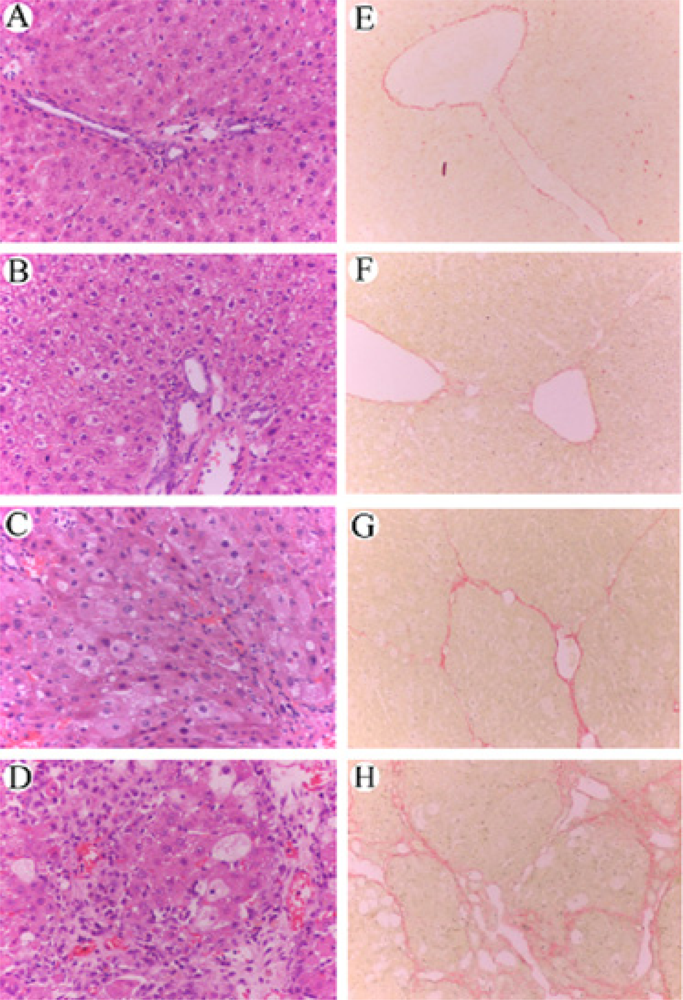
3.5 Effect of RAGE suppression on the histological changes of rat liver</title>
<p>Three days after the final CCl<sub>4</sub> injection, we conducted a histological analysis of the rat liver sections. Piecemeal or bridging necrosis, inflammatory cell infiltration, connective tissue hyperplasia in large quantity in portal area and pseudo-lobular formation were observed in the FM2 group (fibrosis group treated with PBS) and pGCsi-C treated group (<xref ref-type="fig" rid="f6-ijms-09-00638">Figure 6B</xref>, <xref ref-type="fig" rid="f6-ijms-09-00638">6D</xref>, <xref ref-type="fig" rid="f6-ijms-09-00638">6F</xref> and <xref ref-type="fig" rid="f6-ijms-09-00638">6H</xref>). Compared with the control group, the severity of hepatocellular necrosis, inflammatory cell infiltration and fibroplasia were significantly decreased in the pGCsi-R1 treated group, which inhibited the damage of intact architecture of hepatic lobule (<xref ref-type="fig" rid="f6-ijms-09-00638">Figure 6C</xref>, <xref ref-type="fig" rid="f6-ijms-09-00638">6G</xref>). By using Knodell HAI and Ishak modified system, we graded inflammatory activity and staged fibrosis of rat liver in each group. The scores of inflammatory activity and fibrosis in pGCsi-R1 treated group were markedly lower than in the FM2 group and pGCsi-C treated group (x2=25.0291, <italic>P</italic>&lt;0.01; X2=25.6393, <italic>P</italic>&lt;0.01) (<xref ref-type="fig" rid="f6-ijms-09-00638">Figure 6A–H</xref>, <xref ref-type="table" rid="t1-ijms-09-00638">Table 1</xref>). The results suggested that RAGE was necessary for the inflammatory activity and the formation of fibrosis in rat liver.</p></sec>
<sec>
<title>3.6 Effect of RAGE suppression on the levels of ALT, ALB and TBIL in rats</title>
<p>The levels of serum ALT, ALB and TBIL can reflect the hepatocyte injury in liver. Compared with the NC2 control group, the levels of serum ALT, and TBIL in the FM2 group and the pGCsi-C treated group were significantly higher (<italic>P</italic>&lt;0.01), and the level of ALB was markedly decreased (<italic>P</italic>&lt;0.01). After pGCsi-R1 treatment, the serum levels of ALT and TBIL in the pGCsi-R1 group were decreased by 12.67% (<italic>P</italic>&lt;0.01) and 39.6% (<italic>P</italic>&lt;0.01), respectively, while the level of ALB was about 1.5-fold higher than that of the FM2 group (<italic>P</italic>&lt;0.01) (<xref ref-type="table" rid="t2-ijms-09-00638">Table 2</xref>). The results clearly demonstrated that suppression of RAGE inhibited the increase of ALT and TBIL, and the decrease of ALB in rats.</p></sec>
<sec>
<title>3.7 RAGE siRNA significantly reduced the levels of serum fibrosis markers in rats</title>
<p>HA, PCIII and LN are the main components of extracellular matrix (ECM) and their serum levels can indirectly reflect the progression of hepatic fibrogenesis. The levels of serum PCIII, HA and LN were 342.14±19.04 μg/L, 424.63±31.82 μg/L and 221.83±20.06 μg/L, respectively, in the FM2 group and 338.06±16.50 μg/L, 416.30±34.13 μg/L and 220.36±26.16 μg/L, respectively, in the pGCsi-C treated group. These levels were significantly higher than those in the NC2 group, which were 127.33±15.98 μg/L (<italic>P</italic>&lt;0.01), 102.16±7.99 μg/L (<italic>P</italic>&lt;0.01) and 99.9±14 μg/L (<italic>P</italic>&lt;0.01), respectively. But their levels were significantly decreased after treatment with pGCsi-R1. The levels of PCIII, HA and LN in the pGCsi-R1 treated group decreased by 52.82% (<italic>P</italic>&lt;0.01), 42.6% (<italic>P</italic>&lt;0.01), and 67.8% (<italic>P</italic>&lt;0.01), respectively, compared with that in the FM2 group (<xref ref-type="table" rid="t3-ijms-09-00638">Table 3</xref>). These results showed that the suppression of RAGE significantly decreased the levels of serum PCIII, HA and LN in rats.</p></sec>
<sec>
<title>
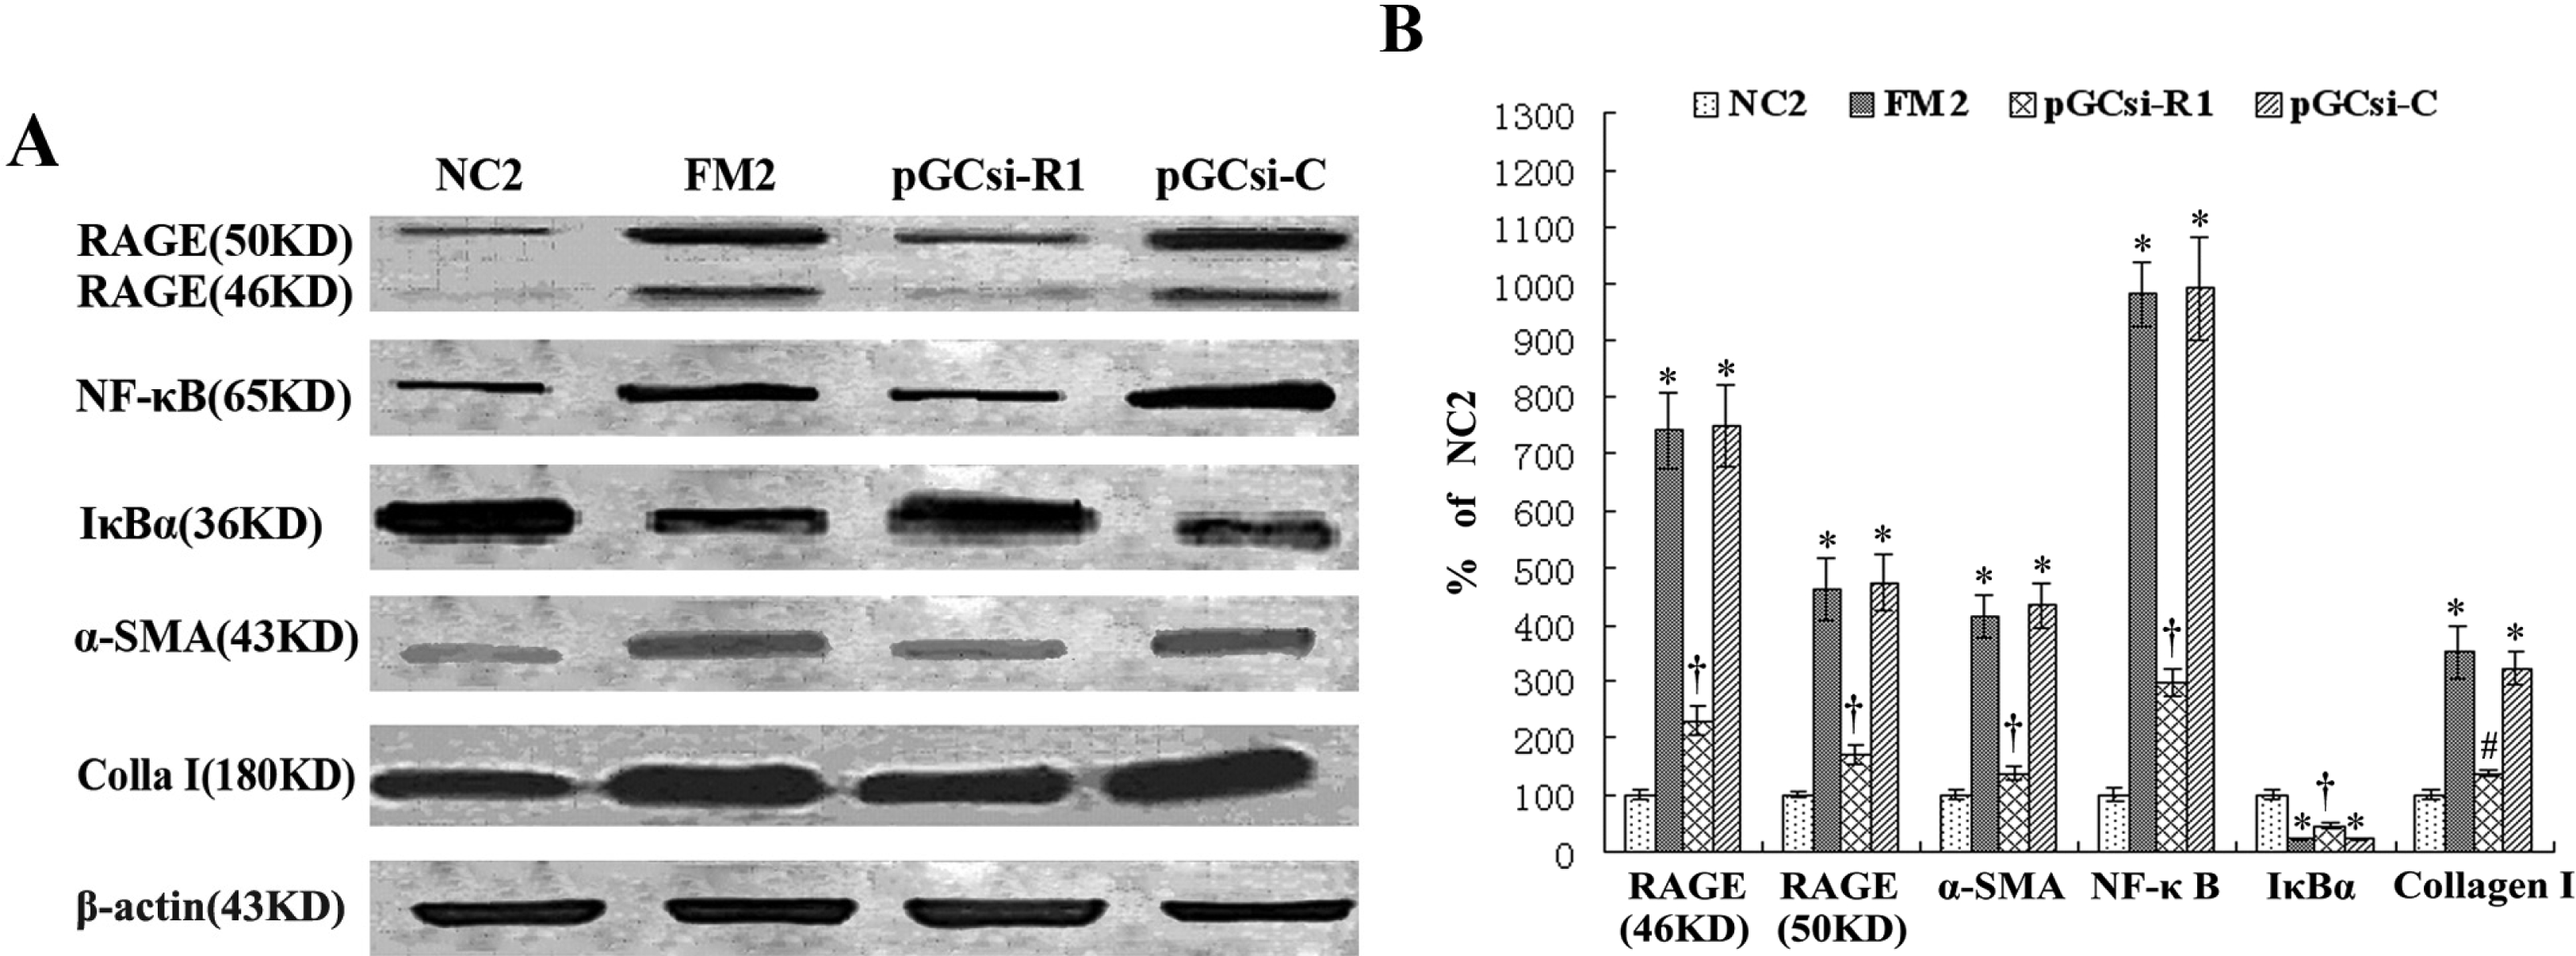
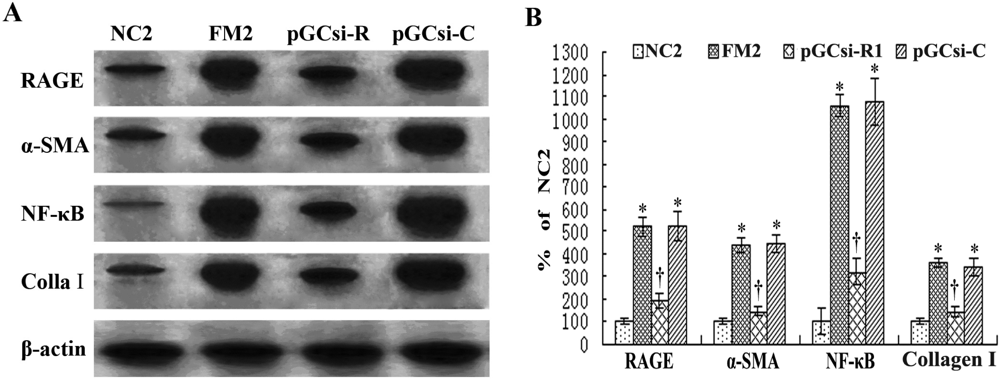
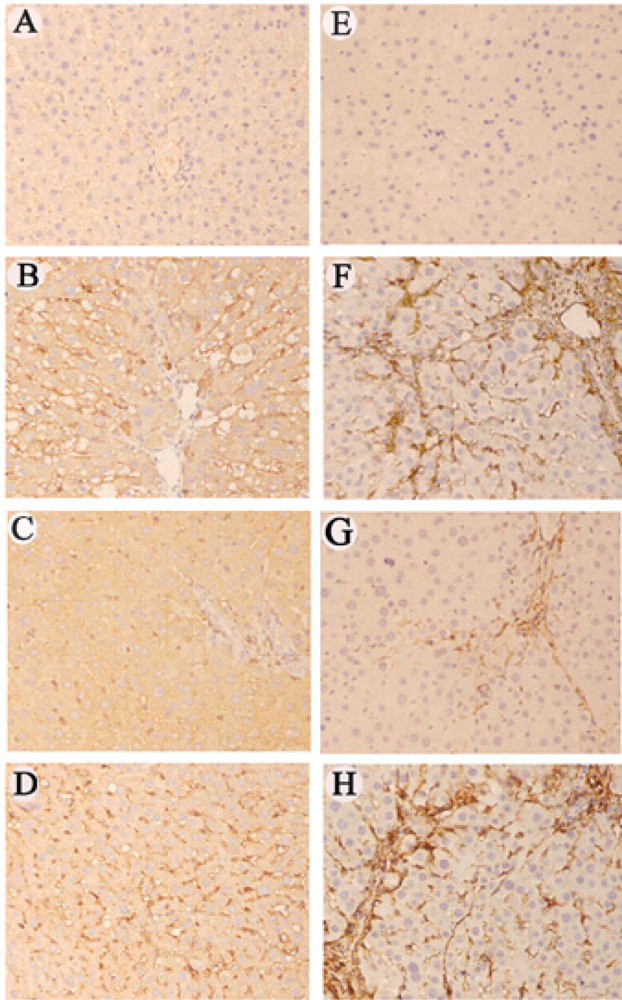
3.8 RAGE siRNA inhibited the expression of RAGE, NF-κB, IκBα, α-SMA and collagen I in rats</title>
<p>To confirm whether the specific siRNA influenced the expression of RAGE in the process of hepatic fibrosis, we determined the expression of RAGE mRNA and proteins in each group by Northern blot analysis and Western blot analysis. The expressions of RAGE mRNA and protein in the FM2 group and pGCsi-C treated group were significantly higher than in the NC2 group (<italic>P</italic>&lt;0.01); however, the RGAE mRNA and protein levels in pGCsi-R1 treated group were significantly lower than in the FM2 group and pGCsi-C treated group (<italic>P</italic>&lt;0.01) (<xref ref-type="fig" rid="f7-ijms-09-00638">Figure 7A–B</xref>, <xref ref-type="fig" rid="f8-ijms-09-00638">8A–B</xref>). The results of the immunohistochemical detection of RAGE in each group were shown in <xref ref-type="fig" rid="f9-ijms-09-00638">Figure 9A–D</xref> and <xref ref-type="table" rid="t4-ijms-09-00638">Table 4</xref>. Quantitative analysis (Imagepro Plus) showed that AOD value of RAGE in the NC2 group was significantly lower than that in the FM2 group and pGCsi-C treated group (<italic>P</italic>&lt;0.01). However, compared with the FM2 group, AOD value of RAGE in the pGCsi-R1 treated group was markedly decreased (<italic>P</italic>&lt;0.01). The results indicated that RAGE siRNA expressed by pGCsi-R1 effectively inhibited RAGE gene and protein expression in the fibrotic liver of rats.</p>
<p>The ratio of NF-κB mRNA to β-actin mRNA was 0.38±0.017 and 0.33±0.033 respectively in the FM2 group and pGCsi-C treated group, significantly higher than that (0.01±0.006) in the NC2 control group (<italic>P</italic>&lt;0.01). However, the up-regulation was significantly inhibited after treatment with pGCsi-R1 (<italic>P</italic>&lt;0.01) (<xref ref-type="fig" rid="f7-ijms-09-00638">Figure 7A–B</xref>). Similar changes were also observed in the expression of NF-κB protein (<xref ref-type="fig" rid="f8-ijms-09-00638">Figure 8A–B</xref>). The expressions of IκBα protein in the FM2 group and pGCsi-C treated group were significantly lower than in the NC2 group (<italic>P</italic>&lt;0.01). However, the expression of IκBα protein in the pGCsi-R1 treated group was markedly higher than in the FM2 group or pGCsi-C treated group (<italic>P</italic>&lt;0.01) (<xref ref-type="fig" rid="f8-ijms-09-00638">Figure 8A–B</xref>).</p>
<p>The expression of α-SMA indicated the activation of HSCs. The expressions of α-SMA mRNA and protein were significantly increased in the FM2 group and pGCsi-C treated group, compared with that in the NC2 group (<italic>P</italic>&lt;0.01). After treatment with pGCsi-R1, the expression levels of α-SMA mRNA and protein were markedly decreased in the pGCsi-R1 treated group compared with that in the FM2 group and pGCsi-C treated group (<italic>P</italic>&lt;0.01) (<xref ref-type="fig" rid="f7-ijms-09-00638">Figure 7A–B</xref>, <xref ref-type="fig" rid="f8-ijms-09-00638">8A–B</xref>). Immunohistological staining of α-SMA showed similar results. AOD values of α-SMA were 0.44±0.036 and 0.438±0.043 in the FM2 group and pGCsi-C treated group, respectively, 3.01- and 3.0-fold higher than that in the NC2 group (<italic>P</italic>&lt;0.01). After treatment with pGCsi-R1, AOD value of α-SMA in pGCsi-R1 treated group decreased to 47.95% of that in the FM2 group (<italic>P</italic>&lt;0.01) (<xref ref-type="fig" rid="f9-ijms-09-00638">Figure 9E–H</xref> and <xref ref-type="table" rid="t5-ijms-09-00638">Table 5</xref>).</p>
<p>In the NC2 group, the expression levels of collagen I mRNA and protein were very low. Compared with the NC2 group, the expression levels of collagen I mRNA and protein were dramatically increased in the FM2 group and pGCsi-C treated group (<italic>P</italic>&lt;0.01). However, the increase was significantly inhibited after treatment with pGCsi-R1 (<italic>P</italic>&lt;0.01) (<xref ref-type="fig" rid="f7-ijms-09-00638">Figure 7A–B</xref>, <xref ref-type="fig" rid="f8-ijms-09-00638">8A–B</xref>). These results showed that RAGE silencing significantly inhibited the expressions of NF-κB, α-SMA and collagen I, and significantly suppressed the degradation of IκBα in the fibrotic liver of rats.</p></sec>
<sec>
<title>
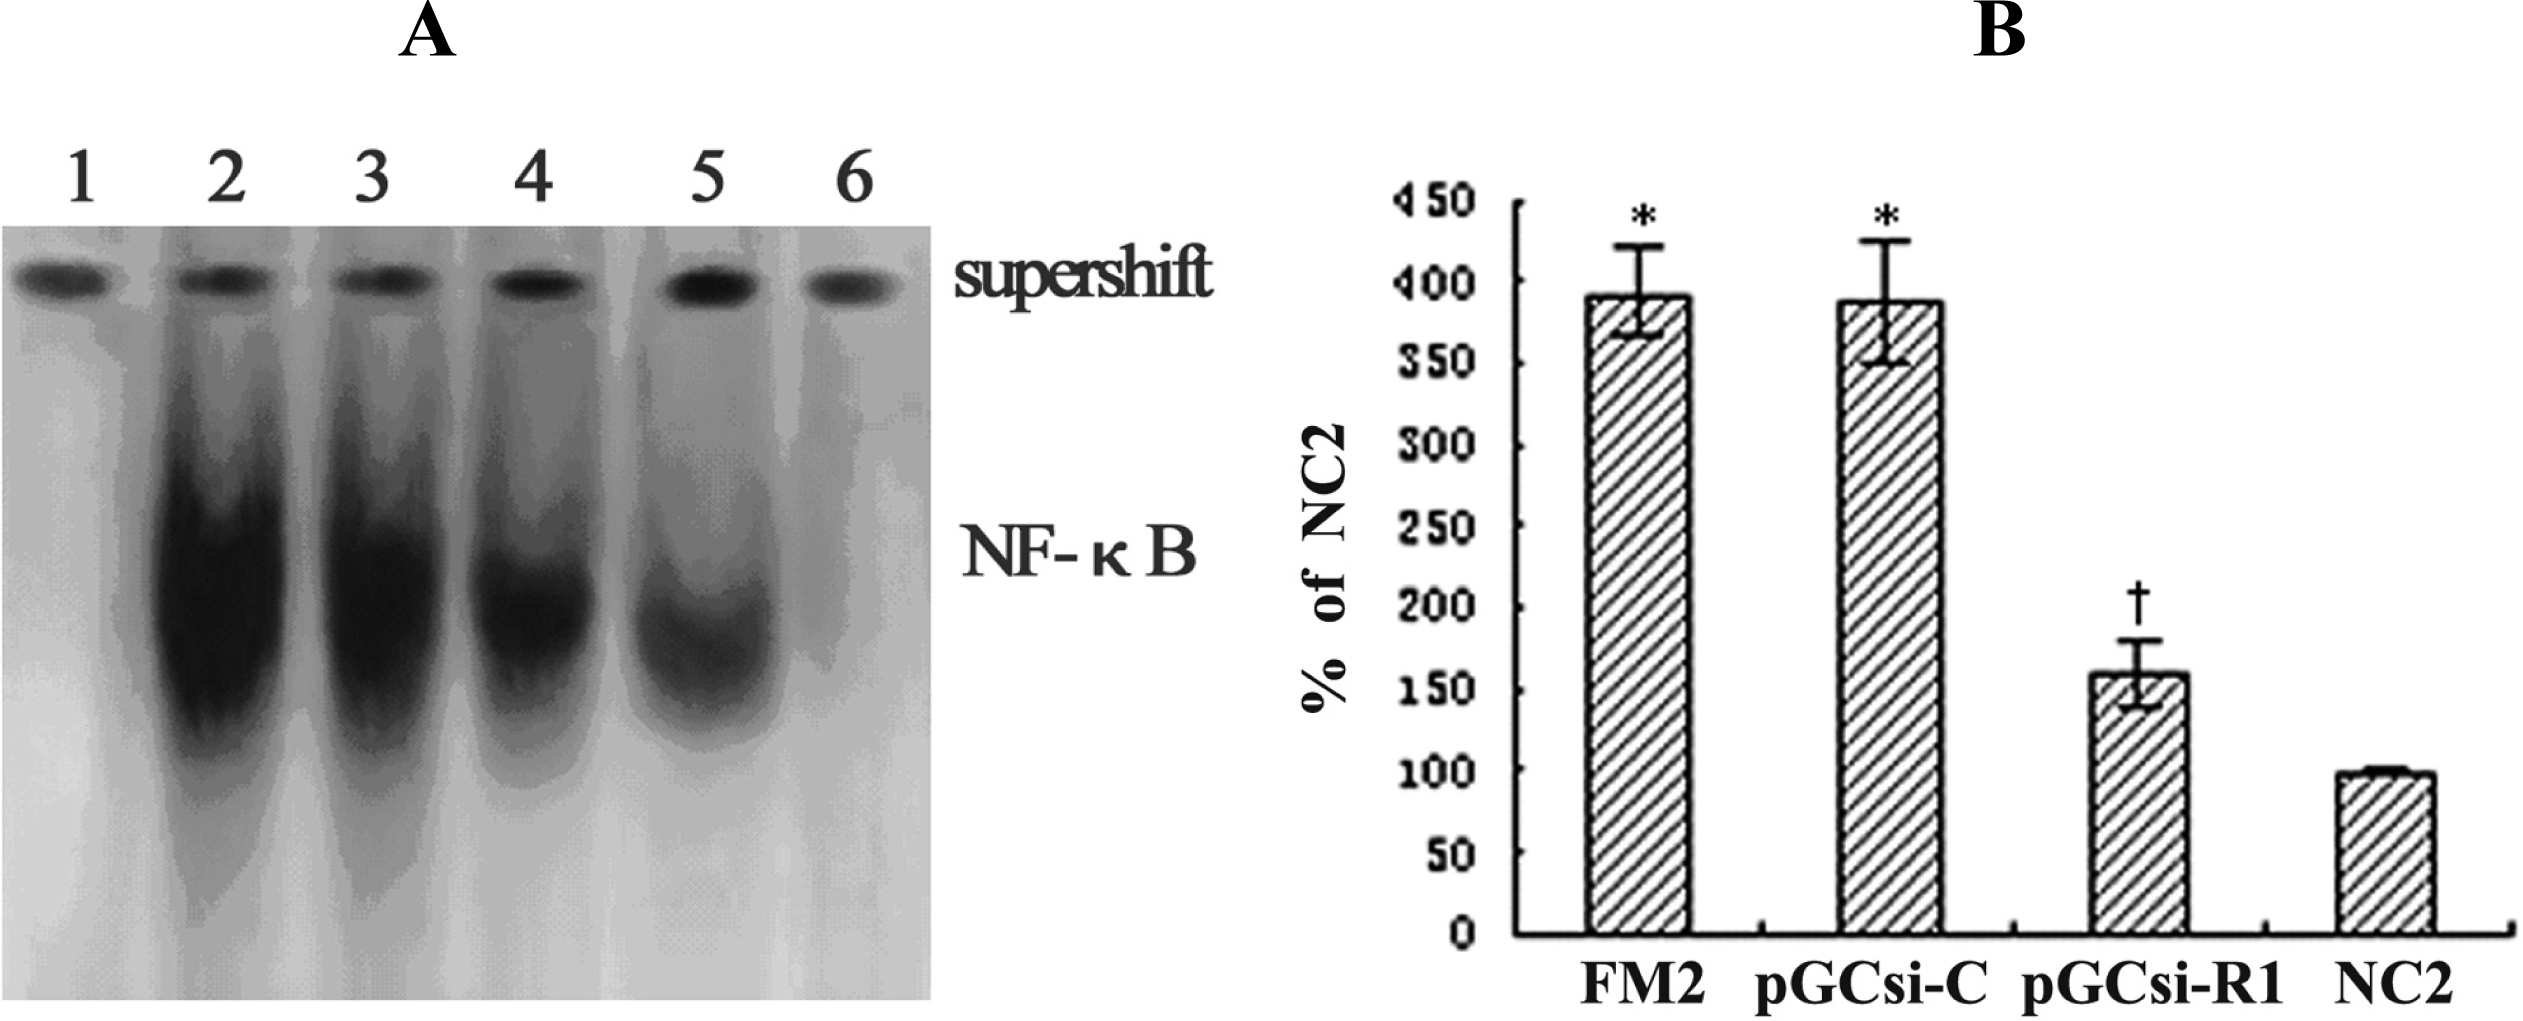
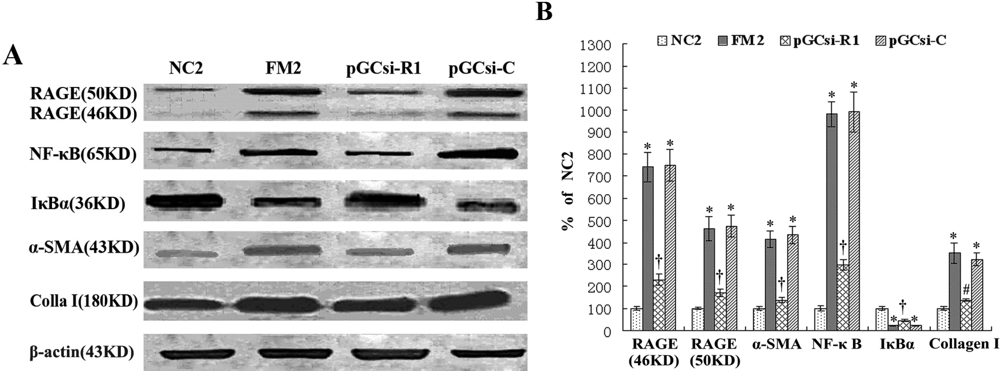
3.9 RAGE siRNA inhibited NF-κB activation in the fibrotic liver of rats</title>
<p>EMSA was used to analyze the nuclear translocation activity of NF-κB in liver tissues. As shown in <xref ref-type="fig" rid="f10-ijms-09-00638">Figure 10</xref>, the results of competition and Supershift experiments indicated that NF-κB can bind to the <sup>32</sup>P-labeled oligonucleotide probe containing the NF-κB consensus site specifically. The activities of NF-κB in the FM2 group and pGCsi-C treated group were about 3.93-fold and 3.87-fold higher than that of the NC2 group, respectively (<italic>P</italic>&lt;0.01). On the contrary, the activity of NF-κB in the pGCsi-R1 treated group was markedly decreased by 39.9%, compared with that in the FM2 group (<italic>P</italic>&lt;0.01). The results indicated that RAGE silencing by pGCsi-R1 expressed RAGE siRNA effectively inhibited the nuclear translocation activity of NF-κB in the fibrotic liver of rats.</p></sec>
<sec>
<title>
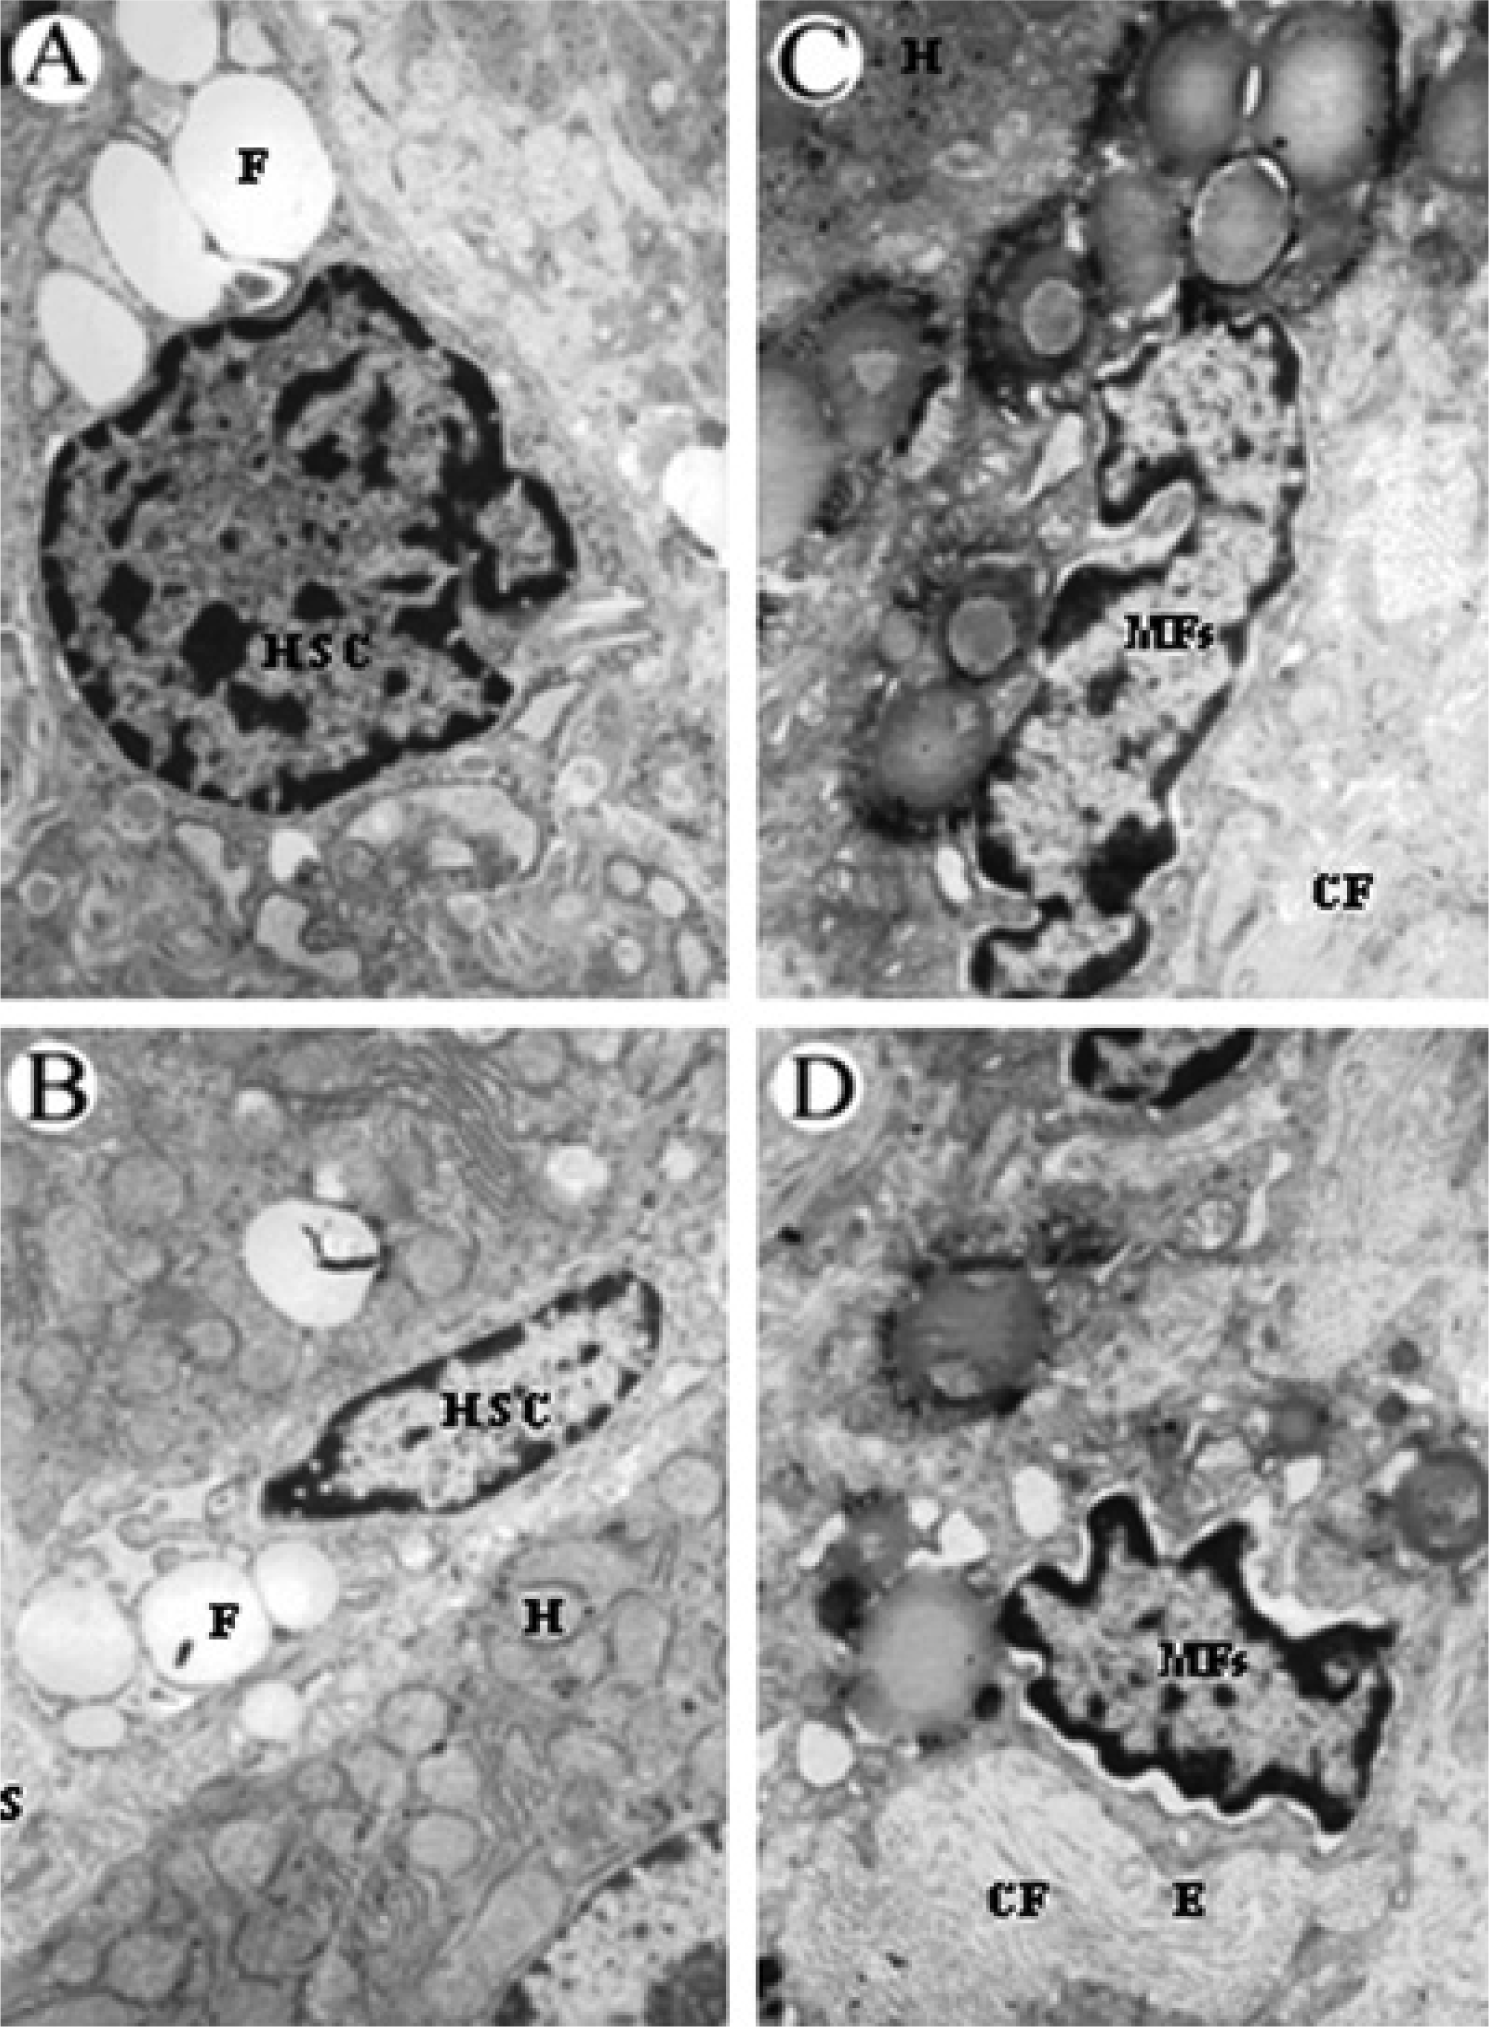
3.10 Effects of RAGE siRNA on changes in ultrastructure of rat liver</title>
<p>Transmission electron microscopy revealed a close intercellular connection of hepatic cells, regular distribution of various cell organelles, well arranged liver sinusoids, accumulated lipid droplets in HSCs and many fenestrae in the distal end of endothelial cells in the NC2 group (<xref ref-type="fig" rid="f11-ijms-09-00638">Figure 11A</xref>). However, a wide spread of hepatic cell necrosis, proliferation, swelling and hypertrophy of mitochodria, occurrence of myelinoid body, reduction of fenestrae in distal end of endothelial cells, formation of the basement membrane on endothelial side, many activated HSCs in Disse's space and a large amount of collagen fiber deposition were shown in the pGCsi-C treated group and the FM2 group (<xref ref-type="fig" rid="f11-ijms-09-00638">Figure 11C–D</xref>). On the contrary, inhibition of hepatocyte injury, normal orientation of cytoplasms, increasing number of lipid droplets in HSCs, and reduction of sedimentary collagen fibers in liver sinusoids and Disse's space were observed in pGCsi-R1 treated group (<xref ref-type="fig" rid="f11-ijms-09-00638">Figure 11B</xref>). These results indicated that pGCsi-R1 expressed RAGE siRNA significantly inhibited ultrastructural changes in fibrotic liver tissue.</p></sec></sec>
<sec sec-type="discussion">
<title>Discussion</title>
<p>RAGE is a new member of the superfamily of immunoglobulins on the cellular membrane. It consists of more than 400 amino acids and can be divided into extracelluar, transmembrane and cytoplasmic regions. RAGE expresses in all the monocytes, vascular endothelial cells, renal mesenchymal cells, neurocytes and smooth muscle cells, <italic>etc</italic>. RAGE, as a signal transduction receptor, mediates a variety of biological effects through binding to AGE on the cell surface. Activation of the functions of RAGE contributes to the pathogenesis of diabetic complications, arteriosclerosis, glomerulosclerosis, renal interstitial fibrosis, and peritoneal fibrosis induced by AGEs as well as to the development of other chronic diseases [<xref ref-type="bibr" rid="b11-ijms-09-00638">11</xref>, <xref ref-type="bibr" rid="b28-ijms-09-00638">28</xref>–<xref ref-type="bibr" rid="b31-ijms-09-00638">31</xref>].</p>
<p>Fehrenbact <italic>et al.</italic> [<xref ref-type="bibr" rid="b5-ijms-09-00638">5</xref>] confirmed that RAGE is exclusively expressed in HSCs and MFs in rat liver and its expression is up-regulated during the activation of HSCs and the transition of HSCs to MFs. This suggests that RAGE may be a major receptor in the activation and transition of HSCs to MFs, and the expression of RAGE in liver plays an important role in liver fibrosis.</p>
<p>By Northern blot analysis and Western blot analysis, we provided the first evidence that RAGE expression was low in normal rat liver (the NC1 group). However, with the progression of CCl<sub>4</sub>-induced liver fibrosis, both the mRNA and protein levels of RAGE were gradually increased and reached the maximum at 6 weeks after CCl<sub>4</sub> injection. There was a statistically significant difference between the NC1 control group and the FM1-6W group (CCl<sub>4</sub> induction for 6 weeks, p&lt;0.01). These results indicated that RAGE might be a major mediator in the process of rat liver fibrosis.</p>
<p>Previous studies demonstrated that specific siRNA expression vector targeting TGF-β1 or chemically modified synthetic siRNA targeting TIMP-2 specifically inhibit the expression of TGF-β1 and TIMP-2 gene, respectively, in rat liver and effectively prevent the liver from fibrosis or cirrhosis [<xref ref-type="bibr" rid="b32-ijms-09-00638">32</xref>–<xref ref-type="bibr" rid="b33-ijms-09-00638">33</xref>]. To confirm the inhibitory effect of RAGE siRNA on the development of hepatic fibrosis, rat hepatic fibrosis induced by intraperitoneal injection of CCl4 was treated with pGCsi-R1 administered through the tail vein. The expression of the RAGE siRNA was confirmed by Northern blot analysis. The histopathological aspects of liver tissue of fibrotic rats treated with pGCsi-R1 were inhibited significantly. Some of the improvements included the decrease of hepatocellular necrosis, inflammatory infiltration and fibroplasia, the resolution of fibrosepta, and the amelioration of ultrastructural changes. Furthermore, compared with the fibrosis group (FM2), the significant decrease of Knodell's and Ishak's scores demonstrated that the activity of inflammation and degree of fibrosis were markedly reduced by pGCsi-R1 expressed siRNA. Improved parameters of liver damage including serum ALT, ALB and TBIL levels also indicated the effectiveness of RAGE siRNA treatment. In addition, we found that the RAGE mRNA and protein levels were markedly enhanced in the FM2 and pGCsi-C treated groups, but the increases were dramatically inhibited by the administration of RAGE siRNA expressing vectors. All these results indicated that RAGE siRNA expressed by pGCsi-R1 can effectively inhibit the expression of RAGE gene and significantly suppress the development of hepatic fibrosis in rats induced by CCl<sub>4</sub>.</p>
<p>Previous studies have found that the activation of NF-κB is closely related to the pathogenesis of RAGE [<xref ref-type="bibr" rid="b9-ijms-09-00638">9</xref>]. The binding of AGE to RAGE induces intracellular oxidant stress [<xref ref-type="bibr" rid="b34-ijms-09-00638">34</xref>] and triggers subsequent intracellular signal cascades, such as activating NF-κB, p21ras, p44/p42 mitogen-activated protein kinases (MAPK), ERK1/2 kinase, and NAPH oxidase [<xref ref-type="bibr" rid="b8-ijms-09-00638">8</xref>–<xref ref-type="bibr" rid="b9-ijms-09-00638">9</xref>, <xref ref-type="bibr" rid="b35-ijms-09-00638">35</xref>–<xref ref-type="bibr" rid="b37-ijms-09-00638">37</xref>]. NF-κB as a critical component in inflammatory conditions can produce proinflammatory cytokines such as TNF-α and interleukin-6 (IL-6), which are involved in the process of fibrogenesis [<xref ref-type="bibr" rid="b38-ijms-09-00638">38</xref>–<xref ref-type="bibr" rid="b39-ijms-09-00638">39</xref>]. Therefore, suppressing the inflammatory response and reducing the release of proinflammatory cytokines such as NF-κB, TNF-α and IL-6, may prevent and reverse hepatic fibrosis [<xref ref-type="bibr" rid="b40-ijms-09-00638">40</xref>]. Li <italic>et al.</italic> [<xref ref-type="bibr" rid="b27-ijms-09-00638">27</xref>] demonstrated that Ang II and Aldo increase the NF-κB activity of HSCs and the expression of the NF-κB target gene, TNF-α, by inhibiting IκBα expression. AECI and Angiotensin II type 1 receptor (AT-1 receptor) blockers exert anti-fibrosis effect through inhibiting NF-κB activation in liver. Compared with the FM2 group and the pGCsi-C treated group, we found that the expression of IκBα protein in the pGCsi-R1 treated group was significantly increased. Meanwhile, the DNA binding activity of NF-κB in liver were significantly decreased. These results suggested that pGCsi-R1 expressed RAGE siRNA tethered NF-κB in cytosol and markedly inhibited the activation of NF-κB by reducing the degradation of IκBα in hepatic fibrosis. We further demonstrated that NF-κB (p65) mRNA and protein levels were significantly increased in the FM2 group and the pGCsi-C treated group compared with the NC2 group, but the increases were greatly decreased after RAGE siRNA treatment. These results indicated that pGCsi-R1 expressed RAGE siRNA significantly suppressed the expression of the mRNA and protein levels of NF-κB in the fibrotic liver of rats. Hence, RAGE siRNA may exert its effect by inhibiting the expression of NF-κB and by blocking NF-κB/IκB signaling pathway induced proinflammatory mediator cascade to suppress the development of hepatic fibrosis via inhibition of the degradation of IκBα.</p>
<p>Activation of HSCs plays a key role in hepatic fibrosis [<xref ref-type="bibr" rid="b41-ijms-09-00638">41</xref>–<xref ref-type="bibr" rid="b42-ijms-09-00638">42</xref>]. Proliferation and contraction of activated HSCs increase the resistance of hepatic sinuses and aggravate liver injury. Growth factors (such as platelet-derived growth factor (PDGF A or B), transforming growth factor (TGF-α or -β)) produced by activated HSCs via autocrine and paracrine secretion change the distribution and content of collagen fibrils as well as the expression of tissue metal matrix protease 1 and 2, which reconstruct the extracellular matrix [<xref ref-type="bibr" rid="b43-ijms-09-00638">43</xref>–<xref ref-type="bibr" rid="b44-ijms-09-00638">44</xref>].</p>
<p>In addition to being a major proinflammatory signaling mediator, NF-κB is also a key transcription factor involved in the activation of HSCs [<xref ref-type="bibr" rid="b38-ijms-09-00638">38</xref>]. To further study the effect of RAGE siRNA expressed by pGCsi-R1 on NF-κB/IκB signaling pathway in hepatic fibrosis, we detected the expression of α-SMA, which reflects the amount of activated HSCs in liver fibrosis [<xref ref-type="bibr" rid="b45-ijms-09-00638">45</xref>], by Northern blot, Western blot analysis and immunohistochemical staining. Our results revealed that in comparison with the FM2 and pGCsi-C treated groups, the pGCsi-R1 treated group had significantly lower α-SMA mRNA and protein levels, suggesting another possible mechanism of the suppressive effect of pGCsi-R1 expressed RAGE siRNA on the development of hepatic fibrosis.</p>
<p>Hepatic fibrosis is characterized by excessive production and deposition of extracellular matrix (ECM) components [<xref ref-type="bibr" rid="b46-ijms-09-00638">46</xref>]. Type I collagen is the major component of the abnormally deposited ECM in hepatic fibrosis and HSCs are known to be the main source of ECM [<xref ref-type="bibr" rid="b47-ijms-09-00638">47</xref>–<xref ref-type="bibr" rid="b48-ijms-09-00638">48</xref>]. Our study showed that inhibiting RAGE gene by pGCsi-R1 expressed RAGE siRNA effectively inhibited the expression of collagen I in CCl<sub>4</sub>-induced rat liver fibrosis and dramatically reduced the levels of serum PCIII, HA and LN. These results indicated that the inhibition of RAGE had prominent anti-fibrotic effects, further confirming the major role RAGE in the progression of liver fibrosis. However, the mechanisms of the effects of RAGE on the accumulation of ECM in hepatic fibrosis need further investigation.</p>
<p>In conclusion, using the RAGE specific siRNA strategy, we effectively inhibited RAGE gene expression in rat liver fibrosis model and successfully prevented experimental liver fibrosis in rat after CCl<sub>4</sub> injection. The suppression of the upregulated expression and activity of NF-κB gene and HSCs activation via inhibition of IκBα degradation, inhibition of ECM production, attenuation of liver injury might be the possible mechanisms of liver fibrosis prevention by inhibiting RAGE in rats. These findings strongly suggested that RAGE may be a new target for combating liver fibrosis and RAGE specific siRNA might be an effective candidate to prevent liver fibrogenesis.</p></sec></body>
<back>
<ack>
<title>Acknowledgments</title>
<p>We thank Dr. Scott L. Friedman of the Mount Sinai School of Medicine, USA for providing the HSC-T6 cells; Dr. Chen Shenping for offering excellent technical assistance.</p></ack>
<ref-list>
<title>References</title>
<ref id="b1-ijms-09-00638"><label>1</label><citation citation-type="journal"><person-group person-group-type="author"><name><surname>Friedman</surname><given-names>SL</given-names></name></person-group><article-title>Molecular regulation of hepatic fibrosis, an integrated cellular response to tissue injury</article-title><source>J Biol Chem</source><year>2000</year><volume>275</volume><fpage>2247</fpage><lpage>2250</lpage><pub-id pub-id-type="doi">10.1074/jbc.275.4.2247</pub-id><pub-id pub-id-type="pmid">10644669</pub-id></citation></ref>
<ref id="b2-ijms-09-00638"><label>2</label><citation citation-type="journal"><person-group person-group-type="author"><name><surname>Pinzani</surname><given-names>M</given-names></name></person-group><article-title>Liver fibrosis</article-title><source>Springer Semin Immunopathol</source><year>1999</year><volume>21</volume><fpage>475</fpage><lpage>490</lpage><pub-id pub-id-type="doi">10.1007/BF00870306</pub-id><pub-id pub-id-type="pmid">10945037</pub-id></citation></ref>
<ref id="b3-ijms-09-00638"><label>3</label><citation citation-type="journal"><person-group person-group-type="author"><name><surname>Moreira</surname><given-names>PK</given-names></name></person-group><article-title>Hepatic stellate cells and liver fibrosis</article-title><source>Arch Pathol Lab Med</source><year>2007</year><volume>131</volume><fpage>1728</fpage><lpage>1734</lpage><pub-id pub-id-type="pmid">17979495</pub-id></citation></ref>
<ref id="b4-ijms-09-00638"><label>4</label><citation citation-type="journal"><person-group person-group-type="author"><name><surname>Reeves</surname><given-names>HL</given-names></name><name><surname>Friedman</surname><given-names>SL</given-names></name></person-group><article-title>Activation of hepatic stellate cells-a key issue in liver fibrosis</article-title><source>Front Biosci</source><year>2002</year><volume>7</volume><fpage>d808</fpage><lpage>826</lpage><pub-id pub-id-type="doi">10.2741/reeves</pub-id><pub-id pub-id-type="pmid">11897564</pub-id></citation></ref>
<ref id="b5-ijms-09-00638"><label>5</label><citation citation-type="journal"><person-group person-group-type="author"><name><surname>Fehrenbach</surname><given-names>H</given-names></name><name><surname>Weiskirchen</surname><given-names>R</given-names></name><name><surname>Kasper</surname><given-names>M</given-names></name><name><surname>Gressner</surname><given-names>AM</given-names></name></person-group><article-title>Up-regulation expression of the receptor for advanced glycation end products in cultured rat hepatic stellate cells during transdifferentiation to myofibroblasts</article-title><source>Hepatology</source><year>2001</year><volume>34</volume><fpage>943</fpage><lpage>952</lpage><pub-id pub-id-type="pmid">11679965</pub-id></citation></ref>
<ref id="b6-ijms-09-00638"><label>6</label><citation citation-type="journal"><person-group person-group-type="author"><name><surname>Schmidt</surname><given-names>AM</given-names></name><name><surname>Yan</surname><given-names>SD</given-names></name><name><surname>Yan</surname><given-names>SF</given-names></name><name><surname>Stern</surname><given-names>DM</given-names></name></person-group><article-title>The biology of the receptor for advanced glycation end products and its ligands</article-title><source>Biochim Biophys Acta</source><year>2000</year><volume>1498</volume><fpage>99</fpage><lpage>111</lpage><pub-id pub-id-type="doi">10.1016/S0167-4889(00)00087-2</pub-id><pub-id pub-id-type="pmid">11108954</pub-id></citation></ref>
<ref id="b7-ijms-09-00638"><label>7</label><citation citation-type="journal"><person-group person-group-type="author"><name><surname>Kislinger</surname><given-names>T</given-names></name><name><surname>Fu</surname><given-names>C</given-names></name><name><surname>Huber</surname><given-names>B</given-names></name><name><surname>Qu</surname><given-names>W</given-names></name><name><surname>Taguchi</surname><given-names>A</given-names></name><name><surname>Du</surname><given-names>Yan S</given-names></name><name><surname>Hofmann</surname><given-names>M</given-names></name><name><surname>Yan</surname><given-names>SF</given-names></name><name><surname>Pischetsrieder</surname><given-names>M</given-names></name><name><surname>Stern</surname><given-names>D</given-names></name><name><surname>Schmidt</surname><given-names>AM</given-names></name></person-group><article-title>N(epsilon)- (carboxymethyl)lysine adducts of proteins are ligands for receptor for advanced glycation end products that activate cell signalling pathways and modulate gene expression</article-title><source>J Biol Chem</source><year>1999</year><volume>274</volume><fpage>31740</fpage><lpage>31749</lpage><pub-id pub-id-type="doi">10.1074/jbc.274.44.31740</pub-id><pub-id pub-id-type="pmid">10531386</pub-id></citation></ref>
<ref id="b8-ijms-09-00638"><label>8</label><citation citation-type="journal"><person-group person-group-type="author"><name><surname>Lander</surname><given-names>HM</given-names></name><name><surname>Tauras</surname><given-names>JM</given-names></name><name><surname>Ogiste</surname><given-names>JS</given-names></name><name><surname>Hori</surname><given-names>O</given-names></name><name><surname>Moss</surname><given-names>RA</given-names></name><name><surname>Schmidt</surname><given-names>AM</given-names></name></person-group><article-title>Activation of the receptor for advanced glycation end products triggers a p21(ras)-dependent mitogen-activated protein kinase pathway regulated by oxidant stress</article-title><source>J Biol Chem</source><year>1997</year><volume>272</volume><fpage>17810</fpage><lpage>17814</lpage><pub-id pub-id-type="doi">10.1074/jbc.272.28.17810</pub-id><pub-id pub-id-type="pmid">9211935</pub-id></citation></ref>
<ref id="b9-ijms-09-00638"><label>9</label><citation citation-type="journal"><person-group person-group-type="author"><name><surname>Yan</surname><given-names>SD</given-names></name><name><surname>Schmidt</surname><given-names>AM</given-names></name><name><surname>Anderson</surname><given-names>GM</given-names></name><name><surname>Chang</surname><given-names>J</given-names></name><name><surname>Brett</surname><given-names>J</given-names></name><name><surname>Zou</surname><given-names>YS</given-names></name><name><surname>Pinsky</surname><given-names>D</given-names></name><name><surname>Stern</surname><given-names>D</given-names></name></person-group><article-title>Enhanced cellular oxidant stress by the interaction of advanced glycation end products with their receptors/binding proteins</article-title><source>J Biol Chem</source><year>1994</year><volume>269</volume><fpage>9889</fpage><lpage>9897</lpage><pub-id pub-id-type="pmid">8144582</pub-id></citation></ref>
<ref id="b10-ijms-09-00638"><label>10</label><citation citation-type="journal"><person-group person-group-type="author"><name><surname>Oldfield</surname><given-names>MD</given-names></name><name><surname>Bach</surname><given-names>LA</given-names></name><name><surname>Forbes</surname><given-names>JM</given-names></name><name><surname>Nikolic-Paterson</surname><given-names>D</given-names></name><name><surname>McRobert</surname><given-names>A</given-names></name><name><surname>Thallas</surname><given-names>V</given-names></name><name><surname>Atkins</surname><given-names>RC</given-names></name><name><surname>Osicka</surname><given-names>T</given-names></name><name><surname>Jerums</surname><given-names>G</given-names></name><name><surname>Cooper</surname><given-names>ME</given-names></name></person-group><article-title>Advanced glycation end products cause epithelial-myofibroblast transdifferentiation via the receptor for advanced glycation end products (RAGE)</article-title><source>J Clin Invest</source><year>2001</year><volume>108</volume><fpage>1853</fpage><lpage>1863</lpage><pub-id pub-id-type="pmid">11748269</pub-id></citation></ref>
<ref id="b11-ijms-09-00638"><label>11</label><citation citation-type="journal"><person-group person-group-type="author"><name><surname>De Vriese</surname><given-names>AS</given-names></name><name><surname>Tilton</surname><given-names>RG</given-names></name><name><surname>Mortiers</surname><given-names>S</given-names></name><name><surname>Lameire</surname><given-names>NH</given-names></name></person-group><article-title>Myofibroblast transdifferentiation of mesothelial cells is mediated by RAGE and contributes to peritoneal fibrosis in uraemia</article-title><source>Nephrol Dial Transplant</source><year>2006</year><volume>21</volume><fpage>2549</fpage><lpage>2555</lpage><pub-id pub-id-type="doi">10.1093/ndt/gfl271</pub-id><pub-id pub-id-type="pmid">16757496</pub-id></citation></ref>
<ref id="b12-ijms-09-00638"><label>12</label><citation citation-type="journal"><person-group person-group-type="author"><name><surname>Sebekova</surname><given-names>K</given-names></name><name><surname>Kupcova</surname><given-names>V</given-names></name><name><surname>Schinzel</surname><given-names>R</given-names></name><name><surname>Heidland</surname><given-names>A</given-names></name></person-group><article-title>Markedly elevated levels of plasma advanced glycation end products in patients with liver cirrhosis-amelioration by liver transplantation</article-title><source>J Hepatol</source><year>2002</year><volume>36</volume><fpage>66</fpage><lpage>71</lpage><pub-id pub-id-type="pmid">11804666</pub-id></citation></ref>
<ref id="b13-ijms-09-00638"><label>13</label><citation citation-type="journal"><person-group person-group-type="author"><name><surname>Ahmed</surname><given-names>N</given-names></name><name><surname>Luthen</surname><given-names>R</given-names></name><name><surname>Haussinger</surname><given-names>D</given-names></name><name><surname>Sebekova</surname><given-names>K</given-names></name><name><surname>Schinzel</surname><given-names>R</given-names></name><name><surname>Voelker</surname><given-names>W</given-names></name><name><surname>Heidland</surname><given-names>A</given-names></name><name><surname>Thornalley</surname><given-names>PJ</given-names></name></person-group><article-title>Increased protein glycation in cirrhosis and therapeutic strategies to prevent it</article-title><source>Ann N Y Acad Sci</source><year>2005</year><volume>1043</volume><fpage>718</fpage><lpage>724</lpage><pub-id pub-id-type="doi">10.1196/annals.1333.083</pub-id><pub-id pub-id-type="pmid">16037298</pub-id></citation></ref>
<ref id="b14-ijms-09-00638"><label>14</label><citation citation-type="journal"><person-group person-group-type="author"><name><surname>Yagmur</surname><given-names>E</given-names></name><name><surname>Tacke</surname><given-names>F</given-names></name><name><surname>Weiss</surname><given-names>C</given-names></name><name><surname>Lahme</surname><given-names>B</given-names></name><name><surname>Manns</surname><given-names>MP</given-names></name><name><surname>Kiefer</surname><given-names>P</given-names></name><name><surname>Trautwein</surname><given-names>C</given-names></name><name><surname>Gressner</surname><given-names>AM</given-names></name></person-group><article-title>Elevation of Nepsilon-(carboxymethyl)lysine-modified advanced glycation end products in chronic liver disease is an indicator of liver cirrhosis</article-title><source>Clin Biochem</source><year>2006</year><volume>39</volume><fpage>39</fpage><lpage>45</lpage><pub-id pub-id-type="doi">10.1016/j.clinbiochem.2005.07.016</pub-id><pub-id pub-id-type="pmid">16321365</pub-id></citation></ref>
<ref id="b15-ijms-09-00638"><label>15</label><citation citation-type="journal"><person-group person-group-type="author"><name><surname>Zeng</surname><given-names>S</given-names></name><name><surname>Feirt</surname><given-names>N,</given-names></name><name><surname>Goldstein</surname><given-names>M</given-names></name><name><surname>Guarrera</surname><given-names>J</given-names></name><name><surname>Ippagunta</surname><given-names>N</given-names></name><name><surname>Ekong</surname><given-names>U</given-names></name><name><surname>Dun</surname><given-names>H</given-names></name><name><surname>Lu</surname><given-names>Y</given-names></name><name><surname>Qu</surname><given-names>W</given-names></name><name><surname>Schmidt</surname><given-names>AM</given-names></name><name><surname>Emond</surname><given-names>JC</given-names></name></person-group><article-title>Blockade of receptor for advanced glycation end products (RAGE) attenuates ischemia and reperfusion injury to the liver in mice</article-title><source>Hepatology</source><year>2004</year><volume>39</volume><fpage>422</fpage><lpage>432</lpage><pub-id pub-id-type="doi">10.1002/hep.20045</pub-id><pub-id pub-id-type="pmid">14767995</pub-id></citation></ref>
<ref id="b16-ijms-09-00638"><label>16</label><citation citation-type="journal"><person-group person-group-type="author"><name><surname>May</surname><given-names>MJ</given-names></name><name><surname>Ghosh</surname><given-names>S</given-names></name></person-group><article-title>Rel/NF-kappaB and I kappaB proteins: an overview</article-title><source>Semin Cancer Biol</source><year>1997</year><volume>8</volume><fpage>63</fpage><lpage>73</lpage><pub-id pub-id-type="doi">10.1006/scbi.1997.0057</pub-id><pub-id pub-id-type="pmid">9299584</pub-id></citation></ref>
<ref id="b17-ijms-09-00638"><label>17</label><citation citation-type="journal"><person-group person-group-type="author"><name><surname>Lawrence</surname><given-names>T</given-names></name><name><surname>Bebien</surname><given-names>M</given-names></name><name><surname>Liu</surname><given-names>GY</given-names></name><name><surname>Nizet</surname><given-names>V</given-names></name><name><surname>Karin</surname><given-names>M</given-names></name></person-group><article-title>IKKalpha limits macrophage NF-kappaB activation and contributes to the resolution of inflammation</article-title><source>Nature</source><year>2005</year><volume>434</volume><fpage>1138</fpage><lpage>1143</lpage><pub-id pub-id-type="doi">10.1038/nature03491</pub-id><pub-id pub-id-type="pmid">15858576</pub-id></citation></ref>
<ref id="b18-ijms-09-00638"><label>18</label><citation citation-type="journal"><person-group person-group-type="author"><name><surname>Wright</surname><given-names>MC</given-names></name><name><surname>Issa</surname><given-names>R</given-names></name><name><surname>Smart</surname><given-names>DE</given-names></name><name><surname>Trim</surname><given-names>N</given-names></name><name><surname>Murray</surname><given-names>GI</given-names></name><name><surname>Primrose</surname><given-names>JN</given-names></name><name><surname>Arthur</surname><given-names>MJ</given-names></name><name><surname>Iredale</surname><given-names>JP</given-names></name><name><surname>Mann</surname><given-names>DA</given-names></name></person-group><article-title>Gliotoxin stimulates the apoptosis of human and rat hepatic stellate cells and enhances the resolution of liver fibrosis in rats</article-title><source>Gastroenterology</source><year>2001</year><volume>121</volume><fpage>685</fpage><lpage>698</lpage><pub-id pub-id-type="doi">10.1053/gast.2001.27188</pub-id><pub-id pub-id-type="pmid">11522753</pub-id></citation></ref>
<ref id="b19-ijms-09-00638"><label>19</label><citation citation-type="journal"><person-group person-group-type="author"><name><surname>Oakley</surname><given-names>F</given-names></name><name><surname>Meso</surname><given-names>M</given-names></name><name><surname>Iredale</surname><given-names>JP</given-names></name><name><surname>Green</surname><given-names>K</given-names></name><name><surname>Marek</surname><given-names>CJ</given-names></name><name><surname>Zhou</surname><given-names>X</given-names></name><name><surname>May</surname><given-names>MJ</given-names></name><name><surname>Millward-Sadler</surname><given-names>H</given-names></name><name><surname>Wright</surname><given-names>MC</given-names></name><name><surname>Mann</surname><given-names>DA</given-names></name></person-group><article-title>Inhibition of inhibitor of kappaB kinases stimulates hepatic stellate cell apoptosis and accelerated recovery from rat liver fibrosis</article-title><source>Gastroenterology</source><year>2005</year><volume>128</volume><fpage>108</fpage><lpage>120</lpage><pub-id pub-id-type="doi">10.1053/j.gastro.2004.10.003</pub-id><pub-id pub-id-type="pmid">15633128</pub-id></citation></ref>
<ref id="b20-ijms-09-00638"><label>20</label><citation citation-type="journal"><person-group person-group-type="author"><name><surname>Bierhaus</surname><given-names>A</given-names></name><name><surname>Schiekofer</surname><given-names>S</given-names></name><name><surname>Schwaninger</surname><given-names>M</given-names></name><name><surname>Andrassy</surname><given-names>M</given-names></name><name><surname>Humpert</surname><given-names>PM</given-names></name><name><surname>Chen</surname><given-names>J</given-names></name><name><surname>Hong</surname><given-names>M</given-names></name><name><surname>Luther</surname><given-names>T</given-names></name><name><surname>Henle</surname><given-names>T</given-names></name><name><surname>Kloting</surname><given-names>I</given-names></name><name><surname>Morcos</surname><given-names>M</given-names></name><name><surname>Hofmann</surname><given-names>M</given-names></name><name><surname>Tritschler</surname><given-names>H</given-names></name><name><surname>Weigle</surname><given-names>B</given-names></name><name><surname>Kasper</surname><given-names>M</given-names></name><name><surname>Smith</surname><given-names>M</given-names></name><name><surname>Perry</surname><given-names>G</given-names></name><name><surname>Schmidt</surname><given-names>AM</given-names></name><name><surname>Stern</surname><given-names>DM</given-names></name><name><surname>Haring</surname><given-names>HU</given-names></name><name><surname>Schleicher</surname><given-names>E</given-names></name><name><surname>Nawroth</surname><given-names>PP</given-names></name></person-group><article-title>Diabetes-associated sustained activation of the transcription factor nuclear factor-kappa B</article-title><source>Diabetes</source><year>2001</year><volume>50</volume><fpage>2792</fpage><lpage>2808</lpage><pub-id pub-id-type="doi">10.2337/diabetes.50.12.2792</pub-id><pub-id pub-id-type="pmid">11723063</pub-id></citation></ref>
<ref id="b21-ijms-09-00638"><label>21</label><citation citation-type="journal"><person-group person-group-type="author"><name><surname>Knodell</surname><given-names>RG</given-names></name><name><surname>Ishak</surname><given-names>KG</given-names></name><name><surname>Black</surname><given-names>WC</given-names></name><name><surname>Chen</surname><given-names>TS</given-names></name><name><surname>Craig</surname><given-names>R</given-names></name><name><surname>Kaplowitz</surname><given-names>N</given-names></name><name><surname>Kiernan</surname><given-names>TW</given-names></name><name><surname>Wollman</surname><given-names>J</given-names></name></person-group><article-title>Formulation and application of a numerical scoring system for assessing histological activity in asymptomatic chronic active hepatitis</article-title><source>Hepatology</source><year>1981</year><volume>1</volume><fpage>431</fpage><lpage>435</lpage><pub-id pub-id-type="doi">10.1002/hep.1840010511</pub-id><pub-id pub-id-type="pmid">7308988</pub-id></citation></ref>
<ref id="b22-ijms-09-00638"><label>22</label><citation citation-type="journal"><person-group person-group-type="author"><name><surname>Ishak</surname><given-names>K</given-names></name><name><surname>Baptista</surname><given-names>A</given-names></name><name><surname>Bianchi</surname><given-names>L</given-names></name><name><surname>Callea</surname><given-names>F</given-names></name><name><surname>De Groote</surname><given-names>J</given-names></name><name><surname>Gudat</surname><given-names>F</given-names></name><name><surname>Denk</surname><given-names>H</given-names></name><name><surname>Desmet</surname><given-names>V</given-names></name><name><surname>Korb</surname><given-names>G</given-names></name><name><surname>MacSween</surname><given-names>RN</given-names></name><etal/></person-group><article-title>Histological grading and staging of chronic hepatitis</article-title><source>J Hepatol</source><year>1995</year><volume>22</volume><fpage>696</fpage><lpage>699</lpage><pub-id pub-id-type="doi">10.1016/0168-8278(95)80226-6</pub-id><pub-id pub-id-type="pmid">7560864</pub-id></citation></ref>
<ref id="b23-ijms-09-00638"><label>23</label><citation citation-type="journal"><person-group person-group-type="author"><name><surname>Ryhanen</surname><given-names>L</given-names></name><name><surname>Stenback</surname><given-names>F</given-names></name><name><surname>Ala-Kokko</surname><given-names>L</given-names></name><name><surname>Savolainen</surname><given-names>ER</given-names></name></person-group><article-title>The effect of malotilate on type III and type IV collagen, laminin and fibronectin metabolism in dimethylnitrosamine-induced liver fibrosis in the rat</article-title><source>J Hepatol</source><year>1996</year><volume>24</volume><fpage>238</fpage><lpage>245</lpage><pub-id pub-id-type="doi">10.1016/S0168-8278(96)80035-3</pub-id><pub-id pub-id-type="pmid">8907579</pub-id></citation></ref>
<ref id="b24-ijms-09-00638"><label>24</label><citation citation-type="journal"><person-group person-group-type="author"><name><surname>Gabrielli</surname><given-names>GB</given-names></name><name><surname>Capra</surname><given-names>F</given-names></name><name><surname>Casaril</surname><given-names>M</given-names></name><name><surname>Squarzoni</surname><given-names>S</given-names></name><name><surname>Tognella</surname><given-names>P</given-names></name><name><surname>Dagradi</surname><given-names>R</given-names></name><name><surname>De Maria</surname><given-names>E</given-names></name><name><surname>Colonbari</surname><given-names>R</given-names></name></person-group><article-title>Serum laminin and type III precollagen in chronic hepatitis C. Diagnostic value in the assessment of disease activity and fibrosis</article-title><source>Chin Chim Acta</source><year>1997</year><volume>265</volume><fpage>21</fpage><lpage>31</lpage><pub-id pub-id-type="doi">10.1016/S0009-8981(97)00103-4</pub-id></citation></ref>
<ref id="b25-ijms-09-00638"><label>25</label><citation citation-type="journal"><person-group person-group-type="author"><name><surname>Castera</surname><given-names>L</given-names></name><name><surname>Hartmann</surname><given-names>DJ</given-names></name><name><surname>Chapel</surname><given-names>F</given-names></name><name><surname>Guettier</surname><given-names>C</given-names></name><name><surname>Mall</surname><given-names>F</given-names></name><name><surname>Lons</surname><given-names>T</given-names></name><name><surname>Richardet</surname><given-names>JP</given-names></name><name><surname>Grimbert</surname><given-names>S</given-names></name><name><surname>Morassi</surname><given-names>O</given-names></name><name><surname>Beaugrand</surname><given-names>M</given-names></name><name><surname>Trinchet</surname><given-names>JC</given-names></name></person-group><article-title>Serum laminin and type IV collagen are accurate markers of histologically severe alcoholic hepatitis in patients with cirrhosis</article-title><source>J Hepatol</source><year>2000</year><volume>32</volume><fpage>412</fpage><lpage>418</lpage><pub-id pub-id-type="doi">10.1016/S0168-8278(00)80391-8</pub-id><pub-id pub-id-type="pmid">10735610</pub-id></citation></ref>
<ref id="b26-ijms-09-00638"><label>26</label><citation citation-type="journal"><person-group person-group-type="author"><name><surname>Liu</surname><given-names>Z</given-names></name><name><surname>Yu</surname><given-names>Y</given-names></name><name><surname>Jiang</surname><given-names>Y</given-names></name><name><surname>Li</surname><given-names>J</given-names></name></person-group><article-title>Growth hormone increases lung NF-kappaB activation and lung microvascular injury induced by lipopolysaccharide in rats</article-title><source>Ann Clin Lab Sci</source><year>2002</year><volume>32</volume><fpage>164</fpage><lpage>170</lpage><pub-id pub-id-type="pmid">12017199</pub-id></citation></ref>
<ref id="b27-ijms-09-00638"><label>27</label><citation citation-type="journal"><person-group person-group-type="author"><name><surname>Li</surname><given-names>X</given-names></name><name><surname>Meng</surname><given-names>Y</given-names></name><name><surname>Wu</surname><given-names>P</given-names></name><name><surname>Zhang</surname><given-names>Z</given-names></name><name><surname>Yang</surname><given-names>X</given-names></name></person-group><article-title>Angiotensin II and Aldosterone stimulating NF-kappaB and AP-1 activation in hepatic fibrosis of rat</article-title><source>Regul Pept</source><year>2007</year><volume>138</volume><fpage>15</fpage><lpage>25</lpage><pub-id pub-id-type="doi">10.1016/j.regpep.2006.07.011</pub-id><pub-id pub-id-type="pmid">16971004</pub-id></citation></ref>
<ref id="b28-ijms-09-00638"><label>28</label><citation citation-type="journal"><person-group person-group-type="author"><name><surname>Bierhaus</surname><given-names>A</given-names></name><name><surname>Hofmann</surname><given-names>MA</given-names></name><name><surname>Ziegler</surname><given-names>R</given-names></name><name><surname>Nawroth</surname><given-names>PP</given-names></name></person-group><article-title>AGEs and their interaction with AGE-receptors in vascular disease and diabetes mellitus. I. The AGE concept</article-title><source>Cardiovasc Res</source><year>1998</year><volume>37</volume><fpage>586</fpage><lpage>600</lpage><pub-id pub-id-type="doi">10.1016/S0008-6363(97)00233-2</pub-id><pub-id pub-id-type="pmid">9659442</pub-id></citation></ref>
<ref id="b29-ijms-09-00638"><label>29</label><citation citation-type="journal"><person-group person-group-type="author"><name><surname>Baeuerle</surname><given-names>PA</given-names></name><name><surname>Henkel</surname><given-names>T</given-names></name></person-group><article-title>Function and activation of NF-kappaB in the immune system</article-title><source>Annu Rev Immunol</source><year>1994</year><volume>12</volume><fpage>141</fpage><lpage>179</lpage><pub-id pub-id-type="doi">10.1146/annurev.iy.12.040194.001041</pub-id><pub-id pub-id-type="pmid">8011280</pub-id></citation></ref>
<ref id="b30-ijms-09-00638"><label>30</label><citation citation-type="journal"><person-group person-group-type="author"><name><surname>Yamamoto</surname><given-names>Y</given-names></name><name><surname>Kato</surname><given-names>I</given-names></name><name><surname>Doi</surname><given-names>T</given-names></name><name><surname>Yonekur</surname><given-names>H</given-names></name><name><surname>Ohashi</surname><given-names>S</given-names></name><name><surname>Takeuchi</surname><given-names>M</given-names></name><name><surname>Watanabe</surname><given-names>T</given-names></name><name><surname>Yamageshi</surname><given-names>S</given-names></name><name><surname>Sakurai</surname><given-names>S</given-names></name><name><surname>Takasawa</surname><given-names>S</given-names></name><name><surname>Okamoto</surname><given-names>H</given-names></name><name><surname>Yamamoto</surname><given-names>H</given-names></name></person-group><article-title>Development and prevention of advanced diabetic nepropathy in RAGE-overexpressing mice</article-title><source>J Clin Invest</source><year>2001</year><volume>108</volume><fpage>261</fpage><lpage>268</lpage><pub-id pub-id-type="pmid">11457879</pub-id></citation></ref>
<ref id="b31-ijms-09-00638"><label>31</label><citation citation-type="journal"><person-group person-group-type="author"><name><surname>Singh</surname><given-names>R</given-names></name><name><surname>Barden</surname><given-names>A</given-names></name><name><surname>Mori</surname><given-names>T</given-names></name><name><surname>Beilin</surname><given-names>L</given-names></name></person-group><article-title>Advanced glycation end-products:a review</article-title><source>Diabetologia</source><year>2001</year><volume>44</volume><fpage>129</fpage><lpage>146</lpage><pub-id pub-id-type="doi">10.1007/s001250051591</pub-id><pub-id pub-id-type="pmid">11270668</pub-id></citation></ref>
<ref id="b32-ijms-09-00638"><label>32</label><citation citation-type="journal"><person-group person-group-type="author"><name><surname>Kim</surname><given-names>KH</given-names></name><name><surname>Kim</surname><given-names>HC</given-names></name><name><surname>Hwang</surname><given-names>MY</given-names></name><name><surname>Oh</surname><given-names>HK</given-names></name><name><surname>Lee</surname><given-names>TS</given-names></name><name><surname>Chang</surname><given-names>HJ</given-names></name><name><surname>Song</surname><given-names>HJ</given-names></name><name><surname>Won</surname><given-names>NH</given-names></name><name><surname>Park</surname><given-names>KK</given-names></name></person-group><article-title>The antifibrotic effect of TGF-β1 siRNAs in murine modle of liver cirrhosis</article-title><source>Biochem Biophys Res Commun</source><year>2006</year><volume>343</volume><fpage>1072</fpage><lpage>1078</lpage><pub-id pub-id-type="doi">10.1016/j.bbrc.2006.03.087</pub-id><pub-id pub-id-type="pmid">16579972</pub-id></citation></ref>
<ref id="b33-ijms-09-00638"><label>33</label><citation citation-type="journal"><person-group person-group-type="author"><name><surname>Hu</surname><given-names>YB</given-names></name><name><surname>Li</surname><given-names>DG</given-names></name><name><surname>Lu</surname><given-names>HM</given-names></name></person-group><article-title>Modified synthetic siRNA targeting tissue inhibitor of metalloproteinase-2 inhibits hepatic fibrogenesis in rats</article-title><source>J Gene Med</source><year>2007</year><volume>9</volume><fpage>217</fpage><lpage>229</lpage><pub-id pub-id-type="doi">10.1002/jgm.1009</pub-id><pub-id pub-id-type="pmid">17351970</pub-id></citation></ref>
<ref id="b34-ijms-09-00638"><label>34</label><citation citation-type="journal"><person-group person-group-type="author"><name><surname>Wautier</surname><given-names>MP</given-names></name><name><surname>Chappey</surname><given-names>O</given-names></name><name><surname>Corda</surname><given-names>S</given-names></name><name><surname>Stern</surname><given-names>DM</given-names></name><name><surname>Schmidt</surname><given-names>AM</given-names></name><name><surname>Wautier</surname><given-names>JL</given-names></name></person-group><article-title>Activation of NADPH oxidase by AGE links oxidant stress to altered gene expression via RAGE</article-title><source>Am J Physiol Endocrinol Metab</source><year>2001</year><volume>280</volume><fpage>E685</fpage><lpage>694</lpage><pub-id pub-id-type="pmid">11287350</pub-id></citation></ref>
<ref id="b35-ijms-09-00638"><label>35</label><citation citation-type="journal"><person-group person-group-type="author"><name><surname>Zill</surname><given-names>H</given-names></name><name><surname>Bek</surname><given-names>S</given-names></name><name><surname>Hofmann</surname><given-names>T</given-names></name><name><surname>Huber</surname><given-names>J</given-names></name><name><surname>Frank</surname><given-names>O</given-names></name><name><surname>Lindenmeier</surname><given-names>M</given-names></name><name><surname>Weigle</surname><given-names>B</given-names></name><name><surname>Erbersdobler</surname><given-names>HF</given-names></name><name><surname>Scheidler</surname><given-names>S</given-names></name><name><surname>Busch</surname><given-names>AE</given-names></name><name><surname>Faist</surname><given-names>V</given-names></name></person-group><article-title>RAGE-mediated MAPK activation by food-derived AGE and non-AGE products</article-title><source>Biochen Biophys Res Commun</source><year>2003</year><volume>300</volume><fpage>311</fpage><lpage>315</lpage><pub-id pub-id-type="doi">10.1016/S0006-291X(02)02856-5</pub-id></citation></ref>
<ref id="b36-ijms-09-00638"><label>36</label><citation citation-type="journal"><person-group person-group-type="author"><name><surname>Taguchi</surname><given-names>A</given-names></name><name><surname>Blood</surname><given-names>DC</given-names></name><name><surname>del Toro</surname><given-names>G</given-names></name><name><surname>Canet</surname><given-names>A</given-names></name><name><surname>Lee</surname><given-names>DC</given-names></name><name><surname>Qu</surname><given-names>W</given-names></name><name><surname>Tanji</surname><given-names>N</given-names></name><name><surname>Lu</surname><given-names>Y</given-names></name><name><surname>Lalla</surname><given-names>E</given-names></name><name><surname>Fu</surname><given-names>C</given-names></name><name><surname>Hofmann</surname><given-names>MA</given-names></name><name><surname>Kislinger</surname><given-names>T</given-names></name><name><surname>Ingram</surname><given-names>M</given-names></name><name><surname>Lu</surname><given-names>A</given-names></name><name><surname>Tanaka</surname><given-names>H</given-names></name><name><surname>Hori</surname><given-names>O</given-names></name><name><surname>Ogawa</surname><given-names>S</given-names></name><name><surname>Stern</surname><given-names>DM</given-names></name><name><surname>Schmidt</surname><given-names>AM</given-names></name></person-group><article-title>Blockade of RAGE-amphoterin signalling suppresses tumour growth and metastases</article-title><source>Nature</source><year>2000</year><volume>405</volume><fpage>354</fpage><lpage>360</lpage><pub-id pub-id-type="doi">10.1038/35012626</pub-id><pub-id pub-id-type="pmid">10830965</pub-id></citation></ref>
<ref id="b37-ijms-09-00638"><label>37</label><citation citation-type="journal"><person-group person-group-type="author"><name><surname>Bataller</surname><given-names>R</given-names></name><name><surname>Brenner</surname><given-names>DA</given-names></name></person-group><article-title>Liver fibrosis</article-title><source>J Clin Invest</source><year>2005</year><volume>115</volume><fpage>209</fpage><lpage>218</lpage><pub-id pub-id-type="pmid">15690074</pub-id></citation></ref>
<ref id="b38-ijms-09-00638"><label>38</label><citation citation-type="journal"><person-group person-group-type="author"><name><surname>Schwabe</surname><given-names>RF</given-names></name><name><surname>Schnabl</surname><given-names>B</given-names></name><name><surname>Kweon</surname><given-names>YO</given-names></name><name><surname>Brenner</surname><given-names>DA</given-names></name></person-group><article-title>CD40 activates NF-kappaB and c-Jun N-terminal kinase and enhances chemokine secretion on activated human hepatic stellate cells</article-title><source>J Immunol</source><year>2001</year><volume>166</volume><fpage>6812</fpage><lpage>6819</lpage><pub-id pub-id-type="pmid">11359840</pub-id></citation></ref>
<ref id="b39-ijms-09-00638"><label>39</label><citation citation-type="journal"><person-group person-group-type="author"><name><surname>Luedde</surname><given-names>T</given-names></name><name><surname>Beraza</surname><given-names>N</given-names></name><name><surname>Trautwein</surname><given-names>C</given-names></name></person-group><article-title>Evaluation of the role of nuclear factor-kappaB signaling in liver injury using genetic animal models</article-title><source>J Gastroenterol Hepatol</source><year>2006</year><issue>Suppl 3</issue><fpage>S43</fpage><lpage>S46</lpage></citation></ref>
<ref id="b40-ijms-09-00638"><label>40</label><citation citation-type="journal"><person-group person-group-type="author"><name><surname>Dang</surname><given-names>SS</given-names></name><name><surname>Wang</surname><given-names>BF</given-names></name><name><surname>Cheng</surname><given-names>YA</given-names></name><name><surname>Song</surname><given-names>P</given-names></name><name><surname>Liu</surname><given-names>ZG</given-names></name><name><surname>Li</surname><given-names>ZF</given-names></name></person-group><article-title>Inhibitory effects of saikosaponin-d on CCl4-induced hepatic fibrogenesis in rats</article-title><source>World J Gastroenterol</source><year>2007</year><volume>13</volume><fpage>557</fpage><lpage>563</lpage><pub-id pub-id-type="pmid">17278221</pub-id></citation></ref>
<ref id="b41-ijms-09-00638"><label>41</label><citation citation-type="journal"><person-group person-group-type="author"><name><surname>Reynaert</surname><given-names>H</given-names></name><name><surname>Thompson</surname><given-names>MG</given-names></name><name><surname>Thomas</surname><given-names>T</given-names></name><name><surname>Geerts</surname><given-names>A</given-names></name></person-group><article-title>Hepatic stellate cells: role in microcirculation and pathophysiology of portal hypertension</article-title><source>Gut</source><year>2002</year><volume>50</volume><fpage>571</fpage><lpage>581</lpage><pub-id pub-id-type="pmid">11889082</pub-id></citation></ref>
<ref id="b42-ijms-09-00638"><label>42</label><citation citation-type="journal"><person-group person-group-type="author"><name><surname>Shi</surname><given-names>GF</given-names></name><name><surname>Li</surname><given-names>Q</given-names></name></person-group><article-title>Effects of oxymatrine on experimental hepatic fibrosis and its mechanism in vivo</article-title><source>World J Gastroenterol</source><year>2005</year><volume>11</volume><fpage>268</fpage><lpage>271</lpage><pub-id pub-id-type="pmid">15633229</pub-id></citation></ref>
<ref id="b43-ijms-09-00638"><label>43</label><citation citation-type="journal"><person-group person-group-type="author"><name><surname>Singh</surname><given-names>KP</given-names></name><name><surname>Gerard</surname><given-names>HC</given-names></name><name><surname>Hudson</surname><given-names>AP</given-names></name><name><surname>Boros</surname><given-names>DL</given-names></name></person-group><article-title>Expression of matrix metalloproteinases and their inhibitors during the resorption of schistosome egg-induced fibrosis in praziquantel-treated mice</article-title><source>Immunology</source><year>2004</year><volume>111</volume><fpage>343</fpage><lpage>352</lpage><pub-id pub-id-type="pmid">15009436</pub-id></citation></ref>
<ref id="b44-ijms-09-00638"><label>44</label><citation citation-type="journal"><person-group person-group-type="author"><name><surname>Okamoto</surname><given-names>K</given-names></name><name><surname>Mimura</surname><given-names>K</given-names></name><name><surname>Murawaki</surname><given-names>Y</given-names></name><name><surname>Yuasa</surname><given-names>I</given-names></name></person-group><article-title>Association of functional gene polymorphisms of matrix metalloproteinase (MMP)-1, MMP-3 and MMP-9 with the progression of chronic liver disease</article-title><source>J Gastroenterol Hepatol</source><year>2005</year><volume>20</volume><fpage>1102</fpage><lpage>1108</lpage><pub-id pub-id-type="pmid">15955221</pub-id></citation></ref>
<ref id="b45-ijms-09-00638"><label>45</label><citation citation-type="journal"><person-group person-group-type="author"><name><surname>Solis-Herruzo</surname><given-names>JA</given-names></name><name><surname>de la Torre</surname><given-names>P</given-names></name><name><surname>Munoz-Yague</surname><given-names>MT</given-names></name></person-group><article-title>Hepatic stellate cells (HSC): architects of hepatic fibrosis</article-title><source>Rev Esp Enferm Dig</source><year>2003</year><volume>95</volume><fpage>438</fpage><lpage>439</lpage><fpage>436</fpage><lpage>437</lpage></citation></ref>
<ref id="b46-ijms-09-00638"><label>46</label><citation citation-type="journal"><person-group person-group-type="author"><name><surname>Urtasun</surname><given-names>R</given-names></name><name><surname>Nieto</surname><given-names>N</given-names></name></person-group><article-title>Hepatic stellate cells and oxidative stress</article-title><source>Rev Esp Enferm Dig</source><year>2007</year><volume>99</volume><fpage>223</fpage><lpage>230</lpage><pub-id pub-id-type="pmid">17590105</pub-id></citation></ref>
<ref id="b47-ijms-09-00638"><label>47</label><citation citation-type="journal"><person-group person-group-type="author"><name><surname>Wang</surname><given-names>JH</given-names></name><name><surname>Batey</surname><given-names>RG</given-names></name><name><surname>George</surname><given-names>J</given-names></name></person-group><article-title>Role of ethanol in the regulation of hepatic stellate cell function</article-title><source>World J Gastroenterol</source><year>2006</year><volume>12</volume><fpage>6926</fpage><lpage>6932</lpage><pub-id pub-id-type="pmid">17109512</pub-id></citation></ref>
<ref id="b48-ijms-09-00638"><label>48</label><citation citation-type="journal"><person-group person-group-type="author"><name><surname>Friedman</surname><given-names>SL</given-names></name></person-group><article-title>Liver fibrosis-from bench to bedside</article-title><source>J Hepatol</source><year>2003</year><volume>38</volume><fpage>S38</fpage><lpage>S53</lpage><pub-id pub-id-type="pmid">12591185</pub-id></citation></ref></ref-list>
<sec sec-type="display-objects">
<title>Figures and Table</title>
<fig id="f1-ijms-09-00638" position="float">
<label>Figure 1.</label>
<caption>
<p>Expression of GFP in pGCsi-R1 transfected HSC-T6 cells. GFP fluorescence in each group of the HSC-T6 cells was detected by fluorescence microscope and flow cytometry at 48 h after transfection. (A, B), bright light and fluorescence field views, respectively, of the same field in the untreated (blank) HSC-T6 cells; (C, D), bright light and fluorescence field views, respectively, of the same field in the pGCsi-R1 transfected HSC-T6 cells; (E), the percentage of the cells expressing GFP in the blank control group; (F), the percentage of the cells expressing GFP in the pGCsi-R1-transfected group. A-D, magnification of 100×.</p></caption>
<graphic xlink:href="ijms-09-00638f1.png"/></fig>
<fig id="f2-ijms-09-00638" position="float">
<label>Figure 2.</label>
<caption>
<p>Effect of RAGE specific siRNA on the expression of RAGE in HSC-T6 cells under different concentrations and at various time points. (A, B), the expression of RAGE mRNA as the ratio to β-actin mRNA by real-time quantitative PCR; (C), the expression of RAGE proteins was determined by Western blot analysis; (D), the 46 KDa and 50 KDa RAGE proteins as the ratios to β-actin protein by densitometric scanning. The changes were expressed as percentages of the respective blank. *, † and ‡ indicate statistically significant differences. *<italic>P</italic>&lt;0.05 vs. blank; †<italic>P</italic>&lt;0.01 vs. 0.5 nM pGCsi-R2; ‡<italic>P</italic>&lt;0.01 vs 1.0 nM pGCsi-R2</p></caption>
<graphic xlink:href="ijms-09-00638f2.png"/></fig>
<fig id="f3-ijms-09-00638" position="float">
<label>Figure 3.</label>
<caption>
<p>Histological changes and Sirius red staining of rat liver fibrosis in different stages. (A, E), NC1; (B, F), FM1-2W; (C, G), FM1-4W; (D, H), FM1-6W; A-D:HE staining (200×); E-H:Sirius red staining (100×).</p></caption>
<graphic xlink:href="ijms-09-00638f3.png"/></fig>
<fig id="f4-ijms-09-00638" position="float">
<label>Figure 4.</label>
<caption>
<p>Expression of RAGE mRNA and protein in rat liver tissues of CCl<sub>4</sub>-induced fibrosis in different stages. (A), the expression of RAGE mRNA was determined by Northern blot analysis; (B), RAGE mRNA as the ratios to β-actin mRNA by densitometric scanning. (C), the expression of RAGE proteins was determined by Western blot analysis; (D), the 46 KDa and 50 KDa RAGE proteins as the ratios to β-actin protein by densitometric scanning. The changes were expressed as percentages of the respective NC1. *, † and ‡ indicate statistically significant differences. *<italic>P</italic>&lt;0.01 vs. NC1; †<italic>P</italic>&lt;0.01 vs. FM1-2W; ‡<italic>P</italic>&lt;0.01 vs FM1-4W.</p></caption>
<graphic xlink:href="ijms-09-00638f4.png"/></fig>
<fig id="f5-ijms-09-00638" position="float">
<label>Figure 5.</label>
<caption>
<p>Expression of RAGE siRNA in the rat liver. Representative Northern blot analysis of RAGE siRNA expression in each group of the rat liver.</p></caption>
<graphic xlink:href="ijms-09-00638f5.png"/></fig>
<fig id="f6-ijms-09-00638" position="float">
<label>Figure 6.</label>
<caption>
<p>Effect of specific siRNA targeting RAGE on rat liver fibrosis by histological examination and Sirius red staining. (A, E), NC2; (B, F), FM2; (C, G), pGCsi-R1; (D, H), pGCsi-C. A-D: HE staining (200×); E-H: Sirius red staining (100×).</p></caption>
<graphic xlink:href="ijms-09-00638f6.png"/></fig>
<fig id="f7-ijms-09-00638" position="float">
<label>Figure 7.</label>
<caption>
<p>Effect of specific siRNA targeting RAGE on the mRNA expression of RAGE, NF-κB, α-SMA and Collagen type I in rats. (A), the mRNA expression of RAGE, α-SMA, NF-κB and Collagen type I was determined by Northern blot analysis. (B), the mRNAs of RAGE, NF-κB, α-SMA and Collagen type I were expressed as the ratios to β-actin mRNA by densitometric scanning, respectively. The changes were expressed as percentages of the respective NC2. * and † indicate statistically significant differences. *<italic>P</italic>&lt;0.01 vs. NC2; †<italic>P</italic>&lt;0.01 vs. FM2.</p></caption>
<graphic xlink:href="ijms-09-00638f7.png"/></fig>
<fig id="f8-ijms-09-00638" position="float">
<label>Figure 8.</label>
<caption>
<p>Effect of specific siRNA targeting RAGE on the expression of 46 kDa RAGE, 50 kDa RAGE, α-SMA, NF-κB, IκBα, and Collagen type I in rats. (A), the protein expression of 46 kDa RAGE, 50 kDa RAGE, α-SMA, NF-κB, IκBα and type I Collagen was determined by Western blot analysis. (B), the proteins of 46 KDa RAGE, 50 KDa RAGE, α-SMA, NF-κB, IκBα, and Collagen type I were expressed as the ratios to β-actin protein by densitometric scanning, respectively. The changes were expressed as percentages of the respective NC2. *, # and † indicate statistically significant differences. *<italic>P</italic>&lt;0.01 vs NC2; <sup>#</sup><italic>P</italic> &lt;0.05, †<italic>P</italic>&lt;0.01 vs. FM2.</p></caption>
<graphic xlink:href="ijms-09-00638f8.png"/></fig>
<fig id="f9-ijms-09-00638" position="float">
<label>Figure 9.</label>
<caption>
<p>Effect of specific siRNA targeting RAGE on the expression of RAGE and α-SMA in fibrotic rat liver examined by immunohistological staining. Representative microphotographs of SP staining in livers were presented. (A, E), NC2; (B, F), FM2; (C, G), pGCsi-R1; (D, H), pGCsi-C. A-H: immunohistochemistey staining (200×). The increases of RAGE and α-SMA expression were observed in FM2 or pGCsi-C-treated livers. In contrast, RAGE and α-SMA expression were significantly decreased in pGCsi-R1-treated livers compared with FM2 or pGCsi-C-treated livers.</p></caption>
<graphic xlink:href="ijms-09-00638f9.png"/></fig>
<fig id="f10-ijms-09-00638" position="float">
<label>Figure 10.</label>
<caption>
<p>EMSA for the NF-κB activity in the liver. Binding specificity was demonstrated by competition with excess unlabeled oligonucleotides containing the κB site and by the results of Supershift experiments. A: lane 1, 100 folded excess unlabeled NF-κB consensus sequence; lane 2, FM2; lane 3, pGCsi-C; lane 4, pGCsi-R1; lane 5, NC2; lane 6, normal saline treatment; B: Densitometric analysis of the results were expressed as percentages of the NC2. * and † indicate statistically significant differences. *<italic>P</italic>&lt;0.01 vs NC2; †<italic>P</italic>&lt;0.01 vs FM2.</p></caption>
<graphic xlink:href="ijms-09-00638f10.png"/></fig>
<fig id="f11-ijms-09-00638" position="float">
<label>Figure 11.</label>
<caption>
<p>Effect of specific siRNA targeting RAGE on the changes in ultrastructure of rat liver. (A), HSCs in Disse's space and fenestrae formed in endothelial cells in the NC2 group; (B), HSCs, liver sinusoids and a few lipid droplets in HSCs in pGCsi-R1 group; (C), activated HSCs and a large amount of collagen fiber deposition in pGCsi-C group and the FM2 group. A: Magnification of 16000×; B: Magnification of 12000×; C: Magnification of 20000×; D: Magnification of 20000×; F:fat droplet; HSC: Hepatic stellate cell; H, hepatocyte; CF, collagen fiber; MFs: myofibroblast; E: endothelial cell.</p></caption>
<graphic xlink:href="ijms-09-00638f11.png"/></fig>
<table-wrap id="t1-ijms-09-00638" position="float">
<label>Table 1.</label>
<caption>
<p>Effects of pGCsi-R1 on rat liver tissue inflammation and fibrosis.</p></caption>
<table frame="hsides" rules="groups">
<thead>
<tr>
<th align="left" rowspan="2" valign="middle">Group</th>
<th align="left" rowspan="2" valign="middle">n</th>
<th align="left" colspan="5">Inflammatory gradation
<hr/></th>
<th align="left" rowspan="2" valign="middle">Average rank</th>
<th align="left" colspan="5">Fibrosis staging</th>
<th align="left" rowspan="2" valign="middle">Average rank</th></tr>
<tr>
<th align="left">0</th>
<th align="left">I</th>
<th align="left">II</th>
<th align="left">III</th>
<th align="left">IV</th>
<th align="left">0</th>
<th align="left">I</th>
<th align="left">II</th>
<th align="left">III</th>
<th align="left">IV</th></tr></thead>
<tbody>
<tr>
<td align="left">NC2</td>
<td align="left">6</td>
<td align="left">0</td>
<td align="left">4.50</td>
<td align="left">6</td>
<td align="left">0</td>
<td align="left">4.50</td></tr>
<tr>
<td align="left">FM2</td>
<td align="left">9</td>
<td align="left">0</td>
<td align="left">2</td>
<td align="left">3</td>
<td align="left">4</td>
<td align="left">24.67<xref ref-type="table-fn" rid="tfn2-ijms-09-00638">*</xref></td>
<td align="left">0</td>
<td align="left">2</td>
<td align="left">3</td>
<td align="left">4</td>
<td align="left">24.78<xref ref-type="table-fn" rid="tfn2-ijms-09-00638">*</xref></td></tr>
<tr>
<td align="left">pGCsi-R1</td>
<td align="left">9</td>
<td align="left">2</td>
<td align="left">5</td>
<td align="left">2</td>
<td align="left">0</td>
<td align="left">10.78<xref ref-type="table-fn" rid="tfn2-ijms-09-00638">*</xref><xref ref-type="table-fn" rid="tfn2-ijms-09-00638">†</xref></td>
<td align="left">2</td>
<td align="left">6</td>
<td align="left">1</td>
<td align="left">0</td>
<td align="left">10.56<xref ref-type="table-fn" rid="tfn2-ijms-09-00638">*†</xref></td></tr>
<tr>
<td align="left">pGCsi-C</td>
<td align="left">9</td>
<td align="left">0</td>
<td align="left">2</td>
<td align="left">4</td>
<td align="left">3</td>
<td align="left">23.89<xref ref-type="table-fn" rid="tfn2-ijms-09-00638">*</xref></td>
<td align="left">0</td>
<td align="left">2</td>
<td align="left">4</td>
<td align="left">3</td>
<td align="left">24.00<xref ref-type="table-fn" rid="tfn2-ijms-09-00638">*</xref></td></tr></tbody></table>
<table-wrap-foot><fn id="tfn1-ijms-09-00638">
<p>Rank test of inflammatory gradation in four groups, indicating statistically significant differences, <italic>X</italic><italic><sup>2</sup></italic>=25.0291, <italic>P</italic>&lt;0.01.<xref ref-type="table-fn" rid="tfn2-ijms-09-00638">*</xref> <italic>P</italic>&lt;0.01 vs NC2;</p></fn><fn id="tfn2-ijms-09-00638">
<p>Rank test of fibrosis staging in four groups, indicating statistically significant differences, <italic>X</italic><italic><sup>2</sup></italic>=25.6393, <italic>P</italic>&lt;0.01, *<italic>P</italic>&lt;0.01 vs NC2; †<italic>P</italic>&lt;0.01 vs FM2.</p></fn></table-wrap-foot></table-wrap>
<table-wrap id="t2-ijms-09-00638" position="float">
<label>Table 2.</label>
<caption>
<p>Effect of siRNA targeting RAGE on ALT, ALB and TBIL in rats.</p></caption>
<table frame="hsides" rules="groups">
<thead>
<tr>
<th align="center">Group</th>
<th align="center">n</th>
<th align="center">ALT (u/L)</th>
<th align="center">ALB (g/L)</th>
<th align="center">TBIL (μmol/L)</th></tr></thead>
<tbody>
<tr>
<td align="center">NC2</td>
<td align="center">6</td>
<td align="center">37.83±3.49</td>
<td align="center">18.08±0.58</td>
<td align="center">5.83±0.39</td></tr>
<tr>
<td align="center">FM2</td>
<td align="center">6</td>
<td align="center">363.17±56.95<xref ref-type="table-fn" rid="tfn4-ijms-09-00638">*</xref></td>
<td align="center">11.52±0.68<xref ref-type="table-fn" rid="tfn4-ijms-09-00638">*</xref></td>
<td align="center">25.25±1.54<xref ref-type="table-fn" rid="tfn4-ijms-09-00638">*</xref></td></tr>
<tr>
<td align="center">pGCsi-R1</td>
<td align="center">9</td>
<td align="center">46.00±1.79<xref ref-type="table-fn" rid="tfn4-ijms-09-00638">*</xref><xref ref-type="table-fn" rid="tfn5-ijms-09-00638">†</xref></td>
<td align="center">17.33±0.75<xref ref-type="table-fn" rid="tfn5-ijms-09-00638">†</xref></td>
<td align="center">10.00±1.70<xref ref-type="table-fn" rid="tfn4-ijms-09-00638">*</xref><xref ref-type="table-fn" rid="tfn5-ijms-09-00638">†</xref></td></tr>
<tr>
<td align="center">pGCsi-C</td>
<td align="center">9</td>
<td align="center">373.50±59.73<xref ref-type="table-fn" rid="tfn4-ijms-09-00638">*</xref></td>
<td align="center">11.90±0.85<xref ref-type="table-fn" rid="tfn4-ijms-09-00638">*</xref></td>
<td align="center">25.50±3.27<xref ref-type="table-fn" rid="tfn4-ijms-09-00638">*</xref></td></tr></tbody></table>
<table-wrap-foot><fn id="tfn3-ijms-09-00638">
<p><xref ref-type="table-fn" rid="tfn4-ijms-09-00638">*</xref> and <xref ref-type="table-fn" rid="tfn5-ijms-09-00638">†</xref> indicate statistically significant differences.</p></fn><fn id="tfn4-ijms-09-00638">
<label>*</label>
<p><italic>P</italic>&lt;0.01 vs. NC2;</p></fn><fn id="tfn5-ijms-09-00638">
<label>†</label>
<p><italic>p</italic>&lt;0.01 vs FM2. ALT: alanine aminotransferase; ALB: albumin; TBIL: total bilirubin.</p></fn></table-wrap-foot></table-wrap>
<table-wrap id="t3-ijms-09-00638" position="float">
<label>Table 3.</label>
<caption>
<p>Effect of siRNA targeting RAGE on fibrosis markers in rats</p></caption>
<table frame="hsides" rules="groups">
<thead>
<tr>
<th align="center">Group</th>
<th align="center">n</th>
<th align="center">PCIII (μg/L)</th>
<th align="center">HA(μg/L)</th>
<th align="center">LN(μg/L)</th></tr></thead>
<tbody>
<tr>
<td align="center">NC2</td>
<td align="center">6</td>
<td align="center">127.33±15.98</td>
<td align="center">102.16±7.99</td>
<td align="center">99.90±14.00</td></tr>
<tr>
<td align="center">FM2</td>
<td align="center">6</td>
<td align="center">342.14±19.04<xref ref-type="table-fn" rid="tfn7-ijms-09-00638">*</xref></td>
<td align="center">424.63±31.82<xref ref-type="table-fn" rid="tfn7-ijms-09-00638">*</xref></td>
<td align="center">221.83±20.06<xref ref-type="table-fn" rid="tfn7-ijms-09-00638">*</xref></td></tr>
<tr>
<td align="center">pGCsi-R1</td>
<td align="center">9</td>
<td align="center">180.72±19.19<xref ref-type="table-fn" rid="tfn7-ijms-09-00638">*</xref>†</td>
<td align="center">180.89±40.01<xref ref-type="table-fn" rid="tfn7-ijms-09-00638">*</xref><xref ref-type="table-fn" rid="tfn8-ijms-09-00638">†</xref></td>
<td align="center">150.41±13.25<xref ref-type="table-fn" rid="tfn7-ijms-09-00638">*</xref><xref ref-type="table-fn" rid="tfn8-ijms-09-00638">†</xref></td></tr>
<tr>
<td align="center">pGCsi-C</td>
<td align="center">9</td>
<td align="center">338.06±16.50<xref ref-type="table-fn" rid="tfn7-ijms-09-00638">*</xref></td>
<td align="center">416.30±34.13<xref ref-type="table-fn" rid="tfn7-ijms-09-00638">*</xref></td>
<td align="center">220.36±26.16<xref ref-type="table-fn" rid="tfn7-ijms-09-00638">*</xref></td></tr></tbody></table>
<table-wrap-foot><fn id="tfn6-ijms-09-00638">
<p><xref ref-type="table-fn" rid="tfn7-ijms-09-00638">*</xref> and <xref ref-type="table-fn" rid="tfn8-ijms-09-00638">†</xref> indicate statistically significant differences.</p></fn><fn id="tfn7-ijms-09-00638">
<label>*</label>
<p>P&lt;0.01 vs NC2;</p></fn><fn id="tfn8-ijms-09-00638">
<label>†</label>
<p>p&lt;0.01 vs FM2. PCIII: precollagen type III; HA: hyaluronic acid; LN:laminin.</p></fn></table-wrap-foot></table-wrap>
<table-wrap id="t4-ijms-09-00638" position="float">
<label>Table 4.</label>
<caption>
<p>Immunohistological image analysis of RAGE in each group (x±s)</p></caption>
<table frame="hsides" rules="groups">
<thead>
<tr>
<th align="center">Group</th>
<th align="center">n</th>
<th align="center">PA(μm<sup>2</sup>)</th>
<th align="center">IOD</th>
<th align="center">AOD</th></tr></thead>
<tbody>
<tr>
<td align="center">NC2</td>
<td align="center">6</td>
<td align="center">37074±2778</td>
<td align="center">8434±857</td>
<td align="center">0.228±0.019</td></tr>
<tr>
<td align="center">FM2</td>
<td align="center">6</td>
<td align="center">73722±4674<xref ref-type="table-fn" rid="tfn10-ijms-09-00638">*</xref></td>
<td align="center">148164±3998<xref ref-type="table-fn" rid="tfn10-ijms-09-00638">*</xref></td>
<td align="center">0.653±0.038<xref ref-type="table-fn" rid="tfn10-ijms-09-00638">*</xref></td></tr>
<tr>
<td align="center">pGCsi-R1</td>
<td align="center">9</td>
<td align="center">40724±2877<xref ref-type="table-fn" rid="tfn11-ijms-09-00638">†</xref></td>
<td align="center">12486±1431<xref ref-type="table-fn" rid="tfn10-ijms-09-00638">#</xref><xref ref-type="table-fn" rid="tfn11-ijms-09-00638">†</xref></td>
<td align="center">0.307±0.033<xref ref-type="table-fn" rid="tfn10-ijms-09-00638">*</xref><xref ref-type="table-fn" rid="tfn11-ijms-09-00638">†</xref></td></tr>
<tr>
<td align="center">pGCsi-C</td>
<td align="center">9</td>
<td align="center">73809±5450<xref ref-type="table-fn" rid="tfn10-ijms-09-00638">*</xref></td>
<td align="center">48704±3483<xref ref-type="table-fn" rid="tfn10-ijms-09-00638">*</xref></td>
<td align="center">0.648±0.073<xref ref-type="table-fn" rid="tfn10-ijms-09-00638">*</xref></td></tr></tbody></table>
<table-wrap-foot><fn id="tfn9-ijms-09-00638">
<p><xref ref-type="table-fn" rid="tfn10-ijms-09-00638">*</xref> and <xref ref-type="table-fn" rid="tfn11-ijms-09-00638">†</xref> indicate statistically significant differences.</p></fn><fn id="tfn10-ijms-09-00638">
<label>#</label>
<p>P&lt;0.05, *P&lt;0.01 vs. NC2;</p></fn><fn id="tfn11-ijms-09-00638">
<label>†</label>
<p>p&lt;0.01 vs FM2. PA : positive area; IOD: integrated optical density; AOD: average optical density.</p></fn></table-wrap-foot></table-wrap>
<table-wrap id="t5-ijms-09-00638" position="float">
<label>Table 5.</label>
<caption>
<p>Immunohistological image analysis of α-SMA in each group(χ̄±s)</p></caption>
<table frame="hsides" rules="groups">
<thead>
<tr>
<th align="center">Group</th>
<th align="center">n</th>
<th align="center">PA(μm<sup>2</sup>)</th>
<th align="center">IOD</th>
<th align="center">AOD</th></tr></thead>
<tbody>
<tr>
<td align="center">NC2</td>
<td align="center">6</td>
<td align="center">238186±32481</td>
<td align="center">35310±4562</td>
<td align="center">0.146±0.016</td></tr>
<tr>
<td align="center">FM2</td>
<td align="center">6</td>
<td align="center">479694±27048<xref ref-type="table-fn" rid="tfn13-ijms-09-00638">*</xref></td>
<td align="center">210923±19716<xref ref-type="table-fn" rid="tfn13-ijms-09-00638">*</xref></td>
<td align="center">0.44±0.036<xref ref-type="table-fn" rid="tfn13-ijms-09-00638">*</xref></td></tr>
<tr>
<td align="center">pGCsi-R1</td>
<td align="center">9</td>
<td align="center">294912±11894<xref ref-type="table-fn" rid="tfn13-ijms-09-00638">*</xref><xref ref-type="table-fn" rid="tfn14-ijms-09-00638">†</xref></td>
<td align="center">62194±5712<xref ref-type="table-fn" rid="tfn13-ijms-09-00638">*</xref><xref ref-type="table-fn" rid="tfn14-ijms-09-00638">†</xref></td>
<td align="center">0.211±0.019<xref ref-type="table-fn" rid="tfn3-ijms-09-00638">*</xref><xref ref-type="table-fn" rid="tfn14-ijms-09-00638">†</xref></td></tr>
<tr>
<td align="center">pGCsi-C</td>
<td align="center">9</td>
<td align="center">477842±42368<xref ref-type="table-fn" rid="tfn13-ijms-09-00638">*</xref></td>
<td align="center">209584±28856<xref ref-type="table-fn" rid="tfn13-ijms-09-00638">*</xref></td>
<td align="center">0.438±0.043<xref ref-type="table-fn" rid="tfn13-ijms-09-00638">*</xref></td></tr></tbody></table>
<table-wrap-foot><fn id="tfn12-ijms-09-00638">
<p><xref ref-type="table-fn" rid="tfn13-ijms-09-00638">*</xref> and <xref ref-type="table-fn" rid="tfn14-ijms-09-00638">†</xref> indicate statistically significant differences.</p></fn><fn id="tfn13-ijms-09-00638">
<label>*</label>
<p><italic>P</italic>&lt;0.01 vs. NC2;</p></fn><fn id="tfn14-ijms-09-00638">
<label>†</label>
<p><italic>p</italic>&lt;0.01 vs FM2.</p></fn></table-wrap-foot></table-wrap></sec></back></article>
