An In Silico Method for Screening Nicotine Derivatives as Cytochrome P450 2A6 Selective Inhibitors Based on Kernel Partial Least Squares

Abstract
:1. Introduction
2. Material and methods
2.1. Kernel partial least squares
- from k = 1 to M
- Kij = K (Xi, Xj)
- um = KmKm′ym
- um = um/||um||
- Km+1 = Km − umum′Km
- ym+1 = ym − umum′Ym
- ym+1 = ym+1/||ym+1||
- The final regression coefficients r are calculated by the following formulawhere the mth columns of Y and U are ym and um respectively.
- The final predictions are
2.2. Data set
3. Results and discussion
3.1. Molecular descriptors
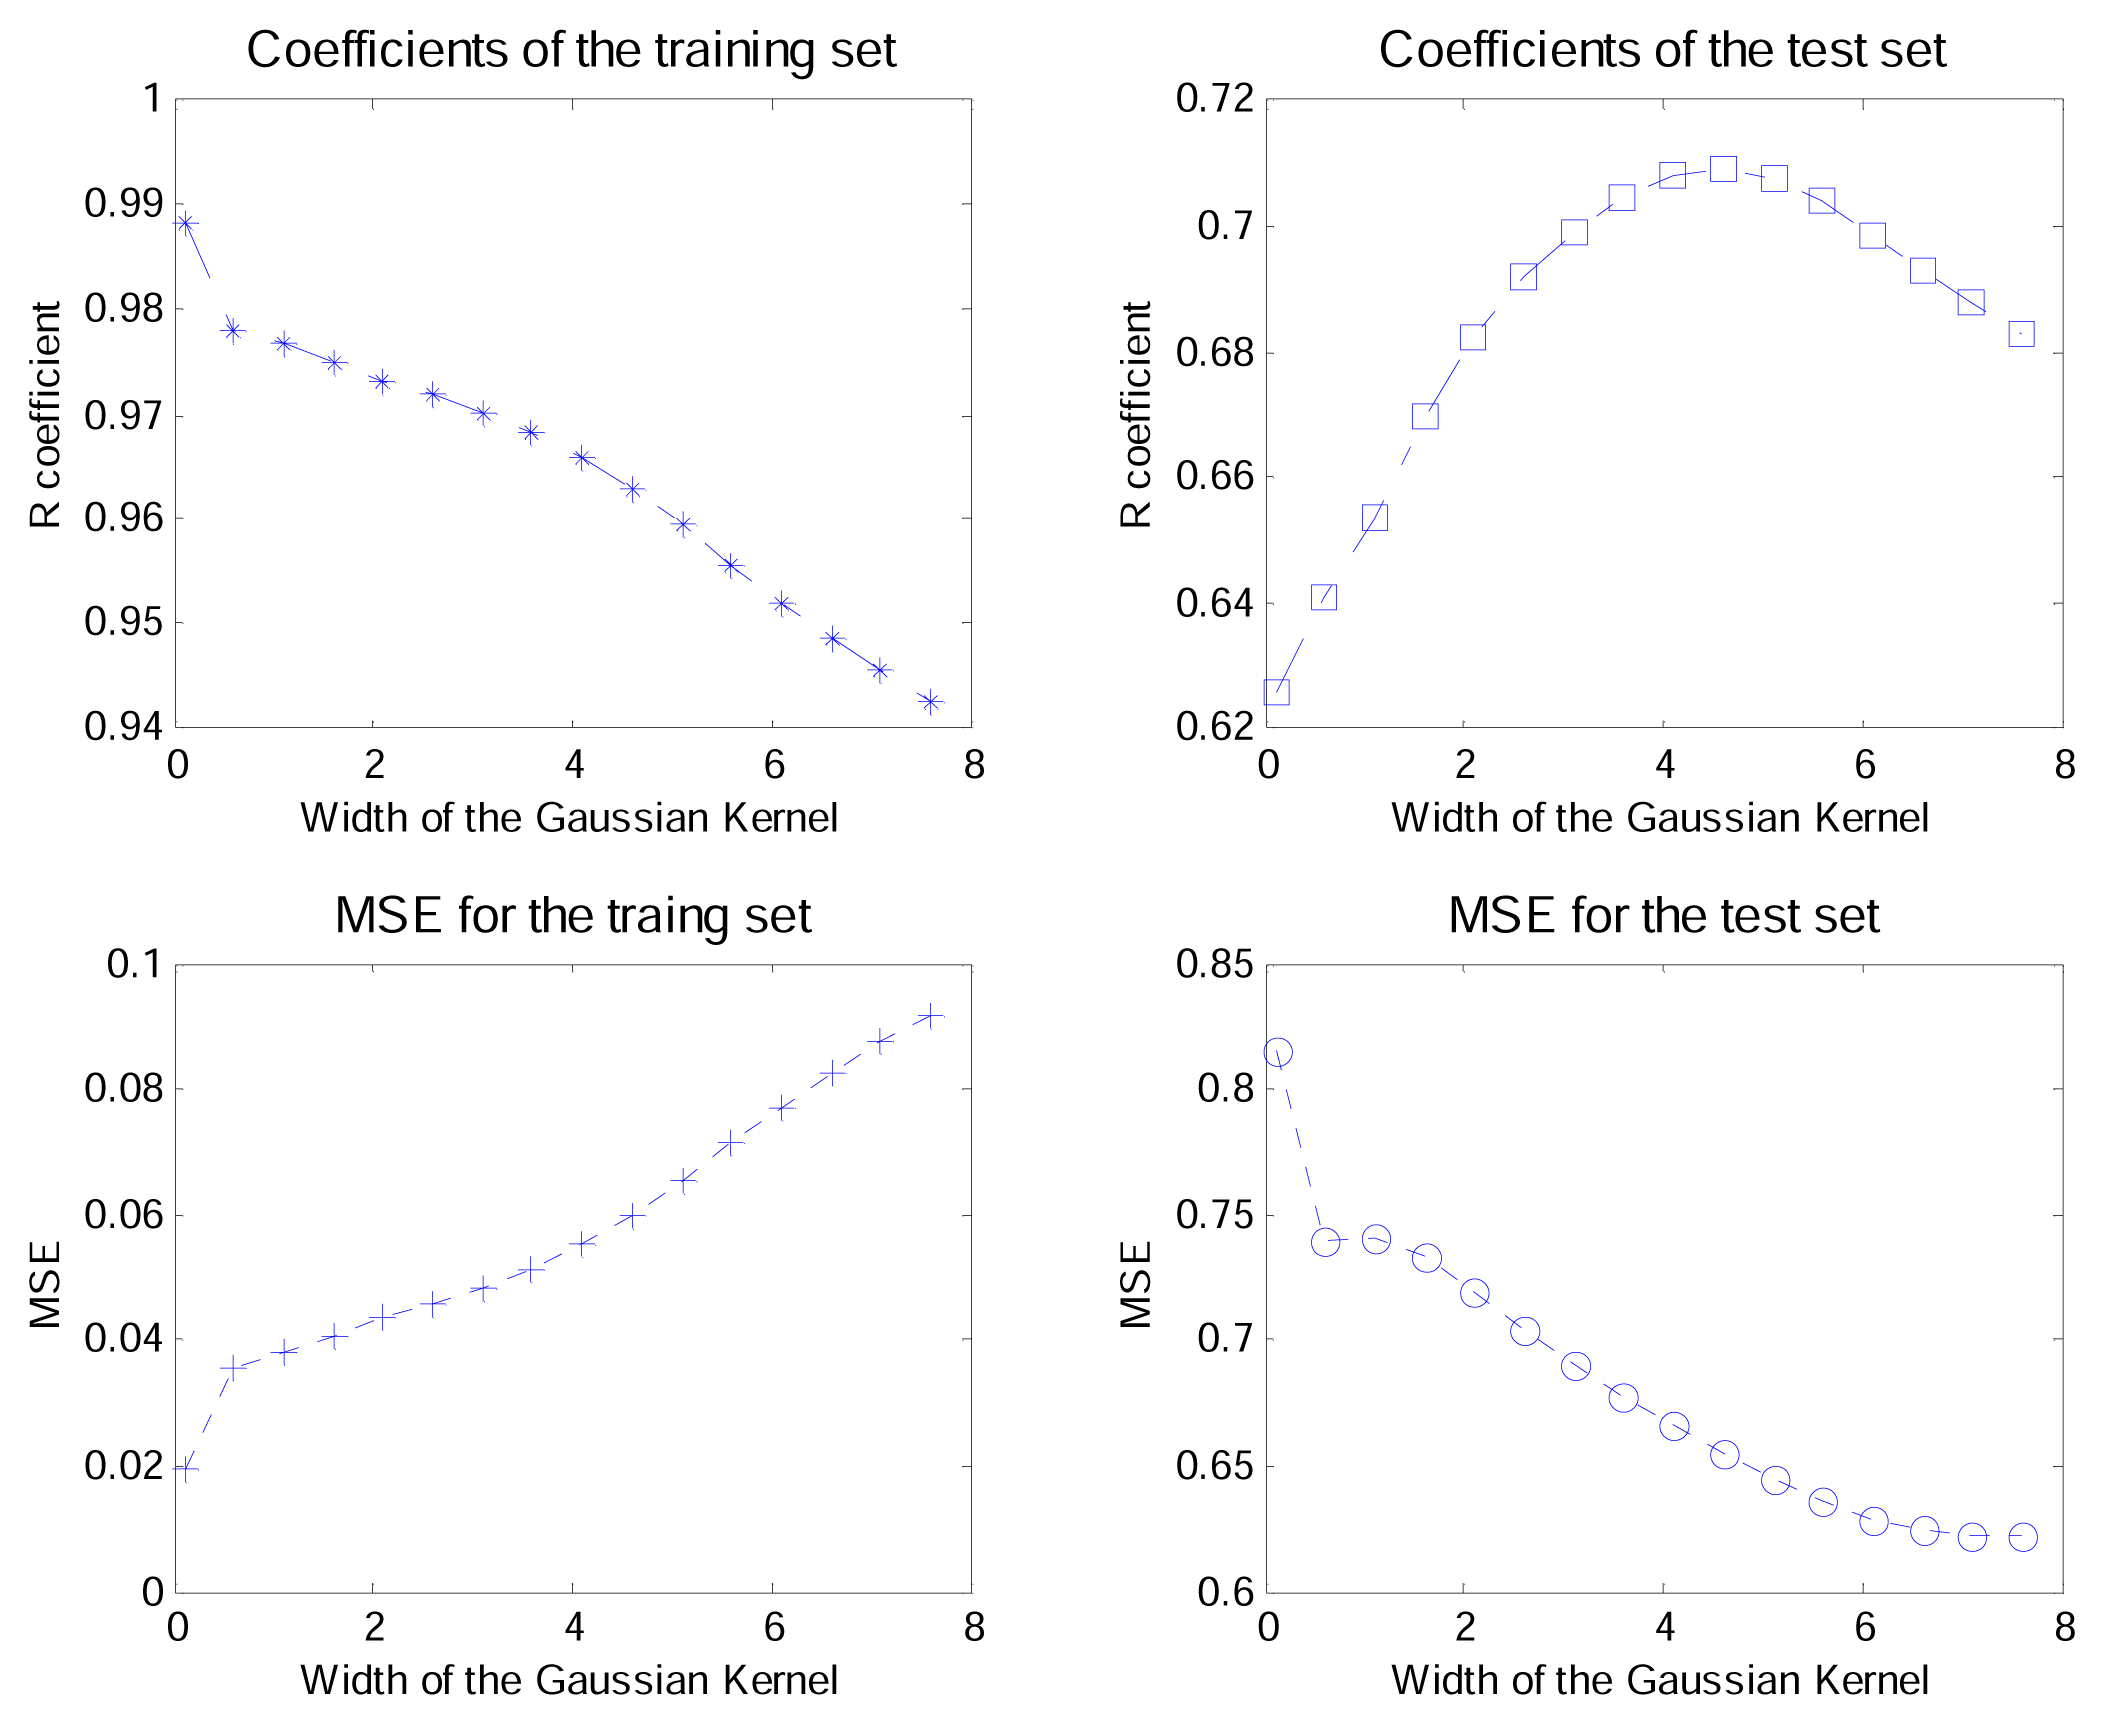
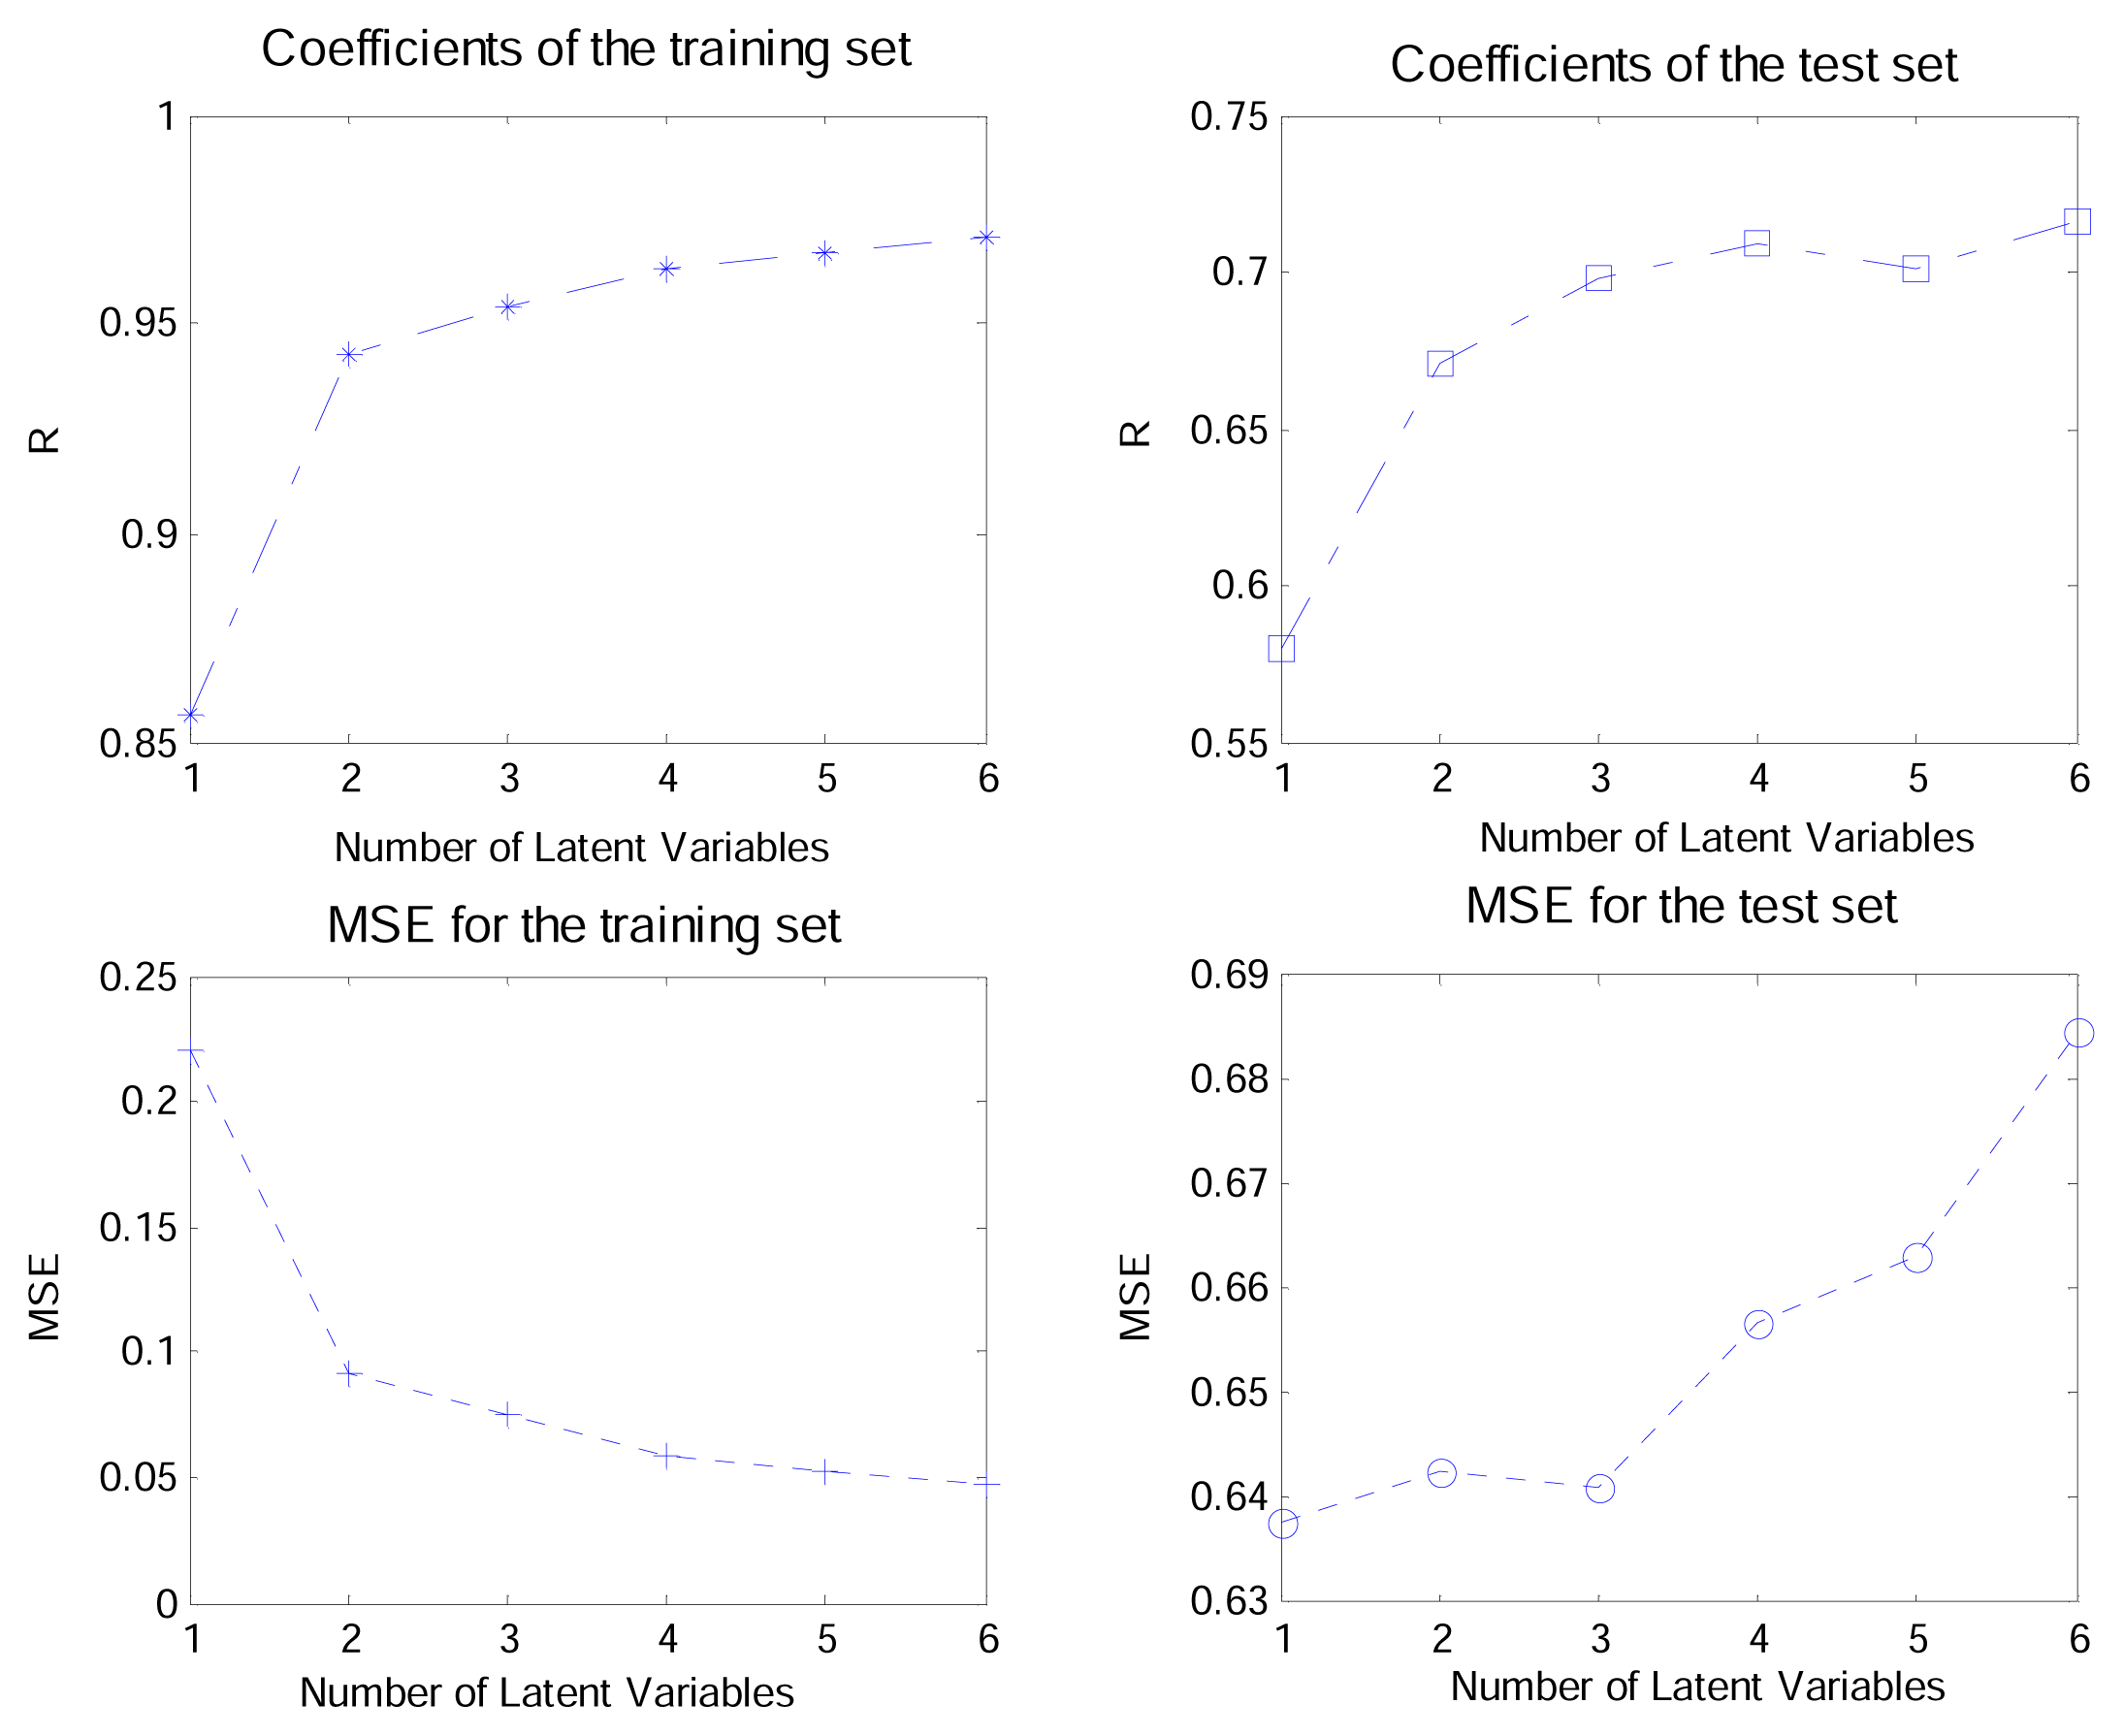
3.2. K-PLS parameters
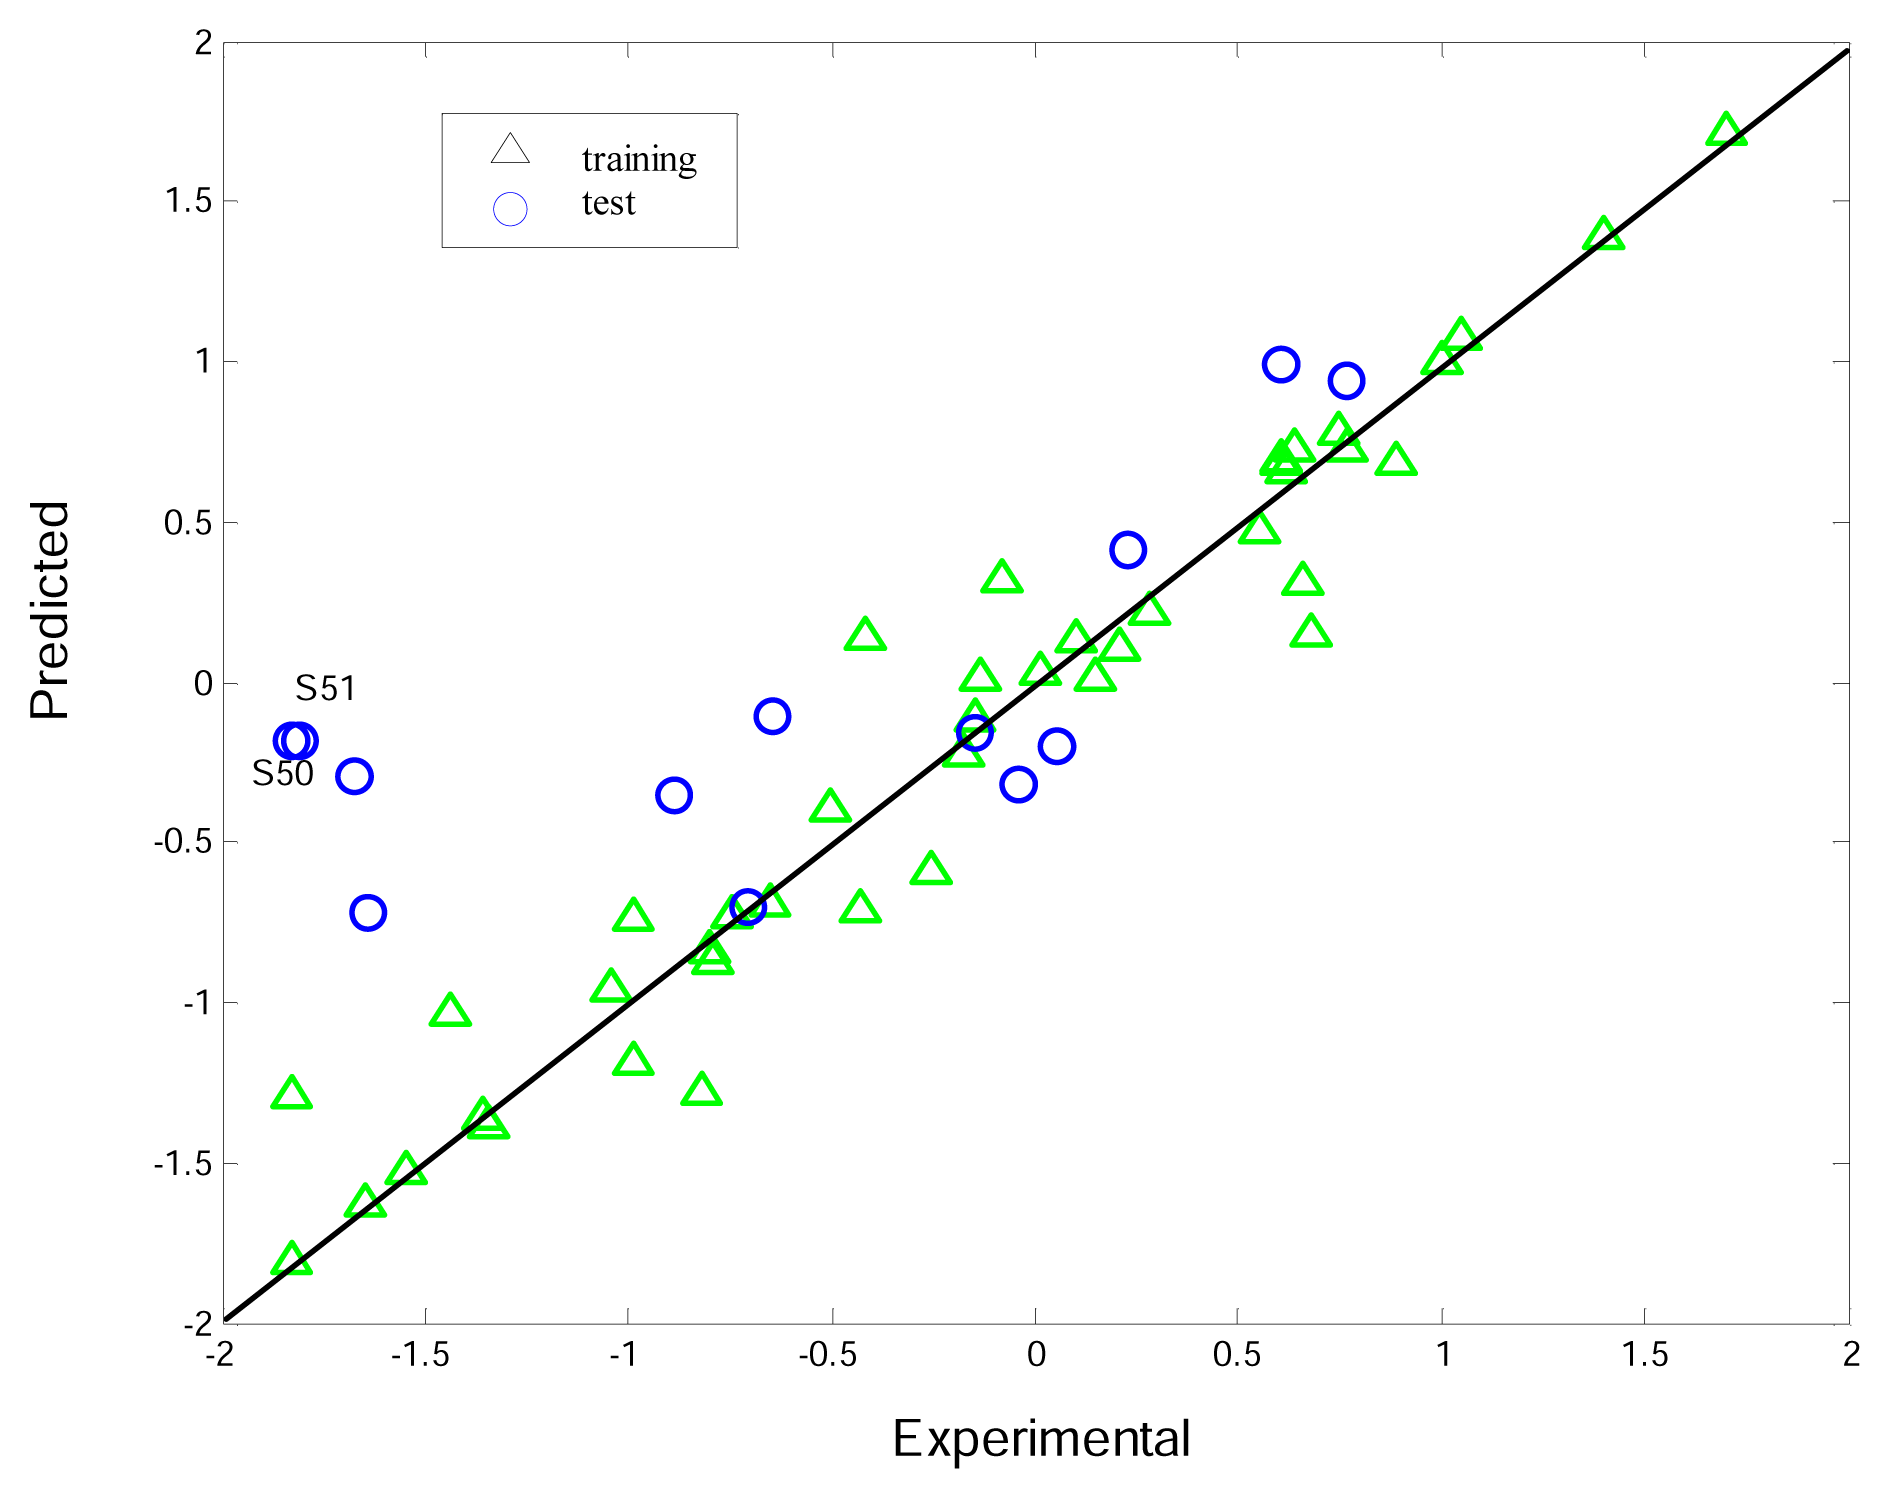
3.3. Interpretation of the K-PLS model
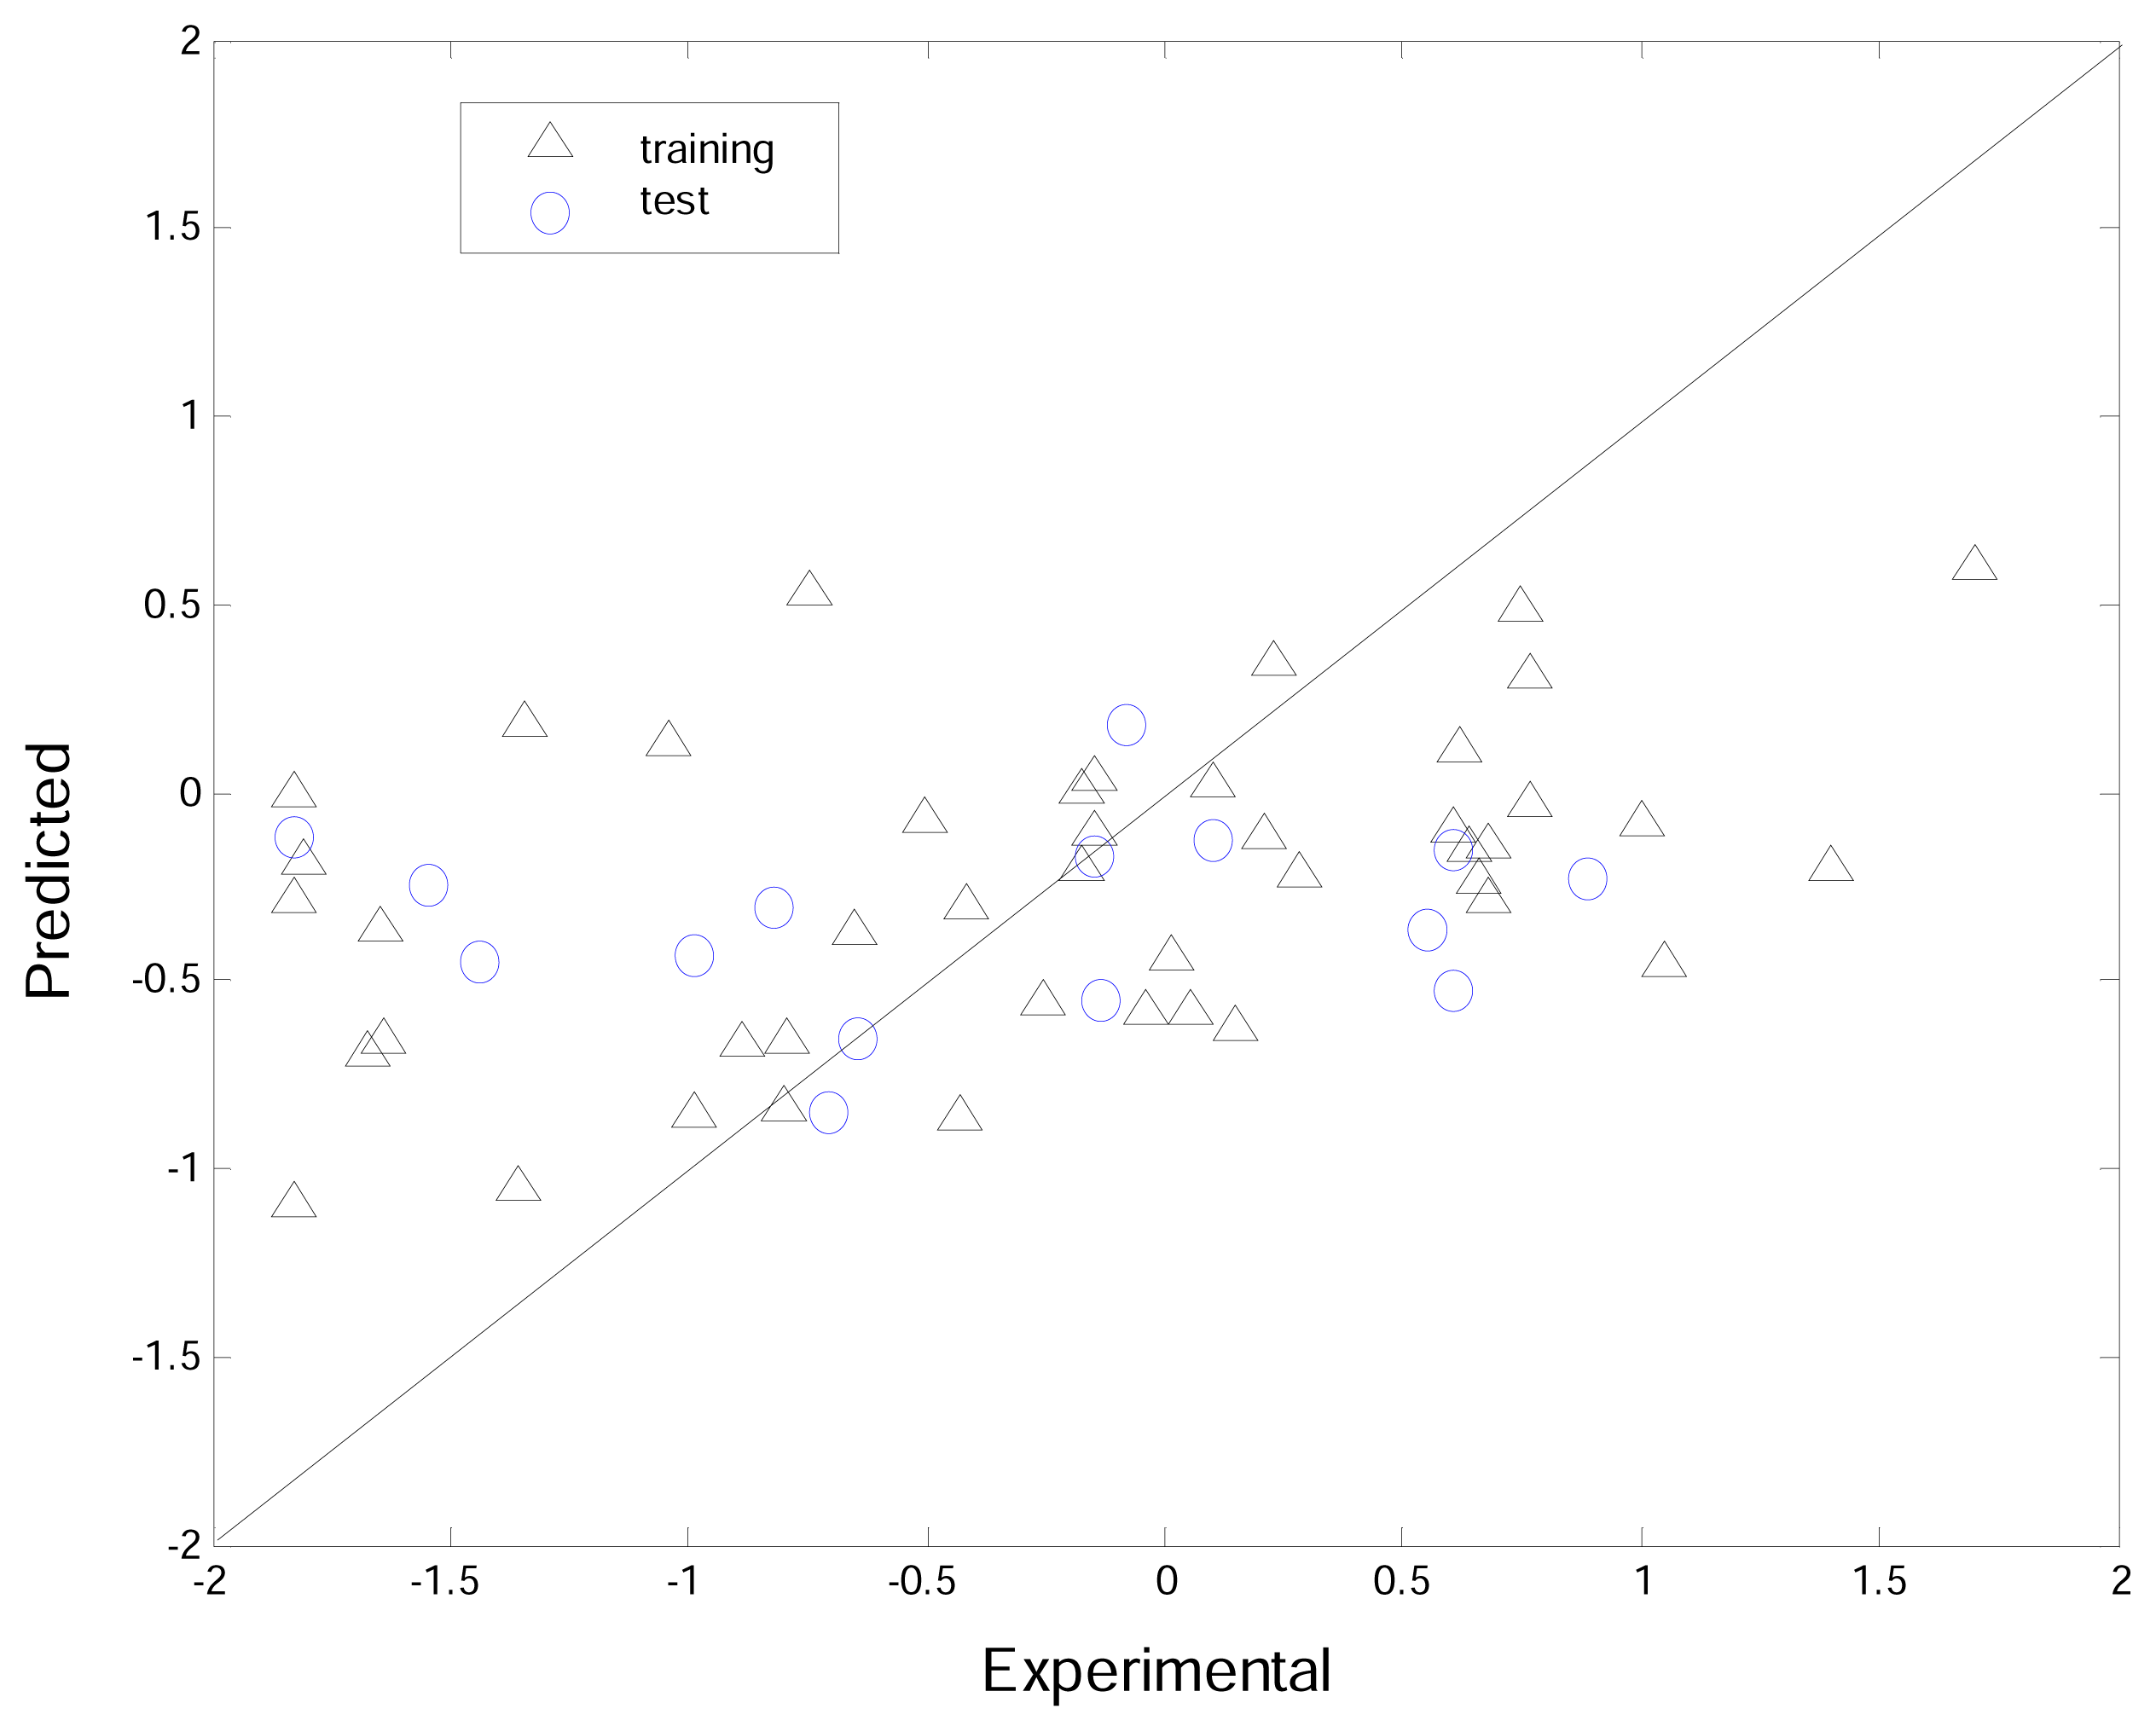
3.4. Comparisons between K-PLS and PLS
4. Conclusion
Acknowledgements
References
- Bennett, K.P.; Embrechts, M. J. Advances in Learning Theory: Methods, Models and Applications, NATO Science Series III: Computer & Systems Sciences; Suykens, J. A. K., Horvath, G., Basu, S., Micchelli, C., Vandewalle, J., Eds.; IOS Press: Amsterdam, 2003; Volume 190, p. 227. [Google Scholar]
- Cashman, J.R.; Park, S.B.; Yang, Z.-C.; Wrighton, S.A.; Jacob, P., III; Benowitz, N.L. Metabolism of nicotine by human liver microsomes: Stereoselective formation of trans-nicotine N′-oxide. Chem. Res. Toxicol 1992, 5, 639–646. [Google Scholar]
- de Jong, S. SIMPLS: an alternative approach to partial least squares regression. Chemometr. Intell. Lab 1993, 18, 251–263. [Google Scholar]
- Denton, T. T.; Zhang, X.; Cashman, J. R. 5-Substituted, 6-substituted, and unsubstituted 3- heteroaromatic pyridine analogues of nicotine as selective inhibitors of cytochrome P-450 2A6. J. Med. Chem 2005, 48, 224–239. [Google Scholar]
- Draper, A. J.; Madan, A.; Parkinson, A. Inhibition of coumarin 7-hydroxylase activity in human liver microsomes. Arch. Biochem. Biophys 1997, 341, 47–61. [Google Scholar]
- Fujita, K.; Kamataki, T. Screening of organosulfur compounds as inhibitors of human CYP2A6. Drug Metab. Dispos 2001, 29, 983–989. [Google Scholar]
- Guengerich, F. P.; Shimada, T.; Yun, C.; Yamazaki, H.; Raney, K. D.; Thier, R.; Coles, B.; Harris, T. M. Interactions of ingested food, beverage, and tobacco components involving human cytochrome P4501A2, 2A6, 2E1, and 3A4 enzymes. Environ. Health Perspect 1994, 102, 49–53. [Google Scholar]
- Hukkanen, J.; Jacob, P., III; Benowitz, N.L. Metabolism and Disposition Kinetics of Nicotine. Pharmacol. Rev 2005, 57, 79–115. [Google Scholar]
- John, S. T.; Nello, C. Kernel methods for pattern analysis; Cambridge Univ Pr, 2004; pp. 137–189. [Google Scholar]
- Kier, L. B.; Hall, L. H. An electrotopological-state index for atoms in molecules. Pharm. Res 1990, 7, 801–807. [Google Scholar]
- Nakajima, M.; Yamamoto, T.; Nunoya, K.; Yokoi, T.; Nagashimi, K.; Inque, K.; Funae, Y.; Shimada, N.; Kamataki, T.; Kuroiwa, Y. Role of human cytochrome P4502A6 in C-oxidation of nicotine. Drug Metab. Dispos 1996, 24, 1212–1217. [Google Scholar]
- Maenpaa, J.; Sigusch, H.; Raunio, H.; Syngelma, T.; Vuorela, P.; Vuorela, H.; Pelkonen, O. Differential inhibition of coumarin 7-hydroxylase activity in mouse and human liver microsomes. Biochem. Pharmacol 1993, 45, 1035–1042. [Google Scholar]
- Nakajima, M.; Yamamoto, T.; Nunoya, K.; Yokoi, T.; Nagashimi, K.; Inque, K.; Funae, Y.; Shimada, N.; Kamataki, T.; Kuroiwa, Y. Characterization of CYP2A6 involved in 39- hydroxylation of cotinine in human liver microsomes. J. Pharmacol. Exp. Ther 1996, 277, 1010– 1015. [Google Scholar]
- Pearce, R.; Greenway, D.; Parkinson, A. Species differences and interindividual variation in liver microsomal cytochrome P450 2A enzymes: effects on coumarin, dicoumarol, and testosterone oxidation. Arch. Biochem. Biophys 1992, 298, 211–225. [Google Scholar]
- Reigh, G.; McMahon, H.; Ishizaki, M.; Ohara, T.; Shimane, K.; Esumi, Y.; Green, C.; Tyson, C.; Ninomiya, S. Cytochrome P450 species involved in the metabolism of quinoline. Carcinogenesis 1996, 17, 1989–1996. [Google Scholar]
- Shimada, T.; Yamazaki, H.; Guengerich, F. P. Ethnic-related differences in coumarin 7- hydroxylation activities catalyzed by cytochrome P4502A6 in liver microsomes of Japanese and Caucasian populations. Xenobiotica 1996, 26, 395–403. [Google Scholar]
- Sun, H. M. Predicting ADMET properties by projecting onto chemical space-benefits and pitfalls. Curr. Comput. Aided Drug D 2006, 2, 179–193. [Google Scholar]
- Tricker, A. R. Nicotine metabolism, human drug metabolism polymorphisms, and smoking behaviour. Toxicology 2003, 183, 151–173. [Google Scholar]
- Yano, J. K.; Denton, T. T.; Cerny, M. A.; Zhang, X.; Johnson, E. F.; Cashman, J. R. Synthetic Inhibitors of Cytochrome P-450 2A6: Inhibitory Activity, Difference Spectra, Mechanism of Inhibition, and Protein Cocrystallization. J. Med. Chem 2006, 49, 6987–7002. [Google Scholar]
- Wang, Y. H.; Han, K. L.; Yang, S. L.; Yang, L. Structural determinants of steroids for cytochrome P4503A4-mediated metabolism. J. Mol. Struct. (THEOCHEM) 2004, 710, 215–221. [Google Scholar]
- Wang, Y. H.; Li, Y.; Li, Y.H.; Yang, S. L.; Yang, L. Modeling Km values using electrotopological state: substrates for cytochrome P450 3A4-mediated metabolism. Bioorg. Med. Chem. Lett 2005a, 15, 4076–4084. [Google Scholar]
- Wang, Y. H.; Li, Y.; Yang, S.L.; Yang, L. Classification of substrates and inhibitors of Pglycoprotein using unsupervised machine learning approach. J. Chem. Inf. Model 2005b, 45, 750–757. [Google Scholar]
- Wold, H. Perspectives in Probability and Statistics; Gani, J., Ed.; Academic Press: London, 1975; p. 520. [Google Scholar]
- Wold, S.; Ruhe, H.; Wold, H.; Dunn, W. J. The collinearity problem in linear regression. The PLS approach to generalized inverse. SIAM J. Sci. Statist. Comput 1984, 5, 735–743. [Google Scholar]


| name | pKi | sumdelI | sumI | Qv | nHBd | nHBa | nwHBa | SHBd | SHBa | SwHBa | Hmax | Gmax | Hmin | nrings |
|---|---|---|---|---|---|---|---|---|---|---|---|---|---|---|
| S1 | 0.68 | 6.783 | 31.5 | 0.969 | 0 | 3 | 9 | 0 | 17.783 | 11.68 | 1.447 | 12.521 | 0.62 | 2 |
| S2 | −1.83 | 3.894 | 29 | 1.319 | 0 | 3 | 9 | 0 | 10.923 | 14.346 | 1.424 | 5.009 | 0.614 | 2 |
| S3 | −0.18 | 2.921 | 26.25 | 1.396 | 0 | 2 | 9 | 0 | 5.892 | 14.826 | 1.364 | 4.141 | 0.605 | 2 |
| S4 | 0.10 | 5.504 | 30.833 | 0.933 | 0 | 3 | 10 | 0 | 15.938 | 14.895 | 1.431 | 10.446 | 1.237 | 2 |
| S5* | −0.15 | 6.29 | 32.5 | 1.05 | 0 | 3 | 10 | 0 | 16.626 | 14.292 | 1.379 | 11.085 | 0.686 | 2 |
| S6 | 0.66 | 1.829 | 22.167 | 1.168 | 0 | 2 | 9 | 0 | 5.752 | 16.415 | 1.328 | 4.045 | 1.186 | 2 |
| S7 | 0.01 | 6.481 | 29.833 | 0.849 | 0 | 3 | 9 | 0 | 17.61 | 12.223 | 1.434 | 12.42 | 1.212 | 2 |
| S8 | −0.99 | 3.656 | 27.333 | 1.188 | 0 | 3 | 9 | 0 | 10.799 | 14.917 | 1.411 | 4.978 | 0.723 | 2 |
| S9 | −0.65 | 2.701 | 24.583 | 1.251 | 0 | 2 | 9 | 0 | 5.795 | 15.4 | 1.351 | 4.098 | 1.198 | 2 |
| S10* | 0.60 | 2.086 | 23.833 | 1.331 | 0 | 2 | 9 | 0 | 5.82 | 15.89 | 1.336 | 4.086 | 0.593 | 2 |
| S11 | −0.42 | 6.826 | 31.5 | 0.969 | 0 | 3 | 9 | 0 | 17.778 | 11.685 | 1.442 | 12.52 | 0.62 | 2 |
| S12 | −0.82 | 3.937 | 29 | 1.319 | 0 | 3 | 9 | 0 | 10.897 | 14.373 | 1.419 | 5.008 | 0.614 | 2 |
| S13 | −1.83 | 7.093 | 32.5 | 0.84 | 0 | 3 | 10 | 0 | 19.5 | 13 | 1.479 | 10.342 | 1.255 | 2 |
| S14 | −0.89 | 2.833 | 25.333 | 1.074 | 0 | 2 | 10 | 0 | 8.23 | 17.103 | 1.364 | 4.209 | 1.187 | 2 |
| S15* | −1.65 | 3.2 | 27 | 1.217 | 0 | 2 | 10 | 0 | 8.371 | 16.578 | 1.372 | 4.309 | 0.63 | 2 |
| S16* | −0.71 | 3.23 | 27 | 1.217 | 0 | 2 | 10 | 0 | 8.321 | 16.622 | 1.37 | 4.27 | 0.585 | 2 |
| S17 | −0.43 | 3.261 | 27 | 1.217 | 0 | 2 | 10 | 0 | 8.352 | 16.62 | 1.368 | 4.309 | 0.576 | 2 |
| S18 | −0.99 | 3.301 | 27 | 1.217 | 0 | 2 | 10 | 0 | 8.454 | 16.56 | 1.37 | 4.403 | 0.621 | 2 |
| S19 | −0.26 | 3.659 | 26.333 | 0.994 | 0 | 3 | 9 | 0 | 12.177 | 14.157 | 1.395 | 4.098 | 1.243 | 2 |
| S20 | −1.44 | 3.458 | 26.333 | 0.994 | 0 | 3 | 9 | 0 | 11.85 | 14.483 | 1.384 | 4.006 | 1.235 | 2 |
| S21 | −0.80 | 4.537 | 29.111 | 1.047 | 0 | 3 | 10 | 0 | 13.688 | 15.423 | 1.407 | 5.672 | 1.234 | 2 |
| S22* | −0.04 | 2.732 | 25.333 | 1.074 | 0 | 2 | 10 | 0 | 8.067 | 17.267 | 1.353 | 4.033 | 1.221 | 2 |
| S23 | −1.65 | 3.82 | 32.667 | 1.093 | 0 | 2 | 14 | 0 | 8.543 | 24.124 | 1.429 | 4.43 | 1.206 | 3 |
| S24 | 0.605 | 3.047 | 23.833 | 1.01 | 1 | 3 | 8 | 1.693 | 10.967 | 12.866 | 1.693 | 4.091 | 1.225 | 2 |
| S25 | −0.795 | 3.55 | 25.5 | 1.163 | 1 | 3 | 8 | 1.715 | 11.33 | 12.24 | 1.715 | 4.285 | 0.631 | 2 |
| S26 | 0.62 | 5.154 | 32.833 | 0.955 | 1 | 4 | 10 | 2.629 | 16.947 | 15.886 | 2.629 | 8.363 | 1.244 | 2 |
| S27 | 0.15 | 6.739 | 34.5 | 0.865 | 1 | 4 | 10 | 2.647 | 20.509 | 13.991 | 2.647 | 8.297 | 1.262 | 2 |
| S28 | −0.14 | 6.739 | 34.5 | 0.865 | 1 | 4 | 10 | 2.647 | 20.509 | 13.991 | 2.647 | 8.297 | 1.262 | 2 |
| S29 | 1.40 | 5.323 | 29 | 1.055 | 1 | 3 | 9 | 1.49 | 14.891 | 13.679 | 1.49 | 5.454 | 0.792 | 2 |
| S30 | 1.70 | 3.697 | 27.333 | 1.188 | 1 | 3 | 9 | 1.463 | 11.329 | 15.389 | 1.463 | 5.536 | 0.744 | 2 |
| S31 | 0.55 | 4.736 | 29.5 | 1.182 | 1 | 3 | 9 | 1.54 | 12.688 | 14.167 | 1.54 | 5.608 | 0.556 | 2 |
| S32 | 0.75 | 2.931 | 27.833 | 1.328 | 1 | 3 | 9 | 1.513 | 9.059 | 15.877 | 1.513 | 4.107 | 0.539 | 2 |
| S33 | −1.35 | 2.594 | 29.333 | 1.473 | 0 | 3 | 9 | 0 | 8.14 | 16.015 | 1.359 | 4.128 | 0.561 | 2 |
| S34* | −1.67 | 4.515 | 31 | 1.319 | 0 | 3 | 9 | 0 | 11.835 | 14.305 | 1.386 | 5.699 | 0.579 | 2 |
| S35 | −0.75 | 5.053 | 29.333 | 1.031 | 1 | 3 | 9 | 2.463 | 14.529 | 14.688 | 2.463 | 8.893 | 0.869 | 2 |
| S36 | −1.55 | 6.68 | 31 | 0.923 | 1 | 3 | 9 | 2.49 | 18.091 | 12.978 | 2.49 | 8.788 | 0.917 | 2 |
| S37 | 1.05 | 3.317 | 23.167 | 1.086 | 1 | 2 | 7 | 1.45 | 9.077 | 13.692 | 1.45 | 5.182 | 0.74 | 1 |
| S38* | 0.05 | 2.731 | 23.667 | 1.247 | 1 | 2 | 7 | 1.5 | 6.884 | 14.192 | 1.5 | 3.941 | 0.527 | 1 |
| S39 | −1.36 | 2.643 | 25.167 | 1.415 | 0 | 2 | 7 | 0 | 5.997 | 14.387 | 1.335 | 3.966 | 0.549 | 1 |
| S40 | −0.15 | 3.839 | 29.5 | 1.182 | 1 | 2 | 11 | 1.45 | 9.605 | 19.304 | 1.45 | 5.526 | 0.72 | 2 |
| S41 | −1.04 | 2.419 | 25.5 | 1.479 | 0 | 2 | 9 | 0 | 5.959 | 15.339 | 1.349 | 4.188 | 0.589 | 2 |
| S42* | 0.77 | 2.215 | 23.833 | 1.331 | 0 | 2 | 9 | 0 | 5.857 | 15.918 | 1.336 | 4.145 | 0.583 | 2 |
| S43* | 0.23 | 3.516 | 25.833 | 1.133 | 1 | 3 | 9 | 1.569 | 11.229 | 14.605 | 1.569 | 5.614 | 1.22 | 2 |
| S44* | 0.89 | 2.833 | 25.333 | 1.178 | 0 | 3 | 8 | 0 | 10.149 | 13.233 | 1.367 | 4.209 | 0.641 | 2 |
| S45 | 0.28 | 3.343 | 26.833 | 1.232 | 0 | 3 | 8 | 0 | 10.371 | 13.419 | 1.371 | 4.28 | 0.498 | 2 |
| S46 | 0.64 | 4.042 | 36.5 | 1.127 | 0 | 3 | 14 | 0 | 10.592 | 25.067 | 1.445 | 4.406 | 0.928 | 3 |
| S47 | 0.77 | 4.042 | 36.5 | 1.127 | 0 | 3 | 14 | 0 | 10.592 | 25.067 | 1.445 | 4.406 | 0.928 | 3 |
| S48 | 0.60 | 2.853 | 25.333 | 1.178 | 0 | 3 | 8 | 0 | 10.154 | 13.214 | 1.376 | 4.128 | 0.664 | 2 |
| S49 | 0.21 | 2.329 | 23.667 | 1.025 | 0 | 3 | 8 | 0 | 9.836 | 13.831 | 1.387 | 3.992 | 1.227 | 2 |
| S50* | −1.81 | 3.285 | 25.833 | 0.86 | 1 | 5 | 6 | 1.936 | 17.196 | 8.637 | 1.936 | 3.925 | 1.256 | 2 |
| S51* | −1.83 | 2.978 | 25.667 | 0.871 | 0 | 5 | 6 | 0 | 16.181 | 9.485 | 1.498 | 3.924 | 1.261 | 2 |
| S52 | −0.08 | 1.787 | 22.167 | 1.168 | 0 | 2 | 9 | 0 | 5.783 | 16.383 | 1.333 | 4.047 | 1.159 | 2 |
| S53 | −0.51 | 2.773 | 23.167 | 1.069 | 0 | 3 | 8 | 0 | 9.797 | 13.369 | 1.364 | 4.165 | 1.226 | 2 |
| S54 | 1.00 | 2.044 | 23.833 | 1.331 | 0 | 2 | 9 | 0 | 5.851 | 15.858 | 1.341 | 4.088 | 0.593 | 2 |
| S55* | −0.64 | 4.94 | 37.667 | 1.058 | 0 | 3 | 15 | 0 | 12.617 | 25.05 | 1.458 | 4.375 | 1.262 | 3 |
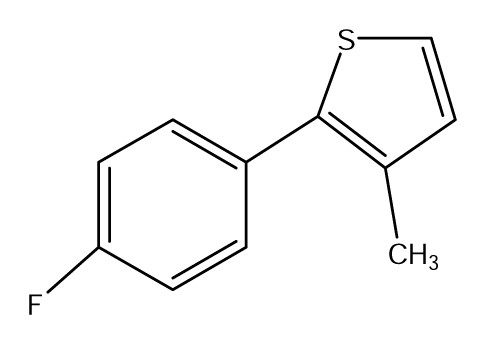
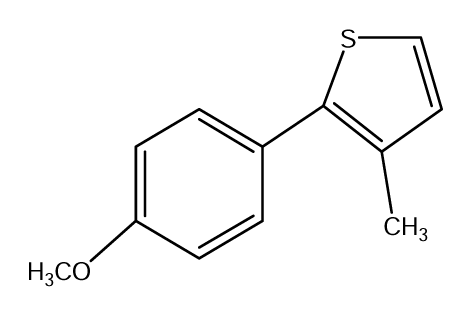
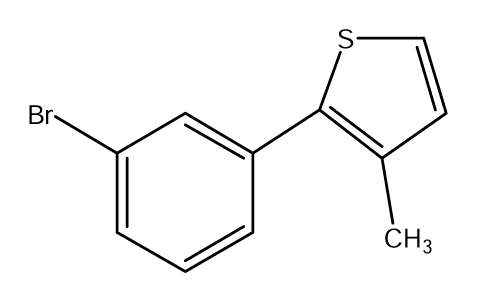
| S1 |  | S2 |  | S3 |  |
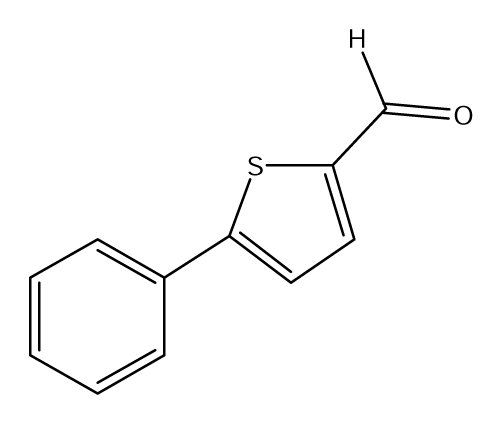
| S4 |  | S5 |  | S6 |  |
| S7 |  | S8 |  | S9 |  |
| S10 |  | S11 |  | S12 |  |
| S13 |  | S14 |  | S15 |  |
| S16 |  | S17 |  | S18 |  |
| S19 |  | S20 |  | S21 |  |
| S22 |  | S23 |  | S24 |  |
| S25 |  | S26 |  | S27 |  |
| S28 |  | S29 |  | S30 |  |
| S31 |  | S32 |  | S33 |  |
| S34 |  | S35 |  | S36 |  |
| S37 |  | S38 |  | S39 |  |
| S40 |  | S41 |  | S42 |  |
| S43 |  | S44 |  | S45 | 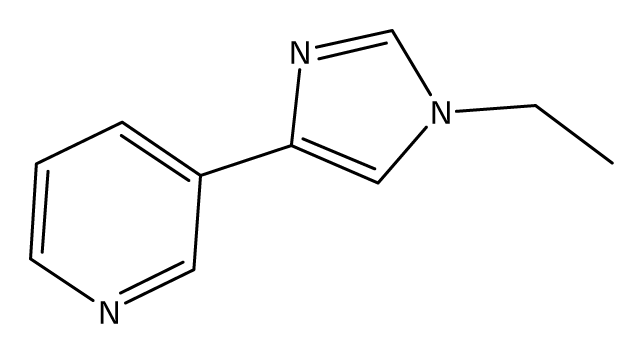 |
| S46 |  | S47 | 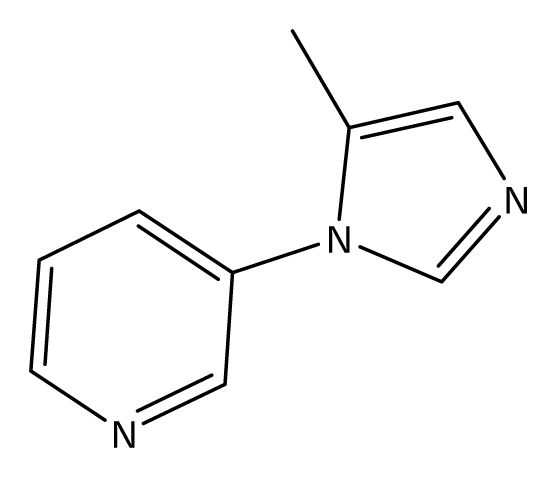 | S48 | 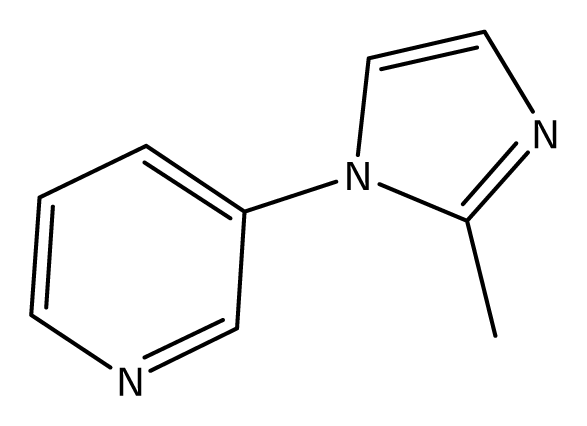 |
| S49 | 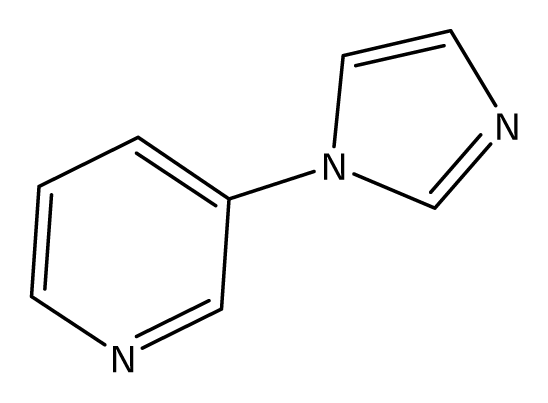 | S50 |  | S51 |  |
| S52 |  | S53 |  | S54 |  |
| S55 | 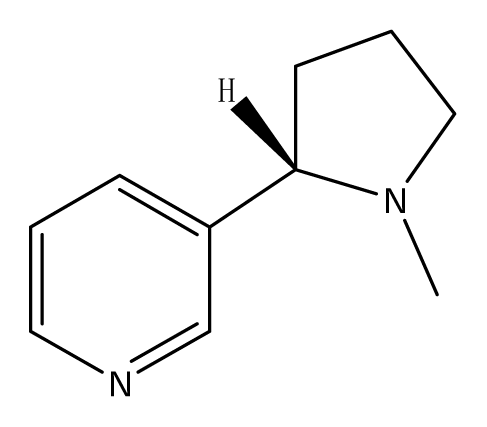 | P1 | 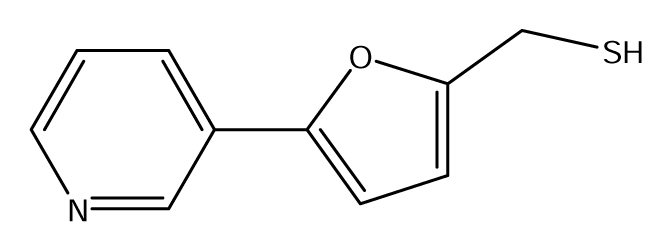 | P2 | 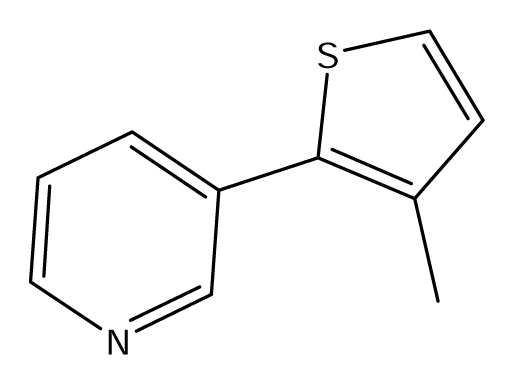 |
| Descriptor | Definition |
|---|---|
| sumdelI | Sum of delta-I values (Intrinsic State and E-State values). |
| sumI | Sum of intrinsic state values (I). |
| Qv | Qv is based on the E-State sumI values. It is the ratio of sumI’s for two extremes of the structure, i.e., molecule’s position along a line from Q calculated for the iso-structural alkane on one end and the most polar iso-skeletal version of the structure. |
| nHBd, nHBa nwHBa, nwHBd | Hydrogen bond donor and acceptor counts (nwHBd and nwHBa are the weak hydrogen bonds). |
| SHBa | Acceptor descriptor for molecule (sum of E-state values for all hydrogen bond acceptors in the molecule). The following groups are classified as acceptors: -OH, =NH, -NH2, -NH-, >N-, -O-, =O, -Salong with -F and -Cl. |
| SHBd | Donor descriptor for molecule (sum of hydrogen E-State values for all hydrogen bond donors in the molecule). The following groups are classified as donors: -OH, =NH, -NH2, -NH-, -SH, and #CH. |
| SwHBa | Descriptor for weak hydrogen bond acceptor (sum of E-State values for all weak hydrogen bond acceptors). Aromatic and otherwise unsaturated carbons are considered to be weak acceptors. |
| Hmax, Gmax, Hmin | Extreme atom level E-State values in molecule:
|
| nrings | Number of rings. |
| K-PLS | PLS | |||
|---|---|---|---|---|
| R | MSE | R | MSE | |
| Training | 0.95 | 0.07 | 0.62 | 0.47 |
| Test | 0.70 | 0.63 | 0.09 | 1.29 |
© 2007 by MDPI Reproduction is permitted for noncommercial purposes.
Share and Cite
Wang, Y.; Li, Y.; Wang, B. An In Silico Method for Screening Nicotine Derivatives as Cytochrome P450 2A6 Selective Inhibitors Based on Kernel Partial Least Squares. Int. J. Mol. Sci. 2007, 8, 166-179. https://doi.org/10.3390/i8020166
Wang Y, Li Y, Wang B. An In Silico Method for Screening Nicotine Derivatives as Cytochrome P450 2A6 Selective Inhibitors Based on Kernel Partial Least Squares. International Journal of Molecular Sciences. 2007; 8(2):166-179. https://doi.org/10.3390/i8020166
Chicago/Turabian StyleWang, Yonghua, Yan Li, and Bin Wang. 2007. "An In Silico Method for Screening Nicotine Derivatives as Cytochrome P450 2A6 Selective Inhibitors Based on Kernel Partial Least Squares" International Journal of Molecular Sciences 8, no. 2: 166-179. https://doi.org/10.3390/i8020166