A DFT-Based QSARs Study of Acetazolamide/Sulfanilamide Derivatives with Carbonic Anhydrase (CA-II) Isozyme Inhibitory Activity

Abstract
:1. Introduction
2. Theory and Computational details
3. Results and discussion
4. Conclusions
Acknowledgements
References
- Kaur, P.; Smitha, R.; Aggarwal, D.; Kapil, M. Acetazolamide: future perspective in topical glaucoma therapeutics. International Journal of Pharmaceutics 2002, 248, 1. [Google Scholar]
- Maren, T.H. Carbonic anhydrase: general prospectives and advances in glaucoma research. Drug. Dev. Res 1987, 10, 255. [Google Scholar]
- Pfeiffer, N. Dorzolamide: development and clinical application of a topical carbonic anhydrase inhibitor. Survey Ophthalmol 1997, 42, 137. [Google Scholar]
- Backer, B. Decrease in intraocular pressure in man by a carbonic anhydrase inhibitor (Diamox). Am. J. Ophthalmol 1954, 37, 13. [Google Scholar]
- Turkmen, H.; Durgun, M.; Yilmaztekin, S.; Emul, M.; Innocenti, A.; Vullo, A.; Scozzafava, A.; Supuran, C.T. Carbonic anhydrase inhibitors. Novel sulfanilamide/acetazolamide derivatives obtained by the tail approach and their interaction with the cytosolic isozymes I and II, and the tumor-associated isozyme IX. Bioorganic & Medicinal Chemistry Letters 2005, 15, 367. [Google Scholar]
- Karelson, M. Molecular Descriptors in QSAR/QSPR; J. Wiley and Sons: New York, 2000. [Google Scholar]
- Tadeschini, R.; Consonni, V. Handbook of Molecular Descriptors; Wiley-VCH: Weinheim, 2000. [Google Scholar]
- Clare, B.W.; Supuran, C.T. Semi-empirical atomic charges and dipole moments in hypervalent sulfonamide molecules: descriptors in QSAR studies. Journal of Molecular Structure (Theochem) 1998, 428, 109. [Google Scholar]
- Clare, B.W.; Supuran, C.T. Carbonic anhydrase inhibitors. Part 61. Quantum chemical QSAR of a group of benzenedisulfonamides. Eur. J. Med. Chem 1999, 34, 463. [Google Scholar]
- Clare, B.W.; Supuran, C.T. Carbonic anhydrase inhibitors - Part 57: Quantum chemical QSAR of a group of 1,3,4-thiadiazole- and 1,3,4-thiadiazoline disulfonamides with carbonic anhydrase inhibitory properties. Eur. J. Med. Chem 1999, 34, 41. [Google Scholar]
- Trohalaki, S.; Giffort, E.; Pachter, R. Improved QSARs for predictive toxicology of halogenated hydrocarbons. Computers and Chemistry 2000, 24, 421. [Google Scholar]
- Zhang, L.; Wan, J.; Yang, G. A DFT-based QSARs study of protoporphyrinogen oxidase inhibitors: phenyl triazolinones. Bioorganic & Medicinal Chemistry 2004, 12, 6183. [Google Scholar]
- Singh, P.P.; Srivastava, H.K.; Pasha, F.A. DFT-based QSAR study of testosterone and its derivatives. Bioorganic & Medicinal Chemistry 2004, 12, 171. [Google Scholar]
- Dewar, M.; Zoebisch, E. G.; Healy, E. F.; Stewart, J.J.B. Development and use of quantum mechanical molecular models. 76. AM1: a new general purpose quantum mechanical molecular model. J. Am. Chem. Soc 1993, 115, 5348. [Google Scholar]
- Stewart, J.J.B. Optimization of parameters for semiempirical methods I. Method. J. Comp. Chem 1989, 10, 209. [Google Scholar]
- Stewart, J.J.B. Optimization of parameters for semiempirical methods II. Applications. J. Comp. Chem 1989, 10, 221. [Google Scholar]
- Frisch, M.J.; Trucks, G.W.; Schlegel, H.B.; Scuseria, G.E.; Robb, M.A.; Cheeseman, J.R.; Montgomery, J.A., Jr.; Vreven, T.; Kudin, K.N.; Burant, J.C.; Millam, J.M.; Iyengar, S.S.; Tomasi, J.; Barone, V.; Mennucci, B.; Cossi, M.; Scalmani, G.; Rega, N.; Petersson, G.A.; Nakatsuji, H.; Hada, M.; Ehara, M.; Toyota, K.; Fukuda, R.; Hasegawa, J.; Ishida, M.; Nakajima, T.; Honda, Y.; Kitao, O.; Nakai, H.; Klene, M.; Li, X.; Knox, J.E.; Hratchian, H.P.; Cross, J.B.; Adamo, C.; Jaramillo, J.; Gomperts, R.; Stratmann, R.E.; Yazyev, O.; Austin, A.J.; Cammi, R.; Pomelli, C.; Ochterski, J.W.; Ayala, P.Y.; Morokuma, K.; Voth, G.A.; Salvador, P.; Dannenberg, J.J.; Zakrzewski, V.G.; Dapprich, S.; Daniels, A.D.; Strain, M.C.; Farkas, O.; Malick, D.K.; Rabuck, A.D.; Raghavachari, K.; Foresman, J.B.; Ortiz, J.V.; Cui, Q.; Baboul, A.G.; Clifford, S.; Cioslowski, J.; Stefanov, B.B.; Liu, G.; Liashenko, A.; Piskorz, P.; Komaromi, I.; Martin, R.L.; Fox, D.J.; Keith, T.; Al-Laham, M.A.; Peng, C.Y.; Nanayakkara, A.; Challacombe, M.; Gill, P.M.W.; Johnson, B.; Chen, W.; Wong, M.W.; Gonzalez, C.; Pople, J.A. GAUSSIAN 03, Revision B.05; Gaussian, Inc: Pittsburgh, PA, 2003. [Google Scholar]
- Parr, R; Yang, W. Density Functional Theory of Atoms and Molecules; Oxford University Press: New York, 1989. [Google Scholar]
- Becke, A.D. Density-functional thermochemistry. III. The role of exact exchange. J. Chem. Phys 1993, 98, 5648. [Google Scholar]
- CODESSA (Comprehensive Descriptors for Structural and Statistical Analysis), Semichem, 7204, Mullen, Shawnee, KS 66216 USA, Copyright©Semichem and the University of Florida, 1995–2004
- Foresman, J.B.; Frisch, A.E. Exploring Chemistry with Electronic Structure Methods, second ed; Gaussian Inc: Pittsburgh, PA, 1996. [Google Scholar]
- Pedregosa, J.C.; Alzuet, G.; Borras, J.; Fustero, S.; Garcia-Granda, S.; Diaz, M.R. Structure of 5- amino-1,3,4-thiadiazole-2-sulfonamide, an inhibitor of the enzyme carbonic anhydrase. Acta Crystallogr 1993, C49, 630. [Google Scholar]
- Nakayama, A.; Hagiwara, K.; Hashimoto, S.; Shimoda, S. QSAR of fungicidal Δ3-1,2,4- thiadiazolines: reactivity-activity correlation of S-H inhibitors. Quant. Struct.-Act. Relat 1993, 12, 251. [Google Scholar]
- Fukui, K. Theory of Orientation and Stereoselection; Springer- Verlag: New York, 1975. [Google Scholar]
- Zhou, Z.; Parr, R.G. Activation hardness: new index for describing the orientation of electrophilic aromatic substitution. J. Am. Chem. Soc 1990, 112, 5720. [Google Scholar]
- Fleming, I. Frontier Orbitals and Organic Chemical Reactions; John Wiley & Sons: New York, 1976. [Google Scholar]
- Lewis, D.F.V. Molecular orbital calculations on solvents and other small molecules: Correlation between electronic and molecular properties υ, αMOL, π*, and β. J. Comput. Chem 1987, 8, 1084. [Google Scholar]
- Parr, R.G.; Donnelly, R.A.; Levy, M.; Palke, W.E. Electronegativity: the density functional viewpoint. J. Chem. Phys 1978, 68, 3801. [Google Scholar]
- Iczkowski, R.P.; Margrave, J.L. Electronegativity. J. Am. Chem. Soc 1961, 83, 3547. [Google Scholar]
- Abbate, F.; Casini, A.; Scozzafava, A.; Supuran, C.T. Carbonic anhydrase inhibitors: X-ray crystallographic structure of the adduct of human isozyme II with a topically acting antiglaucoma sulfonamide. Bioorg. Med. Chem. Lett 2004, 14, 2357. [Google Scholar]
- Clare, B.W.; Supuran, C.T. Carbonic anhydrase inhibitors Part 41,Quantitative Structure Activity correlations involving kinetic rate constants of 20 sulfonamide inhibitors from a noncongeneric series. Eur. J. Med. Chem 1997, 32, 311. [Google Scholar]
- Vidgren, J.; Liljas, A.; Walker, N.P.C. Refined structure of the acetazolamide complex of human carbonic anhydrase II at 1.9 A. Int. J. Biol. Macromol 1990, 12, 334. [Google Scholar]


| Number | Chemical name | LogKI (nM) |
|---|---|---|
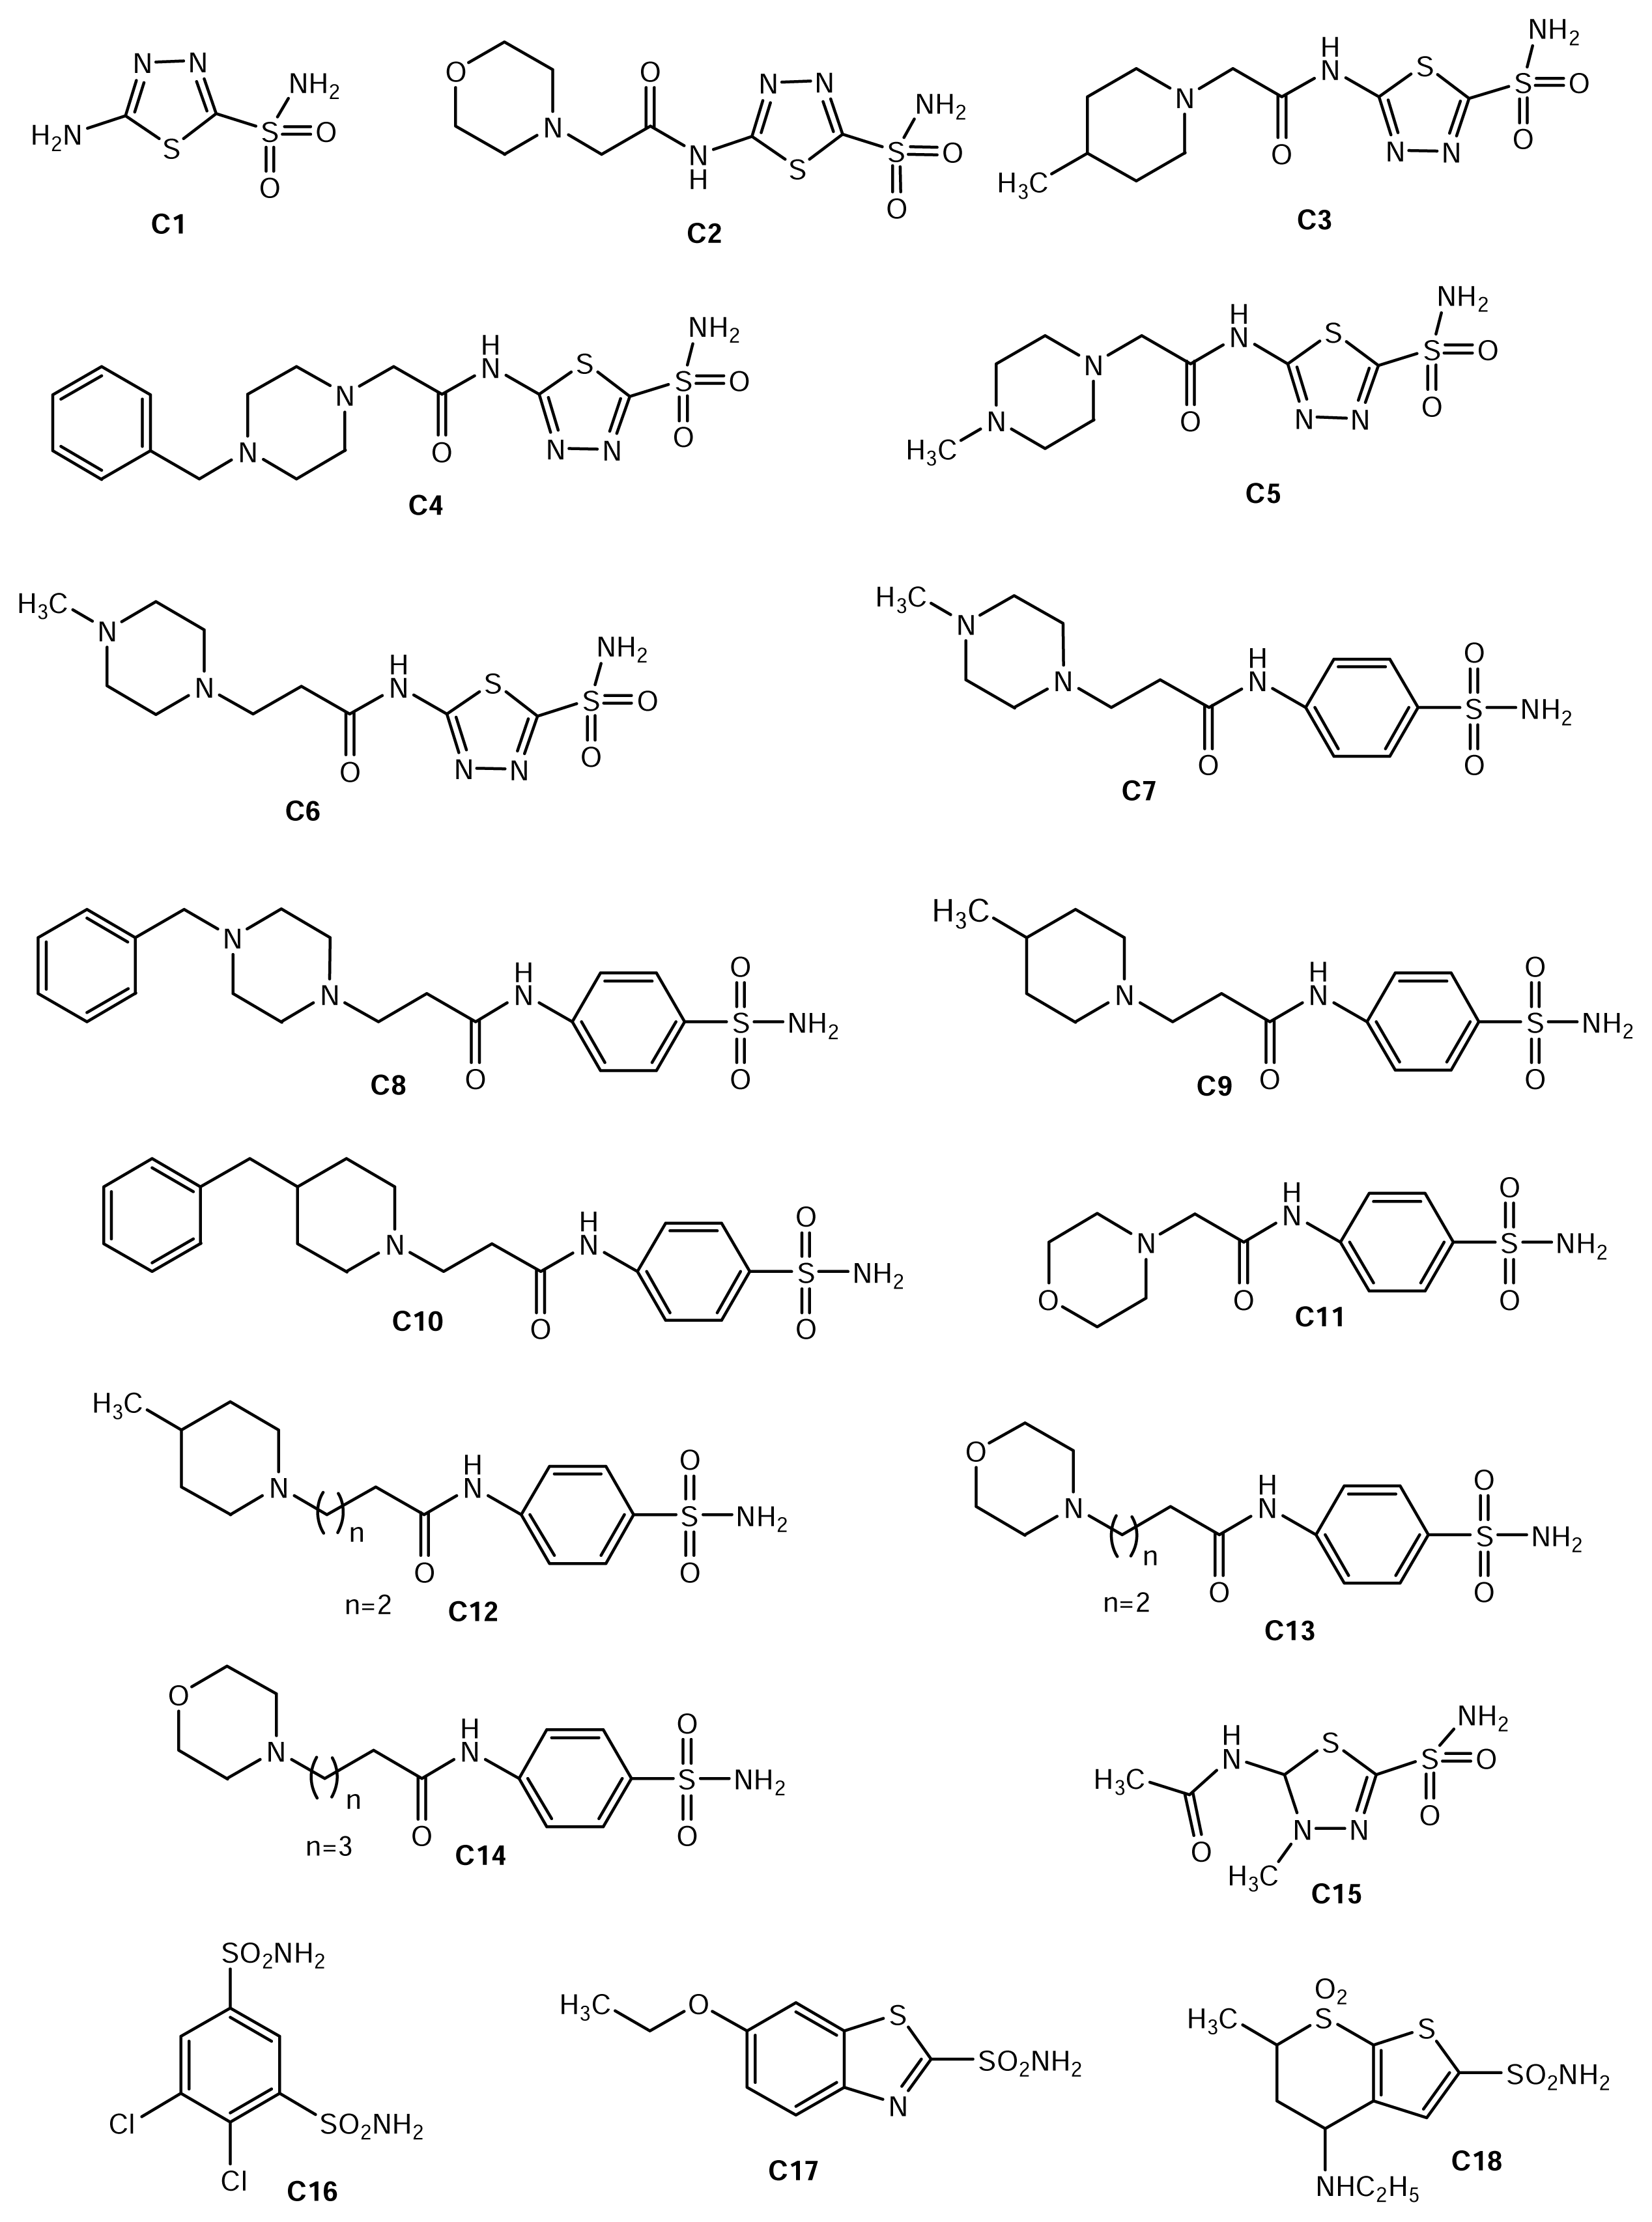
| C1 | Acetazolamide | 1.079 |
| C2 | 2-(2-morpholinoethanoylamino)-1,3,4-thiadiazole-5-sulfonamide | 0 |
| C3 | 2-(2-methylpiperidinoethanoylamino)-1,3,4-thiadiazole-5-sulfonamide | 0.579 |
| C4 | 2-(2-benzylpiperazinoethanoylamino)-1,3,4-thiadiazole-5-sulfonamide | 0.255 |
| C5 | 2-(2-methylpiperazinoethanoylamino)-1,3,4-thiadiazole-5-sulfonamide | 0.204 |
| C6 | 2-(3-methylpiperazinopropionylamino)-1,3,4-thiadiazole-5 sulfonamide | 0.278 |
| C7 | 4-(3-methylpiperazinopropionylamino)benzene sulfonamide | 2.217 |
| C8 | 4-(3-benzylpiperazinopropionylamino)benzene sulfonamide | 2.369 |
| C9 | 4-(3-methylpiperidinopropionylamino)benzene sulfonamide | 2.238 |
| C10 | 4-(3-benzylpiperidinopropionylamino)benzene sulfonamide | 2.411 |
| C11 | 4-(2-Morpholinoethanoylamino)benzene sulfonamide | 1.939 |
| C12 | 4-(4-methylpiperidinobutanoylamino)benzene sulfonamide | 2.423 |
| C13 | 4-(4-Morpholinobutanoylamino)benzene sulfonamide | 2.017 |
| C14 | 4-(5-Morpholinopentanoylamino)benzene sulfonamide | 1.886 |
| C15 | Methazolamide | 1.146 |
| C16 | Dichlorophenamide | 0.903 |
| C17 | Ethoxolamide | 1.579 |
| C18 | Dorzolamide | 0.954 |
| μ | χ | Te | S | ɛH | ɛL | p-LogKI (nM) | e-LogKI (nM) | |
|---|---|---|---|---|---|---|---|---|
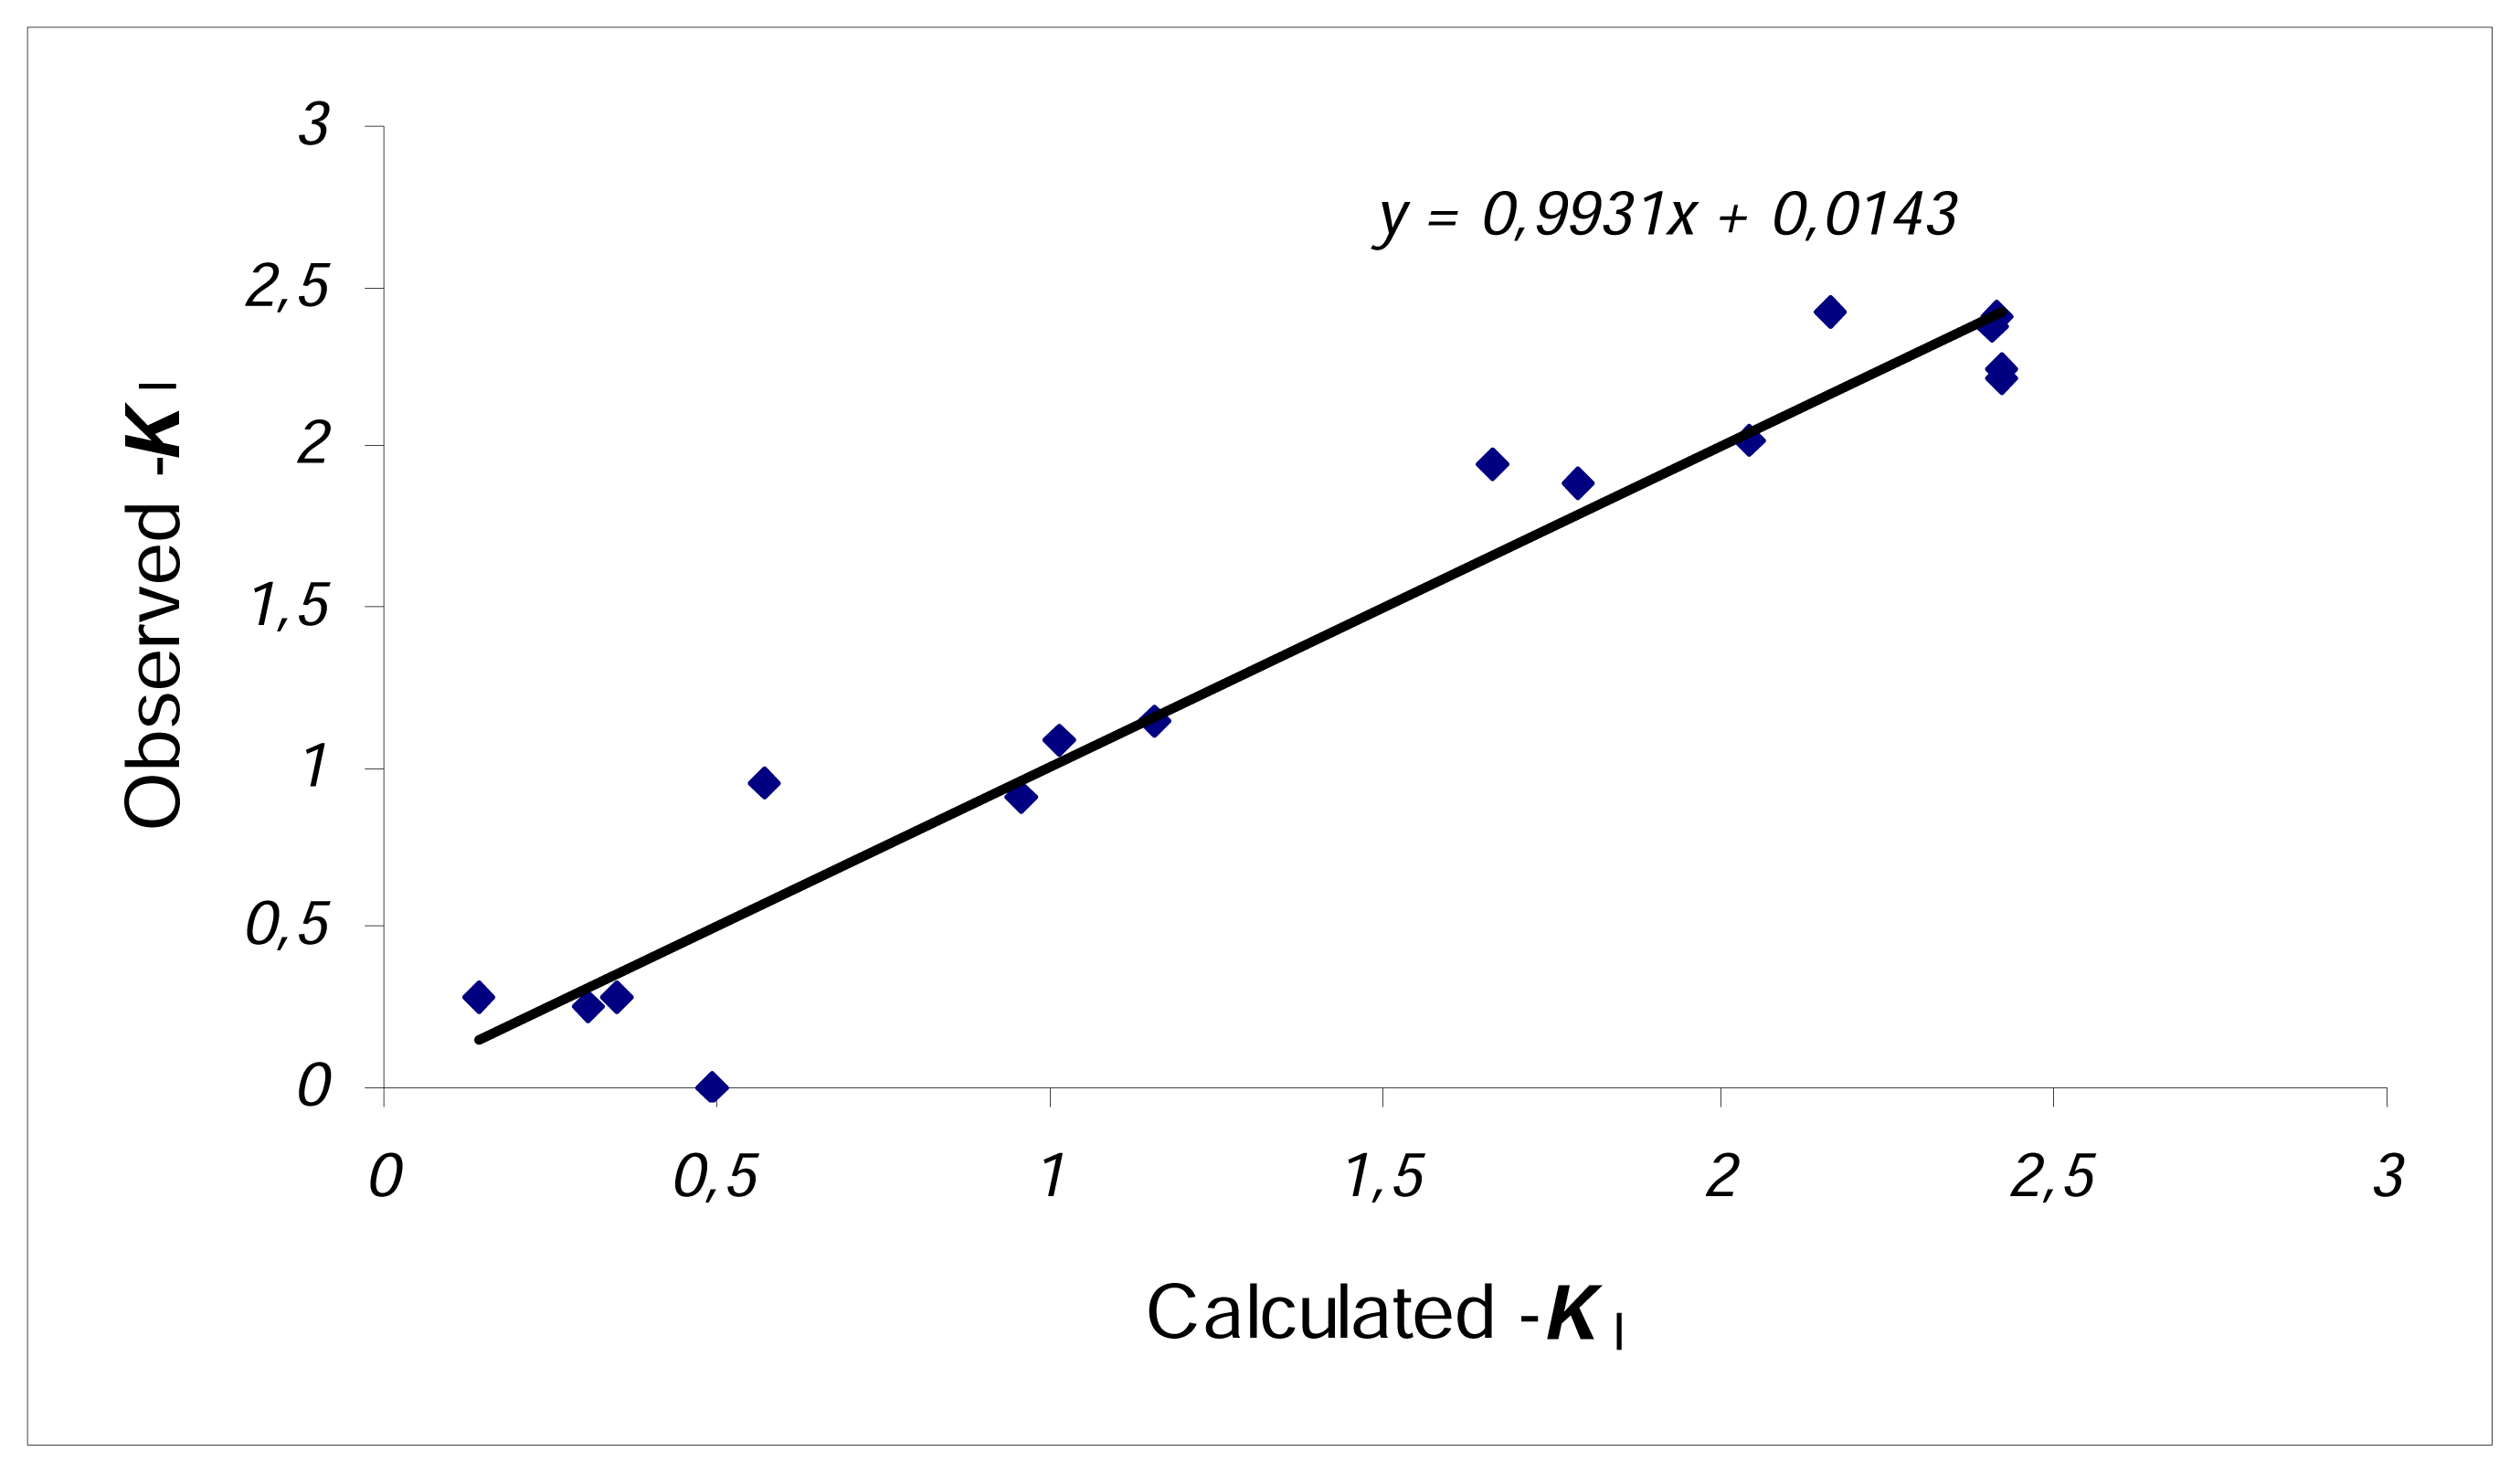
| C1 | 7.5833 | −4.53035 | −1396.87 | 118.94 | −7.2557 | −1.805 | 1.012 | 1.079 |
| C2 | 9.274 | −4.1552 | −1683.34 | 145.33 | −6.6162 | −1.6942 | 0.493 | 0 |
| C3 | 5.8951 | −3.9868 | −1686.71 | 152.64 | −6.2878 | −1.6858 | 1.428 | 0.579 |
| C4 | 10.2529 | −3.85355 | −1933.71 | 175.90 | −6.0951 | −1.612 | 0.307 | 0.255 |
| C5 | 10.1516 | −3.94525 | −1702.74 | 151.82 | −6.2687 | −1.6218 | 0.347 | 0.204 |
| C6 | 11.158 | −3.8854 | −1742.03 | 157.09 | −6.2848 | −1.486 | 0.141 | 0.278 |
| C7 | 5.0308 | −3.3077 | −1389.16 | 162.30 | −5.4515 | −1.163 | 2.424 | 2.217 |
| C8 | 5.0246 | −3.31233 | −1620.13 | 185.74 | −5.4529 | −1.1717 | 2.409 | 2.369 |
| C9 | 5.2198 | −3.19450 | −1373.13 | 163.50 | −5.2651 | −1.1238 | 2.424 | 2.238 |
| C10 | 5.3093 | −3.30498 | −1604.09 | 188.00 | −5.4442 | −1.1657 | 2.415 | 2.411 |
| C11 | 7.6717 | −3.34104 | −1330.46 | 146.79 | −5.7832 | −0.8988 | 1.659 | 1.939 |
| C12 | 6.7593 | −3.52812 | −1412.41 | 168.51 | −6.1843 | −0.8718 | 2.167 | 2.423 |
| C13 | 5.9426 | −4.05371 | −1409.03 | 164.41 | −5.6219 | −2.4855 | 2.047 | 2.017 |
| C14 | 6.0641 | −4.31208 | −1448.31 | 172.06 | −4.4831 | −4.1410 | 1.789 | 1.886 |
| C15 | 7.1901 | −4.05562 | −1436.15 | 127.97 | −6.4273 | −1.6838 | 1.154 | 1.146 |
| C16 | 0.9875 | −4.77509 | −2359.12 | 133.05 | −7.5291 | −2.0210 | 0.954 | 0.903 |
| C17 | 8.1089 | −3.95738 | −1480.26 | 126.83 | −6.2545 | −1.6601 | 0.809 | 1.579 |
| C18 | 6.8271 | −4.08378 | −1995.23 | 151.46 | −6.4665 | −6.4665 | 0.570 | 0.954 |
| No | Equation | Statistical characteristics |
|---|---|---|
| 1 | N=18, R2=0.857, F=19.4 s2=0.137 R2CV=0.789 | |
| 2 | N=18, R2=0.837, F=24.0 s2=0.145 R2CV=0.775 | |
| 3 | N=16, R2=0.943, F=33.2 s2=0.067 R2CV=0.855 (C3 and C17 outliers) | |
| 4 | N=16, R2=0.936, F=40.8 s2=0.068 R2CV=0.893 (C3 and C17 outliers) | |
| 5 | N=16, R2=0.925, F=49.7 s2=0.073 R2CV=0.883 (C3 and C17 outliers) |
© 2007 by MDPI Reproduction is permitted for noncommercial purposes.
Share and Cite
Eroğlu, E.; Türkmen, H.; Güler, S.; Palaz, S.; Oltulu, O. A DFT-Based QSARs Study of Acetazolamide/Sulfanilamide Derivatives with Carbonic Anhydrase (CA-II) Isozyme Inhibitory Activity. Int. J. Mol. Sci. 2007, 8, 145-155. https://doi.org/10.3390/i8020145
Eroğlu E, Türkmen H, Güler S, Palaz S, Oltulu O. A DFT-Based QSARs Study of Acetazolamide/Sulfanilamide Derivatives with Carbonic Anhydrase (CA-II) Isozyme Inhibitory Activity. International Journal of Molecular Sciences. 2007; 8(2):145-155. https://doi.org/10.3390/i8020145
Chicago/Turabian StyleEroğlu, Erol, Hasan Türkmen, Semra Güler, Selami Palaz, and Oral Oltulu. 2007. "A DFT-Based QSARs Study of Acetazolamide/Sulfanilamide Derivatives with Carbonic Anhydrase (CA-II) Isozyme Inhibitory Activity" International Journal of Molecular Sciences 8, no. 2: 145-155. https://doi.org/10.3390/i8020145
APA StyleEroğlu, E., Türkmen, H., Güler, S., Palaz, S., & Oltulu, O. (2007). A DFT-Based QSARs Study of Acetazolamide/Sulfanilamide Derivatives with Carbonic Anhydrase (CA-II) Isozyme Inhibitory Activity. International Journal of Molecular Sciences, 8(2), 145-155. https://doi.org/10.3390/i8020145