Article

Evolution Analysis of the Fasciclin-Like Arabinogalactan Proteins in Plants Shows Variable Fasciclin-AGP Domain Constitutions

1
College of Agronomy, Northwest A&F University, Xianyang 712100, Shaanxi, China
2
College of Landscape Architecture and Arts, Northwest A&F University, Xianyang 712100, Shaanxi, China
3
College of Life Sciences, Northwest A&F University, Xianyang 712100, Shaanxi, China
*
Author to whom correspondence should be addressed.
These authors contribute equally to this work.
Int. J. Mol. Sci. 2019, 20(8), 1945; https://doi.org/10.3390/ijms20081945
Submission received: 22 February 2019 / Revised: 17 April 2019 / Accepted: 19 April 2019 / Published: 20 April 2019
(This article belongs to the Special Issue Plant Cell Wall Proteins and Development)

Abstract

:
The fasciclin-like arabinogalactan proteins (FLAs) play important roles in plant development and adaptation to the environment. FLAs contain both fasciclin domains and arabinogalactan protein (AGP) regions, which have been identified in several plants. The evolutionary history of this gene family in plants is still undiscovered. In this study, we identified the FLA gene family in 13 plant species covering major lineages of plants using bioinformatics methods. A total of 246 FLA genes are identified with gene copy numbers ranging from one (Chondrus crispus) to 49 (Populus trichocarpa). These FLAs are classified into seven groups, mainly based on the phylogenetic analysis of plant FLAs. All FLAs in land plants contain one or two fasciclin domains, while in algae, several FLAs contain four or six fasciclin domains. It has been proposed that there was a divergence event, represented by the reduced number of fasciclin domains from algae to land plants in evolutionary history. Furthermore, introns in FLA genes are lost during plant evolution, especially from green algae to land plants. Moreover, it is found that gene duplication events, including segmental and tandem duplications are essential for the expansion of FLA gene families. The duplicated gene pairs in FLA gene family mainly evolve under purifying selection. Our findings give insight into the origin and expansion of the FLA gene family and help us understand their functions during the process of evolution.

1. Introduction

The cell wall plays an important role in plant growth and development by providing structural support and protection, and acting as a filtering mechanism. Although cell wall proteins account for less than 10% of the cell wall mass, they are predominantly involved in the wall structure, support, signaling, and interactions with other wall components and with the plasma membrane [1,2]. Hydroxyproline-rich glycoproteins (HRGPs) are a major group of cell wall glycoproteins that play important roles in plant growth and development [3].
HRGPs are characterized by a protein backbone rich in hydroxyproline (Hyp). The HRGPs superfamily can be divided into three main subfamilies based on the varying degrees of O-glycosylation: Arabinogalactan proteins (AGPs), extensins (EXTs), and proline-rich proteins (PRPs) [4,5,6]. The protein backbones of AGPs are rich in hydroxyproline/proline (Hyp/Pro), alanine (Ala), serine (Ser), and threonine (Thr), and these amino acids are regularly arranged as Ala–Pro, Ser–Pro, and Thr–Pro, which were introduced as arabinogalactan (AG) glycomodules [7,8,9]. The carbohydrate side chains of AGPs are attached to Hyp and enriched in arabinose and galactose [10]. Based on the variable protein backbones [6], AGPs can be classified into classical AGPs, chimeric AGPs, and AGP-EXT hybrids. The chimeric AGPs can be further categorized into three subclasses based on different conserved domains: Fasciclin-like AGPs (FLAs) [11,12,13], phytocyanin-like AGPs (PAGs) [14,15], and xylogen-like AGPs (XYLPs) [16,17]. As one subclass of the chimeric AGPs, FLAs consist of both fasciclin domains and AGP regions. In most plant species, FLAs contain one or two fasciclin domains. The fasciclin domains contain two highly conserved motifs (H1 and H2) of about 10 amino acids long each and a conserved central YH motif [18]. Proteins with fasciclin domains were first identified in grasshoppers [19] and as adhesion factors were first identified in fruit flies [20]. Since then, more and more fasciclin domains have been identified in animal, yeast, bacteria and plant proteins [18]. The majority of plant fasciclin-like proteins are FLAs and the functions of FLAs are related to many important processes in development and stress responses, such as contributing to biophysical properties (e.g., swelling and interpolymer connectivity), affecting secondary cell wall formation and structure, acting in male gametophyte development, influencing organ formation, and sensing salt stress in roots [18].
To date, FLAs have been identified in several plants, including Arabidopsis (Arabidopsis thaliana) [21], rice (Oryza sativa) [12,22], wheat (Triticum aestivum) [22], poplar (Populus trichocarpa) [23,24], zinnia (Zinnia elegans) [25], cotton (Gossypium raimondii) [26], sea island cotton (Gossypium barbadense) [27], Chinese cabbage (Brassica rapa) [28], eucalyptus (Eucalyptus grandis) [13], and textile hemp (Cannabis sativa) [29]. The analysis of HRGPs from 1000 plant transcriptomes has provided new insights into the evolution of HRGPs across major evolutionary milestones and reveals the origin and diversity of Glycosylphosphatidylinositol (GPI)-anchored AGPs [3]. However, the evolutionary history of the FLA family in plants is little known. In a previous study, it was proposed that a conserved group of FLAs with a single fasciclin domain was specific to the evolution of flowering plant secondary cell wall formation and properties through phylogenetic analysis of >100 FLA mature proteins [30]. In this study, we identify 246 FLAs from 13 plant species belonging to algae, liverworts, mosses, lycophytes, gymnosperms, dicots, and monocots. Moreover, bioinformatics methods are adopted to reveal the evolutionary mechanisms of the FLA family. In order to understand the functions of the FLAs, the evolutionary history of FLAs is investigated in this study. It is found that the FLA genes are abundant in most investigated green plants, but only in one red alga. Additionally, our study shows that there is a reduction in the number of fasciclin domains in FLAs from algae to land plants, which indicates that the reduced number of fasciclin domains plays a crucial role in land plant evolution.

2. Results and Discussions

2.1. Identification of the FLA Family in Plants

FLAs contain both fasciclin domains and AGP regions [6]. We first used the HMM profile of fasciclin downloaded from Pfam (available online: http://pfam.xfam.org/family/PF02469) to identify the proteins with fasciclin domains from 13 plant species (C. crispus, Chlamydomonas reinhardtii, Chara braunii, Marchantia polymorpha, Physcomitrella patens, Selaginella moellendorffii, Picea abies, Amborella trichopoda, Brachypodium distachyon, O. sativa, A. thaliana, E. grandis, and P. trichocarpa) [31,32,33,34,35,36,37,38,39,40,41,42,43]. Then, the obtained proteins were examined by using Batch CD-search tool in the NCBI conserved domain database (available online: http://www.ncbi.nlm.nih.gov/Structure/bwrpsb/bwrpsb.cgi). After that, the AGP regions were identified from these fasciclin proteins by using Finding-AGP program [7]. The proteins that contained both AGP regions and fasciclin domains were identified as FLAs. A total of 235 FLA genes were identified by the HMMER-Finding-AGP program method.
However, the number of FLA genes found in some plants was different from those described in former studies. In A. thaliana, FLA20 (AT5G40940) and FLA21 (AT5G06920) [21] were not identified, while a new putative FLA gene, AT5G16920, was identified. In E. grandis, Eucgr.A01741 and Eucgr.K02662 were missing [13], and Eucgr.K00086 was a newly identified FLA gene. In P. trichopoda, 46 FLA genes were identified compared with the 50 FLA genes analyzed in a previous study [24]: Potri.013G152200, Potri.T130300, Potri.001G440800, Potri.018G005100, Potri.008G127500, Potri.008G128200, and Potri.005G079500 were not identified, whereas Potri.019G049600, Potri.T118500 and Potri.012G006200 were new putative FLA genes identified in this study. In O. sativa, two FLA genes found in a previous study (LOC_Os02g49420 and LOC_Os02g26290) [12] were not identified, while a putative new FLA gene (LOC_Os12g13160) was identified in our work. Among 13 FLA genes that were not identified by the HMMER-Finding-AGP program method, it was found that Potri.T130300, Potri.018G005100, LOC_Os02g49420, and LOC_Os02g26290 did not contain a fasciclin domain by using Batch CD-Search tool. Besides, because the AGP regions of Eucgr.K02662, Potri.008G127500, and Potri.008G128200 were found in the fasciclin domain, they were not identified as FLAs in this study. Then, the remaining six FLAs (AT5G40940, AT5G06920, Eucgr.A01741, Potri.013G152200, Potri.001G440800, and Potri.005G079500) were included in this study and also used as queries to perform BLAST searches to identify their homologous FLAs in other plant species: Phpat.003G041000 in P. patens, MA_89859g0010 and MA_10360g0010 in P. abies, scaffold00024.69 in A. trichopoda, and Eucgr.H00590.1 in E. grandis. As a result, 246 FLA genes were identified.
The number of FLA genes ranged from 1 to 49 across the different plant species; in most species, the number of FLA genes was between 11 and 26. C. crispus had only one FLA gene, while P. trichocarpa contained the highest number of FLA genes (49), almost double the number of the second one, O. sativa (26). It was found that the number of FLA genes and genome size were uncorrelated. P. abies, for instance, which had the largest genome size (19,600 Mb) among these 13 plant species, had only 24 FLA genes compared with P. trichocarpa which had 49 FLA genes with a much smaller genome size (434.29 Mb) (Table 1). The number of FLA genes was also uncorrelated with the number of predicted genes in plant species. For example, E. grandis contained more genes (45,226) than O. sativa, while O. sativa had more FLA genes (26) than E. grandis (18) (Table 1). Overall, higher plants contained the highest number of FLA genes and the number of FLA genes increased from lower plants to higher plants. For example, the number of FLA genes was doubled from lycophytes to gymnosperm.
Moreover, the intron-exon structures of 246 FLA genes were retrieved from the OrcAE website (available online: https://bioinformatics.psb.ugent.be/orcae/overview/Chbra), Phytozome website (Version 12; available online: https://phytozome.jgi.doe.gov/pz/portal.html), and ConGenIE website (available online: http://congenie.org/) and were displayed by GSDS 2.0 (available online: http://gsds.cbi.pku.edu.cn/) [44]. Green algae FLA genes contained a large number of introns, while most land plants FLA genes contained one intron or even had no intron (Table S1). It seemed that introns in FLA genes were lost during plant evolution, especially from green algae to land plants.

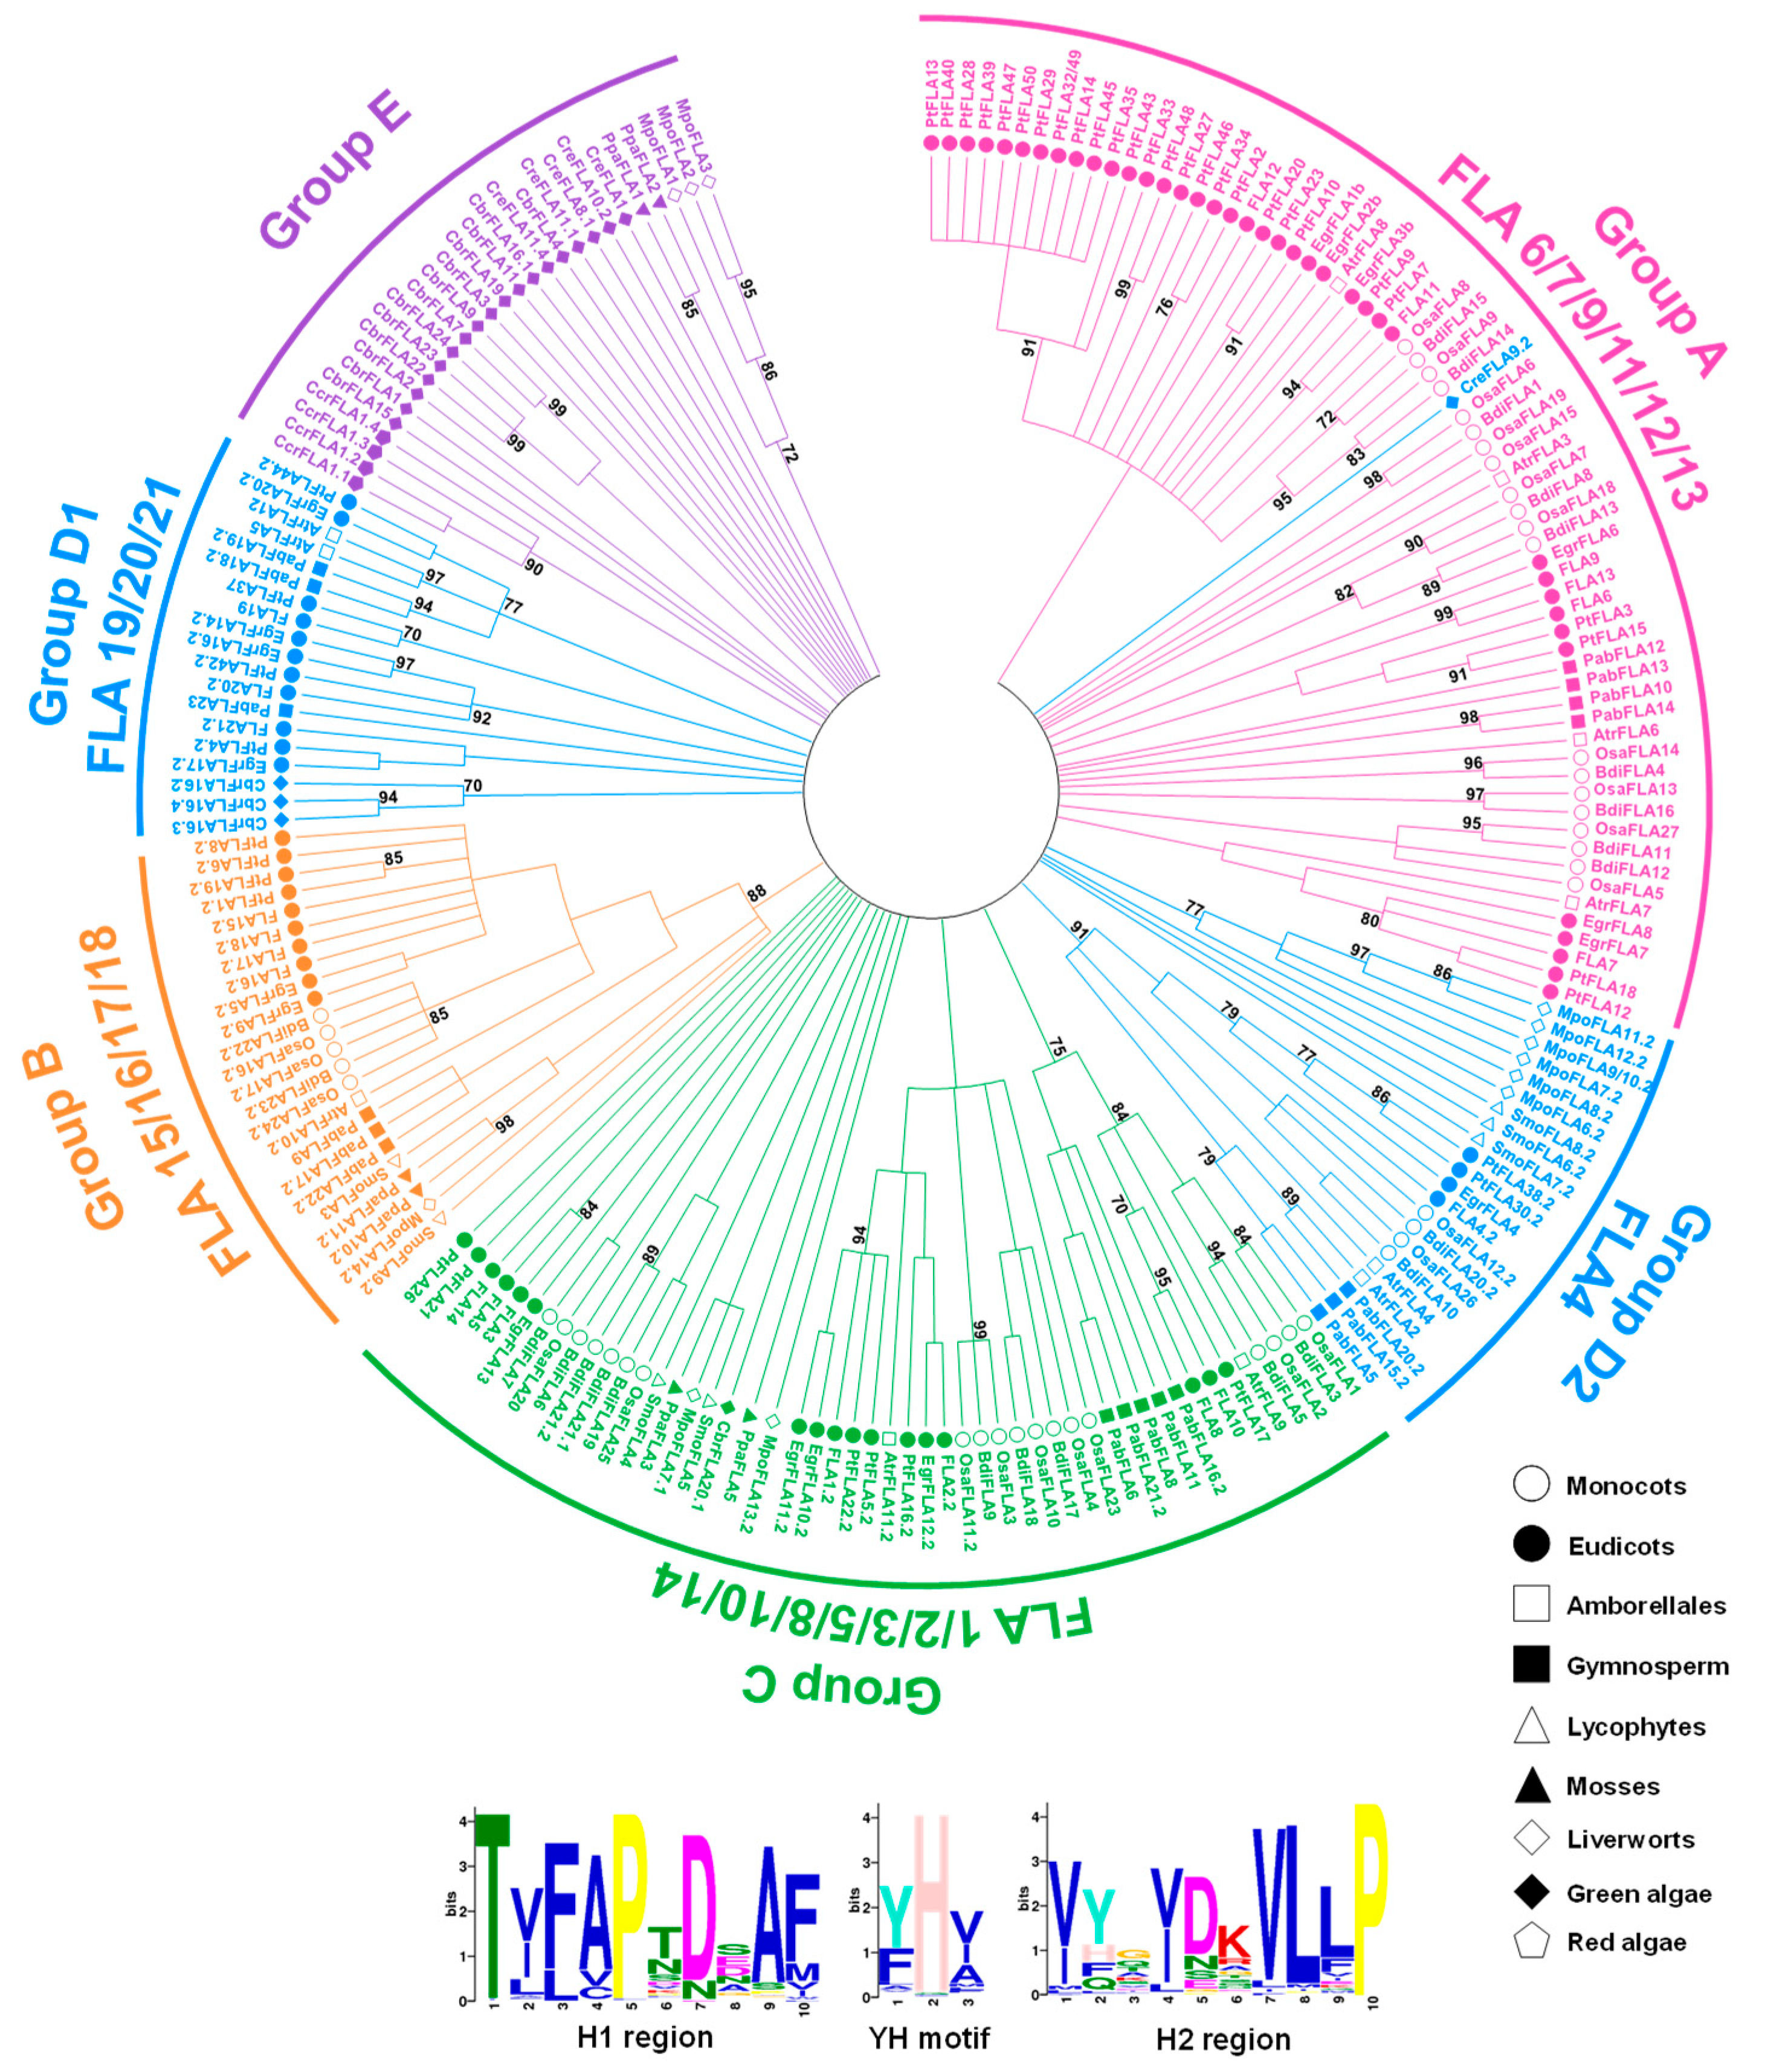
2.2. Phylogenetic Analysis and Classification of FLAs

In order to understand the relationships between FLAs with different numbers of fasciclin domains, evolutionary analysis was performed based on multiple sequence alignments of FLAs. First, all the FLA protein sequences were filtered by BLAST+ [45] with a −5 expect (E) threshold. The sequences (CreFLA2, CreFLA3, CreFLA4, CreFLA5, CreFLA6, and CreFLA7 in C. reinhardtii, CbrFLA5, CbrFLA6, CbrFLA8, CbrFLA10, CbrFLA12, CbrFLA13, CbrFLA14, CbrFLA17, CbrFLA18, and CbrFLA21 in C. braunii) with low similarity to other plant species were removed, and classified into Group F (Table S1). Next, after removing sequences of signal peptides and GPI anchor addition signals, the filtered 230 FLA sequences were aligned by Clustal Omega 1.2.2, and the HMM profile of fasciclin domains was used as a guide [46,47]. Then, the fasciclin domains could be divided into two types (Type 1 and Type 2) based alignment results (Figure 1 and Figure S1). The FLA sequences with Type 1 and Type 2 fasciclin domains were further aligned, respectively (Figures S2 and S3). Interestingly, for some algae FLA sequences that contained more than two fasciclin domains, only one or two fasciclin domains had hits in other FLA sequences: The first and the fourth fasciclin domains in CreFLA11, the second fasciclin domain in CreFLA10. It was likely that the other fasciclin domains with low similarity to those in higher plants were lost in the course of evolution from algae to land plants.
The phylogenetic tree of filtered 230 FLA sequences could not be built because the identity of alignment was very low (<30%). Once the identity was above 30%, the accuracy of alignment was acceptable [48,49,50]. The accuracy of the FLA alignment results was tested by computing the overall mean distance with the P-distance method in Mega 7 [49,51]. As P-distance equals 1 minus the identity of amino acids, the identities of Type 1 and Type 2 fasciclin domains were 31.7% and 30.4%, respectively. The accuracy results of Type 1 and Type 2 were 0.683 and 0.696, respectively. These indicators made it suitable for building the phylogenetic trees. The Maximum Likelihood (ML) trees for each type were built using the best models: Le_Gascuel_2008 model [52] + Gamma distribution + evolutionarily invariable (LG + G + I) for Type 1, Le_Gascuel_2008 model + Gamma distribution (LG + G) for Type 2, with 85% partial deletion by Mega 7. Bootstrap analyses with 1000 replicates were performed for support estimation. Confidence values below 50% were cut off, and confidence values higher than 70% were shown on nodes (Figure 2 and Figure 3). Although the similarity between full-length sequences of FLAs are quite low, the fasciclin domains exhibited two highly conserved motifs (H1 and H2) and a conserved central YH motif [18]. MEME web server (available online: http://meme-suite.org/tools/meme) [53] was used to find the conserved motif (H1, H2, and YH motifs) of Type 1 and Type 2 sequences. The H1 and YH motif were similar between Type 1 and Type 2 sequences, while the H2 region was quite different. In Type 1 sequences, the H2 motif was characterized by [Gly/Ile/Val/Leu/Phe]–X–[Ile/Val/Cys]–His–Gly–[Ile/Val/Leu]–X–X– [Leu/Val/Pro/Ile]–[Leu/Met/Ile] sequence. In Type 2 sequences, the H2 motif was characterized by [Val/Ile/Met/Leu]–[Tyr/His/Phe/Gln]–X–[Val/Ile/Leu]–X–X–[Val/Leu]–Leu–[Leu/Phe/Val]–Pro sequence (X represents any amino acid) (Figure 2 and Figure 3). Interestingly, most FLAs with single fasciclin domain was of Type 2, while only a few FLAs with single fasciclin domain was of Type 1.
Based on the sequence similarity, phylogenetic analysis, and previous study [11], we have classified FLAs into seven groups: Group A (including FLA6, FLA7, FLA 9, FLA 11–13 from A. thaliana), Group B (FLA 15–18 from A. thaliana), Group C (including FLA 1–3, FLA 5, FLA8, FLA10, FLA14 from A. thaliana), Group D1 (including FLA 19–22 from A. thaliana), Group D2 (including FLA4 from A. thaliana), Group E, and Group F (Table S1). Group F sequences were all algae FLAs which were not included in building phylogenetic trees. The remaining algae FLAs were all in Group D1 and Group E, which meant that Group D1 and Group E might be traced back to the origin of the FLA family in plants. Moreover, FLA3, 5, 14, 20, 21, and 22 were specifically expressed in anthers at different stages of floral development [18,54,55]. FLA3 was involved in microspore development, and its knock-down plants showed reduced female fertility [56]. There was a probability that Group C and Group D1 FLAs were mainly related to male gametophyte development. Group C and Group D1 FLAs were also related to the growth regulator. For instance, FLA1 and FLA2 might play an important role in root development [57,58]. Interestingly, in Group A, all FLAs were with single fasciclin domain. A previous study proposed that Group A FLAs were specific to the evolution of flowering plant secondary cell wall formation and properties [30]. For example, FLA11, FLA12, and ZeFLA11 are highly expressed in vascular tissue and double mutants of FLA11 and 12 showed defects in secondary cell wall thickening [25,30]. EgrFLA1, 2, and 3 were also highly expressed in stems. EgrFLA2 was involved in altering fiber cellulose deposition in woody tissue, and EgrFLA3 influenced flexural strength [13]. In Eucalyptus nitens, EniFLA1, 2, and 3, which were closely related to FLA11 and 12, as well as highly similar to EgrFLA1 and 2, could affect stem biomechanics [30]. These Group A FLAs and their homologs in other plants (poplar, zinnia) were also involved in secondary cell wall biosynthesis [23,25]. In addition, FLA9 in Group A was also related to seed development. It had been shown that the stress-induced reductions of FLA9 gene expression enhanced the abortion of fertilized ovaries [59].
In addition, the variable fasciclin number of FLAs had a tight relationship to the phylogenetic tree. All the FLAs with multiple fasciclin domains (>2) were in Group D1 and Group E. As these FLAs were only identified in algae, they might be the most original FLAs in the course of evolutionary history. In Group A, all the FLAs were with single fasciclin domain and belonged to seed plants. Group A FLAs were the latest FLAs generated in the course of evolutionary history. From Group E to Group A, the number of fasciclin domains reduced over the course of evolutionary history. Except for Group A FLAs, the structures of FLAs were quite diverse, especially for Group E FLAs, which included the most original FLAs. Moreover, Group E FLA genes contained more introns than other groups. The number of introns also reduced over the course of evolutionary history.
Moreover, to understand the relationship between FLAs with single fasciclin domain, a phylogenetic tree of FLAs with single fasciclin domain from nine plant species (C. reinhardtii, C. crispus, M. polymorpha, P. patens, S. moellendorffii, P. abies, A. trichopoda, B. distachyon, and A. thaliana) was built by the Maximum Likelihood (ML) method under the LG + G model with 85% partial deletion. Bootstrap analyses with 1000 replicates were performed for support estimation; confidence values higher than 50% were shown on nodes. The structure displays of these FLAs were generated by GSDS 2.0 (available online: http://gsds.cbi.pku.edu.cn/) [44] (Figure 4). The structure of Group A FLA genes was very similar. Except for PabFLA12, PabFLA14, and AtrFLA6, the remaining Group A FLA genes did not contain introns, and most of their fasciclin domains were flanked by two AGP regions. The structures of FLAs with single fasciclin domains in Group E were quite diverse. By contrast, the phylogenetic relationship of FLAs with single fasciclin domain was similar to the phylogenetic relationships of Type 2 (Figure 3). The main type of fasciclin domain in these FLAs was Type 2 fasciclin domain. Most of Group D1 FLAs contained Type 1 fasciclin domains. It is likely that the Type 1 fasciclin domain was lost mainly in FLAs with single fasciclin domain over the course of evolutionary history. Different from phylogenetic relationships of Type 1 and Type 2 fasciclin domains (Figure 2 and Figure 3), Group C appeared to be divergent (Figure 4). Some Group C FLAs were close to Group D2, while others were close to Group B. Moreover, the structure of these diverged Group C was different. The fasciclin domains of FLAs tailed with AGP regions belonged to Group C, which were close to Group B. For FLAs from Group C which was close to Group D2, their fasciclin domains were covered by two AGP regions.

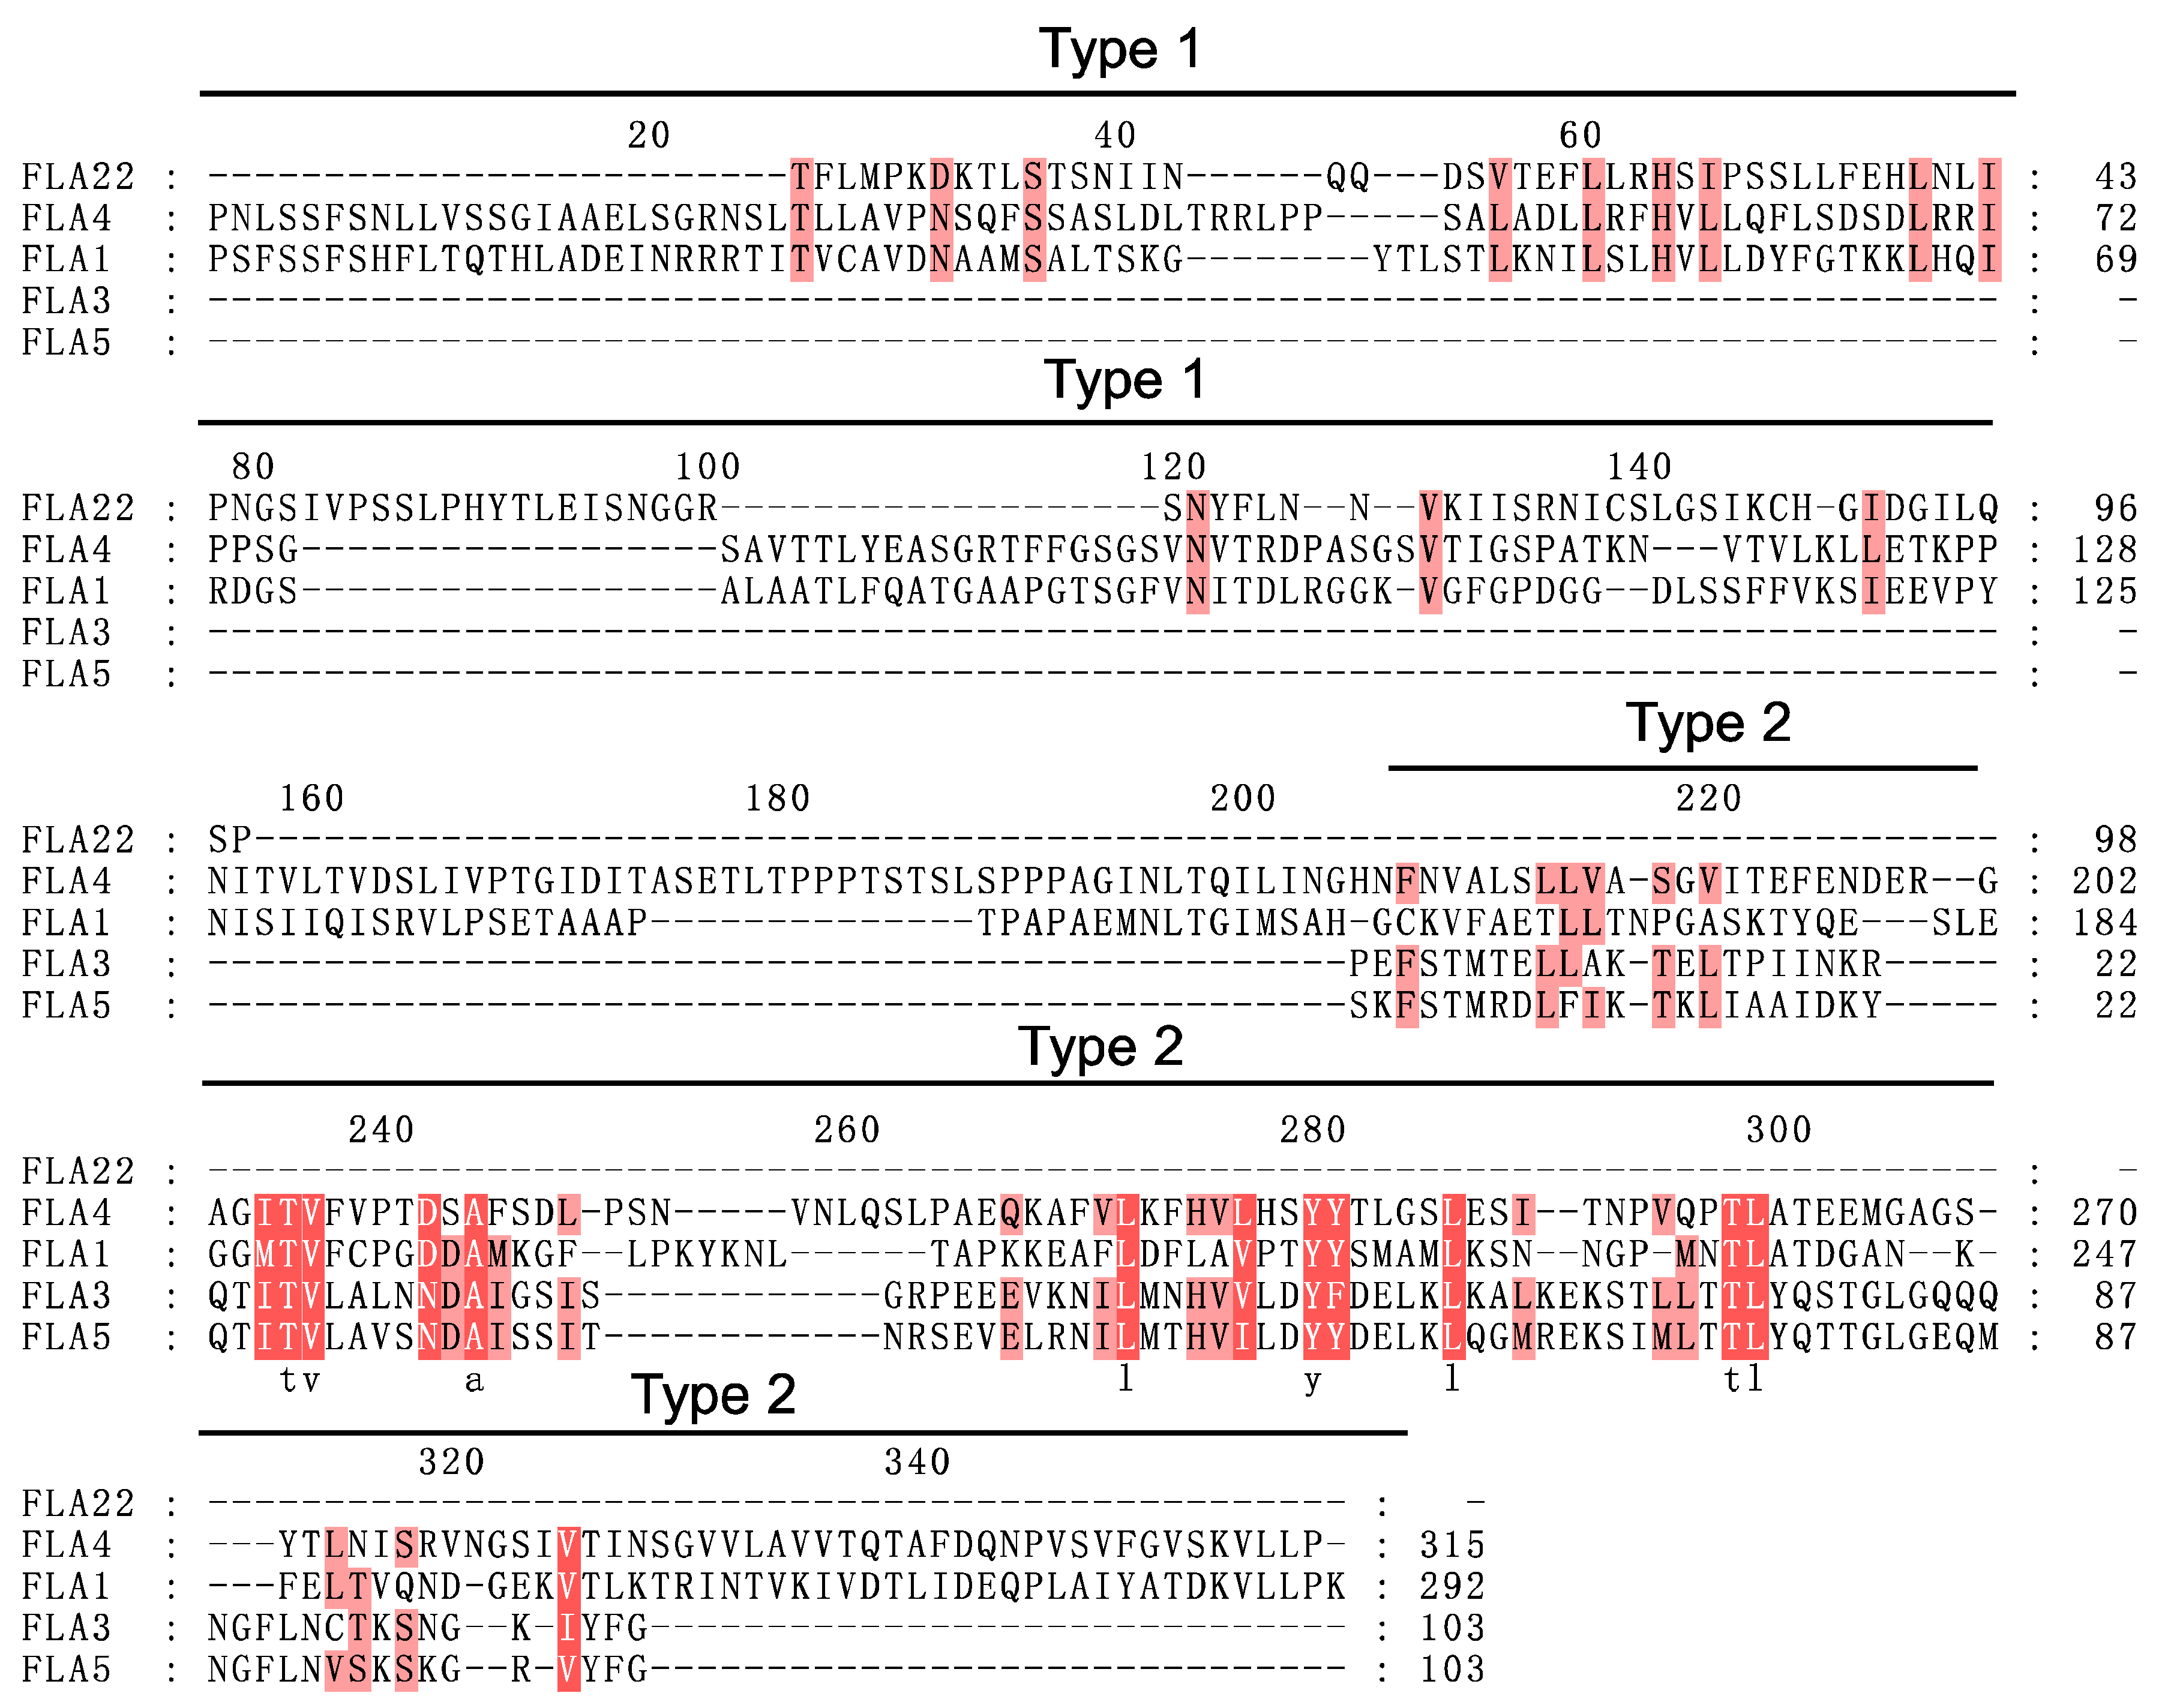
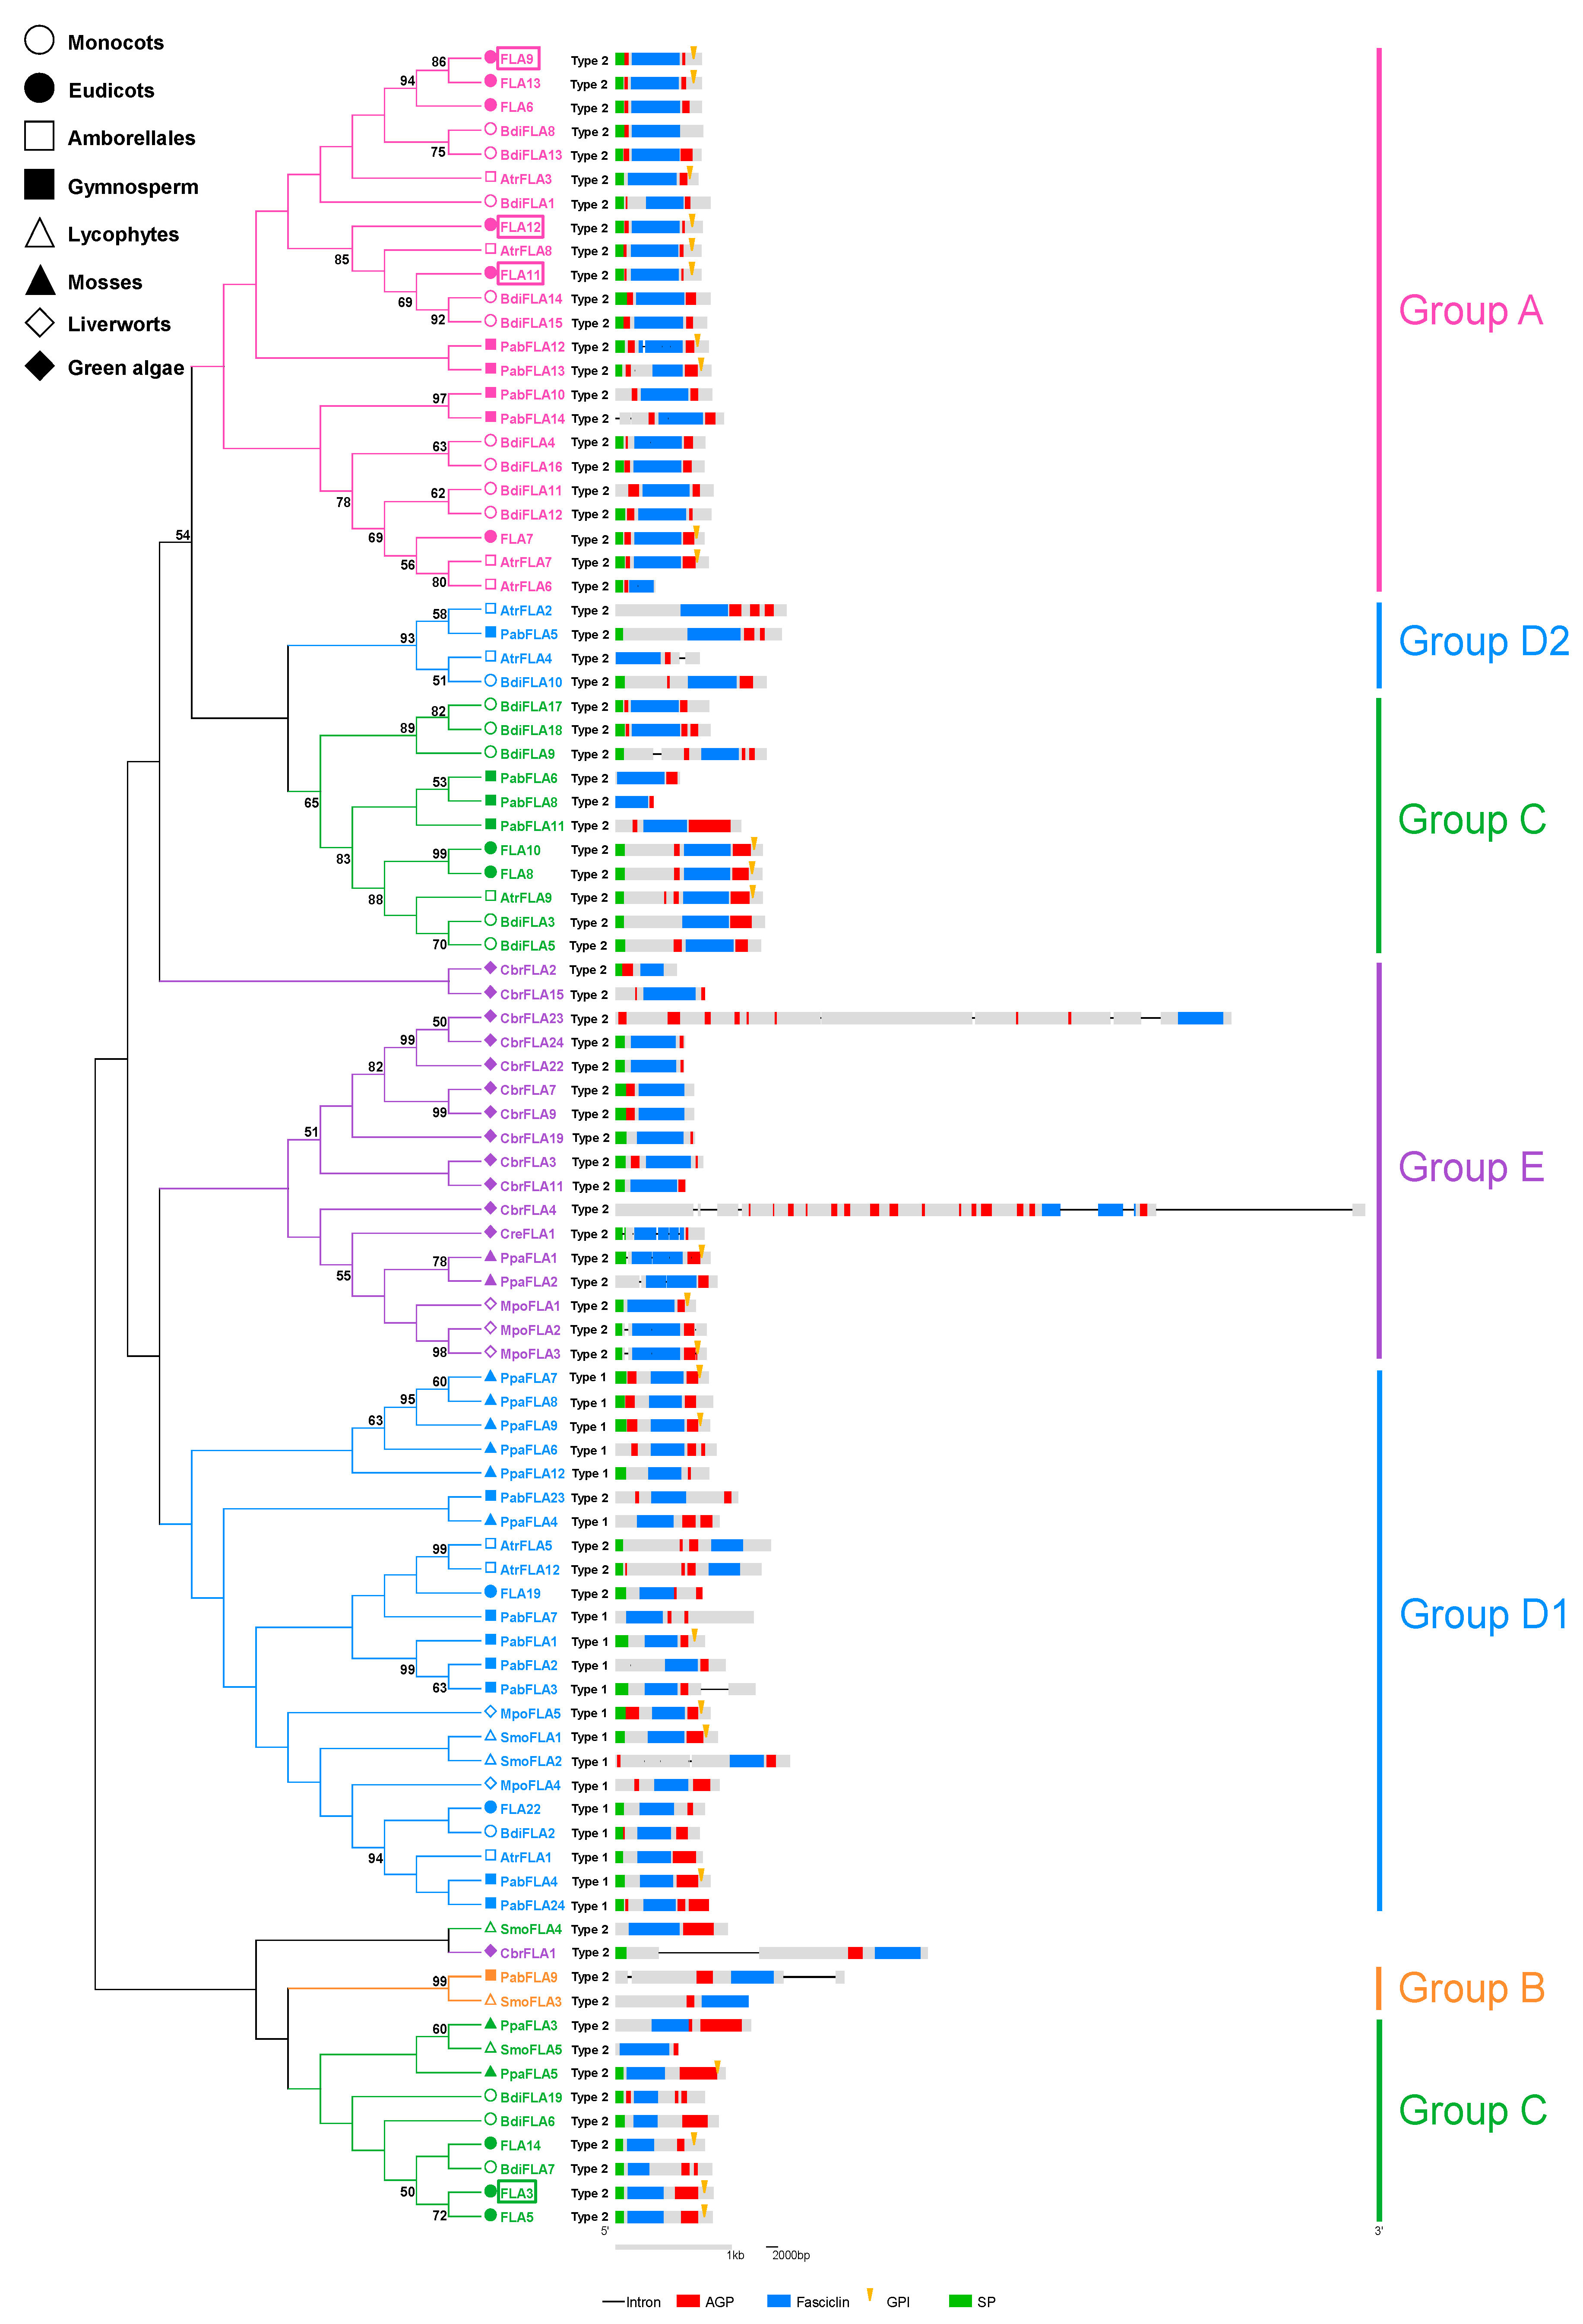
2.3. Structural and Evolutionary Analysis of FLAs

The amino acid sequences of 246 FLAs identified in our work were shown in Figure S4. One hundred seventy-six of them contained a single fasciclin domain, and 66 of them contained two fasciclin domains. Only four FLAs with more than two fasciclin domains were found in algae, one in red algae and three in green algae. Moreover, FLAs with a single fasciclin domain, as well as with two domains first appeared in green algae (Figure 5). It was likely that divergence happened in green algae. From green algae to land plants, the number of fasciclin domains in FLAs was reduced. It had been proven that FLAs with a single fasciclin domain had conserved roles in secondary cell wall biology and properties [13]. Besides, there was an example of the functional roles of different fasciclin domains in one FLA protein. The C-proximal fasciclin domain of FLA4 was responsible for its genetic functions, while the N-proximal fasciclin domain was required for stabilization of plasma membrane localization [60,61]. It was likely that the number of fasciclin domains was related to the functions of FLAs.
FLAs were classified into seven groups based on the sequence similarity, phylogenetic analysis, and previous study [11]. Different from the previous study [11], Group D was divided into Group D1 and Group D2 because of their difference in phylogenetic analysis. Moreover, Group E and Group F present in non-seed plants are the groups newly proposed in this work. The evolutionary history of FLA family was shown in Figure 5. FLAs evolved very early during plant evolution. Group E first appeared in the plant kingdom, then Group F, Group D1, Group C, Group D2, Group B, Group A appeared successively. The Group E FLA from red algae was the most original FLA. Group F was largely dissimilar to the other groups and only existed in green algae. Group D1 and Group C evolved early during green plant evolution. The divergence of FLAs occurred in green algae; Group D1 and Group C remained, while Group F was lost after the separation between green algae and land plants. Group B and Group D2 evolved after plants conquered the land. Group A, the latest group appeared, evolved during seed plant evolution. By contrast, Group E, the earliest appeared group, was lost in seed plants.

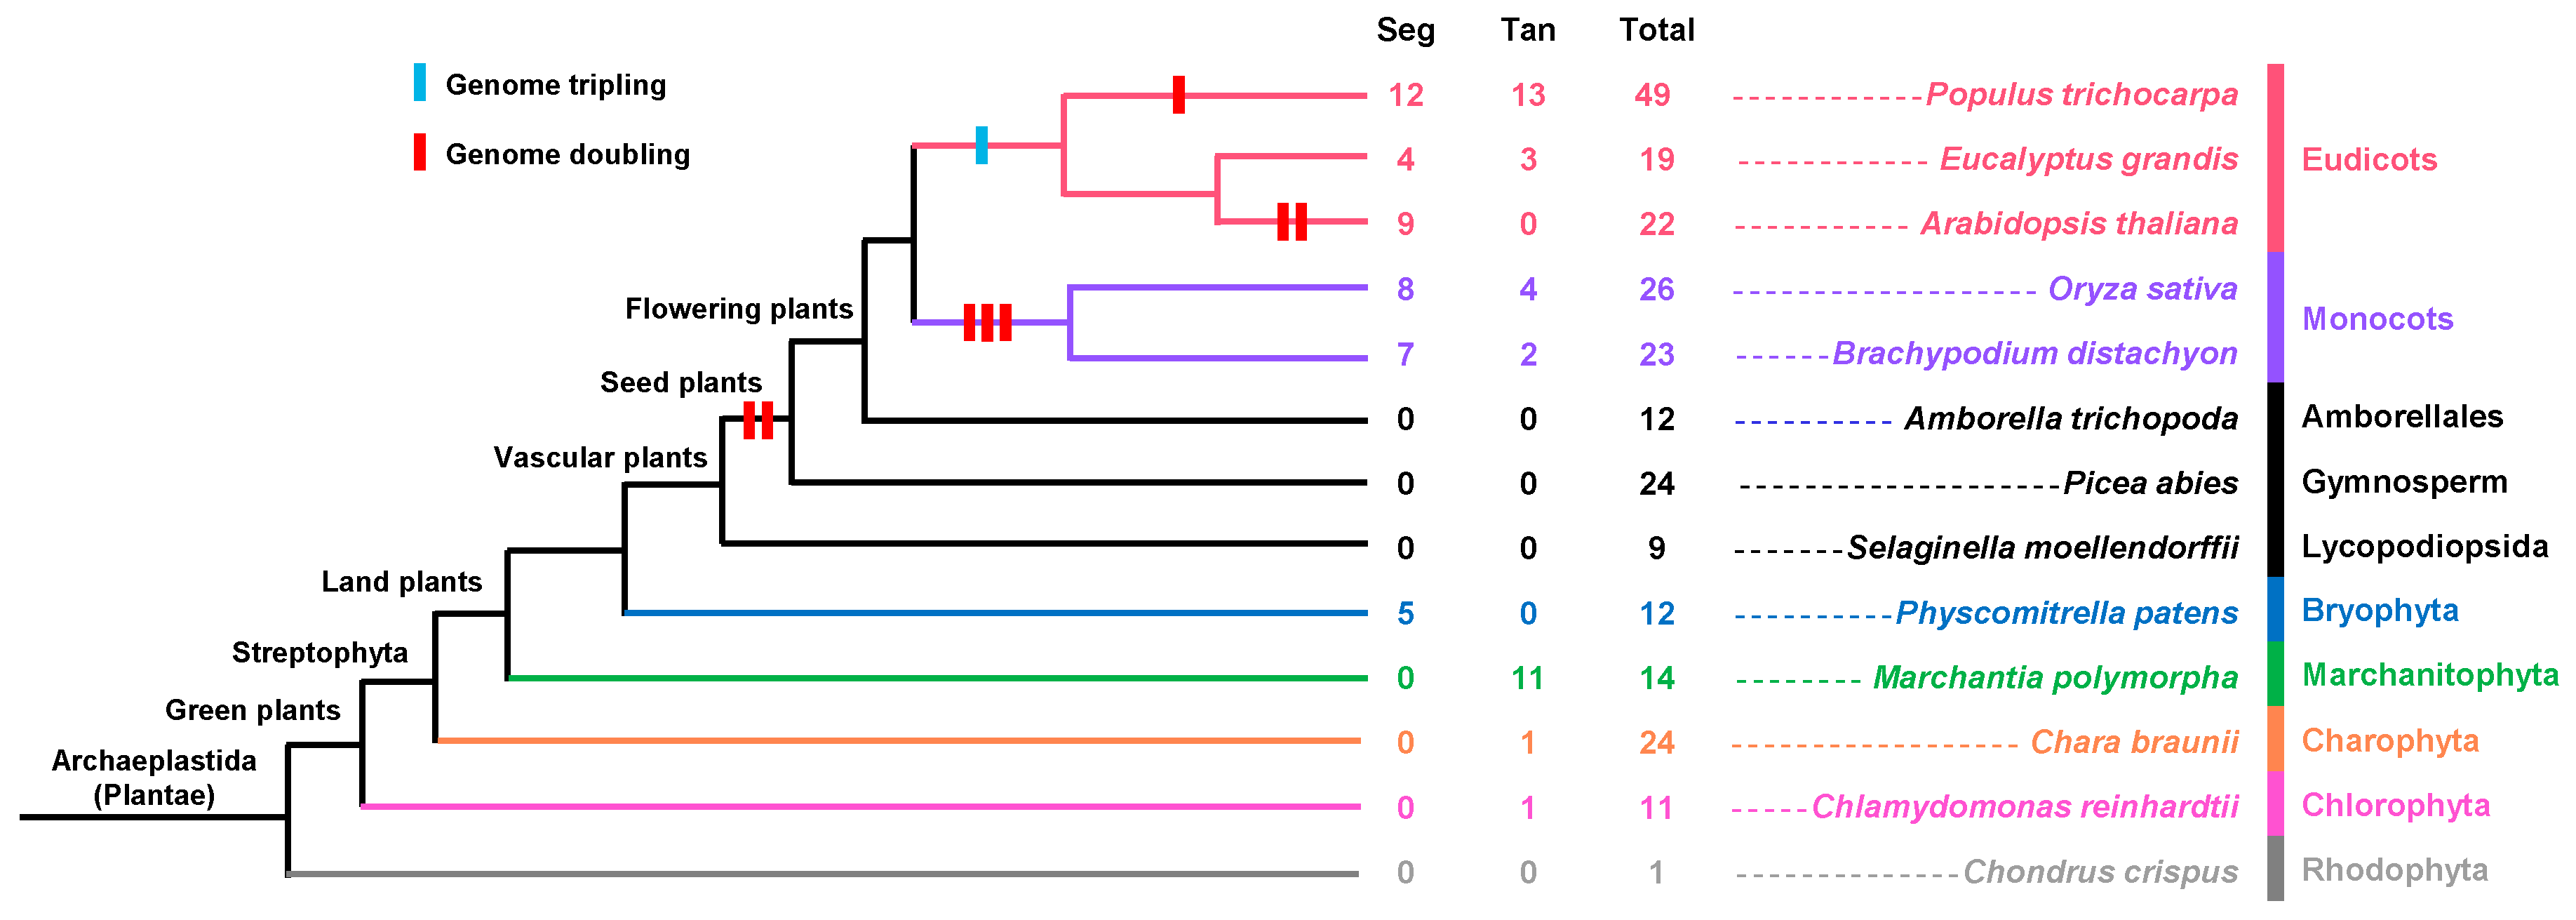
2.4. Analysis of FLA Duplication Patterns during the Process of Evolution

The evolution of genomes and genetic systems is mainly driven by gene duplications [62]. The three elementary gene expansion patterns are tandem duplication, segmental duplication, and transposition events [63,64]. In the plant kingdom, tandem duplication and segmental duplication are the main processes of gene family expansion compared with transposition events [65,66]. We investigated these two duplication events to understand the FLA genes’ expansion patterns in the plant kingdom. The paralogous genes that exist in the same chromosome within a 50 kb physical distance are examples of tandem duplication [65]. First, in order to find the chromosomal locations, the annotation information for the FLA genes was downloaded from OrcAE (available online: https://bioinformatics.psb.ugent.be/orcae/overview/Chbra), Phytozome (available online: https://phytozome.jgi.doe.gov/pz/portal.html) and ConGenIE (available online: http://congenie.org/). Then, the distances between FLA genes’ locations were compared in the same chromosome. The locus search tool on PGDD (available online: http://chibba.agtec.uga.edu/duplication/index/locus) and MCSCAN were used to find the segmental duplications (Table S2). The duplications in FLA genes were related to whole-genome duplication events (Figure 6). The higher plants exhibited more duplications than lower plants. P. trichocarpa had the highest number of duplicated FLA genes, which made it have more FLA genes than other plant species. Although most duplicated pairs shared the same structure type, some duplicated genes had different structure types. For example, in C. reinhardtii, Cre16.g687742 containing two fasciclin domains and Cre16.g687854 containing single fasciclin domain most probably result from tandem duplication. It seemed that some FLA genes with single fasciclin domain evolved from FLA genes with two fasciclin domains. FLAs with single fasciclin domain evolved from FLAs with multiple fasciclin domains, and the number of fasciclin domains was reduced in evolutionary history.
In order to understand the evolution processes of the FLA gene family in the plant kingdom, duplicated gene pairs among FLAs were used to estimate the molecular evolutionary rates by calculating their Ka/Ks value (Table S2). The Ka/Ks values of all the duplicated gene pairs except the Mapoly0075s0013.1/Mapoly0075s0013.2 gene pair were lower than 1. It was assumed that FLA duplicated gene pairs evolved under purifying selection, indicating that the functions of the FLAs gene family were crucial to plant development and functional mutations in FLA genes might have negative impacts on plants. The Ka/Ks ratio of Mapoly0075s0013.1/Mapoly0075s0013.2 gene pair was 2.3512, showing that this gene pair underwent positive selection pressure during evolution. However, plants could not escape from their environment in order to adapt to changes, so positive selection, which could lead to beneficial functional changes, was also important during plant evolution [67]. The Mapoly0075s0013.1/Mapoly0075s0013.2 gene pair, which was found to experience positive selection, might have improved the adaptation of the plant to new environments.

3. Materials and Methods

3.1. Bioinformatics Identification of FLAs

Multiple searches were carried out in order to identify FLA genes in 13 plant species (C. crispus, C. reinhardtii, C. crispus, M. polymorpha, P. patens, S. moellendorffii, P. abies, A. trichopoda, B. distachyon, O. sativa, A. thaliana, E. grandis, and P. trichocarpa) [31,32,33,34,35,36,37,38,39,40,41,42,43]. The predicted proteomes of C. crispus was downloaded from NCBI, that of C. braunii were from the OrcAE website (available online: https://bioinformatics.psb.ugent.be/orcae/overview/Chbra), that of P. abies were from the ConGenIE website (available online: http://congenie.org/), and that of other species from the Phytozome website (Version 12; available online: https://phytozome.jgi.doe.gov/pz/portal.html). Except for P. abies [35], the statistics of genome size overall number of predicted genes were from the NCBI Genome database (available online: https://www.ncbi.nlm.nih.gov/genome).
Then, the Hidden Markov Model (HMM) profile built for fasciclin domains was downloaded from Pfam (available online: http://pfam.xfam.org/family/PF02469) [68], and HMMER 3.0 [69] was used to search proteins with fasciclin domains from the selected plants. Then the presence of fasciclin domains corresponding to the obtained proteins was examined by the NCBI conserved domain database (available online: http://www.ncbi.nlm.nih.gov/cdd). Next, the Finding-AGP program [7] was used to identify AGP regions from proteins with fasciclin domains. Finally, proteins with both fasciclin domains and AGP regions were identified as FLAs. Also, the omitted FLA sequences that were identified in former studies (AT5G40940, AT5G06920, Eucgr.A01741, Potri.013G152200, Potri.001G440800, and Potri.005G079500) were used as queries to perform BLAST searches with a −3 expect (E) threshold to find FLAs that could not be identified by HMMER 3.0.
Moreover, most FLAs have a predicted signal peptide and GPI-anchor. Therefore, SignalP 4.1 Server (available online: http://www.cbs.dtu.dk/services/SignalP/) was used to predict signal peptides [70] and big-PI Plant Predictor (available online: http://mendel.imp.ac.at/gpi/plant_server.html) was used to predict GPI modification sites [71]. The intron of red algae FLA was detected by the GSDS website (available online: http://gsds.cbi.pku.edu.cn/) [44], and the intron of other FLAs were found from the OrcAE website (available online: https://bioinformatics.psb.ugent.be/orcae/overview/Chbra), the Phytozome website (Version 12; available online: https://phytozome.jgi.doe.gov/pz/portal.html), and the ConGenIE website (available online: http://congenie.org/). The amino acid sequences and the presence of AGP regions, signal peptides, fasciclin domains, and GPI-anchor signals are given in Table S1.

3.2. Multiple Sequence Alignment and Phylogenetic Analysis

All of the FLA protein sequences were searched against each other by BLAST+ with a −5 expect (E) threshold [45]. The sequences with low similarity were removed. Then, signal peptides and GPI modification sites were removed from filtered FLA sequences. These sequences were aligned by Clustal Omega 1.2.2 with HMM of the fasciclin domain as a guide in the alignment [46,47]. The fasciclin domains were designated as Type 1 and Type 2 and were also aligned by Clustal Omega 1.2.2 with the HMM of the fasciclin domain as a guide in the alignment [46,47]. GeneDoc [72] was used to display multiple sequence alignments.
The reliability of alignment results was tested by computing overall mean distance with the P-distance method by Mega 7 [49,51]. The alignments of Type 1, Type 2, and FLAs with a single fasciclin domain was then used to build phylogenetic trees with the Maximum Likelihood (ML) method. The best models for ML trees were found by Mega 7 [51,73]. Then, ML trees were built under the best model with 85% partial deletion by Mega 7. Bootstrap analyses with 1, 000 replicates were performed for support estimation [51,52].

3.3. Motif Prediction

In order to identify the conserved domains and motifs of Type 1 and Type 2 fasciclin domains, MEME web server (available online: http://meme-suite.org/tools/meme) [53] was used to identify the conserved motifs (H1 and H2 regions, YH motif). The following parameters were used when running the MEME: (1) The motif sites in sequences were distributed by 0 or 1 occurrence per sequence; (2) the maximum of motifs was set to be 10 for the H1 and H2 regions, and 3 for the YH motif; and (3) a 0-order model of sequences was used as the background model.

3.4. Gene Duplication and Molecular Evolution

The annotation information of the FLA genes on the phytozome website (available online: https://phytozome.jgi.doe.gov/pz/portal.html), the OrcAE website (available online: https://bioinformatics.psb.ugent.be/orcae/overview/Chbra), and the ConGenIE website (available online: http://congenie.org/) was used to find the chromosomal locations. The paralogous genes that exit in the same chromosome within a 50-kb physical distance was defined as tandem duplication [64]. The segmental duplications of 10 plants (C. reinhardtii, P. patens, S. moellendorffii, P. abies, A. trichopoda, B. distachyon, O. sativa, A. thaliana, E. grandis, and P. trichocarpa) were found by the PGDD locus search tool (available online: http://chibba.agtec.uga.edu/duplication/index/locus). Because M. polymorpha and C. crispus data were absent in PGDD, Multiple Collinearity Scan (MCSCAN) [74,75,76,77] was used to find the segmental duplications in M. polymorpha.
To calculate the molecular evolutionary rates between FLAs duplicated gene pairs, pairwise alignment was performed among these gene pairs by ClustalW (codons) in MEGA7 [51]. Then, the MYN (Modified YN) model in KaKs_Calculator 2.0 was used to estimate the nonsynonymous substitution rate (Ka), the synonymous substitution rate (Ks) and the Ka/Ks value of these duplicated gene pairs [78].

4. Conclusions

FLAs play an important role in plant development and adaption to the environment. Two hundred forty-six FLA genes in 13 plant species were identified in this study. It was found that FLAs first appeared in algae. Based on the sequence similarity and phylogenetic analysis, FLAs could be classified into seven groups: Group A, Group B, Group C, Group D1, Group D2, Group E, and Group F. Group E FLAs were the earliest to appear in evolutionary history and disappeared in seed plants, while Group A FLAs were the latest and only existed in seed plants. FLAs with multiple fasciclin domain (>2) were possibly the first FLA type to appear in Archaeplastida because they only existed in algae. FLAs with single fasciclin domain and with two fasciclin domains were dominant in green plants. The number of fasciclin domains in FLAs varied in green algae and was reduced to one or two in land plants. In addition, introns in FLA genes were lost during plant evolution, especially from green algae to land plants. Moreover, tandem and segmental duplications contributed to the expansion of the FLA gene family, and duplicated gene pairs in FLAs mainly evolved under purifying selection.

Supplementary Materials

Supplementary materials can be found at https://www.mdpi.com/1422-0067/20/8/1945/s1.

Author Contributions

H.M. conceived of and designed the research plans; J.H. and H.Z. performed most of the experiments and analyzed the data; Z.C., Y.K., and J.L. provided technical assistance to J.H. and H.Z.; J.H. and H.Z. wrote the article with contributions from all the authors; H.M. supervised and supported the writing.

Acknowledgments

This research was supported by the National Natural Science Foundation of China (31500212), the Natural Science Foundation of Shaanxi Province (2015JQ3090), and the Undergraduate Innovation Foundation of Northwest A&F University (No. 1201710712099).

Conflicts of Interest

The authors declare no conflict of interest.

Abbreviations

FLAFasciclin-like arabinogalactan protein
AGPArabinogalactan protein
GPIGlycosylphosphatidylinositol
PAST%The percentage of Pro, Ala, Ser, and Thr residues in a protein amino-acid sequence
CcrChondrus crispus
CreChlamydomonas reinhardtii
MpoMarchantia polymorpha
SmoSelaginella moellendorffii
PabPicea abies
AtrAmborella trichopoda
EgrEucalyptus grandis
PtPopulus trichocarpa
BdiBrachypodium distachyon
OsOryza sativa
KaNonsynonymous substitution rate
KsSynonymous substitution rate
PGDDPlant Genome Duplication Database
NCBINational Center for Biotechnology Information
ConGenIEConifer Genome Integrative Explorer
HMMHidden Markov Model
BLASTPProtein Basic Local Alignment Search Tool
MYNModified Yang-Nielsen Algorithm
MCSCANMultiple Collinearity Scan
MEMEMultiple Expectation maximization for Motif Elicitation
LGLe_Gascuel_2008 model
GGamma distribution
IEvolutionarily invariable
GSDSGene Structure Display Server
OrcAEOnline Resource for Community Annotation of Eukaryotes

References

  1. Nothnagel, E.A. Proteoglycans and related components in plant cells. Int. Rev. Cytol. 1997, 174, 195–291. [Google Scholar] [PubMed]
  2. Chivasa, S.; Ndimba, B.K.; Simon, W.J.; Robertson, D.; Yu, X.L.; Knox, J.P.; Bolwell, P.; Slabas, A.R. Proteomic analysis of the Arabidopsis thaliana cell wall. Electrophoresis 2002, 23, 1754–1765. [Google Scholar] [CrossRef]
  3. Johnson, K.L.; Cassin, A.M.; Lonsdale, A.; Wong, G.K.-S.; Soltis, D.E.; Miles, N.W.; Melkonian, M.; Melkonian, B.; Deyholos, M.K.; Leebens-Mack, J.; et al. Insights into the Evolution of Hydroxyproline-rich Glycoproteins from 1000 plant Transcriptomes. Plant Physiol. 2017, 174, 904–921. [Google Scholar] [CrossRef]
  4. Jamet, E.; Albenne, C.; Boudart, G.; Irshad, M.; Canut, H.; Pont-Lezica, R. Recent advances in plant cell wall proteomics. Proteomics 2008, 8, 893–908. [Google Scholar] [CrossRef] [PubMed]
  5. Nothnagel, E.A.; Bacic, A.; Clarke, A.E. Cell and Developmental Biology of Arabinogalactan-Proteins; Springer Science Business Media: New York, NY, USA, 2000. [Google Scholar]
  6. Showalter, A.M. Arabinogalactan-proteins: Structure, expression and function. Cell. Mol. Life Sci. 2001, 58, 1399–1417. [Google Scholar] [CrossRef]
  7. Ma, Y.; Yan, C.; Li, H.; Wu, W.; Liu, Y.; Wang, Y.; Chen, Q.; Ma, H. Bioinformatics Prediction and Evolution Analysis of Arabinogalactan Proteins in the Plant Kingdom. Front. Plant Sci. 2017, 8, 66. [Google Scholar] [CrossRef]
  8. Ellis, M.; Egelund, J.; Schultz, C.J.; Bacic, A. Arabinogalactan-proteins: Key Regulators at the Cell Surface? Plant Physiol. 2010, 153, 403–419. [Google Scholar] [CrossRef]
  9. Shpak, E.; Barbar, E.; Leykam, J.F.; Kieliszewski, M.J. Contiguous Hydroxyproline Residues Direct Hydroxyproline Arabinosylation in Nicotiana tabacum. J. Biol. Chem. 2001, 276, 11272–11278. [Google Scholar] [CrossRef] [PubMed]
  10. Showalter, A.M.; Basu, D. Extensin and Arabinogalactan-Protein Biosynthesis: Glycosyltransferases, Research Challenges, and Biosensors. Front. Plant Sci 2016, 7, 814. [Google Scholar] [CrossRef] [PubMed]
  11. Johnson, K.L.; Jones, B.J.; Bacic, A.; Schultz, C.J. The fasciclin-like arabinogalactan proteins of Arabidopsis. A multigene family of putative cell adhesion molecules. Plant Physiol. 2003, 133, 1911–1925. [Google Scholar] [CrossRef] [PubMed]
  12. Ma, H.; Zhao, J. Genome-wide identification, classification, and expression analysis of the arabinogalactan protein gene family in rice (Oryza sativa L.). J. Exp. Bot. 2010, 61, 2647–2668. [Google Scholar] [CrossRef]
  13. MacMillan, C.P.; Taylor, L.; Bi, Y.; Southerton, S.G.; Evans, R.; Spokevicius, A. The fasciclin-like arabinogalactan protein family of Eucalyptus grandis contains members that impact wood biology and biomechanics. New Phytol. 2015, 206, 1314–1327. [Google Scholar] [CrossRef] [PubMed]
  14. Mashiguchi, K.; Asami, T.; Suzuki, Y. Genome-wide identification, structure and expression studies, and mutant collection of 22 early nodulin-like protein genes in Arabidopsis. Biosci. Biotechnol. Biochem. 2009, 73, 2452–2459. [Google Scholar] [CrossRef]
  15. Ma, H.; Zhao, H.; Liu, Z.; Zhao, J. The phytocyanin gene family in rice (Oryza sativa L.): genome-wide identification, classification and transcriptional analysis. PLoS ONE 2011, 6, e25184. [Google Scholar] [CrossRef]
  16. Motose, H.; Sugiyama, M.; Fukuda, H. A proteoglycan mediates inductive interaction during plant vascular development. Nature 2004, 429, 873–878. [Google Scholar] [CrossRef] [PubMed]
  17. Kobayashi, Y.; Motose, H.; Iwamoto, K.; Fukuda, H. Expression and genome-wide analysis of the xylogen-type gene family. Plant Cell Physiol. 2011, 52, 1095–1106. [Google Scholar] [CrossRef] [PubMed]
  18. Seifert, G.J. Fascinating Fasciclins: A Surprisingly Widespread Family of Proteins that Mediate Interactions between the Cell Exterior and the Cell Surface. Int. J. Mol. Sci. 2018, 19, 1628. [Google Scholar] [CrossRef]
  19. Bastiani, M.J.; Harrelson, A.L.; Snow, P.M.; Goodman, C.S. Expression of fasciclin I and II glycoproteins on subsets of axon pathways during neuronal development in the grasshopper. Cell 1987, 48, 745–755. [Google Scholar] [CrossRef]
  20. Elkins, T.; Zinn, K.; McAllister, L.; Hoffmann, F.M.; Goodman, C.S. Genetic analysis of a Drosophila neural cell adhesion molecule: interaction of fasciclin I and Abelson tyrosine kinase mutations. Cell 1990, 60, 565–575. [Google Scholar] [CrossRef]
  21. Schultz, C.J.; Rumsewicz, M.P.; Johnson, K.L.; Jones, B.J.; Gaspar, Y.M.; Bacic, A. Using Genomic Resources to Guide Research Directions. The Arabinogalactan Protein Gene Family as a Test Case. Plant Physiol. 2002, 129, 1448–1463. [Google Scholar] [CrossRef]
  22. Faik, A.; Abouzouhair, J.; Sarhan, F. Putative fasciclin-like arabinogalactan-proteins (FLA) in wheat (Triticum aestivum) and rice (Oryza sativa): identification and bioinformatic analyses. Mol. Genet. Genom. 2006, 276, 478–494. [Google Scholar] [CrossRef]
  23. Lafarguette, F.; Leplé, J.C.; Déjardin, A.; Laurans, F.; Costa, G.; Lesage-Descauses, M.C.; Pilate, G. Poplar genes encoding fasciclin-like arabinogalactan proteins are highly expressed in tension wood. New Phyto. 2004, 164, 107–121. [Google Scholar] [CrossRef] [Green Version]
  24. Showalter, A.M.; Keppler, B.D.; Liu, X.; Lichtenberg, J.; Welch, L.R. Bioinformatic Identification and Analysis of Hydroxyproline-Rich Glycoproteins in Populus trichocarpa. Bmc Plant Biol. 2016, 16, 229. [Google Scholar] [CrossRef] [PubMed]
  25. Dahiya, P.; Findlay, K.; Roberts, K.; McCann, M.C. A fasciclin-domain containing gene, ZeFLA11, is expressed exclusively in xylem elements that have reticulate wall thickenings in the stem vascular system of Zinnia elegans cv Envy. Planta 2006, 223, 1281–1291. [Google Scholar] [CrossRef] [PubMed]
  26. Huang, G.Q.; Xu, W.L.; Gong, S.Y.; Li, B.; Wang, X.L.; Xu, D.; Li, X.B. Characterization of 19 novel cotton FLA genes and their expression profiling in fiber development and in response to phytohormones and salt stress. Physiol. Plant 2008, 134, 348–359. [Google Scholar] [CrossRef] [PubMed]
  27. Liu, H.; Shi, R.; Wang, X.; Pan, Y.; Li, Z.; Yang, X.; Zhang, G.; Ma, Z. Characterization and expression analysis of a fiber differentially expressed Fasciclin-like arabinogalactan protein gene in sea island cotton fibers. PLoS ONE 2013, 8, e70185. [Google Scholar] [CrossRef]
  28. Jun, L.; Xiaoming, W. Genome-wide identification, classification and expression analysis of genes encoding putative fasciclin-like arabinogalactan proteins in Chinese cabbage (Brassica rapa L.). Mol. Biol. Rep. 2012, 39, 10541–10555. [Google Scholar] [CrossRef]
  29. Guerriero, G.; Mangeot-Peter, L.; Legay, S.; Behr, M.; Lutts, S.; Siddiqui, K.S.; Hausman, J.F. Identification of fasciclin-like arabinogalactan proteins in textile hemp (Cannabis sativa L.): in silico analyses and gene expression patterns in different tissues. Bmc Genom. 2017, 18, 741. [Google Scholar] [CrossRef]
  30. MacMillan, C.P.; Mansfield, S.D.; Stachurski, Z.H.; Evans, R.; Southerton, S.G. Fasciclin-like arabinogalactan proteins: specialization for stem biomechanics and cell wall architecture in Arabidopsis and Eucalyptus. Plant J. 2010, 62, 689–703. [Google Scholar] [CrossRef] [PubMed]
  31. Collen, J.; Porcel, B.; Carre, W.; Ball, S.G.; Chaparro, C.; Tonon, T.; Barbeyron, T.; Michel, G.; Noel, B.; Valentin, K.; et al. Genome structure and metabolic features in the red seaweed Chondrus crispus shed light on evolution of the Archaeplastida. Proc. Natl. Acad. Sci. USA 2013, 110, 5247–5252. [Google Scholar] [CrossRef] [PubMed]
  32. Bowman, J.L.; Kohchi, T.; Yamato, K.T.; Jenkins, J.; Shu, S.; Ishizaki, K.; Yamaoka, S.; Nishihama, R.; Nakamura, Y.; Berger, F.; et al. Insights into Land Plant Evolution Garnered from the Marchantia polymorpha Genome. Cell 2017, 171, 287–304. [Google Scholar] [CrossRef] [PubMed]
  33. Lang, D.; Ullrich, K.K.; Murat, F.; Fuchs, J.; Jenkins, J.; Haas, F.B.; Piednoel, M.; Gundlach, H.; Van Bel, M.; Meyberg, R.; et al. The Physcomitrella patens chromosome-scale assembly reveals moss genome structure and evolution. Plant J. 2018, 93, 515–533. [Google Scholar] [CrossRef] [PubMed]
  34. Banks, J.A.; Nishiyama, T.; Hasebe, M.; Bowman, J.L.; Gribskov, M.; dePamphilis, C.; Albert, V.A.; Aono, N.; Aoyama, T.; Ambrose, B.A.; et al. The Selaginella Genome Identifies Genetic Changes Associated with the Evolution of Vascular Plants. Science 2011, 332, 960–963. [Google Scholar] [CrossRef] [PubMed] [Green Version]
  35. Nystedt, B.; Street, N.R.; Wetterbom, A.; Zuccolo, A.; Lin, Y.-C.; Scofield, D.G.; Vezzi, F.; Delhomme, N.; Giacomello, S.; Alexeyenko, A.; et al. The Norway spruce genome sequence and conifer genome evolution. Nature 2013, 497, 579–584. [Google Scholar] [CrossRef] [PubMed] [Green Version]
  36. Ambrella Genome Project. The Amborella Genome and the Evolution of Flowering Plants. Science 2013, 342, 1241089. [Google Scholar] [CrossRef] [PubMed]
  37. The International Brachypodium Initiative. Genome sequencing and analysis of the model grass Brachypodium distachyon. Nature 2010, 463, 763–768. [Google Scholar] [CrossRef]
  38. Ouyang, S.; Zhu, W.; Hamilton, J.; Lin, H.; Campbell, M.; Childs, K.; Thibaud-Nissen, F.; Malek, R.L.; Lee, Y.; Zheng, L.; et al. The TIGR rice Genome Annotation Resource: improvements and new features. Nucleic Acids Res. 2007, 35, D883–D887. [Google Scholar] [CrossRef]
  39. Merchant, S.S.; Prochnik, S.E.; Vallon, O.; Harris, E.H.; Karpowicz, S.J.; Witman, G.B.; Terry, A.; Salamov, A.; Fritz-Laylin, L.K.; Marechal-Drouard, L.; et al. The Chlamydomonas Genome Reveals the Evolution of Key Animal and Plant Functions. Science 2007, 318, 245–250. [Google Scholar] [CrossRef] [PubMed]
  40. Lamesch, P.; Berardini, T.Z.; Li, D.; Swarbreck, D.; Wilks, C.; Sasidharan, R.; Muller, R.; Dreher, K.; Alexander, D.L.; Garcia-Hernandez, M.; et al. The Arabidopsis Information Resource (TAIR): improved gene annotation and new tools. Nucleic Acids Res. 2012, 40, D1202–D1210. [Google Scholar] [CrossRef]
  41. Myburg, A.A.; Grattapaglia, D.; Tuskan, G.A.; Hellsten, U.; Hayes, R.D.; Grimwood, J.; Jenkins, J.; Lindquist, E.; Tice, H.; Bauer, D.; et al. The genome of Eucalyptus grandis. Nature 2014, 510, 356–362. [Google Scholar] [CrossRef]
  42. Tuskan, G.A.; Difazio, S.; Jansson, S.; Bohlmann, J.; Grigoriev, I.; Hellsten, U.; Putnam, N.; Ralph, S.; Rombauts, S.; Salamov, A.; et al. The Genome of Black Cottonwood, Populus trichocarpa (Torr. & Gray). Science 2006, 313, 1596–1604. [Google Scholar]
  43. Nishiyama, T.; Sakayama, H.; de Vries, J.; Buschmann, H.; Saint-Marcoux, D.; Ullrich, K.K.; Haas, F.B.; Vanderstraeten, L.; Becker, D.; Lang, D.; et al. The Chara Genome: Secondary Complexity and Implications for Plant Terrestrialization. Cell 2018, 174, 448–464. [Google Scholar] [CrossRef]
  44. Hu, B.; Jin, J.; Guo, A.-Y.; Zhang, H.; Luo, J.; Gao, G. GSDS 2.0: an upgraded gene feature visualization server. Bioinformatics 2015, 31, 1296–1297. [Google Scholar] [CrossRef]
  45. Camacho, C.; Coulouris, G.; Avagyan, V.; Ma, N.; Papadopoulos, J.; Bealer, K.; Madden, T.L. BLAST+: architecture and applications. Bmc Bioinform. 2009, 10, 421. [Google Scholar] [CrossRef] [PubMed]
  46. Sievers, F.; Wilm, A.; Dineen, D.; Gibson, T.J.; Karplus, K.; Li, W.; Lopez, R.; McWilliam, H.; Remmert, M.; Soding, J.; et al. Fast, scalable generation of high-quality protein multiple sequence alignments using Clustal Omega. Mol. Syst. Biol. 2011, 7, 539. [Google Scholar] [CrossRef]
  47. Sievers, F.; Higgins, D.G. Clustal Omega for making accurate alignments of many protein sequences. Protein Sci. 2018, 27, 135–145. [Google Scholar] [CrossRef]
  48. Thompson, J.D.; Plewniak, F.; Poch, O. A comprehensive comparison of multiple sequence alignment programs. Nucleic Acids Res. 1999, 27, 2682–2690. [Google Scholar] [CrossRef] [PubMed] [Green Version]
  49. Hall, B.G. Phylogenetic Trees Made Easy: A How-To Manual, 4th ed.; Oxford University Press: Cary, NC, USA, 2011. [Google Scholar]
  50. Ogden, T.H.; Rosenberg, M.S. Multiple Sequence Alignment Accuracy and Phylogenetic Inference. Syst. Biol. 2006, 55, 314–328. [Google Scholar] [CrossRef] [PubMed] [Green Version]
  51. Kumar, S.; Stecher, G.; Tamura, K. MEGA7: Molecular Evolutionary Genetics Analysis Version 7.0 for Bigger Datasets. Mol. Biol. Evol. 2016, 33, 1870–1874. [Google Scholar] [CrossRef]
  52. Le, S.Q.; Gascuel, O. An Improved General Amino Acid Replacement Matrix. Mol. Biol. Evol. 2008, 25, 1307–1320. [Google Scholar] [CrossRef] [Green Version]
  53. Bailey, T.L.; Elkan, C. Fitting a mixture model by expectation maximization to discover motifs in biopolymers. Proc. Int. Conf. Intell. Syst. Mol. Biol. 1994, 2, 28–36. [Google Scholar] [PubMed]
  54. Klepikova, A.V.; Logacheva, M.D.; Dmitriev, S.E.; Penin, A.A. RNA-seq analysis of an apical meristem time series reveals a critical point in Arabidopsis thaliana flower initiation. Bmc Genom. 2015, 16, 466. [Google Scholar] [CrossRef] [PubMed]
  55. Klepikova, A.V.; Kasianov, A.S.; Gerasimov, E.S.; Logacheva, M.D.; Penin, A.A. A high resolution map of the Arabidopsis thaliana developmental transcriptome based on RNA-seq profiling. Plant J. 2016, 88, 1058–1070. [Google Scholar] [CrossRef]
  56. Li, J.; Yu, M.; Geng, L.L.; Zhao, J. The fasciclin-like arabinogalactan protein gene, FLA3, is involved in microspore development of Arabidopsis. Plant J. 2010, 64, 482–497. [Google Scholar] [CrossRef] [PubMed]
  57. Basu, D.; Tian, L.; Debrosse, T.; Poirier, E.; Emch, K.; Herock, H.; Travers, A.; Showalter, A.M. Glycosylation of a Fasciclin-Like Arabinogalactan-Protein (SOS5) Mediates Root Growth and Seed Mucilage Adherence Via a Cell Wall Receptor-Like Kinase (FEI1/FEI2) Pathway in Arabidopsis. PLoS ONE 2016, 11, e0145092. [Google Scholar] [CrossRef]
  58. Johnson, K.L.; Kibble, N.A.; Bacic, A.; Schultz, C.J. A Fasciclin-Like Arabinogalactan-Protein (FLA) Mutant of Arabidopsis thaliana, FLA1, Shows Defects in Shoot Regeneration. PLoS ONE 2011, 6, e25154. [Google Scholar] [CrossRef]
  59. Cagnola, J.I.; Dumont de Chassart, G.J.; Ibarra, S.E.; Chimenti, C.; Ricardi, M.M.; Delzer, B.; Ghiglione, H.; Zhu, T.; Otegui, M.E.; Estevez, J.M.; et al. Reduced expression of selected FASCICLIN-LIKE ARABINOGALACTAN PROTEIN genes associates with the abortion of kernels in field crops of Zea mays (maize) and of Arabidopsis seeds. Plant Cell Env. 2018, 41, 661–674. [Google Scholar] [CrossRef] [PubMed]
  60. Turupcu, A.; Almohamed, W.; Oostenbrink, C.; Seifert, G.J. A speculation on the tandem fasciclin 1 repeat of FLA4 proteins in angiosperms. Plant Signal. Behav. 2018, 13, e1507403. [Google Scholar] [CrossRef]
  61. Xue, H.; Veit, C.; Abas, L.; Tryfona, T.; Maresch, D.; Ricardi, M.M.; Estevez, J.M.; Strasser, R.; Seifert, G.J. Arabidopsis thaliana FLA4 functions as a glycan-stabilized soluble factor via its carboxy-proximal fasciclin 1 domain. Plant J. 2017, 91, 613–630. [Google Scholar] [CrossRef]
  62. Moore, R.C.; Purugganan, M.D. The early stages of duplicate gene evolution. Proc. Natl. Acad. Sci. USA 2003, 100, 15682–15687. [Google Scholar] [CrossRef] [PubMed] [Green Version]
  63. Cao, J.; Li, X. Identification and phylogenetic analysis of late embryogenesis abundant proteins family in tomato (Solanum lycopersicum). Planta 2015, 241, 757–772. [Google Scholar] [CrossRef]
  64. Kong, H.; Landherr, L.L.; Frohlich, M.W.; Leebens-Mack, J.; Ma, H.; dePamphilis, C.W. Patterns of gene duplication in the plant SKP1 gene family in angiosperms: evidence for multiple mechanisms of rapid gene birth. Plant J. 2007, 50, 873–885. [Google Scholar] [CrossRef] [PubMed]
  65. Cannon, S.B.; Mitra, A.; Baumgarten, A.; Young, N.D.; May, G. The roles of segmental and tandem gene duplication in the evolution of large gene families in Arabidopsis thaliana. Bmc Plant Biol. 2004, 4, 10. [Google Scholar] [CrossRef] [PubMed]
  66. Zhu, Y.; Wu, N.; Song, W.; Yin, G.; Qin, Y.; Yan, Y.; Hu, Y. Soybean (Glycine max) expansin gene superfamily origins: segmental and tandem duplication events followed by divergent selection among subfamilies. Bmc Plant Biol. 2014, 14, 93. [Google Scholar] [CrossRef] [PubMed]
  67. Cao, J.; Li, X.; Lv, Y.; Ding, L. Comparative analysis of the phytocyanin gene family in 10 plant species: A focus on Zea mays. Front. Plant Sci. 2015, 6, 515. [Google Scholar] [CrossRef] [PubMed]
  68. Finn, R.D.; Coggill, P.; Eberhardt, R.Y.; Eddy, S.R.; Mistry, J.; Mitchell, A.L.; Potter, S.C.; Punta, M.; Qureshi, M.; Sangrador-Vegas, A.; et al. The Pfam protein families database: towards a more sustainable future. Nucleic Acids Res. 2016, 44, D279–D285. [Google Scholar] [CrossRef]
  69. Eddy, S.R. Accelerated profile HMM searches. Plos Comput. Biol. 2011, 7, e1002195. [Google Scholar] [CrossRef]
  70. Petersen, T.N.; Brunak, S.; von Heijne, G.; Nielsen, H. SignalP 4.0: discriminating signal peptides from transmembrane regions. Nat. Methods 2011, 8, 785–786. [Google Scholar] [CrossRef] [PubMed]
  71. Eisenhaber, B.; Wildpaner, M.; Schultz, C.J.; Borner, G.H.; Dupree, P.; Eisenhaber, F. Glycosylphosphatidylinositol Lipid Anchoring of Plant Proteins. Sensitive Prediction from Sequence- and Genome-wide Studies for Arabidopsis and Rice. Plant Physiol. 2003, 133, 1691–1701. [Google Scholar] [CrossRef] [PubMed]
  72. Nicholas, K.B.; Nicholas, H.B., Jr.; Deerfield, D.W., II. GeneDoc: Analysis and visualization of genetic variation. Embnew 1997, 4, 1–4. [Google Scholar]
  73. Nei, M.; Kumar, S. Molecular Evolution and Phylogenetics; Oxford University Press: New York, NY, USA, 2000. [Google Scholar]
  74. Lee, T.H.; Tang, H.; Wang, X.; Paterson, A.H. PGDD: a database of gene and genome duplication in plants. Nucleic Acids Res. 2013, 41, D1152–D1158. [Google Scholar] [CrossRef]
  75. Tang, H.; Bowers, J.E.; Wang, X.; Ming, R.; Alam, M.; Paterson, A.H. Synteny and Collinearity in Plant Genomes. Science 2008, 320, 486–488. [Google Scholar] [CrossRef] [PubMed]
  76. Tang, H.; Wang, X.; Bowers, J.E.; Ming, R.; Alam, M.; Paterson, A.H. Unraveling ancient hexaploidy through multiply-aligned angiosperm gene maps. Genome Res. 2008, 18, 1944–1954. [Google Scholar] [CrossRef] [PubMed] [Green Version]
  77. Tang, H.; Bowers, J.E.; Wang, X.; Paterson, A.H. Angiosperm genome comparisons reveal early polyploidy in the monocot lineage. Proc. Natl. Acad. Sci. USA 2010, 107, 472–477. [Google Scholar] [CrossRef] [PubMed]
  78. Wang, D.; Zhang, Y.; Zhang, Z.; Zhu, J.; Yu, J. KaKs_Calculator 2.0: A Toolkit Incorporating Gamma-Series Methods and Sliding Window Strategies. Genom. Proteom. Bioinform. 2010, 8, 77–80. [Google Scholar] [CrossRef] [Green Version]
Figure 1. Multiple sequence alignment of representative FLA sequences. Fasciclin domains were divided into two types (Type 1 and Type 2). Residues with high similarity (80%, 60%) were highlighted in dark pink and light pink, respectively.
Ijms 20 01945 g001
Figure 2. Phylogenetic relationships between Type 1 fasciclin domains in plant species. The amino acid sequences of fasciclin domains in FLAs were aligned by Clustal Omega 1.2.2 with the guide of HMM profile of fasciclin domains, and the phylogenetic trees were built by Mega 7 using the Maximum Likelihood (ML) method with 85% partial deletion. Bootstrap analyses with 1,000 replicates were performed for support estimation. The confidence values below 50% were cut off, and the confidence values higher than 70% are shown on nodes. The tree was divided into four major clades: Group B, Group C, Group D1, and Group D2. Plant species from different lineages are shown in different shape. FLAs from A. thaliana are indicated for each clade. The order of fasciclin domains was designated from the N-terminus to the C-teminus (e.g., FLA4.1, FLA4.2, and so on). The conserved motifs (H1, H2, and YH motifs) shown below the tree were found using the MEME web server.
Ijms 20 01945 g002
Figure 3. Phylogenetic relationships between Type 2 fasciclin domains in plant species. The amino acid sequences of fasciclin domains in FLAs were aligned by Clustal Omega 1.2.2 with the guide of HMM profile of fasciclin domains, and the phylogenetic trees were built by Mega 7 using the Maximum Likelihood (ML) method with 85% partial deletion. Bootstrap analyses with 1000 replicates were performed for support estimation. The confidence values below 50% were cut off, and the confidence values higher than 70% are shown on nodes. The tree was divided into six major clades: Group A, Group B, Group C, Group D1, Group D2, and Group E. Plant species from different lineages are shown in different shape. FLAs from A. thaliana are indicated for each clade. The domain closest to the N-terminus is indicated by .1 and the second by .2. The conserved motifs (H1, H2, and YH motifs) shown below the tree were found using the MEME web server.
Ijms 20 01945 g003
Figure 4. Phylogenetic relationships and structure display of FLAs with single fasciclin domain in nine plant species (C. reinhardtii, C. crispus, M. polymorpha, P. patens, S. moellendorffii, P. abies, A. trichopoda, B. distachyon, and A. thaliana). Plant species from different lineages are shown in different shapes. The phylogenetic trees were built by Mega 7 using the Maximum Likelihood (ML) method under LG+G model with 85% partial deletion. Bootstrap analyses with 1000 replicates were performed for support estimation, the confidence values higher than 50% are shown on nodes. The tree was divided into six groups according to the classifications based on two types fasciclin domains (Figure 2 and Figure 3): Group A, Group B, Group C, Group D1, Group D2 and Group E. The structure displays were generated by GSDS 2.0. Black lines represent introns, gray rectangles the CDS regions, red rectangles the AGP regions, blue rectangles the fasciclin domains, green rectangles signal peptides, and yellow wedges GPI-anchor modification sites. The framed FLAs denote functionally characterized FLAs (FLA3, FLA9, FLA11, and FLA12).
Ijms 20 01945 g004
Figure 5. Evolutionary model of the FLA family in plants. The green letters display the appearance of different groups of FLAs. The red letters display the disappearance of Group E and Group F FLAs. The cubes display the number of fasciclin domains in FLAs.
Ijms 20 01945 g005
Figure 6. Duplication events of FLA genes in the plant kingdom. The phylogenetic tree on the left was built based on the Tree of Life Web project (available online: http://www.tolweb.org/Green_plants) and whole-genome duplication events in PGDD (available online: http://chibba.pgml.uga.edu/duplication/index/home). The number next to the tree is the number of FLA genes resulting from segmental duplication, tandem duplication, and total FLA genes in the species. Seg: Segmental duplication (pairs); Tan: Tandem duplication (pairs); Total: Total number of FLA genes in the species.
Ijms 20 01945 g006
Table 1. Information about genome size and fasciclin-like arabinogalactan protein (FLA) gene number in the plants of interest for this study.
LineageOrganismGenome Size (Mb)No. of Predicted GenesNo. of FLA GenesReference
Red algaeChondrus crispus104.9898431This study
Green algaeChlamydomonas reinhardtii120.40514,48811This study
Chara braunii1751.2135,42424This study
LiverwortsMarchantia polymorpha215.73919,28714This study
MossesPhyscomitrella patens472.08123,73312This study
LycophytesSelaginella moellendorffii212.31534,7829This study
GymnospermPicea abies19,60028,35424This study
AmborellalesAmborella trichopoda706.49519,35412This study
EudicotsArabidopsis thaliana119.14838,09322Schultz et al. [21]
Eucalyptus grandis691.4345,22619MacMillan et al. [13]
Populus trichocarpa434.2937,19749Showalter et al. [24]
MonocotsBrachypodium distachyon218.34534,31023This study
Oryza sativa374.42333,18526Ma and Zhao [12]

