Article

4-Mercaptobenzoic Acid Labeled Gold-Silver-Alloy-Embedded Silica Nanoparticles as an Internal Standard Containing Nanostructures for Sensitive Quantitative Thiram Detection

1
Department of Bioscience and Biotechnology, Konkuk University, Seoul 143-701, Korea
2
Department of Chemistry Education, Seoul National University, Seoul 151-742, Korea
*
Author to whom correspondence should be addressed.
Int. J. Mol. Sci. 2019, 20(19), 4841; https://doi.org/10.3390/ijms20194841
Submission received: 12 August 2019 / Revised: 20 September 2019 / Accepted: 26 September 2019 / Published: 29 September 2019
(This article belongs to the Special Issue Silver Nano/Microparticles: Modification and Applications 2.0)

Abstract

:
In this study, SiO2@Au@4-MBA@Ag (4-mercaptobenzoic acid labeled gold-silver-alloy-embedded silica nanoparticles) nanomaterials were investigated for the detection of thiram, a pesticide. First, the presence of Au@4-MBA@Ag alloys on the surface of SiO2 was confirmed by the broad bands of ultraviolet-visible spectra in the range of 320–800 nm. The effect of the 4-MBA (4-mercaptobenzoic acid) concentration on the Ag shell deposition and its intrinsic SERS (surface-enhanced Raman scattering) signal was also studied. Ag shells were well coated on SiO2@Au@4-MBA in the range of 1–1000 µM. The SERS intensity of thiram-incubated SiO2@Au@4-MBA@Ag achieved the highest value by incubation with 500 µL thiram for 30 min, and SERS was measured at 200 µg/mL SiO2@Au@4-MBA@Ag. Finally, the SERS intensity of thiram at 560 cm−1 increased proportionally with the increase in thiram concentration in the range of 240–2400 ppb, with a limit of detection (LOD) of 72 ppb.

1. Introduction

The use of pesticides in modern agriculture has improved crop yield and quality by controlling or destroying pests or weeds [1,2,3,4]. Although pesticides have diverse benefits, they are also a threat to consumer health because they are toxic to humans and other species [5,6]. When pesticides are used for crops or seeds, their traces could remain in the food [7], and these derivatives are considered to be toxic [8]. Further, pesticides are suspected to be carcinogenic and teratogenic compounds [7]. Therefore, the sensitive detection of a small concentration of these fungicides in soils, water, and foods, as well as their chemical state, is important [7].
Various methods have been proposed for monitoring pesticide residues, such as high-performance liquid chromatography (HPLC), gas chromatography-mass spectrometry (GC-MS), thin-layer chromatography, and enzyme-linked immunosorbent assay [9,10,11,12,13]. Currently, HPLC is the most robust and reliable method for food safety analysis. However, HPLC is time-consuming and expensive; requires a harsh solvent, high power source, bulky and sophisticated operation, complicated multi-step pre-treatment process; and could be dedicated in labs to trained personnel [14,15]. Thus, a fast, simple, highly sensitive, and stable method should be developed for the determination of pesticide residue.
Surface-enhanced Raman scattering (SERS) has been developed as a vibrational spectroscopy technique for various applications because of its non-destructive, rapid, molecular fingerprinting, ultrasensitive, and photostable properties [16,17,18,19,20]. Compared with HPLC-MS, SERS does not require harsh solvents and a high power source, and it is easily compatible with other detection systems [21]. As a result, many studies have focused on the use of different nanoparticles (NPs) as substrates for SERS detection of pesticides, such as silver nanostructures [21,22,23,24,25,26], gold nanostructures [27,28,29,30,31], and graphene oxide [32,33]. Although these nanostructures could enhance the SERS signal up to 1014 times, the practical application of SERS exhibits some technical challenges in the fabrication of reproducible, reliable, and robust SERS-active surfaces.
Recently, internal standards have been used to correct variations of SERS intensity in quantitative SERS assays [34,35,36,37]. Among them, the ratiometric SERS indicator-based detection mode of core-shell materials has been successfully developed because it can avoid the competition between the internal standard and the target molecules. However, difficulties in synthesizing an appropriate SERS probe for a specified target limited the application of the ratiometric SERS indicator-based detection mode [37]. Previously, our group reported Au-Ag alloys assembled silica NPs (SiO2@Au@Ag NPs) as a strong and reliable SERS probe with 4-mercaptobenzoic acid (4-MBA) as an internal standard located between the SiO2@Au core and the Ag shell. SiO2@Au@4-MBA@Ag NPs were synthesized by Au seed-mediated Ag growth on the surface of a silica template, followed by incorporating 4-MBA on the surfaces [38,39,40,41]. However, their application for SERS detection has not been completely investigated. In this study, we investigated the application of SiO2@Au@4-MBA@Ag NPs on pesticide detection.

2. Results and Discussion

To prepare SiO2@Au@4-MBA, silica NPs (ca. 150 nm in diameter) were first functionalized with amine groups by 3-aminopropyltriethoxysilane (APTS) to prepare aminated silica NPs, as shown in Figure 1 [42]. Simultaneously, colloidal Au NPs (3 nm) were prepared using tetrakis(hydroxymethyl)phosphonium chloride (THPC) and incubated with the aminated silica NPs by gentle shaking to prepare Au NPs embedded with SiO2 (SiO2@Au NPs), according to the method reported by Pham et al. [38,39,40,41]. Subsequently, 4-MBA was introduced on the surface of SiO2@Au NPs through the strong affinity between thiol groups and Au, and it was used as an internal standard. Finally, the Ag shell was deposited on SiO2@Au@4-MBA to enhance the Raman signal of RLCs by reducing a silver precursor (AgNO3) in the presence of ascorbic acid (AA) and polyvinylpyrrolidone (PVP) as a stabilizer and structure-directing agent under mild reducing conditions [39]. The silver ions reduced by AA were selectively grown onto SiO2@Au@4-MBA cores to form the core-shell SiO2@Au@4-MBA@Ag NPs; this was accompanied by an obvious color change to black. The presence of the Ag shell could also prevent the leakage of 4-MBA from the Au surface and improve the chance of generating numerous hot spots on the silica surface to detect the target molecules.

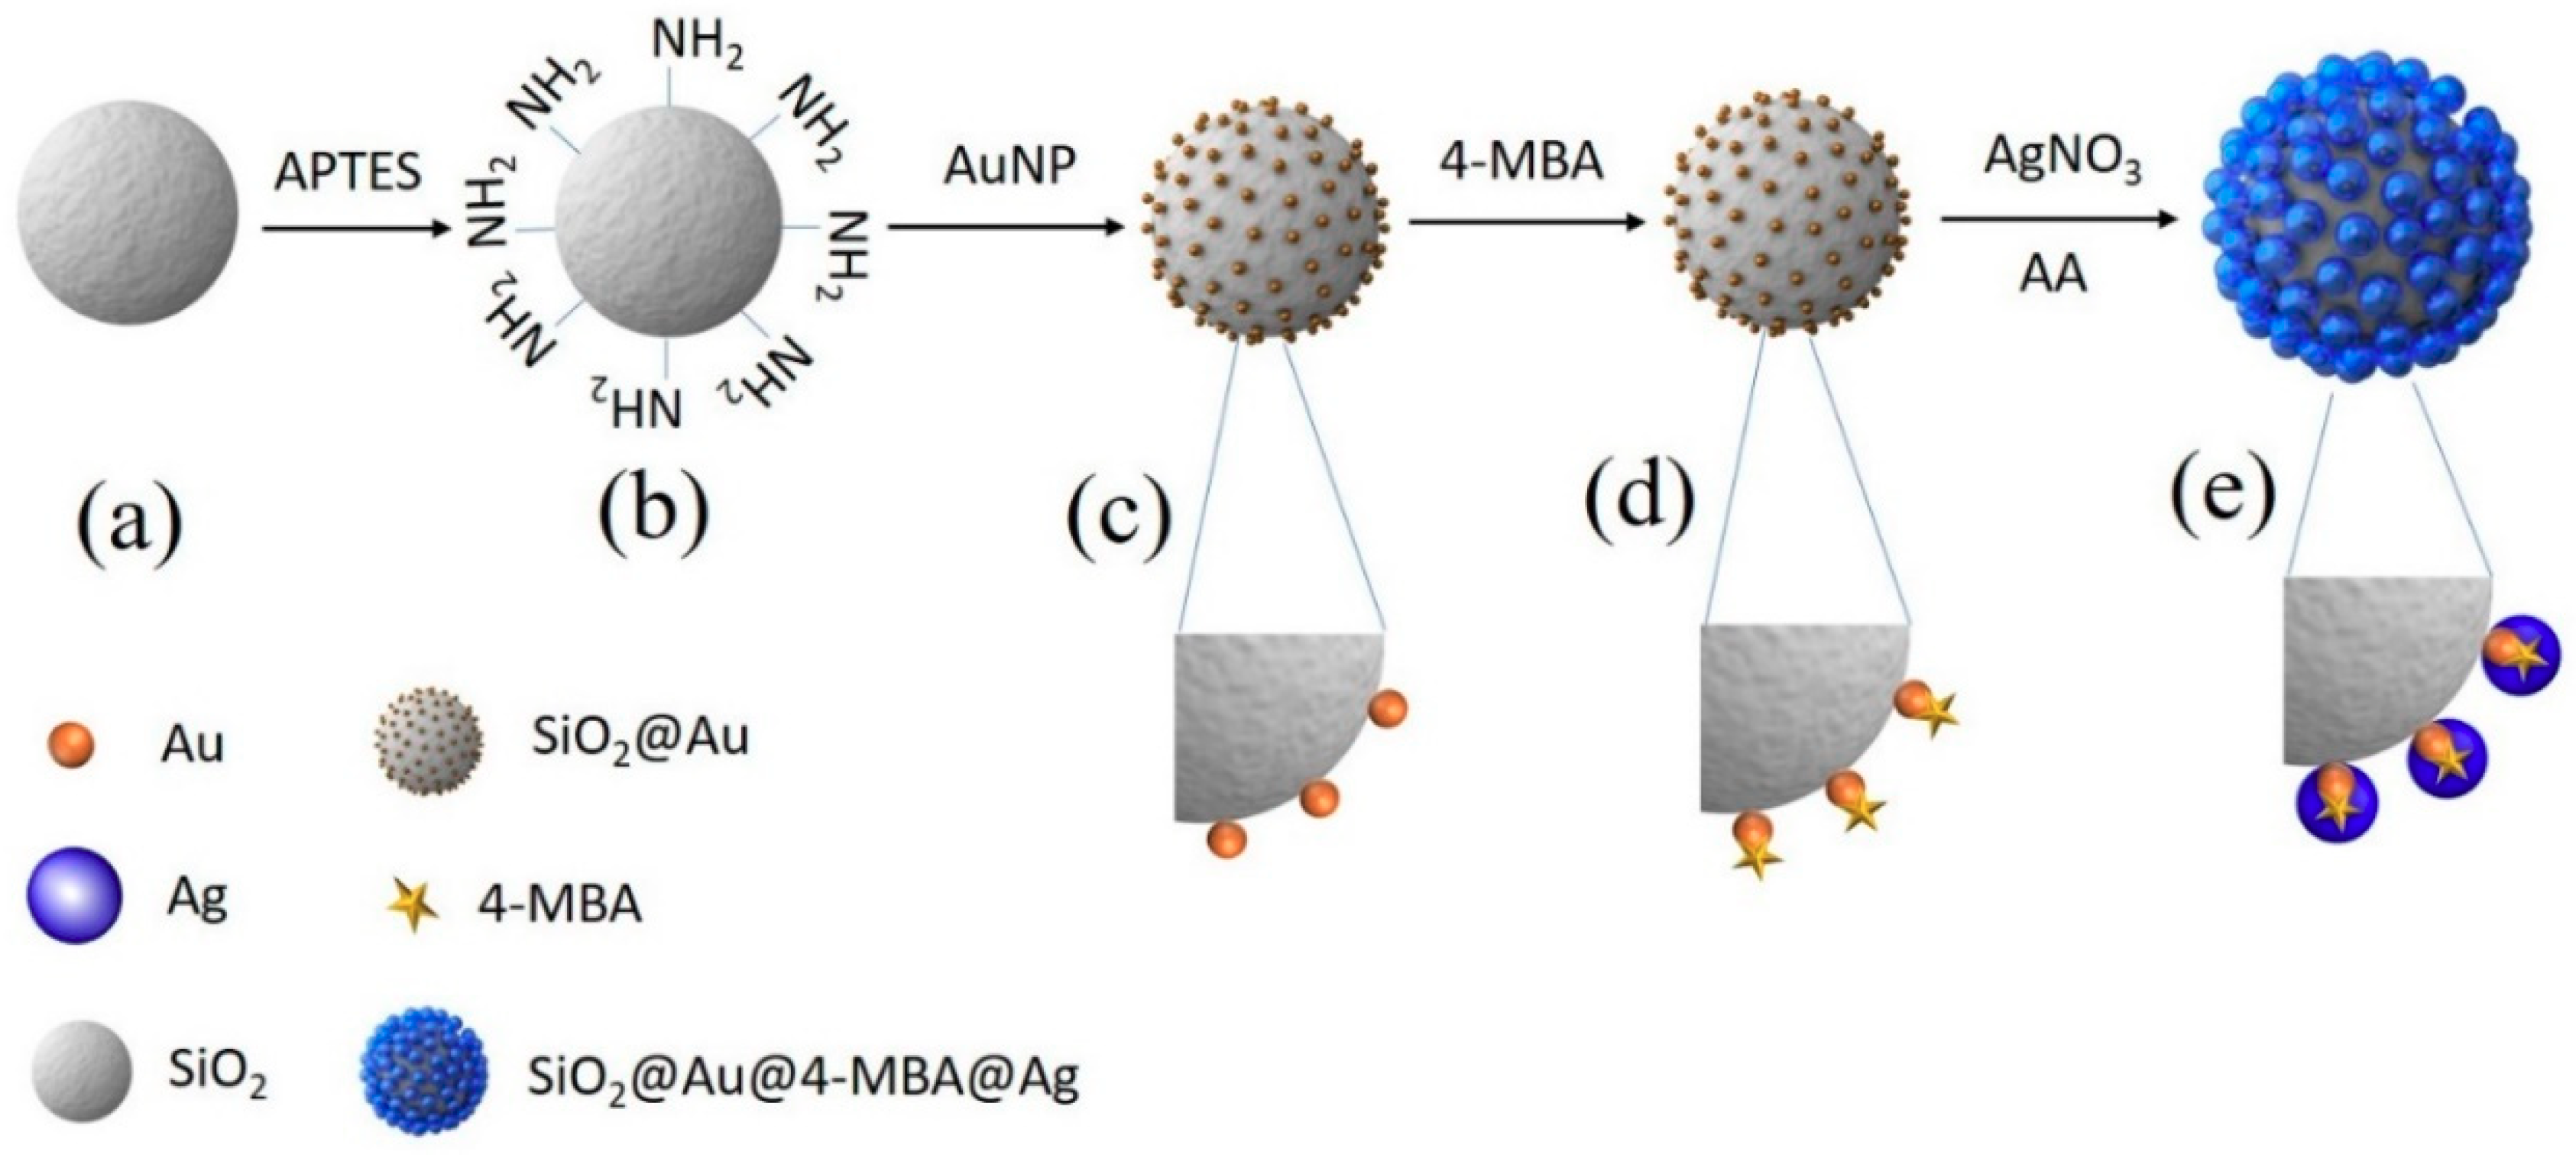
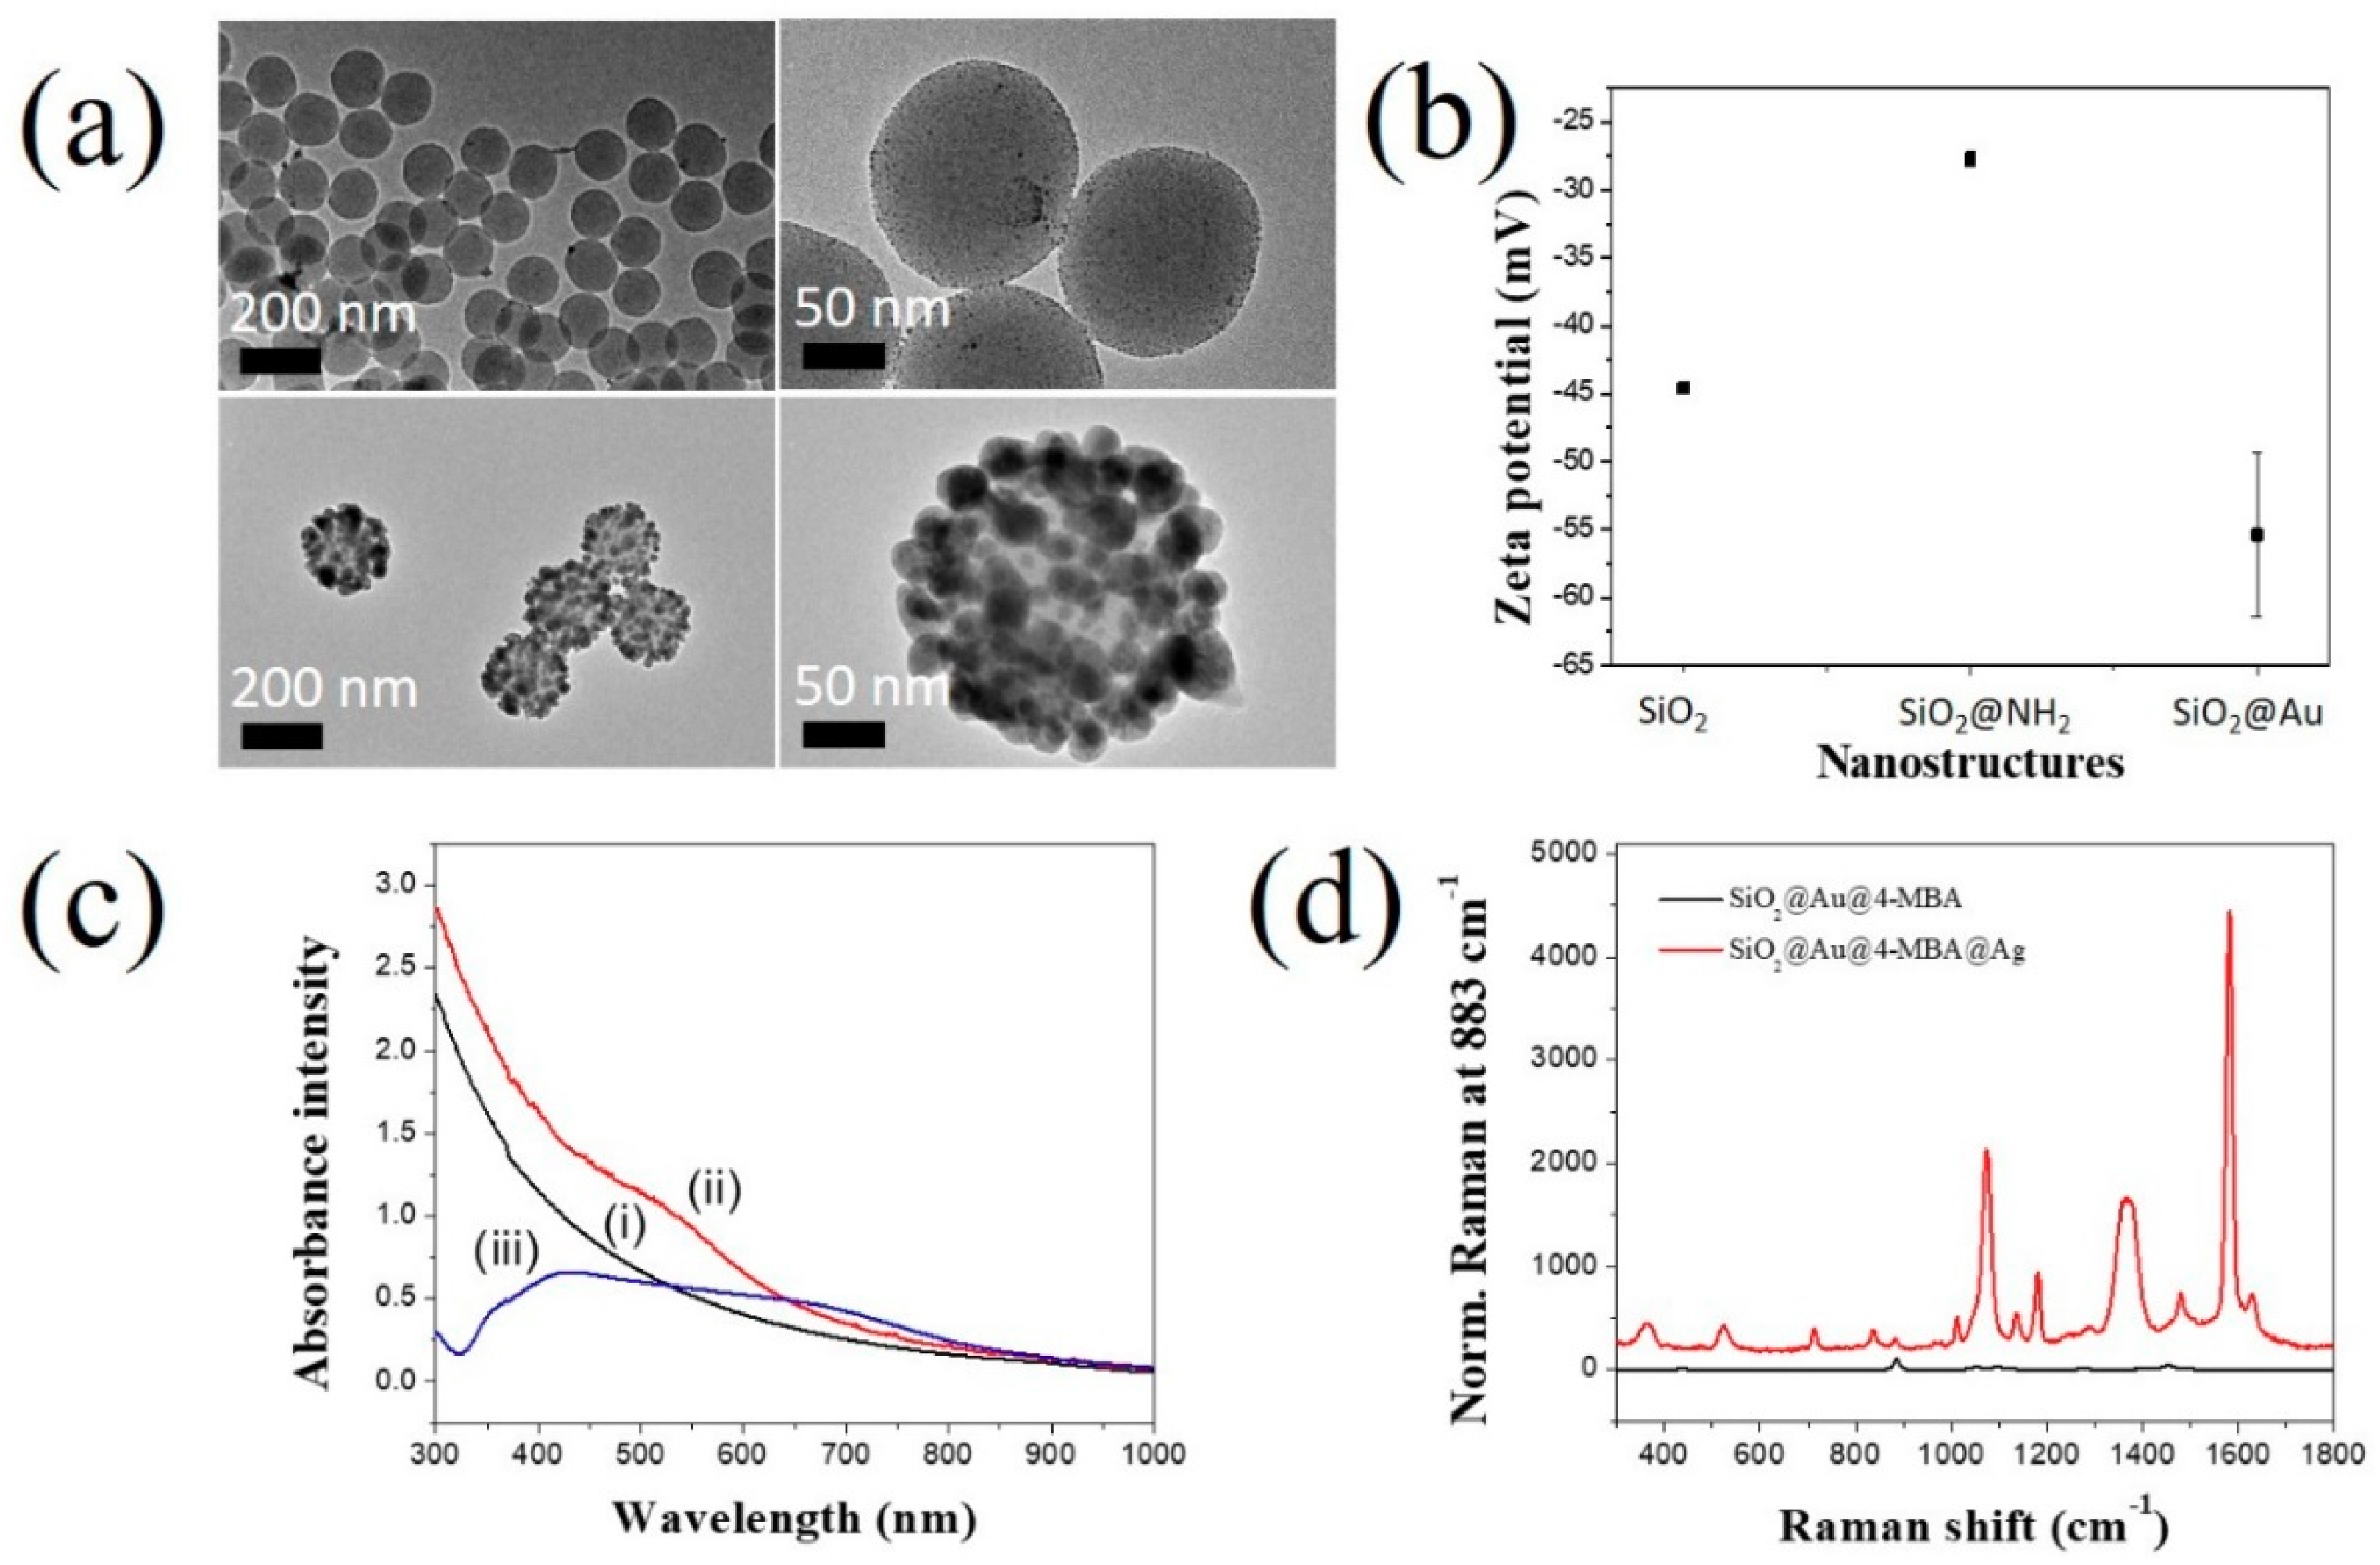
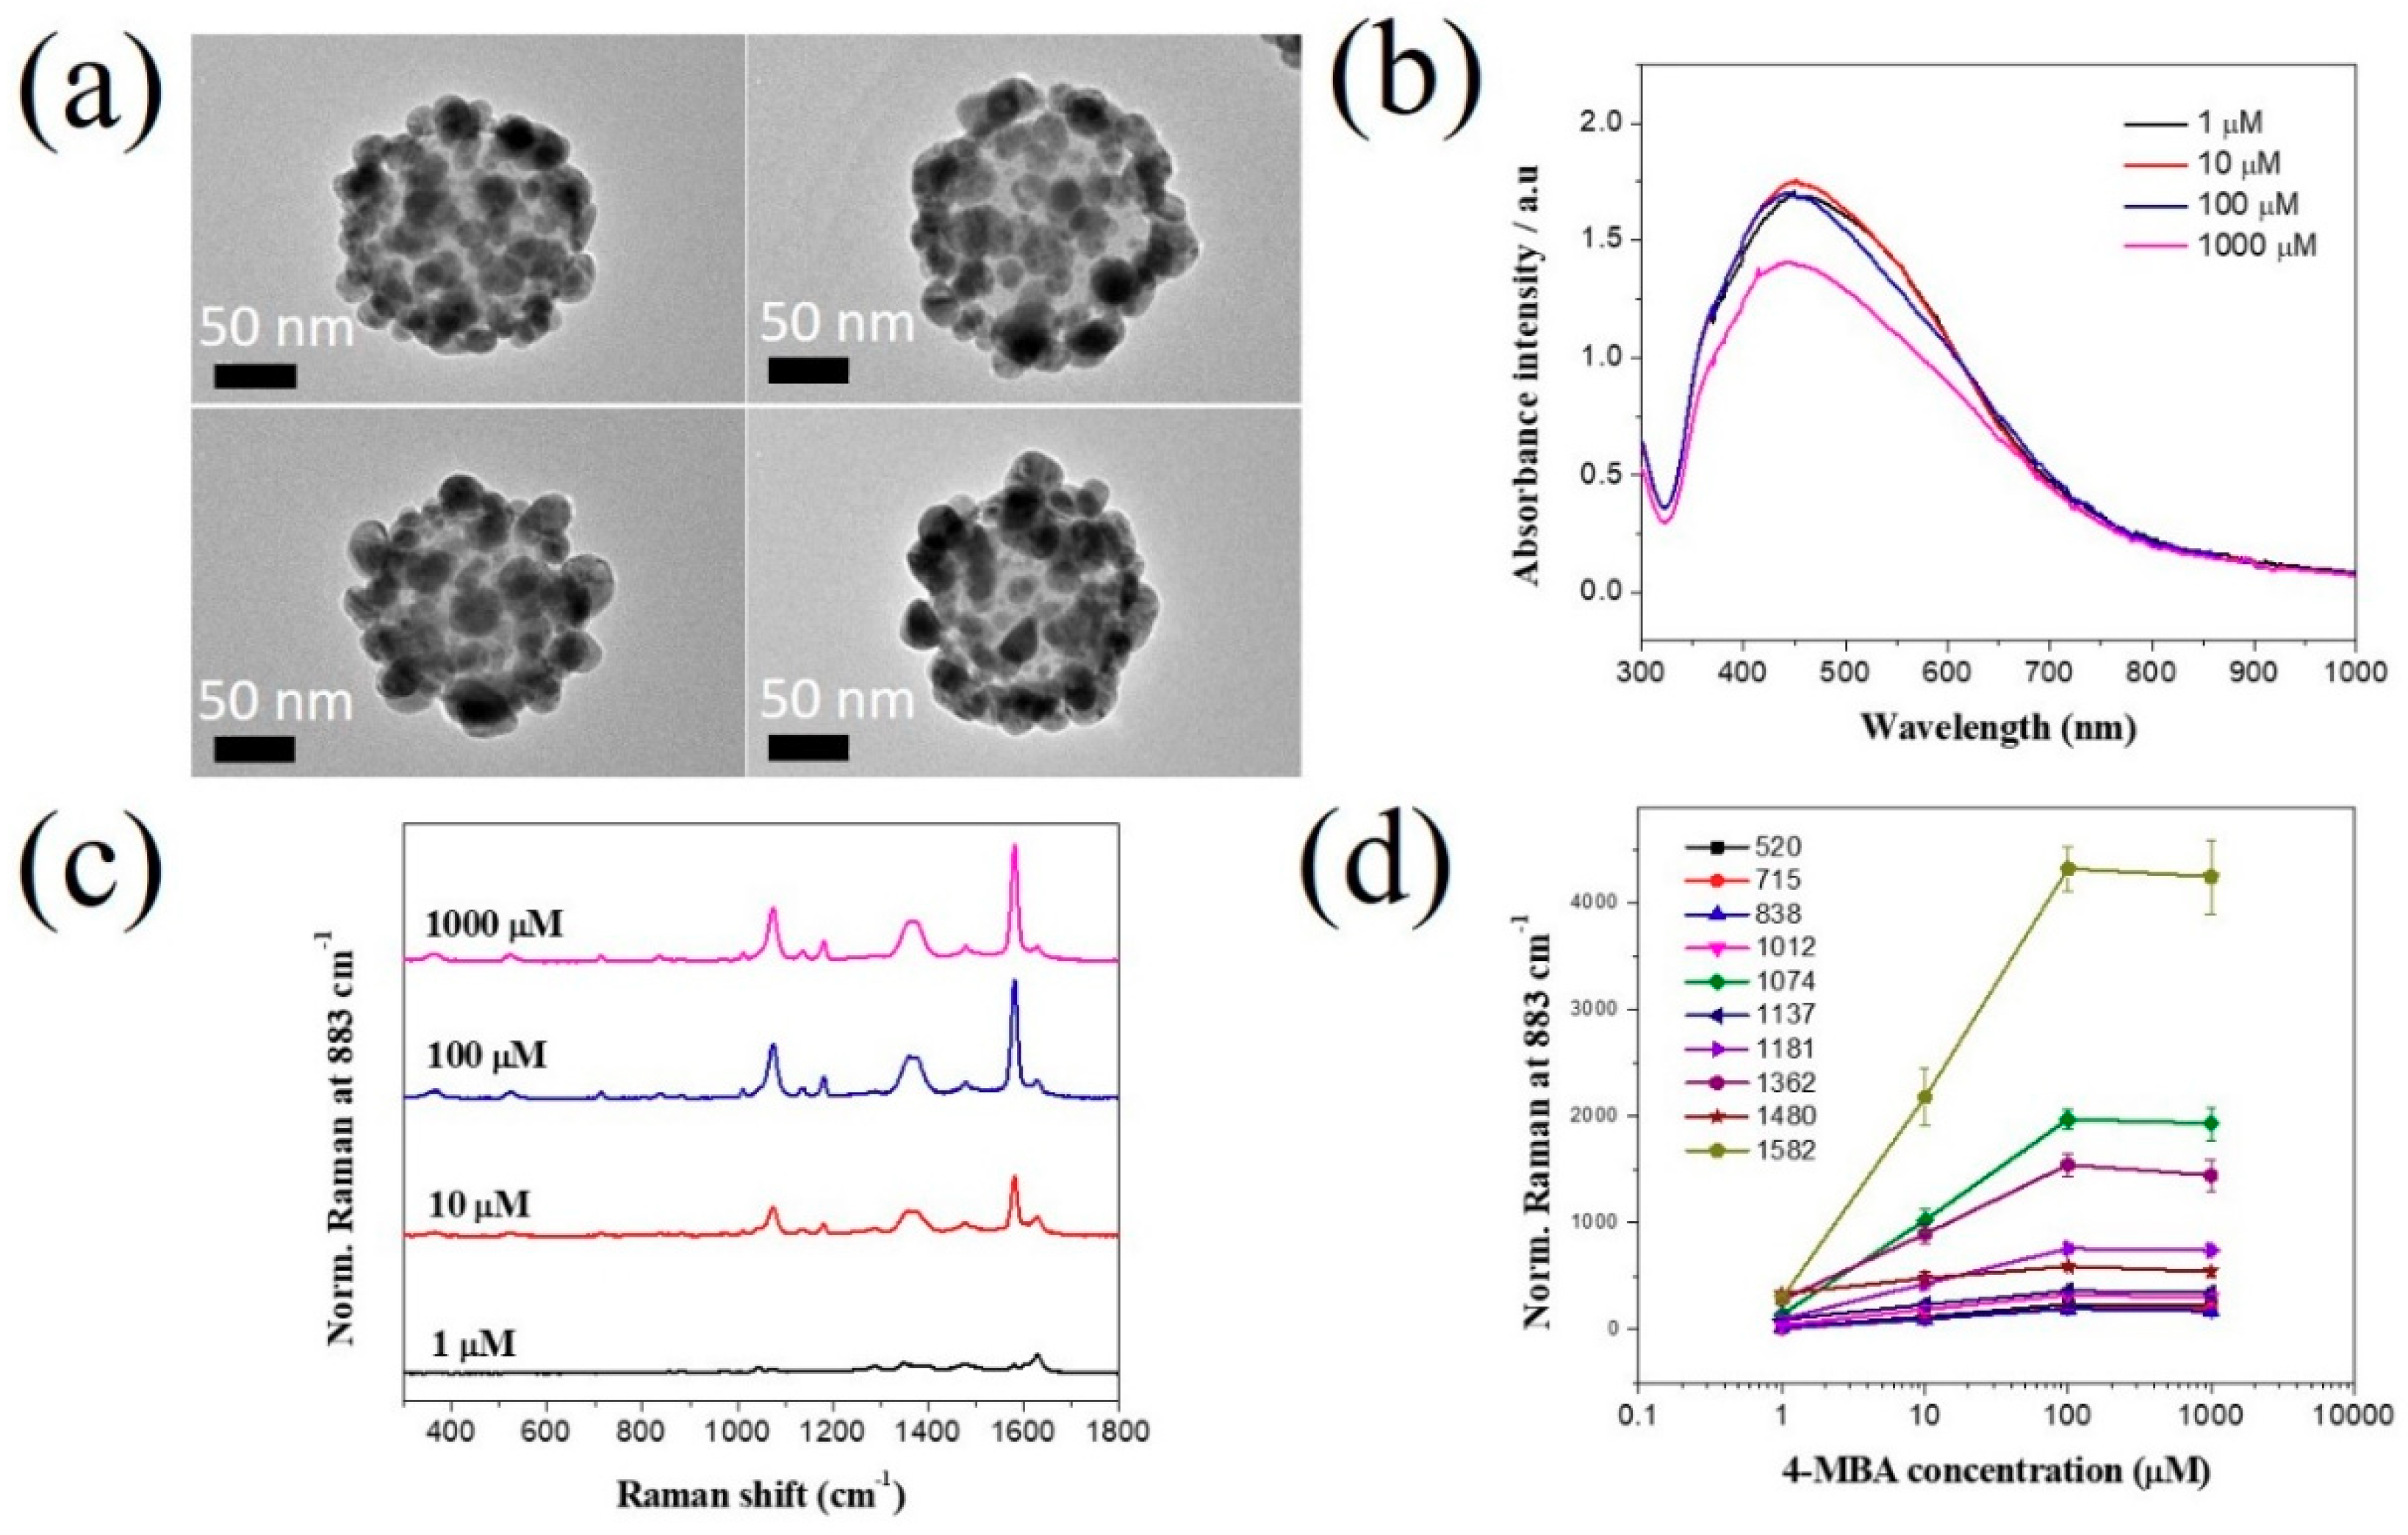
2.1. Characterizations of SiO2@Au@4-MBA@Ag NPs

We investigated the characteristics and effect of 4-MBA on the generation of SiO2@Au@4-MBA@Ag. Figure 2a shows the transmission electron microscopy (TEM) images of SiO2@Au@4-MBA@Ag. It can be seen that the Ag shell was well coated on its surface. The surface of SiO2 NPs was decorated with various small Ag NPs. From the TEM images, the average size of the SiO2@Au@4-MBA@Ag NPs was determined to be 195 ± 10 nm (n = 90). The zeta potential was also used to confirm the presence of Au NPs (Figure 2b). SiO2 NPs showed a zeta potential of −45 ± 0.1 mV. When the surface of the SiO2 NP was incubated with APTS, the zeta potential of SiO2@NH2 increased to −28 ± 0.6 mV because of the positive property of the NH2 groups. For all the NH2 groups, the Au NPs were immobilized on the surface of SiO2@NH2 by electrostatic attraction. The surface of the Au NPs was stabilized by THPC; therefore, the zeta potential of SiO2@Au decreased to −55 ± 6.1 mV. The sizes of SiO2@Au@4-MBA@Ag NPs increased when the Ag shell was deposited, as shown in Figure 2. The UV-Vis (ultraviolet–visible) spectra of SiO2@Au@4-MBA@Ag were consistent with the TEM images (Figure 2b). The suspension of SiO2 does not show its absorbance in the range of 300–1000 nm. Whereas the maximum peak of SiO2@Au was at ~520 nm when the Au NPs were immobilized on the surface of SiO2 NPs, the suspension of SiO2@Au@4-MBA@Ag NPs showed a broadband from 320 to 800 nm. This indicated the generation of irregular structures in the Ag shell and the creation of hot-spot structures on the surface of SiO2@Au@4-MBA@Ag NPs, producing a continuous spectrum of resonant multimode [38,39,40,41].
The Raman signals of SiO2@Au@4-MBA@Ag NPs were also measured (Figure 2d). The signal of 4-MBA on the surface of SiO2@Au NPs is unclear. In contrast, SiO2@Au@4-MBA@Ag exhibited a considerably stronger SERS signal of 4-MBA than SiO2@Au@4-MBA. In general, the bands of 4-MBA on the surface of SiO2@Au@4-MBA@Ag were observed at 360, 520, 715, 838, 1012, 1074, 1137, 1180, 1362, 1480, and 1582 cm−1 in Figure 2d. For 4-MBA, the peak at about 1074 cm−1 was attributed to the aromatic ring vibration possessing the C–S stretching mode, the band at about 1582 cm−1 arose from the aromatic ring breathing mode. The less intense band at 1362 cm−1 and 840 cm−1 were the COO stretching mode. Other weak bands at 1137 cm−1 and 1179 cm−1 corresponding to the C–H deformation modes were also observed. This result is consistent with our previous report [40,41,43]. The reproducibility and repeatability of Raman signals of SiO2@Au@4-MBA@Ag were showed in Figure S1. The sample was measured three times and repeated three times. The reproducibility and repeatability of Raman signals of SiO2@Au@4-MBA@Ag were calculated to be 2.7 and 8.1%, respectively. This result was rapidly similar to the size distribution of SiO2@Au@4-MBA@Ag by TEM analysis.
In addition, the effect of 4-MBA concentration on the SERS signal of SiO2@Au@4-MBA@Ag NPs was investigated. As previously reported, the density of carboxyl groups on the surface of SiO2@Au@4-MBA NPs affected the deposition of Ag shell on SiO2@Au@4-MBA [35,36]. Therefore, the effect of 4-MBA concentration on the SERS signal of SiO2@Au@4-MBA@Ag is considered in Figure 3. Various concentrations of 4-MBA in the range of 1–1000 µM were incubated with 100 µg of SiO2@Au@4-MBA, followed by Ag shell deposition of 300 µM AgNO3 in the presence of AA and PVP. All SiO2@Au@4-MBA@Ag NPs at 4-MBA in the range of 1–1000 µM were coated with Ag shells, as shown in Figure 3a. The Ag shell appears to have been better deposited at low concentrations than high concentrations of 4-MBA. The presence of irregular structures on the Ag shell on the surface of SiO2@Au@4-MBA@Ag NPs was also confirmed by UV–Vis spectroscopy with a broadband from 320 to 800 nm (Figure 3b). The SERS intensity of SiO2@Au@4-MBA@Ag NPs for 1–1000 µM 4-MBA clearly differed. The SERS signal of 4-MBA at all bands in Figure 3d increased gradually and became saturated after 100 µM. Therefore, we chose the concentration of 4-MBA concentration as 100 µM for further studies.

2.2. Detection of Thiram by SiO2@Au@4-MBA@Ag NPs

For the application, we chose thiram, a fungicide to prevent fungal diseases in seed and crops, as a pesticide sample in this study. Thiram is the simplest thiuram disulfide and the oxidized dimer of dimethyldithiocarbamate. In literature, the ratio of Raman intensity between a target molecule and an internal standard in quantitative SERS measurement provides more accurate information than the SERS signal of an intrinsic target molecule [31]. In our study, 4-MBA immobilized between the SiO2@Au core and Ag shell was used as an internal standard to calculate the concentration of thiram. Figure S2 shows the SERS bands of SiO2@Au@4-MBA@Ag NPs in the presence and absence of thiram. Dominant bands of SiO2@Au@4-MBA@Ag were observed at 360, 520, 715, 838, 1012, 1074, 1137, 1180, 1362, 1480, and 1582cm−1. When thiram was adsorbed on the surface of SiO2@Au@4-MBA@Ag NPs, the SERS bands of thiram-incubated SiO2@Au@4-MBA@Ag NPs was observed at 360, 444, 520, 560, 715, 838, 881, 936, 1015, 1074, 1137, 1181, 1381, 1448, 1480, 151, 1582 cm−1. Thus, several new bands were obtained at 440, 560, 931, 1146, 1381, and 1512 cm−1. According to a previous report by Kang et al., SERS bands of thiram on the Ag surface was observed at 342, 446, 564, 870, 928, 1150, 1386, 1444, 1514 cm−1 [25]. Therefore, these bands were attributed to the characteristic bands of thiram [25,41]. The SERS bands of thiram and 4-MBA were partially overlapped; therefore, the SERS signals of thiram-incubated SiO2@Au@4-MBA@Ag NPs at 360, 881, 1074, 1137, 1181, 1381, 1582 cm−1 increased comparing to those of SiO2@Au@4-MBA@Ag NPs. To calculate the concentration of thiram, the ratio of Raman intensity of bands at 520 cm−1 and 560 cm−1 were chosen as the characteristic bands of 4-MBA and thiram, respectively.

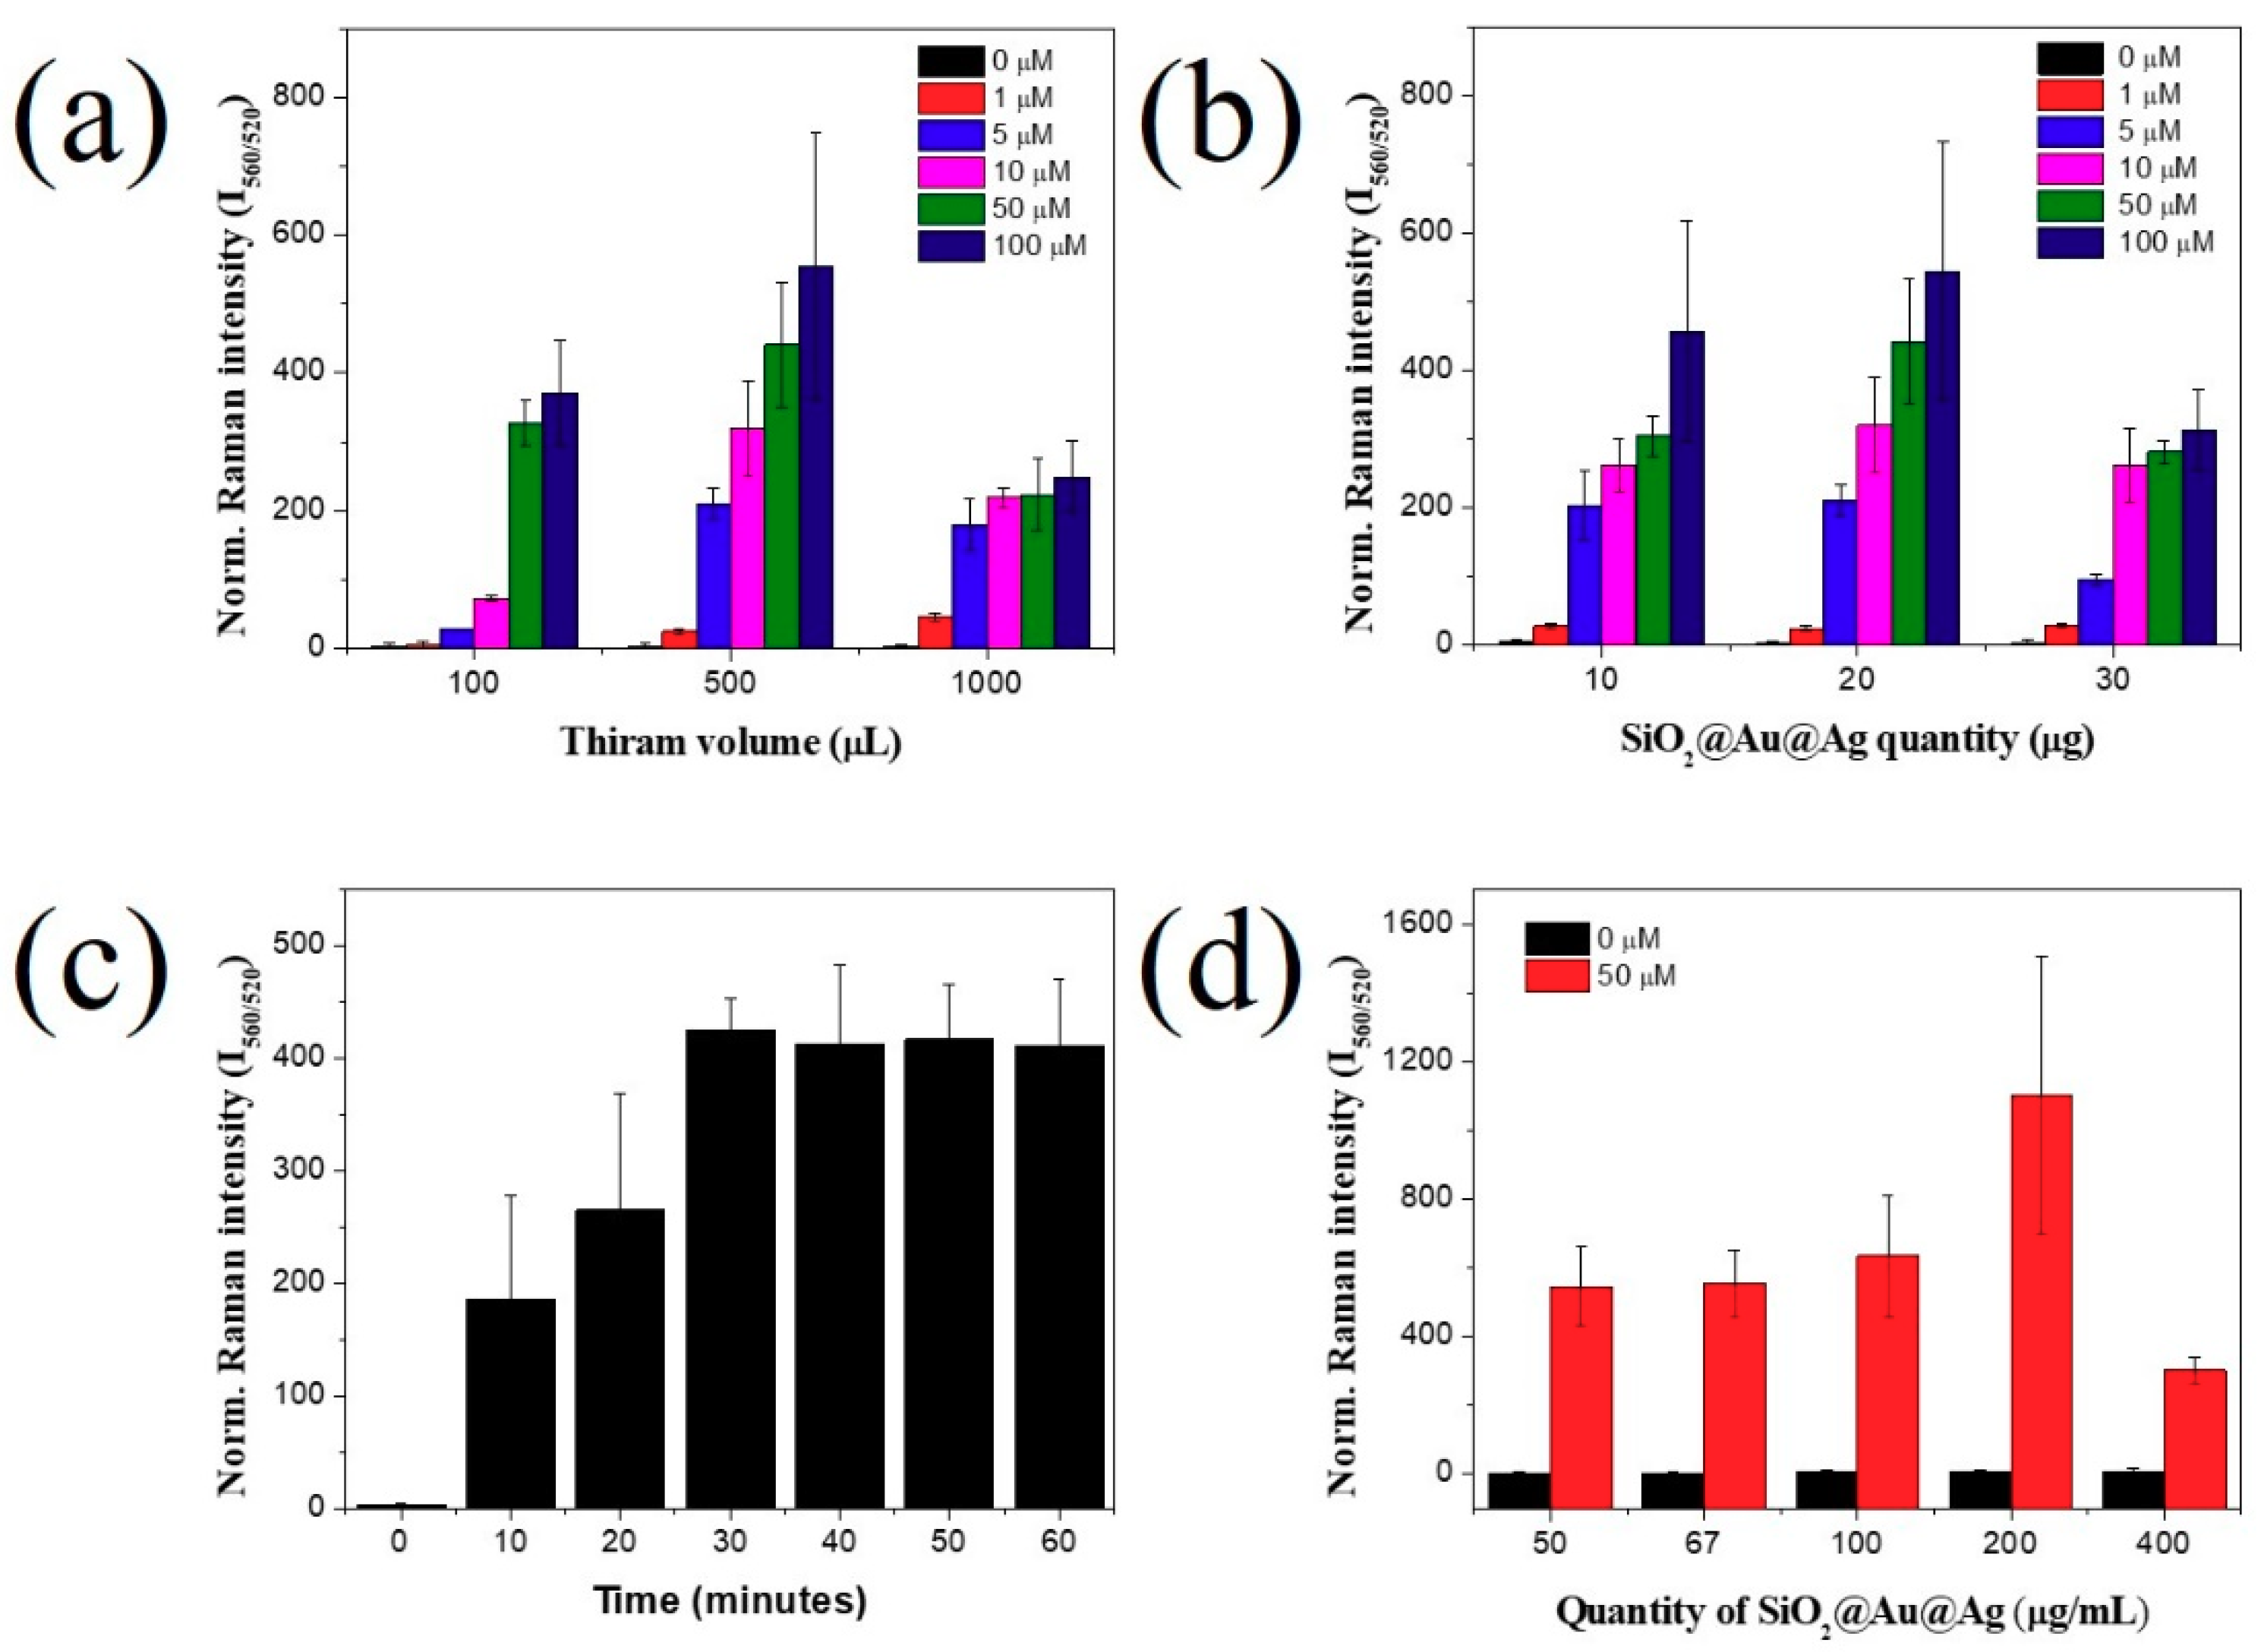
2.2.1. Optimization of Thiram Detection by SiO2@Au@4-MBA@Ag NPs

Effect of Employed Power Energy and Laser Lines

In the literature, the power energy has been considered an important factor affecting the SERS signal of target molecules. Therefore, we examined the effect of employed power energy on the SERS signal of thiram detection in the range of 2–10 mW (Figure S3). The SERS intensities of both SiO2@Au@4-MBA@Au in the presence or absence of thiram increased with the employed power energy. We chose the employed power of 10 mW to detect thiram for further studies. In order to investigate the effect of laser lines on the SERS signal of thiram, we also measured the Raman intensity of thiram-incubated SiO2@Au@4-MBA@Ag at the laser lines of 532 and 780 nm. As showed in Figure S4 the Raman bands of thiram-incubated SiO2@Au@4-MBA@Ag using the laser line of 780 nm were broadened and unclear while those using the laser line of 532 nm was clearly obtained. Although UV-Vis absorbance might not be proportionally related to the strength of the SERS signal intensity, when that wavelength of the laser is irradiated to particle, the particles will absorb the laser energy well and it is likely to be connected to a strong SERS signal. Since we have 532 nm wavelength of the laser and the materials well absorbed the 300 nm to 650 nm wavelength with the maximum absorption peak at ~450 nm, we chose the laser line of 532 nm for Raman measurement.

Effect of Target Volume

Other than the power energy of the Raman equipment, the SERS signal was affected by various conditions of the nanomaterials or target concentration. We obtained the SERS signal of SiO2@Au@4-MBA@Au incubated with various volumes and concentrations of thiram; the results are shown in Figure 4a. The SERS signal at different concentrations of thiram (100, 500, and 1000 µL) was incubated with 20 µg of SiO2@Au@4-MBA@Ag. The ratio of SERS intensity between 4-MBA and thiram measured by the SERS signal of thiram in the range of 1–100 µM is shown in Figure 4. In Figure 4a, the SERS band ratios of thiram at 560 and 520 cm−1 were proportional to the thiram concentration at all thiram volumes. However, the behavior of thiram for each specific volume varied with the concentration. At 100 µL thiram, the SERS band of thiram began increasing at 5 µM, while this ratio increased immediately at 1 µM when 500 µL and 1000 µL thiram were incubated. In addition, the SERS signal of thiram was almost balanced very early at 5 µM, when 1000 µL thiram was utilized. This is because the quantities of thiram at each volume changed with the thiram concentration, while the surface area of SiO2@Au@4-MBA@Ag was constant (20 µg). We found that when 100 µL of 5 µM thiram or 500 µL of 1 µM thiram was utilized, the quantity of thiram was calculated to be 0.5 nmol, and the SERS signal of thiram can be observed at 0.5 nm. The SERS signal of thiram was balanced at 5 nmol. The SERS signal of thiram increased steadily and slowly at 500 µM thiram; hence, we chose 500 µL of thiram for further studies.

Effect of Quantity of SiO2@Au@4-MBA@Ag NPs

The effect of SiO2@Au@4-MBA@Ag quantity is also considered in Figure 4. SiO2@Au@4-MBA@Ag amounts of 10, 20, and 30 µg were incubated with 500 µL thiram at 1 to 100 µM thiram, and the results are shown in Figure 4b. For the same concentration of thiram, the greater the amount of SiO2@Au@4-MBA@Ag added to the thiram solution acting as a substrate for thiram detection, the lower the SERS signal of thiram (Figure 4b). It is well known that the efficiency of SERS depends on the density of the target on the surface of nanomaterials [19]. Therefore, when a greater amount of SiO2@Au@4-MBA@Ag was added, more hot spots were available on the surface of SiO2@Au@4-MBA@Ag, generating numerous detection sites for thiram, meanwhile, the quantity of thiram was constant. Thus, the density of thiram at the gap or on the surface of SiO2@Au@4-MBA@Ag decreased, resulting in decreased enhancement of the thiram intensity between two adjacent Au@4-MBA@Ag NPs on the surface of SiO2@Au@4-MBA@Ag (Figure 4c) [33]. As a result, the intensity of thiram-incubated SiO2@Au@4-MBA NPs decreased (Figure 4b). For the same concentration of thiram, the greater the amount of SiO2@Au@4-MBA added, the larger the gap between Au@4-MBA@Ag NPs (Figure 4a).

Effect of Incubation Time of Thiram

Incubation is an important factor that affects the adsorption of target molecules onto the surface of a nanomaterial. Thus, the effect of thiram incubation time on the SERS signal is shown in Figure 4c. The SERS intensity of thiram-incubated SiO2@Au@4-MBA@Ag was proportional to the incubation time, and the highest value was achieved at 30 min. The result indicated that thiram was absorbed efficiently on the surface of SiO2@Au@4-MBA@Ag because of the thiol groups.

Effect of Concentration of Thiram Incubated SiO2@Au@4-MBA@Ag

According to a previous report, the density of nanomaterials significantly affected the SERS signal. Figure 4d shows the effect of thiram-incubated SiO2@Au@4-MBA@Ag concentration on the SERS signal of thiram. In the absence of thiram, the SERS signal of SiO2@Au@4-MBA@Ag NP suspension was insignificantly different; meanwhile, in the presence of thiram, the SERS signal of SiO2@Au@4-MBA@Ag NPs increased slowly from 50 µg/mL to 100 µg/mL and achieved the highest value at 200 µg/mL. For concentrations greater than 200 µg/mL, the SERS signal of the thiram-incubated SiO2@Au@4-MBA@Ag NP suspension decreased sharply owing to the low diffraction of the suspension.

2.2.2. Detection of Thiram by SiO2@Au@4-MBA@Ag NPs

We measured SERS signals at various concentrations of thiram, in the range of 240–24,000 ppb, with 20 µg of the SiO2@Au@4-MBA@Ag. The bands at 520 cm−1 and 560 cm−1 were chosen as the characteristic bands of 4-MBA and thiram, respectively. The SERS intensity of thiram at 560 cm−1 and the ratios of the Raman intensity of thiram to that of 4-MBA are shown in Figure 5. In Figure 5a, the SERS intensity at 560 cm−1 increased with the increase in a thiram concentration lower than 2400 ppb. Whereas the SERS intensity ratio at 560 cm−1 and 520 cm−1 increased proportionally with the increase in thiram concentration lower than 12,000 ppb (Figure 5b). The calibration curves of thiram showed a linear dependence (y = 0.344 × C + 6.625; R2 = 0.95 (C = thiram concentration, y is SERS signal value on y-axis in Figure 5c)) between the SERS intensity ratio and thiram concentration between 240 ppb and 2400 ppb. The limit of detection of thiram was determined to be 72 ppb (S/N (signal to noise ratio) = 3), which is considerably lower than 288.5 ppb, as in our report [35], and the limit of the detection value is lower than the maximal residue limit recommended by the US (7 ppm) and Canada (0.1 ppm) [44,45].

3. Materials and Methods

3.1. Chemicals and Reagents

Tetraethylorthosilicate (TEOS), APTS, silver nitrate (AgNO3), chloroauric acid (HAuCl4), THPC, 4-mercaptobenzoic acid (4-MBA), AA, PVP, and thiram were purchased from Sigma-Aldrich (St. Louis, MO, USA) and used without further purification. Ethyl alcohol (EtOH) and aqueous ammonium hydroxide (NH4OH, 27%) were purchased from Daejung (Siheung, Korea). Ultrapure water (18.2 MΩ cm) was produced using a Millipore water purification system (EXL Water purification, Vivagen Co., Ltd., Seongnam, South Korea). Thiram: the toxicity class WHO III (LD50 for rabbits >210 mg/kg, Inhalation LC50 (4 h) for rats 4.42 mg/kg) [46].

3.2. Preparation of SiO2@Au@4-MBA

In a previous report, Pham et al. revealed that the SiO2@Au@Ag NPs possessed a relatively high Raman enhancement effect [38,39,40,41]. Au NPs assembled silica nanoparticles (SiO2@Au NPs) were prepared by incubating the Au NP suspension with aminated silica NPs overnight. Subsequently, 1 mL of 100 µM 4-MBA solution in EtOH was added to SiO2@Au (1.0 mg), and the suspension was stirred vigorously for 1 h at room temperature. The colloids were centrifuged and washed several times with EtOH. The NPs were re-dispersed in 1.0 mL absolute EtOH to obtain 1 mg/mL SiO2@Au NPs modified with 4-MBA (SiO2@Au@4-MBA).

3.3. Preparation of SiO2@Au@4-MBA@Ag NPs

Au@4-MBA@Ag NPs assembled silica NPs were prepared in an aqueous medium via the reduction and deposition of Ag using ascorbic acid onto SiO2@Au@4-MBA NPs in a polyvinylpyrrolidone (PVP) environment. Briefly, 200 µL of 200 µg/µL SiO2@Au@4-MBA was dispersed in 9.8 mL of water containing 10 mg PVP, which was kept still for 30 min. Then, 20 µL of 10 mM silver nitrate was added to the suspension, followed by the addition of 20 µL of 10 mM ascorbic acid. This suspension was incubated for 15 min to completely reduce the Ag+ ions to Ag. The reduction steps were repeated to obtain the desired AgNO3 concentration. SiO2@Au@4-MBA@Ag NPs were obtained by centrifuging the suspension at 8500 rpm for 15 min, and the NPs were washed several times with EtOH to remove excess reagent. SiO2@Au@4-MBA@Ag NPs were re-dispersed in 1 mL of absolute EtOH to obtain a 200 µg/mL SiO2@Au@4-MBA@Ag NP suspension.

3.4. Thiram Detection

To absorb thiram on the surface of SiO2@Au@4-MBA NPs, 500 µL of 50 µM thiram solution was incubated with 500 µL of 200 µg/mL SiO2@Au@4-MBA@Ag NPs suspension for 30 min, followed by centrifugation for 15 min at 13,000 rpm to collect the colloids. The prepared NPs were washed several times with EtOH to remove excess reagent. SiO2@Au@4-MBA@Ag@thiram NPs was re-dispersed in 500 µL of absolute EtOH to obtain a 200 µg/mL SiO2@Au@4-MBA@Ag@thiram NP suspension.

3.5. SERS Measurement of SiO2@Au@4-MBA@Ag@thiram

To obtain the surface-enhanced Raman spectrum, the obtained colloids suspensions were measured in a capillary tube. SERS signals were measured using a micro-Raman system with a 532 nm laser excitation source and equipped with an optical microscope (BX41, Olympus, Tokyo, Japan). The SERS signals were collected in a back-scattering geometry using a ×10 objective lens (0.90 NA, Olympus, Shinjuku, Tokyo, Japan). A 532 nm diode-pumped solid-state laser was used as a photo-excitation source, exerting a laser power of 10 mW at the sample. The selected sites were measured randomly, and all SERS spectra were integrated for 5 s. The size of the laser beam spot was approximately 2.0 μm. The SERS spectrum was obtained in the 300–2000 cm−1 wavenumber range.

4. Conclusions

We successfully prepared SiO2@Au@4-MBA@Ag nanomaterials and optimized their conditions for thiram detection. The presence of Au@4-MBA@Ag alloys on the surface of SiO2 was confirmed by the broad bands in the range of 320 to 800 nm, indicating the generation of bumpy structures on the the Ag shell. The effect of 4-MBA concentration on the SERS signal of SiO2@Au@4-MBA@Ag NPs was studied. The SERS signal of 4-MBA increased gradually for concentrations under 100 µM. For thiram detection, SiO2@Au@4-MBA@Ag exhibited a stronger SERS signal of 4-MBA at 360, 520, 715, 838, 1012, 1074, 1137, 1362, 1480, and 1582 cm−1. Meanwhile, several new bands of thiram were obtained at 440, 560, 931, 1146, 1381, and 1512 cm−1 when thiram was adsorbed on the surface of SiO2@Au@4-MBA@Ag NPs. Additionally, the SERS intensities of both SiO2@Au@4-MBA@Au increased with the employed power energy from 2 to 10 mW. The SERS intensity of the thiram incubated SiO2@Au@4-MBA@Ag achieved the highest value via incubation with 500 µL thiram for 30 min and measuring SERS at 200 µg/mL SiO2@Au@4-MBA@Ag. Finally, the SERS intensity of the thiram at 560 cm−1 increased proportionally with the increase in thiram concentration in the range of 240 to 2400 ppb with a LOD of 72 ppb. This study provides a thorough understanding of thiram detection, which supports further research and development for strong and reliable SERS probes based on SiO2@Au@4-MBA@Ag NPs.

Supplementary Materials

Supplementary Materials can be found at https://www.mdpi.com/1422-0067/20/19/4841/s1.

Author Contributions

X.-H.P. and B.-H.J. conceived and designed the experiments; X.-H.P., E.H., H.-M.K., and B.S.S. performed the experiments; X.-H.P., K.-H.H. and E.H. analyzed the data; D.H.J. contributed reagents/materials/analysis tools; X.-H.P. and B.-H.J. wrote the paper; D.H.J. and B.-H.J. supervised.

Funding

This work was supported by the KU Research Professor Program of Konkuk University and funded by Science, ICT & Future Planning (NRF 2016M3A9B6918892) and the Korean Health Technology R&D Project, Ministry of Health & Welfare (HI17C1264).

Conflicts of Interest

The authors declare no conflict of interest. The funders had no role in the design of the study; in the collection, analyses, or interpretation of data; in the writing of the manuscript, or in the decision to publish the results.

References

  1. Kumar, P.; Kim, K.-H.; Deep, A. Recent advancements in sensing techniques based on functional materials for organophosphate pesticides. Biosens. Bioelectron. 2015, 70, 469–481. [Google Scholar] [CrossRef]
  2. Chrimes, A.F.; Khashayar, K.; Paul, R.S.; Arnan, M.; Kourosh, K. Microfluidics and Raman microscopy: Current applications and future challenges. Chem. Soc. Rev. 2013, 42, 5880–5906. [Google Scholar] [CrossRef] [PubMed]
  3. Chen, L.; Choo, J. Recent advances in surface-enhanced Raman scattering detection technology for microfluidic chips. ELECTROPHORESIS 2008, 29, 1815–1828. [Google Scholar] [CrossRef] [PubMed]
  4. Damalas, C.A.; Khan, M. Pesticide use in vegetable crops in Pakistan: Insights through an ordered probit model. Crop Prot. 2017, 99, 59–64. [Google Scholar] [CrossRef]
  5. Johnson, M.K. Trends in Pharmacological Sciences. In Handbook of Pesticide Toxicology, Vols 1, 2 and 3; Krieger, R.I., Krieger, W.C., Eds.; Elsevier: Amsterdam, The Netherlands, 1991; Volume 12, pp. 277–278. [Google Scholar]
  6. Gunnell, D.; Eddleston, M.; Phillips, M.R.; Konradsen, F. The global distribution of fatal pesticide self-poisoning: Systematic review. BMC Public Health 2007, 7, 357. [Google Scholar] [CrossRef]
  7. Sánchez-Cortés, S.; Domingo, C.; García-Ramos, J.V.; Aznárezet, J.A. Surface-Enhanced Vibrational Study (SEIR and SERS) of Dithiocarbamate Pesticides on Gold Films. Langmuir 2001, 17, 1157–1162. [Google Scholar] [CrossRef]
  8. Ferrer, C.; Lozano, A.; Uclés, S.; Valverde, A.; Fernández-Alba, A.R. European Union proficiency tests for pesticide residues in fruit and vegetables from 2009 to 2016: Overview of the results and main achievements. Food Control 2017, 82, 101–113. [Google Scholar] [CrossRef]
  9. Sherma, J. Review of thin-layer chromatography in pesticide analysis: 2014–2016. J. Liq. Chromatogr. Relat. Technol. 2017, 40, 226–238. [Google Scholar]
  10. Watanabe, E.; Miyake, S.; Ito, S.; Baba, K.; Eun, H.; Ishizaka, M.; Endo, S. Reliable enzyme immunoassay detection for chlorothalonil: Fundamental evaluation for residue analysis and validation with gas chromatography. J. Chromatogr. A 2006, 1129, 273–282. [Google Scholar] [CrossRef] [PubMed]
  11. Kutsanedzie, F.Y.H.; Hao, L.; Yan, S.; Ouyang, Q.; Chen, Q. Near infrared chemo-responsive dye intermediaries spectra-based in-situ quantification of volatile organic compounds. Sens. Actuators B: Chem. 2018, 254, 597–602. [Google Scholar] [CrossRef]
  12. Chen, Q.; Zhang, C.; Zhao, J.; Ouyang, Q. Recent advances in emerging imaging techniques for non-destructive detection of food quality and safety. Trac Trends Anal. Chem. 2013, 52, 261–274. [Google Scholar] [CrossRef]
  13. Kutsanedzie, F.Y.H.; Chen, Q.; Hassan, M.M.; Yang, M.; Sun, H.; Rahman, M.H. Near infrared system coupled chemometric algorithms for enumeration of total fungi count in cocoa beans neat solution. Food Chem. 2018, 240, 231–238. [Google Scholar] [CrossRef]
  14. Sun, F. Analytical methods and recent developments in the detection of melamine. Trac Trends Anal. Chem. 2010, 29, 1239–1249. [Google Scholar] [CrossRef]
  15. Zheng, J.; He, L. Surface-Enhanced Raman Spectroscopy for the Chemical Analysis of Food. Compr. Rev. Food Sci. Food Saf. 2014, 13, 317–328. [Google Scholar] [CrossRef]
  16. Schlücker, S. Surface-Enhanced Raman Spectroscopy: Concepts and Chemical Applications. Angew. Chem. Int. Ed. 2014, 53, 4756–4795. [Google Scholar] [CrossRef]
  17. Wang, Y.; Yan, B.; Chen, L. SERS Tags: Novel Optical Nanoprobes for Bioanalysis. Chem. Rev. 2013, 113, 1391–1428. [Google Scholar] [CrossRef] [PubMed]
  18. Culha, M.; Klutse, B.; Lavrik, N.; Klutse, C.K. Surface-Enhanced Raman Scattering as an Emerging Characterization and Detection Technique. J. Nanotechnol. 2012, 2012, 971380. [Google Scholar] [CrossRef]
  19. Jun, B.-H.; Kim, G.; Jeong, S.; Noh, M.S. Silica Core-based Surface-enhanced Raman Scattering (SERS) Tag: Advances in Multifunctional SERS Nanoprobes for Bioimaging and Targeting of Biomarkers#. Bull. Korean Chem. Soc. 2015, 36, 963–978. [Google Scholar]
  20. Goodacre, R.; Graham, D.; Faulds, K. Recent developments in quantitative SERS: Moving towards absolute quantification. Trends Anal. Chem. 2018, 102, 359–368. [Google Scholar] [CrossRef] [Green Version]
  21. Dies, H.; Siampani, M.; Escobedo, C.; Docoslis, A. Direct Detection of Toxic Contaminants in Minimally Processed Food Products Using Dendritic Surface-Enhanced Raman Scattering Substrates. Sensors 2018, 18, 2726. [Google Scholar] [CrossRef] [PubMed]
  22. Dao, T.C.; Luong, T.Q.N.; Cao, T.A.; Kieu, N.M. High-sensitive SERS detection of thiram with silver nanodendrites substrate. Adv. Nat. Sci. Nanosci. Nanotechnol. 2019, 10, 025012. [Google Scholar] [CrossRef]
  23. Wei, W.; Du, Y.; Zhang, L.; Yang, Y.; Gao, Y. Improving SERS hot spots for on-site pesticide detection by combining silver nanoparticles with nanowires. J. Mater. Chem. C 2018, 6, 8793–8803. [Google Scholar] [CrossRef]
  24. Sun, H.; Liu, H.; Wu, Y. A green, reusable SERS film with high sensitivity for in-situ detection of thiram in apple juice. Appl. Surf. Sci. 2017, 416, 704–709. [Google Scholar] [CrossRef]
  25. Kang, J.-S.; Hwang, S.Y.; Lee, C.-J.; Lee, M.-S. SERS of Dithiocarbamate Pesticides Adsorbed on Silver Surface; Thiram. Bull. Korean Chem. Soc. 2002, 23, 1604–1610. [Google Scholar] [Green Version]
  26. Sánchez-Cortés, S.; Vasina, M.; Francioso, O.; García-Ramos, J.V. Raman and surface-enhanced Raman spectroscopy of dithiocarbamate fungicides. Vib. Spectrosc. 1998, 17, 133–144. [Google Scholar] [CrossRef]
  27. Yu, Y.; Zeng, P.; Yang, C.; Gong, J.; Liang, R.; Qu, Q.; Zhang, S. Gold-Nanorod-Coated Capillaries for the SERS-Based Detection of Thiram. Acs Appl. Nano Mater. 2019, 2, 598–606. [Google Scholar] [CrossRef]
  28. Chen, M.; Luo, W.; Liu, Q.; Hao, N.; Zhu, Y.; Liu, M.; Wang, L.; Yang, H.; Chen, X. Simultaneous In Situ Extraction and Fabrication of Surface-Enhanced Raman Scattering Substrate for Reliable Detection of Thiram Residue. Anal. Chem. 2018, 90, 13647–13654. [Google Scholar] [CrossRef] [PubMed]
  29. Zhao, Y.; Newton, J.N.; Liu, J.; Wei, A. Dithiocarbamate-Coated SERS Substrates: Sensitivity Gain by Partial Surface Passivation. Langmuir 2009, 25, 13833–13839. [Google Scholar] [CrossRef] [PubMed]
  30. Saute, B.; Premasiri, R.; Ziegler, L.; Narayanan, R. Gold nanorods as surface enhanced Raman spectroscopy substrates for sensitive and selective detection of ultra-low levels of dithiocarbamate pesticides. Analyst 2012, 137, 5082–5087. [Google Scholar] [CrossRef]
  31. Atanasov, P.A.; Nedyalkov, N.N.; Fukata, N.; Jevasuwan, W.; Subramani, T.; Terakawa, M.; Nakajima, Y. Surface-Enhanced Raman Spectroscopy (SERS) of Mancozeb and Thiamethoxam Assisted by Gold and Silver Nanostructures Produced by Laser Techniques on Paper. Appl. Spectrosc. 2019, 73, 313–319. [Google Scholar] [CrossRef]
  32. Lai, H.; Xu, F.; Zhang, Y.; Wang, L. Recent progress on graphene-based substrates for surface-enhanced Raman scattering applications. J. Mater. Chem. B 2018, 6, 4008–4028. [Google Scholar] [CrossRef]
  33. Zhu, C.; Wang, X.; Shi, X.; Yang, F.; Meng, G.; Xiong, Q.; Ke, Y.; Wang, H.; Lu, Y.; Wu, N. Detection of Dithiocarbamate Pesticides with a Spongelike Surface-Enhanced Raman Scattering Substrate Made of Reduced Graphene Oxide-Wrapped Silver Nanocubes. Acs Appl. Mater. Interfaces 2017, 9, 39618–39625. [Google Scholar] [CrossRef] [PubMed]
  34. Shen, W.; Lin, X.; Jiang, C.; Li, C.; Lin, H.; Huang, J.; Wang, S.; Liu, G.; Yan, X.; Zhong, Q. Reliable Quantitative SERS Analysis Facilitated by Core–Shell Nanoparticles with Embedded Internal Standards. Angew. Chem. Int. Ed. 2015, 54, 7308–7312. [Google Scholar] [CrossRef] [PubMed]
  35. Kammer, E.; Olschewski, K.; Bocklitz, T.; Rosch, P.; Weber, K.; Cialla, D.; Popp, J. A new calibration concept for a reproducible quantitative detection based on SERS measurements in a microfluidic device demonstrated on the model analyte adenine. Phys. Chem. Chem. Phys. 2014, 16, 9056–9063. [Google Scholar] [CrossRef]
  36. Zhou, Y.; Ding, R.; Joshi, P.; Zhang, P. Quantitative surface-enhanced Raman measurements with embedded internal reference. Anal. Chim. Acta 2015, 874, 49–53. [Google Scholar] [CrossRef] [PubMed]
  37. Zhang, X.-Q.; Li, S.-X.; Chen, Z.-P.; Chen, Y.; Yu, R.-Q. Quantitative SERS analysis based on multiple-internal-standard embedded core-shell nanoparticles and spectral shape deformation quantitative theory. Chemom. Intell. Lab. Syst. 2018, 177, 47–54. [Google Scholar] [CrossRef]
  38. Pham, X.-H.; Lee, M.; Shim, S.; Jeong, S.; Kim, H.-M.; Hahm, E.; Lee, S.H.; Lee, Y.-S.; Jeong, D.H.; Jun, B.-H. Highly sensitive and reliable SERS probes based on nanogap control of a Au-Ag alloy on silica nanoparticles. RSC Adv. 2017, 7, 7015–7021. [Google Scholar] [CrossRef]
  39. Shim, S.; Pham, X.-H.; Cha, M.G.; Lee, Y.-S.; Jeong, D.H.; Jun, B.-H. Size effect of gold on Ag-coated Au nanoparticle-embedded silica nanospheres. RSC Adv. 2016, 6, 48644–48650. [Google Scholar] [CrossRef]
  40. Pham, X.-H.; Hahm, E.; Kang, E.; Ha, Y.N.; Lee, S.H.; Rho, W.-Y.; Lee, Y.-S.; Jeong, D.H.; Jun, B.-H. Gold-silver bimetallic nanoparticles with a Raman labeling chemical assembled on silica nanoparticles as an internal-standard-containing nanoprobe. J. Alloy. Compd. 2019, 779, 360–366. [Google Scholar] [CrossRef]
  41. Pham, X.-H.; Hahm, E.; Kang, E.; Son, B.S.; Ha, Y.; Kim, H.-M.; Jeong, D.H.; Jun, B.-H. Control of Silver Coating on Raman Label Incorporated Gold Nanoparticles Assembled Silica Nanoparticles. Int. J. Mol. Sci. 2019, 20, 1258. [Google Scholar] [CrossRef]
  42. Stöber, W.; Fink, A.; Bohn, E. Controlled growth of monodisperse silica spheres in the micron size range. J. Colloid Interface Sci. 1968, 26, 62–69. [Google Scholar] [CrossRef]
  43. Michota, A.; Bukowska, J. Surface-enhanced Raman scattering (SERS) of 4-mercaptobenzoic acid on silver and gold substrates. J. Raman Spectrosc. 2003, 34, 21–25. [Google Scholar] [CrossRef]
  44. Environmental Protection Agency (EPA). Reregistration Eligibility Decision for Thiram; EPA 738-R-04-012; Agency, U.S.E.P.: Washington, DC, USA, 2004; p. 278. [Google Scholar]
  45. Pest Management Regulatory Agency. Proposed Maximum Residue Limit Ferbam, Thiram and Ziram; Pest Management Regulatory Agency Health Canada: Ottawa, ON, Cananda, 2019; p. 8. [Google Scholar]
  46. Sharma, V.K.; Aulakh, J.S.; Malik, A.K. Thiram: Degradation, applications and analytical methods. J. Environ. Monit. 2003, 5, 717–723. [Google Scholar] [CrossRef] [PubMed]
Figure 1. Illustration of preparation of Au@4-MBA@Ag embedded silica nanoparticles (SiO2@Au@4-MBA@Ag NPs) for surface-enhanced Raman scattering probe. (a) Silica NP, (b) aminated silica NP, (c) Au NPs embedded silica NP, (d) Au NPs embedded silica NP incubated with 4-MBA (SiO2@Au@4-MBA) and (e) SiO2@Au@4-MBA coated with Ag shell by the reduction of silver nitrate in the presence of ascorbic acid and polyvinyl pyrrolidone.
Ijms 20 04841 g001
Figure 2. Characteristics of SiO2@Au@4-MBA@Ag. (a) TEM images, (b) Zeta potential, (c) UV-Vis spectra of (i) 1000 µg/mL SiO2, (ii) 1000 µg/mL SiO2@Au@4-MBA, and (iii) 10 µg/mL SiO2@Au@4-MBA@Ag, and (d) Raman spectra of SiO2@Au@4-MBA and SiO2@Au@4-MBA@Ag. Error bar represents the average value of three samples.
Ijms 20 04841 g002
Figure 3. Effect of 4-MBA on SERS signal of SiO2@Au@4-MBA@Ag NPs at different concentrations in the range of 1 µM–1000 µM. (a) TEM images, (b) UV-Vis spectra, (c) Raman spectra, and (d) Raman signal plot of SiO2@Au@4-MBA@Ag. Error bar represents samples in triplicate.
Ijms 20 04841 g003
Figure 4. Effect of (a) thiram volume, (b) quantity of SiO2@Au@4-MBA@Ag, (c) incubation time, and (d) dilution of SiO2@Au@4-MBA@Ag nanoparticles in the presence of 50 uM thiram. Error bar represents the triplicates of samples.
Ijms 20 04841 g004
Figure 5. (a) Raman signal (different lines from bottom to top represents different thiram concentration: 0, 240, 1200, 2400, 12,000 and 24,000 ppb) and (b) Raman intensity ratio at 560 and 520 cm−1 and (c) calibration curves of thiram-incubated SiO2@Au@4-MBA@Ag NPs at various concentrations of thiram from 0 to 24,000 ppb. The dynamic linear range of 240 to 2400 ppb with the limit of detection of 72 ppb. Error bar represents an average value of five samples.
Ijms 20 04841 g005

