Article

InDel Marker Based Estimation of Multi-Gene Allele Contribution and Genetic Variations for Grain Size and Weight in Rice (Oryza sativa L.)

1
Jiangsu Key Laboratory of Crop Genetics and Physiology/Co-Innovation Center for Modern Production Technology of Grain Crops, Key Laboratory of Plant Functional Genomics of the Ministry of Education, Yangzhou University, Yangzhou 225009, China
2
Rice Breeding and Genetics Section, Rice Research Institute, Kala Shah Kaku, Lahore, Pakistan
3
Key Laboratory of Genetics and Breeding in Forest Trees and Ornamental Plants, College of Biological Sciences and Technology, Beijing Advanced Innovation Center for Tree Breeding by Molecular Design, National Engineering Laboratory for Tree Breeding , Beijing Forestry University, Beijing 100083, China
4
Joint International Laboratory of Agriculture and Agri-Product Safety, Yangzhou University, Yangzhou 225009, China
*
Author to whom correspondence should be addressed.
Int. J. Mol. Sci. 2019, 20(19), 4824; https://doi.org/10.3390/ijms20194824
Submission received: 27 July 2019 / Revised: 24 September 2019 / Accepted: 24 September 2019 / Published: 28 September 2019
(This article belongs to the Special Issue Molecular Research in Rice: Agronomically Important Traits)

Abstract

:
The market success of any rice cultivar is exceedingly dependent on its grain appearance, as well as its grain yield, which define its demand by consumers as well as growers. The present study was undertaken to explore the contribution of nine major genes, qPE9~1, GW2, SLG7, GW5, GS3, GS7, GW8, GS5, and GS2, in regulating four size and weight related traits, i.e., grain length (GL), grain width (GW), grain thickness (GT), and thousand grain weight (TGW) in 204 diverse rice germplasms using Insertion/Deletion (InDel) markers. The studied germplasm displayed wide-ranging variability in the four studied traits. Except for three genes, all six genes showed considerable association with these traits with varying strengths. Whole germplasm of 204 genotypes could be categorized into three major clusters with different grain sizes and weights that could be utilized in rice breeding programs where grain appearance and weight are under consideration. The study revealed that TGW was 24.9% influenced by GL, 37.4% influenced by GW, and 49.1% influenced by GT. Hence, assuming the trend of trait selection, i.e., GT > GW > GL, for improving TGW in the rice yield enhancement programs. The InDel markers successfully identified a total of 38 alleles, out of which 27 alleles were major and were found in more than 20 genotypes. GL was associated with four genes (GS3, GS7, GW8, and GS2). GT was also found to be regulated by four different genes (GS3, GS7, GW8, and GS2) out of the nine studied genes. GW was found to be under the control of three studied genes (GW5, GW8, and GS2), whereas TGW was found to be under the influence of four genes (SLG7, GW5, GW8, and GS5) in the germplasm under study. The Unweighted Pair Group Method with Arithmetic means (UPGMA) tree based on the studied InDel marker loci segregated the whole germplasm into three distinct clusters with dissimilar grain sizes and weights. A two-dimensional scatter plot constructed using Principal Coordinate Analysis (PCoA) based on InDel markers further separated the 204 rice germplasms into four sub-populations with prominent demarcations of extra-long, long, medium, and short grain type germplasms that can be utilized in breeding programs accordingly. The present study could help rice breeders to select a suitable InDel marker and in formulation of breeding strategies for improving grain appearance, as well as weight, to develop rice varieties to compete international market demands with higher yield returns. This study also confirms the efficient application of InDel markers in studying diverse types of rice germplasm, allelic frequencies, multiple-gene allele contributions, marker-trait associations, and genetic variations that can be explored further.

1. Introduction

Rice is the most consumable food commodity in the world and is used as a staple by more than 50% of the world’s population [1]. Rice is also the third-highest produced agricultural commodity after sugarcane and maize [2]. It is a highly valuable grain crop with regard to human nutrition, as well as caloric intake, which provides more than one-fifth of the calories being consumed by humans worldwide [3]. The rapid increase in the human population is further boosting its demand. In some countries, rice is the only staple food, whereas in some other countries, rice is consumed as a traditional dish, as well as an important ingredient in different dishes. In the international market, quality of rice grain is highly indicative of its price, which also reflects its sale-ability. Therefore, both yield and grain quality are equally important parameters for varietal improvement in rice breeding programs.
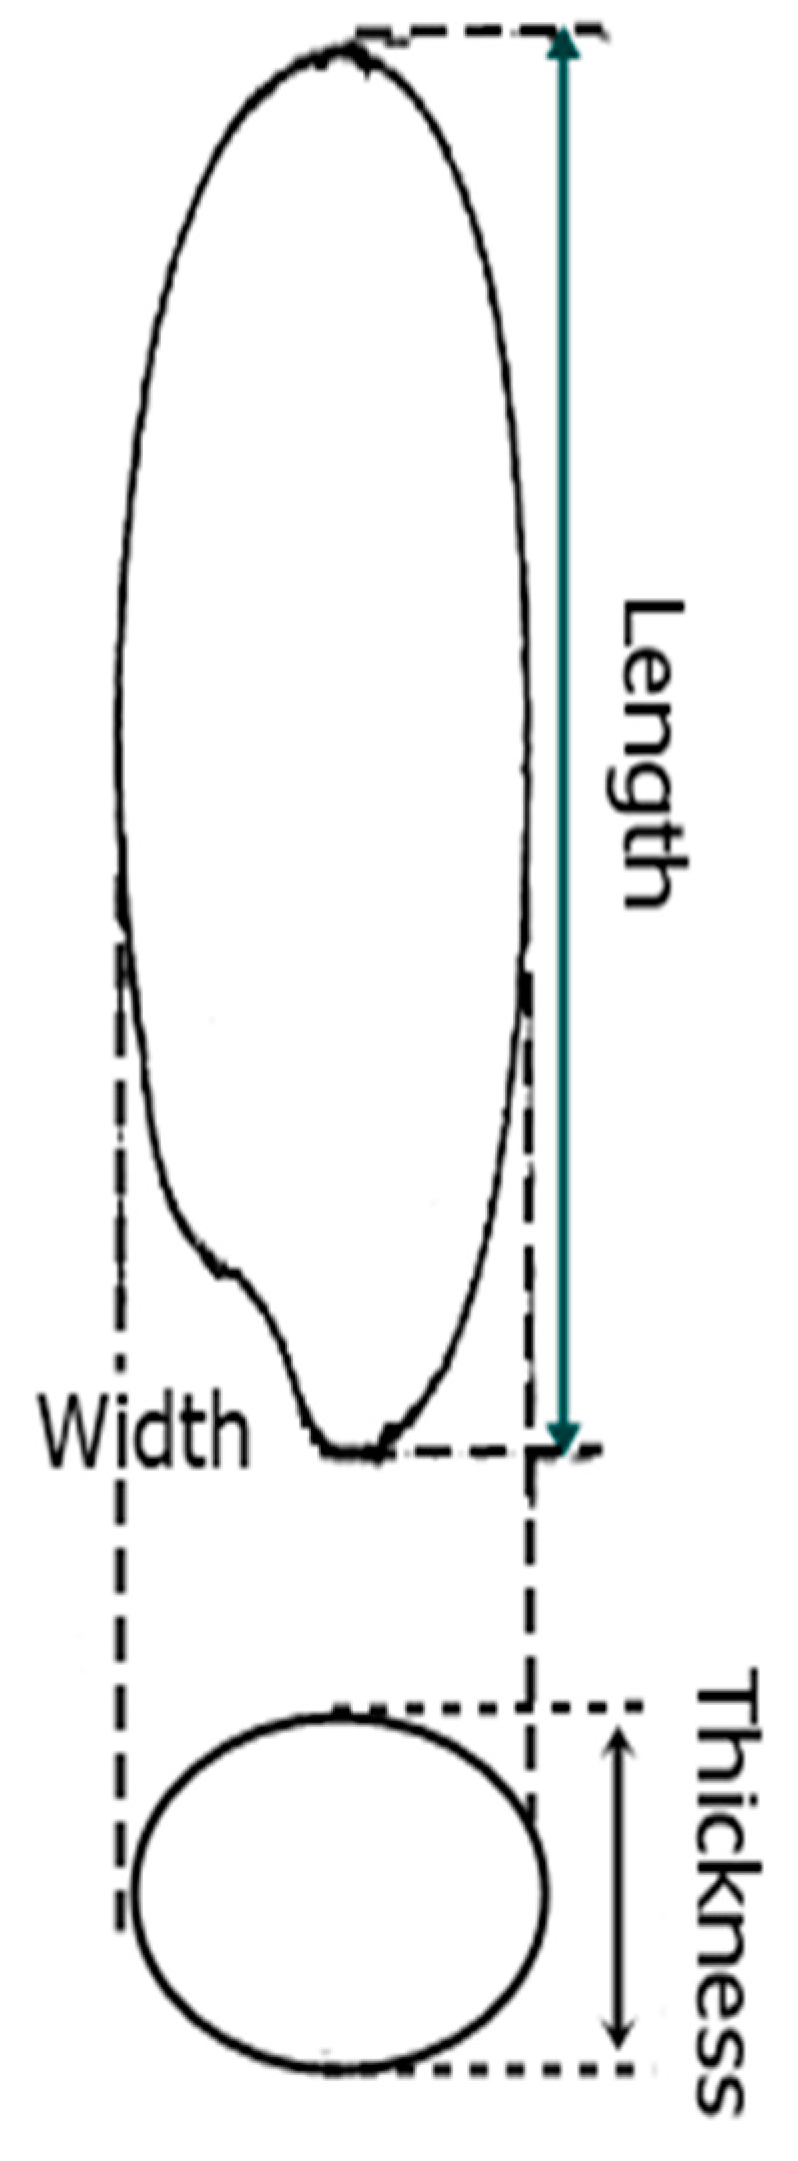
Commercial success of a modern rice cultivar is highly dependent on grain size related traits (e.g., grain length, grain width, and thickness) for quality and grain weight associated traits (most importantly thousand grain weight) for grain yield [4]. Grain size related traits determine the rice’s final market value as defined by consumer preferences, which are a combination of grain size, length, and thickness (Figure 1). Some consumers prefer long grains, while some prefer short and bold grains. Likewise, grain yield is determined by three major components, including grain weight, panicles per plant, and grains per panicle. Among these, the most associated trait is grain weight which is determined as the 1000 grain weight. Therefore, grain length, width, and thickness along with the 1000 grain weight, are central benchmarks for breeding grain appearance, as well as yield improvement, in rice. However, due to the quantitatively inherited nature of these traits, breeders hardly rely on phenotypes for their improvement [5]. Therefore, the use of genetic markers is considered superior to phenotyping [6], because such markers are not affected by the environment and are more efficient and reliable compared to phenotypic data.
A number of Quantitative Trait Loci (QTLs) for grain appearance and weight have already been investigated and reported by different scientists [7,8,9,10,11,12,13,14,15,16,17,18,19,20]. More often, grain length, thickness, and width are regarded as determinants of grain appearance whereas the 1000 grain weight determines grain weight and eventually grain yield. As reported, these traits are under the control of several or many genes and are highly influenced by environmental factors. So far, several major QTLs influencing grain appearance and grain weight have already been characterized and investigated by many researchers. These major genes/QTLs include qPE9~1 [17], GW2 [12], SLG7 [21,22], GW5 [23,24,25,26], GS3 [27,28,29], GS7 [30], GW8 [31], GS5 [32], and GS2 [33,34,35,36].
GS2 (GRAIN SIZE 2), also reported as GL2 (GRAIN LENGTH 2) or PT2 (PANICLE TRAIT 2), is a rare allele directly controlling two important grain size related traits, including grain width and grain length in rice. GS2 is found to encode a transcriptional regulator protein named Growth-Regulating Factor 4 (OsGRF4), which is then targeted by OsmiR396, which is a microRNA causing termination of the OsGRF4 function. Several studies have shown that a 2 bp substitution mutation in GS2 disturbs the binding of OsmiR396 on OsGRF4, resulting in its overexpression, which in turns increases cell enlargement and enhances cell division in grains, causing longer and wider rice grains [33,34,35,36]. GS3 (GRAIN SIZE 3) was among the first reported genes to have minor effects on grain thickness and width. In published studies on GS3, the GS3 was demonstrated to be a negative regulator of grain size, and its encoded putative transmembrane protein contains a plant-specific organ size regulation (OSR) domain as a negative regulatory motif, whose function is inhibited by its tumor necrosis factor receptor/nerve growth factor receptor (TNFR/NGFR) family, cysteine-rich domain and von Willebrand factor type C (VWFC) domain. All four domains have been reported to regulate cell divisions in the upper epidermis of the glume inside the rice seed, causing minor effects on the cell size [29].
GS5 (GRAIN SIZE 5) has been reported by many researchers who described this gene as a regulator of grain filling and weight. GS5 promotes cell division in rice seed and, to some extent, elongation of the cells located in the lemma and palea [32]. The encoded protein of GS5 (i.e., putative serine carboxypeptidase) executes its function as a positive regulator of a subset of the transition genes (G1-to-S) of cell cycle, causing increased cell divisions and resulting in enhanced grain filling and grain weight. Likewise, the GW2 (GRAIN WIDTH 2) gene encodes a protein (RING-type) that has E3 ubiquitin ligase activity, which degrades the ubiquitin–proteasome pathway. GW2 negatively regulates cell division by suppressing its substrate(s) to proteasomes for regulated proteolysis. The absence or loss of the GW2 function via its mutation causes enhanced milk filling in grains and enlarged endosperm cells, resulting in a wider spikelet hull [12].
GW5 (GRAIN WIDTH 5), also reported as SW5 (SEED WIDTH 5) and GSE5, was investigated by many researchers [23,24,25,26], who discovered that GW5 is negatively associated with rice grain width and weight. Later, it was revealed that GW5 actually encodes a calmodulin-binding protein, and GW5 physically interacts with calmodulin AsCaM1-1, which is responsible for grain width in rice. The deletion of GW5 or its mutations result in wider grains, indicating its negative effects on grain width. Likewise, SLG7 (GRAIN LENGTH 7), also known as GW7 (GRAIN WIDTH 7), has been identified to encode a TONNEAU1-recruiting motif protein responsible for increased cellular division in the longitudinal direction and reduced cell division in the transverse direction [37]. This gene was found to be responsible for grain appearance by altering cell divisions, thereby having significant effects on regulating grain weight, as well.
GW8 (GRAIN WIDTH 8) has been reported as a positive regulator of cell proliferation and has a positive association with seed width and seed weight [31]. It encodes SQUAMOSA promoter-binding protein-like 16 (AsSPL16), that was discovered to regulate the expression of several genes involved in G1-to-S transition, similar to the regulatory role of the GS5 gene [31,32]. It was revealed that a higher expression of the GW8 gene promoted cell division and grain filling, resulting in increased grain width and a higher grain yield.
GS7 (GRAIN SHAPE 7), a robust QTL known to regulate grain shape, has been reported [30] to control the grain length, roundness (thickness), and area (size) in rice. Likewise, another gene, qPE9~1, also known as DEP1 (DENSE AND ERECT PANICLE 1), encodes a G protein γ subunit found to be involved in the regulation of erect panicles, grains per panicle, nitrogen uptake, and stress tolerance through a G protein signal pathway [17,38]. In another study, the protein was also found to regulate plant architecture, grain size, and grain yield in rice. The qPE9–1 protein contains an N-terminal G gamma-like (GGL) domain, a putative transmembrane domain, and a C-terminal cysteine-rich domain [39]. Overexpression of protein qPE9–1 has been found to be responsible for increased grain size and yield in rice.
In the past few years, PCR based InDel markers have gained popularity in diversity studies because of their reproducibility, ease of use, and co-dominant inheritance [40]. InDel markers have been extensively utilized as powerful phylogenetic markers for mapping and other genetic studies in different crops [41,42,43,44,45,46,47,48]. Here, based on deletion insertion polymorphisms (DIPs), InDel markers were deployed successfully to study marker trait association and genetic variations. InDels are becoming more famous, as their genotyping requires a low start-up cost, and because they are efficient, relatively simple, and applicable to a wide range of species for which expressed sequence tag (EST) collections are available. Therefore, the leading goals of this study were to assess the efficacy of InDels to (1) estimate the population structure, allelic frequencies, and genetic variation in diverse germplasms comprising 204 rice genotypes; (2) sort the germplasms based on the distribution of the InDel marker loci; (3) assess the allele based contribution of the target genes and their association with individual traits; (4) and engagement of InDel markers to understand the genetics of traits for efficient breeding [49,50].

2. Results

2.1. Descriptive Statistics and Phenotypic Variability for Rice Grain Size and Weight

Descriptive statistics (Table 1) were determined for all four studied traits, i.e., grain length (GL), grain thickness (GT), grain width (GW), and thousand grain weight (TGW), to elaborate the phenotypic variations of the respective traits in 204 rice germplasms. Collected data of whole studied germplasm for each trait is given in Table S1 (as Supplementary Material) The average values (Mean ± Standard Error) of 204 rice genotypes for GL, GW, GT, and TGW were observed to be 8.162 ± 0.065 mm, 2.932 ± 0.019 mm, 2.156 ± 0.012 mm, and 25.858 ± 0.199 g, respectively. The germplasm consisting of 204 rice genotypes showed an appreciable range for the estimated GL: 4.640 (ranging from 6.01 to 10.65 mm). Conversely, GW and GT showed lower range values (i.e., 1.800 and 1.000, respectively), ranging from 2.05 to 3.85 mm and 1.86 to 2.86 mm, respectively. Likewise, TGW was found to have an substantial range of 20 (ranging from 17 g to 37 g), depicting a wide range of variation also suggested by the higher value of variance (i.e., 8.070 in the studied germplasm). On other hand, the variance for GL (0.864) was recorded to be higher than the variance of GW and GT (having a variance of 0.073 and 0.027, respectively) (Table 1). The coefficient of variation (CV%) for all the studied traits (i.e., GL, GW, GT, and TGW) was 11.4%, 9.2%, 7.7%, and 11%, respectively. Kurtosis and skewness both symbolize the modes of gene action [51], and estimate the gene numbers controlling the trait [52], respectively. Estimated values of the skewness and kurtosis for all the studied traits are given in Table 1. Skewness was observed for GL, GT, and TGW, with values of 0.514, −0.148, 1.075, and 1.501, while the estimated kurtosis values were −0.511, 1.092, 1.965, and 1.590, respectively (Table 1).
Figure 2 shows the score plot showing phenotypic variability within the germplasm on a biplot using principal component analysis (PCA), with the first two components representing the maximum proportion (PC1 = 56.8%, PC2 = 31.1%) of the total variation. This shows that sufficient phenotypic variation is present in the germplasm to study genetic variation in the germplasm [53].
Based on clustering, 204 germplasms were classified into three distinct clusters (I, II, III), as depicted in Figure 3. The major cluster, i.e., Cluster I, consisted of 182 genotypes. Cluster II consisted of 8 genotypes, whereas Cluster III had only 14 genotypes. Cluster I was further subdivided into Cluster IA and Cluster IB for simplification. Cluster IA consisted of 78 entries, and Cluster IB contained 104 entries of germplasm. The average grain length of Cluster I was calculated to be 8.01 mm, whereas the average GW and GT were 2.96 mm and 2.16 mm, respectively. The thousand grain weight (TGW) of this group was 25.63 g. Cluster II showed the highest values for the average GL (8.83 mm), indicating that the entries of this group had the maximum grain length. This group also had the maximum GT (2.27 mm), GW (3.02 mm), and the heaviest grain, as indicated by its TGW value (i.e., 30.43 g). Cluster III contained genotypes with a medium grain length (8.25 mm), but their GW (2.71 mm), GT (2.03 mm), and TGW (21.70 g) were the lowest among the groups [54].

2.2. Factor Analysis and Phenotypic Correlation among the Four Traits for Rice Grain Size and Weight

The Pearson correlation coefficients (r) were estimated for pair-wise analysis among the studied traits (i.e., GL, GW, GT, and TGW) using diverse germplasms comprising 204 rice germplasms (Table 2). A correlation analysis between GL and GW showed a highly significant (p ≤ 0.01) but negative association (r = −0.604 **) between these two traits. Such a negative linear relationship has also been reported by other researchers [20,55]. GL and GT were also negatively correlated (r = −0.398 *), which was also significant (p ≤ 0.05) and strong. In the case of TGW, GL showed a significant (p ≤ 0.05) and positive association (r = 0.249 *), depicting the linear relationship between these two traits. A highly significant (p ≤ 0.01) and positive relationship (r = 0.686 **) was also observed between GW and GT, indicating that GW was 68.6% positively influenced by GT in the studied rice germplasm. Likewise, GW showed a significant (p ≤ 0.05) and positive association (r = 0.374 *) with TGW. GT was also found to have a highly significant (p ≤ 0.01) and positive association (r = 0.491 **) with TGW. These results further revealed that TGW was 24.9% influenced by GL, 37.4% influenced by GW, and 49.1% influenced by GT. Hence, we assume the trend of trait selection (i.e., GT > GW> GL) for improving TGW in yield enhancement programs. The same results were also confirmed using Factor analysis in the Minitab software by producing a biplot for all the traits to further study the pattern of association among the traits. The results confirmed the importance of GT followed by GW and GL in improving TGW and paddy yield. Figure 4 shows a two-dimensional (2D) representation of the associations among the traits [56,57,58].

2.3. InDel Based Estimation of the Allelic Distribution of Fifteen Genes in the Determination of Grain Size and Weight

A number of genes and their alleles in different combinations have been found to be involved in determining the ultimate size, shape, and weight of rice grains (also detected by previous researchers) [7,8,9,10,11,12,13,14,15,16,17,18,19,20]. An amplification profile of 14 Insertion/Deletion (InDel) markers of nine studied genes related to grain size and weight in 204 rice germplasms is given in Figure 5. A functional insertion–deletion (InDel) marker (sequences of reverse and forward primers are given in Table 8) was used to determine the allelic frequency of the qPE9~1 gene in the germplasm. The InDel marker produced 270 bp and 350 bp fragments, which corresponded to the A- and B-allele, respectively (Figure 5). The results (Table 3) showed that A- and B-alleles were distributed in the germplasm with frequencies of 0.8922 and 0.1078 (i.e., ~89% and ~11% of the whole germplasm) in 364 and 44 genotypes, respectively. The frequencies of alleles in the genotypes are given in Table 3. The germplasm with an A-allele of this gene was observed to have a lower grain length (7.94 ± 0.920 mm), whereas the B-allele was found to control grain length (Table 4) in rice grains, as suggested by the longer grain length (8.24 ± 0.961 mm) in the germplasm possessing the allele. Entries with lower grain widths (2.95 ± 0.275 mm) retained the A-allele, whereas the B-allele was retained by germplasm with higher values of gain width (3.05 ± 0.209 mm). For the GW2 gene, another InDel marker (Table 8) was used to determine its allelic distribution in the germplasm. The A-allele (labelled for the fragment at 500 bp) was present in 290 rice genotypes (with 0.7108 allelic frequency), whereas the B-allele (labelled for the fragment at 520 bp) was present in 116 entries, with an allelic frequency of 0.2843 (Table 3). The A-allele was observed in the germplasm having grains with a lower grain width (2.95 ± 0.273 mm), whereas the B-allele was found in the germplasm with more grain width (3.02 ± 0.253 mm). However, the results for the gene associations with any traits were non-significant.
The InDel marker SLG7-InDel (Table 8) was used to determine the allelic distribution of SLG7 in the 204 rice germplasms. Two alleles (A and B, designated for bands at 450 bp and 500 bp, respectively) successfully divided all the germplasms into two groups: the A-allele group (308 entries) and the B-allele group (100 entries), with allelic frequencies estimates of 0.7549 (~75% of the total population) and 0.2451 (~24% of the total population), respectively (Table 3). It was further shown that both the alleles have no effect in regulating grain shape (i.e., GL, GT, and GW) (Table 4). The results depicted in Table 4 show that the gene is significantly (p ≤ 0.05) associated with TGW. Two alleles of the GW5 gene, the A- and B-alleles (DNA fragments at 450 bp and 500 bp, respectively), were distinguished by another insertion–deletion (InDel) marker, GW5-InDel (Table 8), used to investigate the allelic frequencies of both alleles in the target germplasms of 204 rice lines. Both alleles were found in germplasm with different frequencies (Table 3). The A-allele was present in 294 genotypes, and the B-allele was found in 114 genotypes, with estimated frequencies of 0.7206 and 0.2794, respectively. Notably, the gene was found to have a significant (p ≤ 0.05) contribution in controlling GW and TGW. Two alleles (the A-allele labelled for the DNA fragment at 650 bp and the B-allele at 750 bp) were observed for the GS3 gene by using an InDel marker, GS3-InDel (Table 8), which distinguished all the germplasms into groups, with A- and B-alleles in 204 germplasms with the frequencies of 69.6% and 30.4%, respectively, in 284 and 124 rice genotypes (Table 3). The gene was also found to have a significant (p ≤ 0.05) association (Table 4) with GL and GT, as indicated in Table 4, which shows that the A-allele of this gene was found in the germplasm with a less average GL (7.90 ± 0.926 mm) and thicker (2.14 ± 0.166 mm) grains, while the B-allele was present in genotypes with longer grains (8.16 ± 0.917 mm) and a low average GT (2.11 ± 0.159). The GS7-InDel marker (Table 8) was used to determine allelic frequencies in the subject population for the GS7 gene. This InDel marker divided all germplasms into three groups: a group containing A-alleles and B-alleles only and a third one possessing both A- and B-alleles, which were distributed among the germplasms with different frequencies (0.4412, 0.3088, and 0.2451 respectively), present in 90, 63, and 50 entries, respectively (Table 3). It was further observed that the A-allele (DNA band labelled at 200 bp) was present in 56.4% of the total germplasm, whereas the B-allele (at 250 bp) was present in 43% of the total germplasm under study (Figure 5). Interestingly, both the A- and B-alleles showed a significantly higher mean grain length (8.19 ± 0921 and 8.08 ± 0.828 respectively) separately. However, in combination (AB), both alleles showed a lower mean grain length (7.57 ± 0.974). These studies, based on 204 germplasms, also showed that the gene has significant (p ≤ 0.05) associations with two grain size traits (i.e., GL and GT), indicating its contribution in regulating grain size in rice.
An InDel marker, GW8-InDel (Table 8), was applied to distinguish all germplasms into two groups carrying A- and B-alleles, as designated by DNA fragments/bands at 350 bp and 450 bp, respectively (Figure 5). The A-allele was found to be present in 29.9% (122 genotypes) and the B-allele was present in the remaining 62.8% (256 genotypes) of the total germplasms (Table 3). Remarkably, the B-allele had a significantly higher mean grain length (8.41 ± 0.890), a significantly lower grain width (2.92 ± 0.259), and a lower grain thickness (2.09 ± 0.118) compared to the A-allele, which showed a lower mean grain length (7.34 ± 0.578), a significantly higher grain width (3.05 ± 0.203), and a higher thickness (2.27 ± 0.133) in the studied 204 germplasms. Based on the GW8-InDel marker loci in the GW8 gene, the gene was found to be strongly associated (p ≤ 0.01) with three grain size traits (i.e., GL, GW, and GT) (Table 4). However, no allelic associations were observed in the case of TGW in this study. Likewise, another InDel marker, GW8-InDel1A was used for the same germplasm. It also separated the whole germplasm into two groups carrying A- (350 bp) and B-alleles (450 bp), with a frequency of 31.1% (127 genotypes) and 66.4% (271 genotypes), respectively. The results show that the B-allele has a significantly higher average gain length (8.40 ± 0.901) and a lower grain width (2.91 ± 0.260) and grain thickness (2.09 ±0.118) compared to the A-allele, which showed a lower average grain length (7.42 ± 0.667), a significantly higher grain width (3.06 ± 0.231), and an average grain thickness (2.27 ± 0.169) in the studied genotypes. TGW showed no changes due to these alleles. A third InDel marker, GW8-InDel2B, was also used for further studies, as it separated the whole germplasm into A-allele (at 270 bp) with a lower frequency (46%) and the B-allele (at 300 bp) with frequency (51.9%) that was found in 94 and 106 genotypes out of the 204 genotypes (Figure 5). These results show that B-allele has a significantly higher grain length (8.35 ± 0.852), a lower grain width (2.92 ± 0.274), and a lower grain thickness (2.10 ± 0.129) compared to the A-allele, which showed a lower average grain length (7.64 ± 0.965) and a higher average grain width (3.00 ± 0.238) in the studied genotypes. Unlike other InDel markers, GW8-InDel2B also distinguished the germplasm into two groups for the thousand grain weight, with the A-allele having a significantly higher TGW (26.0 ± 2.824) and the B-allele with a lower average TGW (25.0 ± 2.611). For all three InDel markers, the same results were observed for GL, GT, and GW, showing a very strong association (p ≤ 0.01), whereas, in the case of TGW, only one marker (GW8-InDel2B) showed a strong and highly significant (p ≤ 0.01) association, as depicted in Table 4. A-alleles of this gene should be considered while improving the GW, GT, and TGW in rice, whereas the B-alleles should be considered when breeding for longer grains.
Another QTL GS5 has already been reported to regulate grain size in rice via grain filling and weight [32]. In this study, two InDel markers, GS5-InDel1A and GS5-InDel1B (Table 8), were applied to determine the contribution of the affective alleles for the GS5 gene in the germplasm. The InDel1A marker yielded two alleles, A (500 bp) and B (550 bp), with a frequency of 181 (44.3%) and 215 (52.7%), respectively (Table 3). The other InDel marker, GS5-InDel2B, also yielded two alleles, A (500 bp) and B (550 bp), with a frequency of 101 (24.5%) and 295 (72.3%), respectively. Both these markers had no observable association with the grain size traits in this study, except the thousand grain weight (TGW). The B-alleles of both InDel markers (i.e., GS5-InDel1A and GS5-InDel1B) were found to control the heavier grains (Table 4), as indicated by the significantly higher average TGW values (27.0 ± 2.535 and 26.2 ± 2.899, respectively) of the genotypes possessing B-alleles, whereas the germplasm with the other allele (A-allele) showed a lower average TGW for both markers (24.0 ± 3.180 and 23.0 ± 2.729, respectively). Likewise, in the case of the GS5-InDel1A makers, the A-allele was found to be present in 90 germplasms with a lower average grain length (7.79 ± 0.921 mm), and B-allele was found in 107 genotypes with a longer grain length (8.16 ± 0.925 mm). For the marker GS5-InDel2B, the A-allele was present in only seven genotypes with shorter grains (7.40 ± 0.900 mm) and in the B-allele in the larger portion of germplasm (185 genotypes) with a longer grain length (8.24 ± 0.934 mm), as represented in Table 4. The study further revealed that there is a strong (p ≤ 0.05) association of the GS5 gene for both the InDel markers with TGW.
For the GS2 gene, three InDel markers (i.e., GS2-InDel, GS2-InDel1A, and GS2-InDel2B (Table 8)) were used to determine the different alleles for the GS2 gene in the germplasm of 204 entries. Two alleles, A and B, were determined for the DNA fragments at 400 bp and 500 bp, respectively, which distinguished the whole germplasm into two groups: one having 16% (65 entries) germplasm of the total (with A-alleles) and other having 83% of the total (339 entries) (with B-alleles). However, no significant associations were detected for these alleles with regards to grain size and weight related traits, suggesting the inefficiency of this marker in distinguishing this gene in the rice germplasm under study. The other InDel marker, GS2-InDel1A, distinguished germplasm into two groups: one with A-alleles (designated for the band at 400 bp), comprising 52.7%, and one with B-alleles (at 500 bp), comprising 45.3% of the total germplasm. Genotypes possessing B-alleles showed a significantly higher average grain length (8.44 ± 0.908), a significantly lower grain width (2.84 ± 0.275), and a lower grain thickness (2.09 ± 0.126); whereas genotypes with A-alleles showed a significantly lower average grain length (7.66 ± 0.820), as well as wider and thicker grains compared to the rest of the germplasm. No associations were observed for the TGW marker in the present study. The third marker, GS2-InDel2B, also distinguished A- and B-alleles, labelled for the bands at 250 bp and 300 bp, respectively, and present in 24.7% and 72.3% of the total germplasm (Figure 5). This marker separated the genotypes into two groups: one with genotypes possessing A-alleles with a significantly higher average grain length (9.32 ± 0.951), a significantly lower grain width (2.65 ± 0.303), and a lower grain thickness (2.08 ± 0.153), and the other group consisting of genotypes with B-alleles with a significantly lower average grain length (7.81 ± 0.742) and wider and thicker grains with a higher average grain width (3.01 ± 0.201) compared to the rest of the germplasm (Table 3). This gene was found to have a strong and highly significant (p ≤ 0.01) association with GL, GT, and GW, thereby revealing its importance in regulating all these traits in rice grains (Table 4). GS2 showed no association with TGW, indicating that this gene is responsible only for regulating the grain size in the studied germplasm. These results showed that, for longer grains, the B-allele should be taken into consideration for the InDel1A marker, and the A-allele should be considered for the InDel2B marker.

2.4. Favorable Alleles of Studied Genes for Gene Pyramiding

In the present study, a total of 38 alleles were identified. Out of these, only 27 alleles were major alleles (genotype frequency ≥0.2). Alleles present in less than 20 genotypes were considered minor alleles. Major alleles were further classified into favorable and non-favorable categories. A total of seven alleles were found to be favorable/beneficial for improving the grain length (>8 mm), having a better TGW, followed by GT and GW, respectively (Table 5). The individual role of the nine studied genes for improving grain size (GL, GW, and GT) and weight (TGW) were estimated, and the combined impact of these favorable alleles was comprehensively analyzed. ANOVA was used to test the difference between the germplasms possessing favorable alleles and non-favorable alleles in the studied germplasms (Table 5). The frequency of the favorable alleles was recorded to be in the range of 24.7% to 66.4%, with the highest for the gene GW8 (with marker InDel1A), followed by GW8 (InDel), GS7 (InDel), GW8 (InDel2B), GS2 (InDel1A), GS3 (InDel), and GS2 (InDel2B), as depicted in Figure S1. All the favorable alleles, except GS3 (InDel) and GW8 (InDel2B), were observed to contribute to the grain length (GL > 8 mm) and thousand grain weight (Table 5). As GL and TGW are positively correlated, these genotypes may be utilized in pyramiding the target genes for longer and heavier grains to simultaneously improve the yield and quality. Average GL of the cumulated FAs were found to be higher compared with the average GL of the cumulated N-FAs depicted in Table 5.

2.5. InDel Polymorphism and Assessment of the Genetic Relationship among the 204 Rice Germplasms

To study the genetic relatedness among the studied germplasm consisting of 204 rice genotypes, fourteen (14) developed Insertion/Deletion (InDel) markers from the nine grain shape, size, and weight related genes were used. Most of the InDel markers amplified 2 bands / alleles, as depicted in Figure 5. Four markers (i.e., qPE9~1-InDel, SLG7-InDel, GW5-InDel, and GS3-InDel) showed two alleles per locus, whereas the rest of the markers showed three allele types for their respective genes (Table 5). The major allele frequency ranged from 0.5196 to 0.9069, with an average value of 0.6903. The studied markers also revealed higher gene diversity (D) ranging from 0.1730–0.5246, with an average of 0.4073, indicating that the genotypes in the studied germplasm possess a considerable range of gene variations that can be further exploited. This statement is further strengthened by the higher values of the polymorphism information content (PIC) values, which have an average value of 0.3310 (0.1653–0.4359). The maximum PIC value was observed for the marker GW8-InDel (0.4359), followed by GS5-InDel1A (0.4145), GW8-InDel2B (0.4023), and GS2-InDel1A (0.4018), as mentioned in Table 6. The Average value of the observed heterozygosity was very low (0.0193), indicating that the rice germplasm under study was mostly homozygous and had uniform lines. Among all the studied markers, GS7-InDel (for GS7 gene) showed considerable heterozygosity in its results compared to the other markers. The study showed that InDel markers (i.e., GW8-InDel, GW8-InDel2B, GS5-InDel1A, and GS2-InDel1A) of the GW8, GS5, and GS2 genes are highly informative regarding these traits and can be used to understand the genetic variations in germplasm, whereas the rest of the markers are moderate to slightly informative for these traits in this study (Table 6).
In order to understand genetic variations and distinctiveness in the selected germplasm, an un-weighted neighbor joining tree was constructed (bootstraps value of 10,000) based on a dissimilarity index calculated from allelic data in the bit data format (0 and 1 indicating the absence and presence of alleles, respectively) using the Otsuka–Ochiai coefficient [47,48]. The Formula for calculating the coefficients was
d i j = 1   a ( a + b ) ( a + c )   .
Based on cluster analysis, 204 germplasms were classified into six distinct clusters, encircled separately, as illustrated by the UPGMA tree in Figure 6. The three major and three minor clusters showed distinct grain characteristics. Major clusters were designated as Cluster I, Cluster II, and Cluster III. Cluster I consisted of 80 genotypes that can be further divided into two sub-clusters, IA and IB. Sub-cluster IA consists of 35 genotypes, having the highest average grain length (GL) of 9.58 mm. The average grain width (GW) and average grain thickness (GT) were 2.70 mm and 2.09 mm, respectively, whereas the thousand grain weight (TGW) of this sub-cluster was 27.07 g. Likewise, sub-cluster IB consists of 43 genotypes, with an average GL of 8.78 mm, an average GW of 2.76, an average GT of 2.07, and an average TGW of 25.52 g. The germplasm in cluster I contains extra-long grain rice genotypes that can be utilized for breeding long grain rice varieties. The major Cluster II, consisting of 35 genotypes, comprises the germplasms with an average GL, GW, GT, and TGW of 8.05 mm, 2.95 mm, 2.14 mm, and 25.36 g, respectively. This cluster contains germplasms with long and bolder grains that can be utilized in breeding programs, where grain length along with grain width and thickness are under consideration. Major Cluster III included 74 germplasms, with a mean GL of 7.38, a mean GW of 3.09 mm, a mean GT of 2.29 mm, and a mean TGW of 25.81 g, illustrating that this group consisted of rice germplasms with shorter and bolder grains. This germplasm can be utilized for short and thicker grains with a higher grain weight. The other three minor clusters contained 15 germplasms, as depicted in Figure 6.

2.6. Estimation of Population Genetics for Grain Size and Weight Based on Fourteen InDel Markers

To estimate the genetic relationship among the populations of the 204 rice genotypes in the germplasm, the total rice germplasm was divided into four sub-populations according to grain type. Extra-long grains with an average grain length (GL) of more than 9.5 mm comprising 23 rice germplasms, long grains with average AGL in the range of 8.5–9.5 mm comprising 48 rice germplasms, medium grains comprising 78 rice germplasms with an average GL between 7.5–8.5 mm, and a short grain type containing 55 germplasms with an average GL below 7.5 mm. Principal Coordinate Analysis (PCoA) was used to establish the genetic relationship of all the germplasms based on fourteen InDel markers, as depicted in Figure 7. A scatter plot was constructed with two first coordinates that collectively explain 57.3% of the total genetic variation and separate the germplasm into four types of distinct clusters according to their grain types. These results are also in agreement with the results depicted in UPGMA and the dendrogram.
These four sub-populations were further investigated based on the InDel marker binary data in order to separate the total molecular variance into variance within and between sub-populations. The study demonstrated that the total molecular variance was partitioned into two, of which the maximum variance (89%) was observed within the population, and the minimum was found between the populations (11%), as demonstrated in Figure 8. The results extracted from AMOVA analysis (Table 7) clearly showed that there was a maximum (ΦPT = 0.449) and significant (p ≤ 0.001) genetic between the short grain and extra-long grain germplasms / sub-populations, while the lowest (ΦPT = 0.035) genetic differentiation was observed between the long grain and medium grain sub-populations.

3. Discussion

Before this study, the size and weight related traits of rice grains, including grain length, grain width, grain thickness, and thousand grain weight, had not been explored at the same time using a large and diverse germplasm group with the help of InDel markers. New Generation Sequencing (NGS) tools have yielded advanced, cheaper, and more efficient methods for developing such markers. This investigatory research efficaciously shows the capable utilization of deletion / insertion variations (DIV) that naturally accrue in the rice genome. InDel polymorphisms are the second most abundant (after SNPs) forms of genetic variations in animals and plants, with great diversity. Moreover, previous studies only showed the contributions of the reported genes in regulating these grain traits separately [11,15,16,19,20,59,
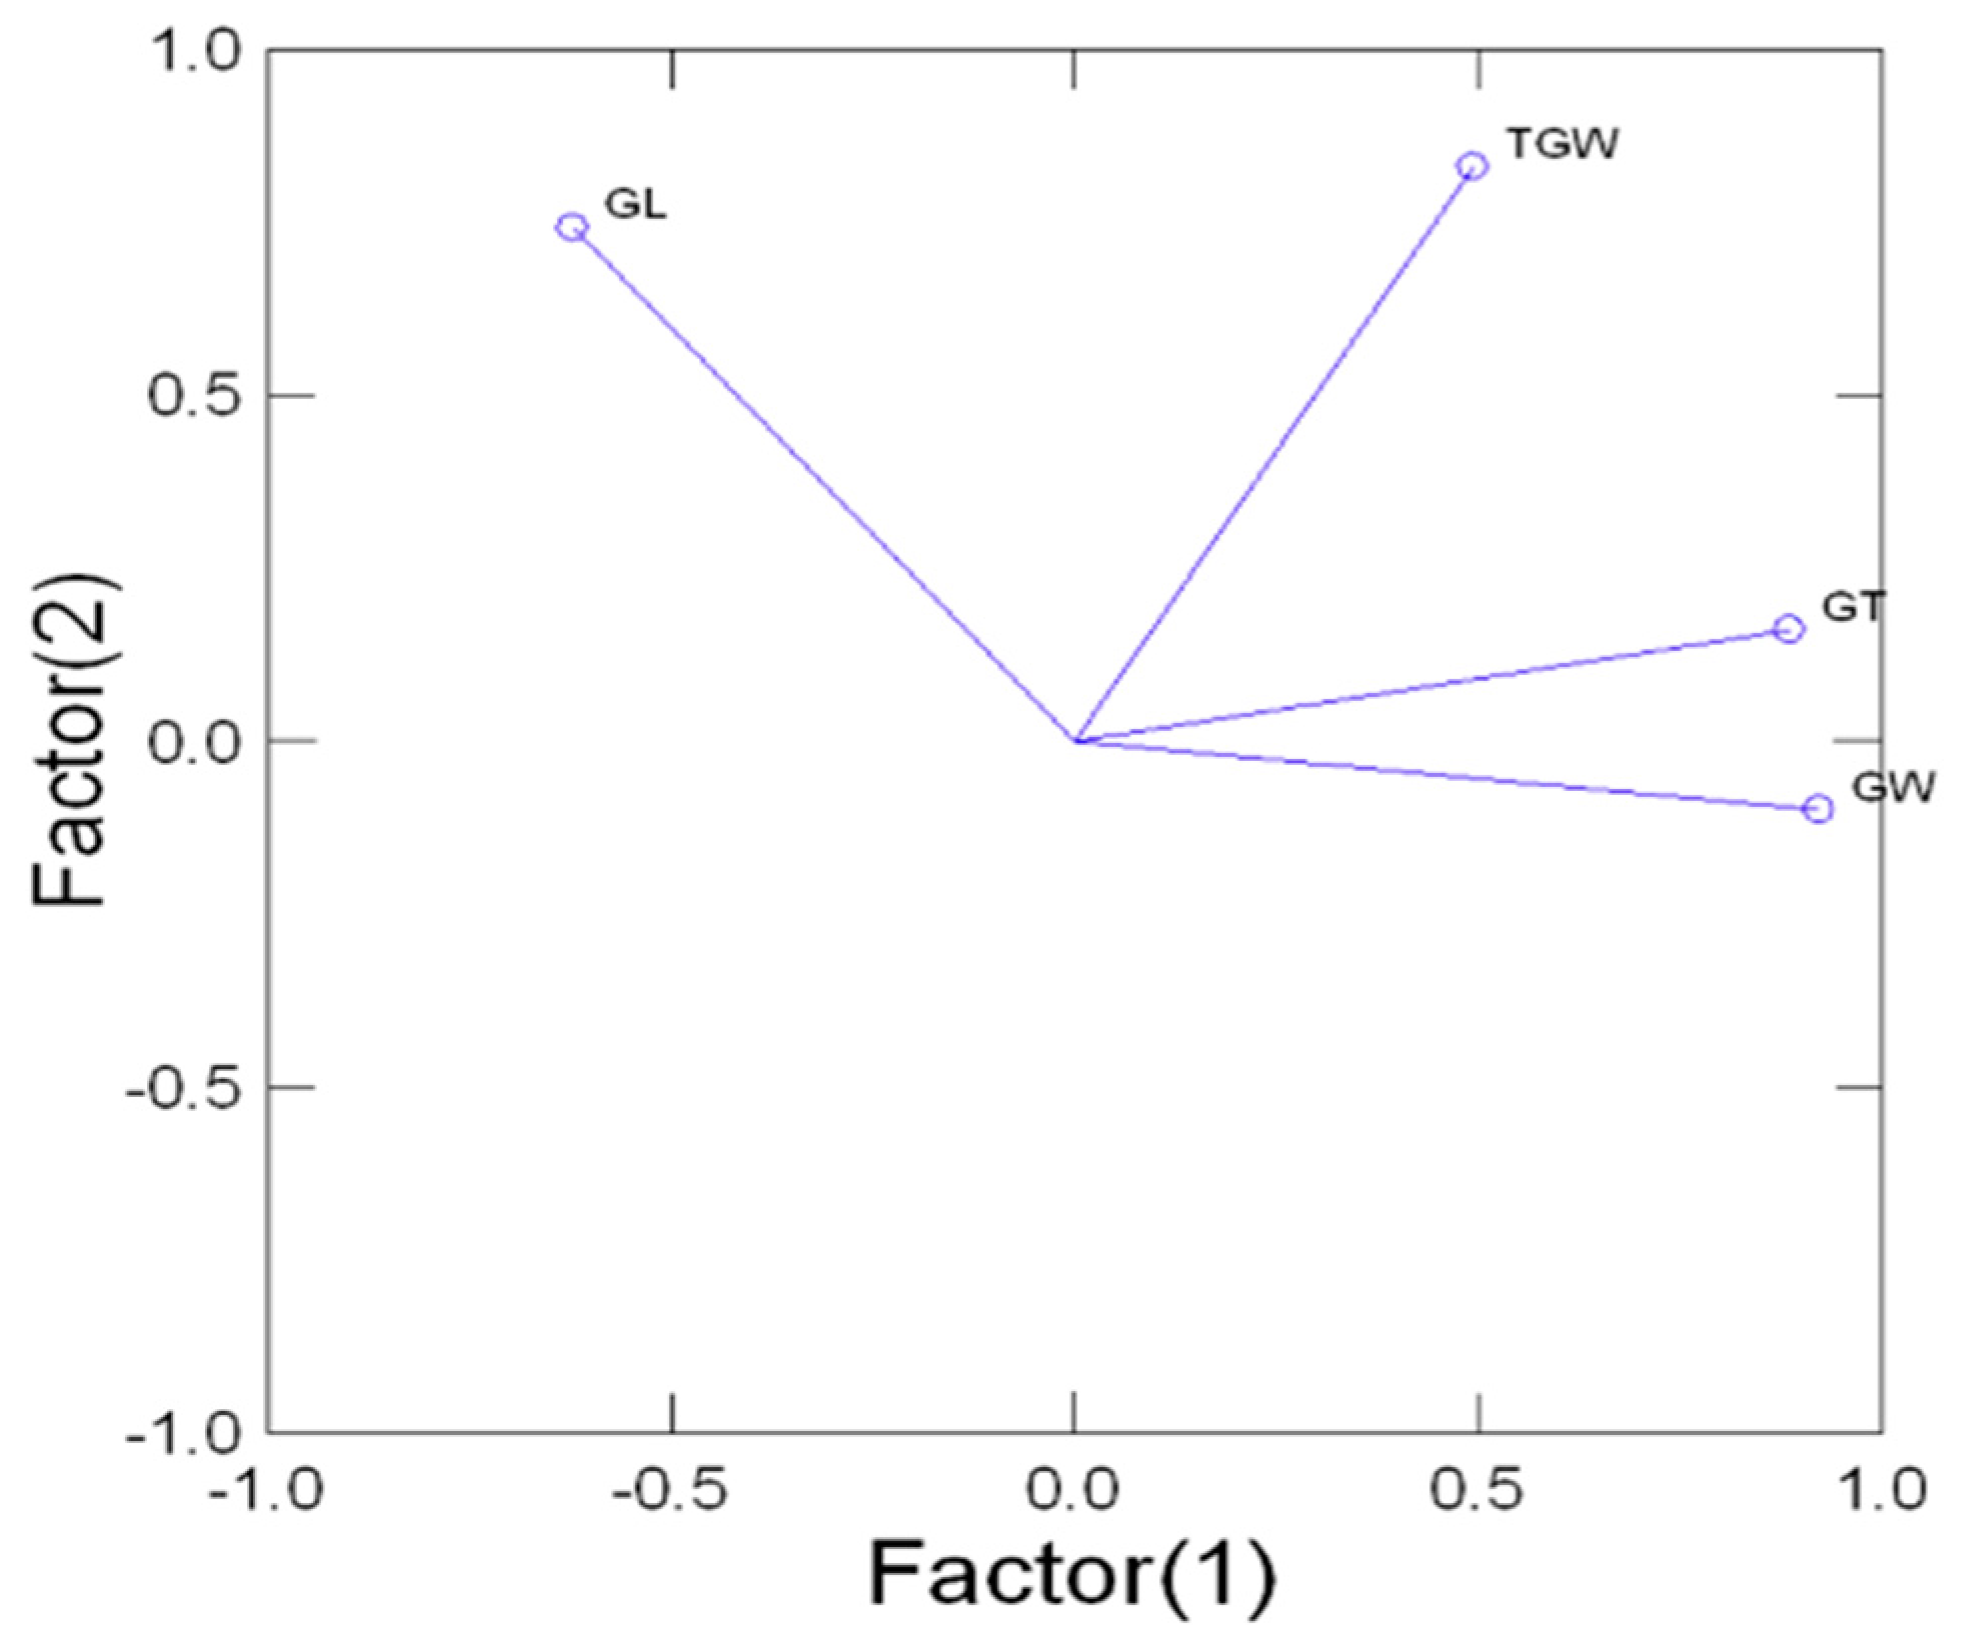
60]. However, recent studies have shown the modes of InDel based allelic contributions in the expression of grain size, as well as weight related traits, the allelic combination of all the InDel marker loci involved in the final texture of the rice grains, and the potential of each loci in regulating these traits in rice. This research can assist in selecting or deselecting genes for rapid breeding strategies. The correlation coefficient values suggest that the thousand grain weight (TGW) was positively influenced by the other studied grain size traits but with a different aptitude. The TGW can be improved by using all three studied grain traits—most importantly GT, which contributes 49%, followed by GW and GL, which contribute 37.4% and 24.9% of the final grain weight, respectively. These findings are in agreement with those of previous studies [19,54,61,62], which showed that grain weight is significantly correlated with grain size. The present study further showed that the thickness of rice grains was most strongly correlated with grain weight, followed by width, whereas the length of the grains was the least associated, suggesting that selecting for grain thickness is more fruitful for heavier grains (Table 2, Figure 4).
In the present study, two hundred and four rice genotypes were used to investigate alleles in nine different genes that regulate size and weight in rice grains, using InDel markers. In the past few years, PCR based InDel markers have gained popularity in variation studies because of their reproducibility, easy to use nature, and co-dominant inheritance [
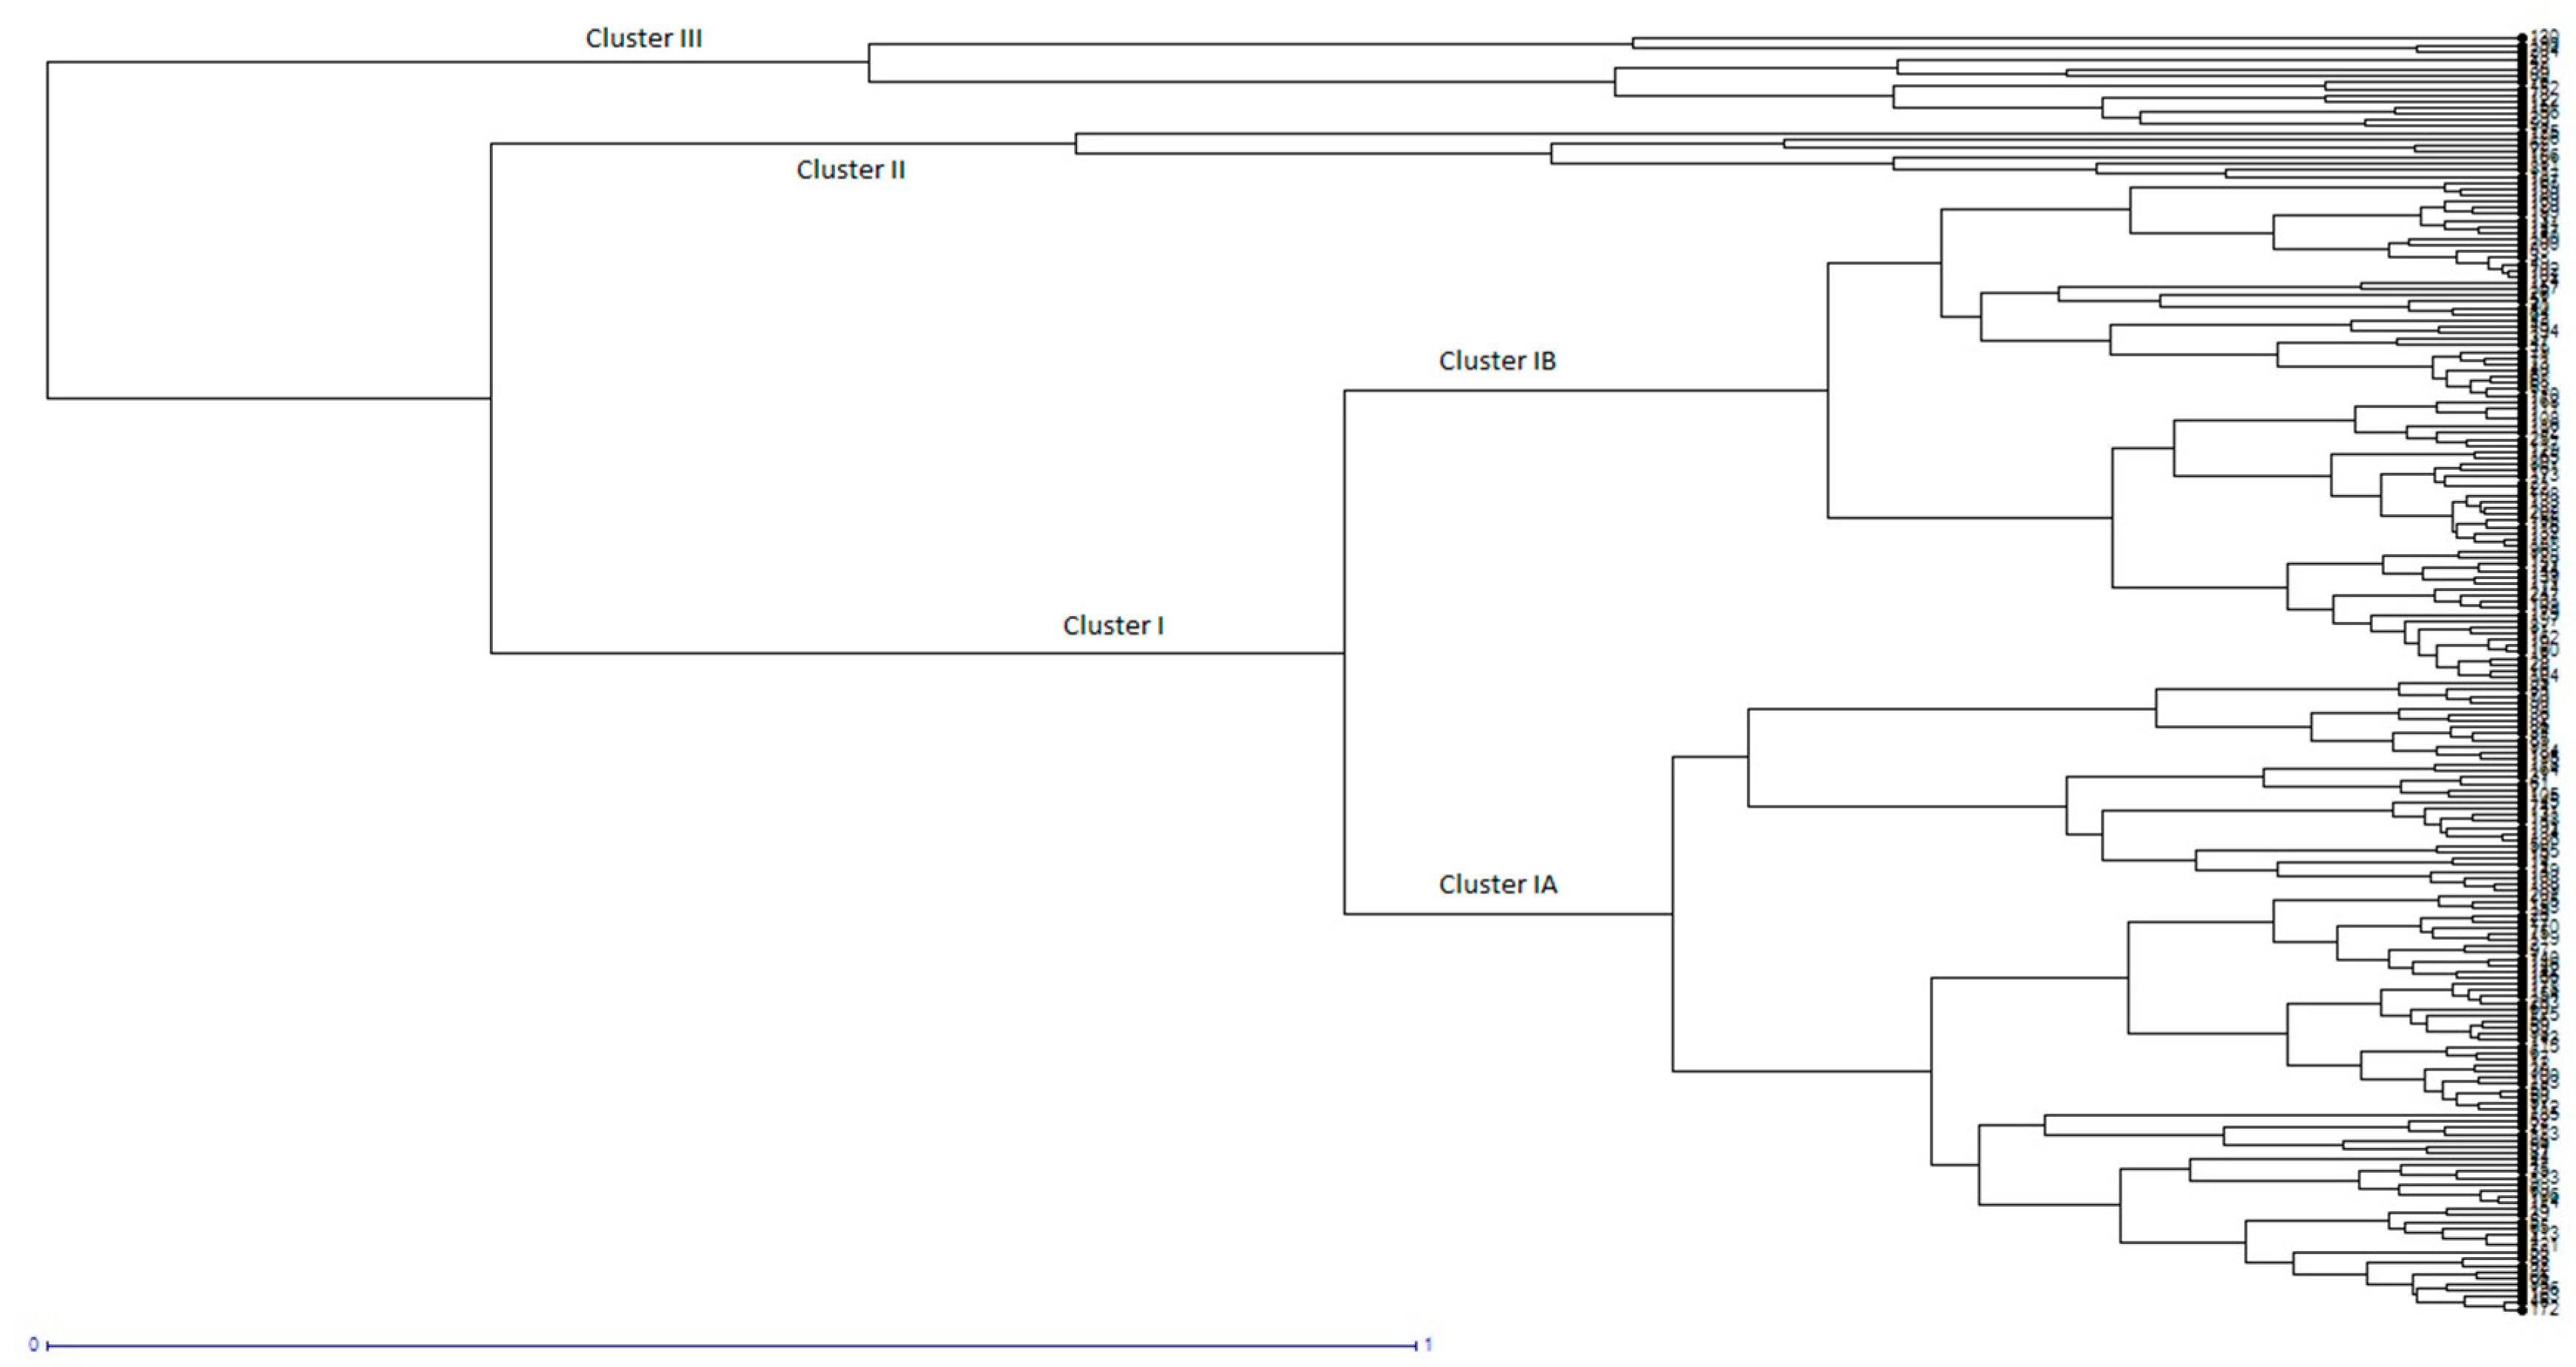
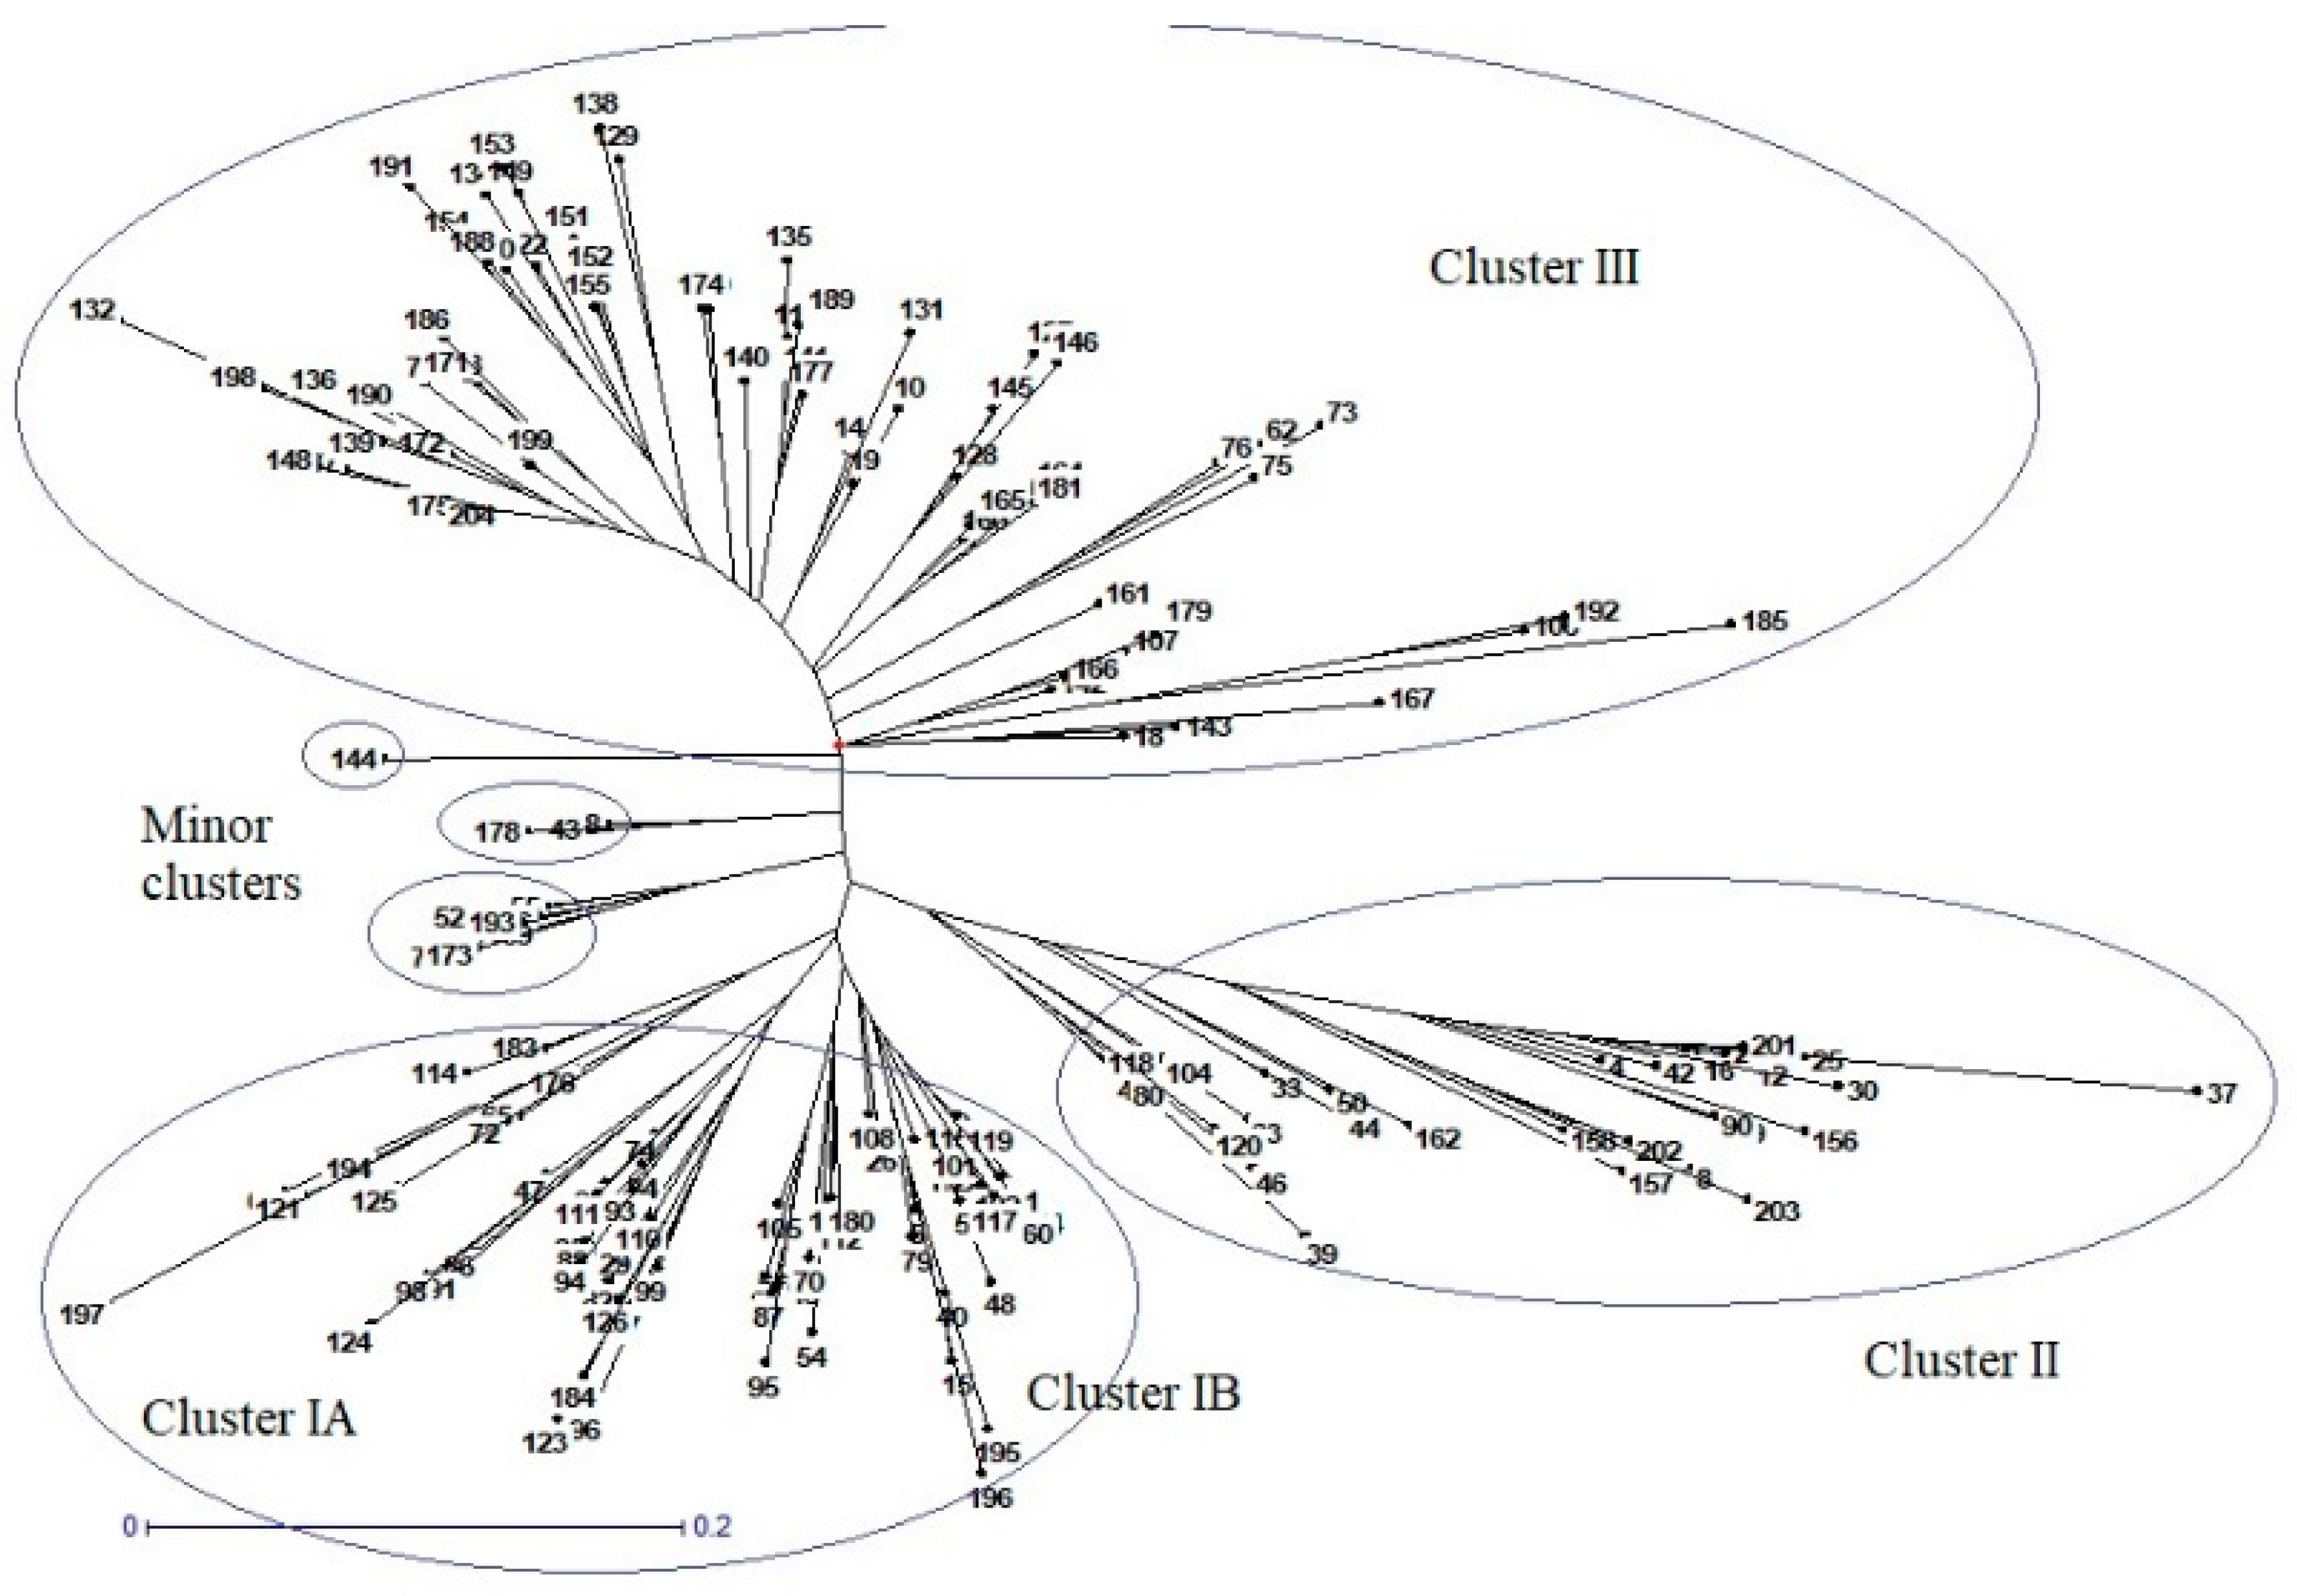
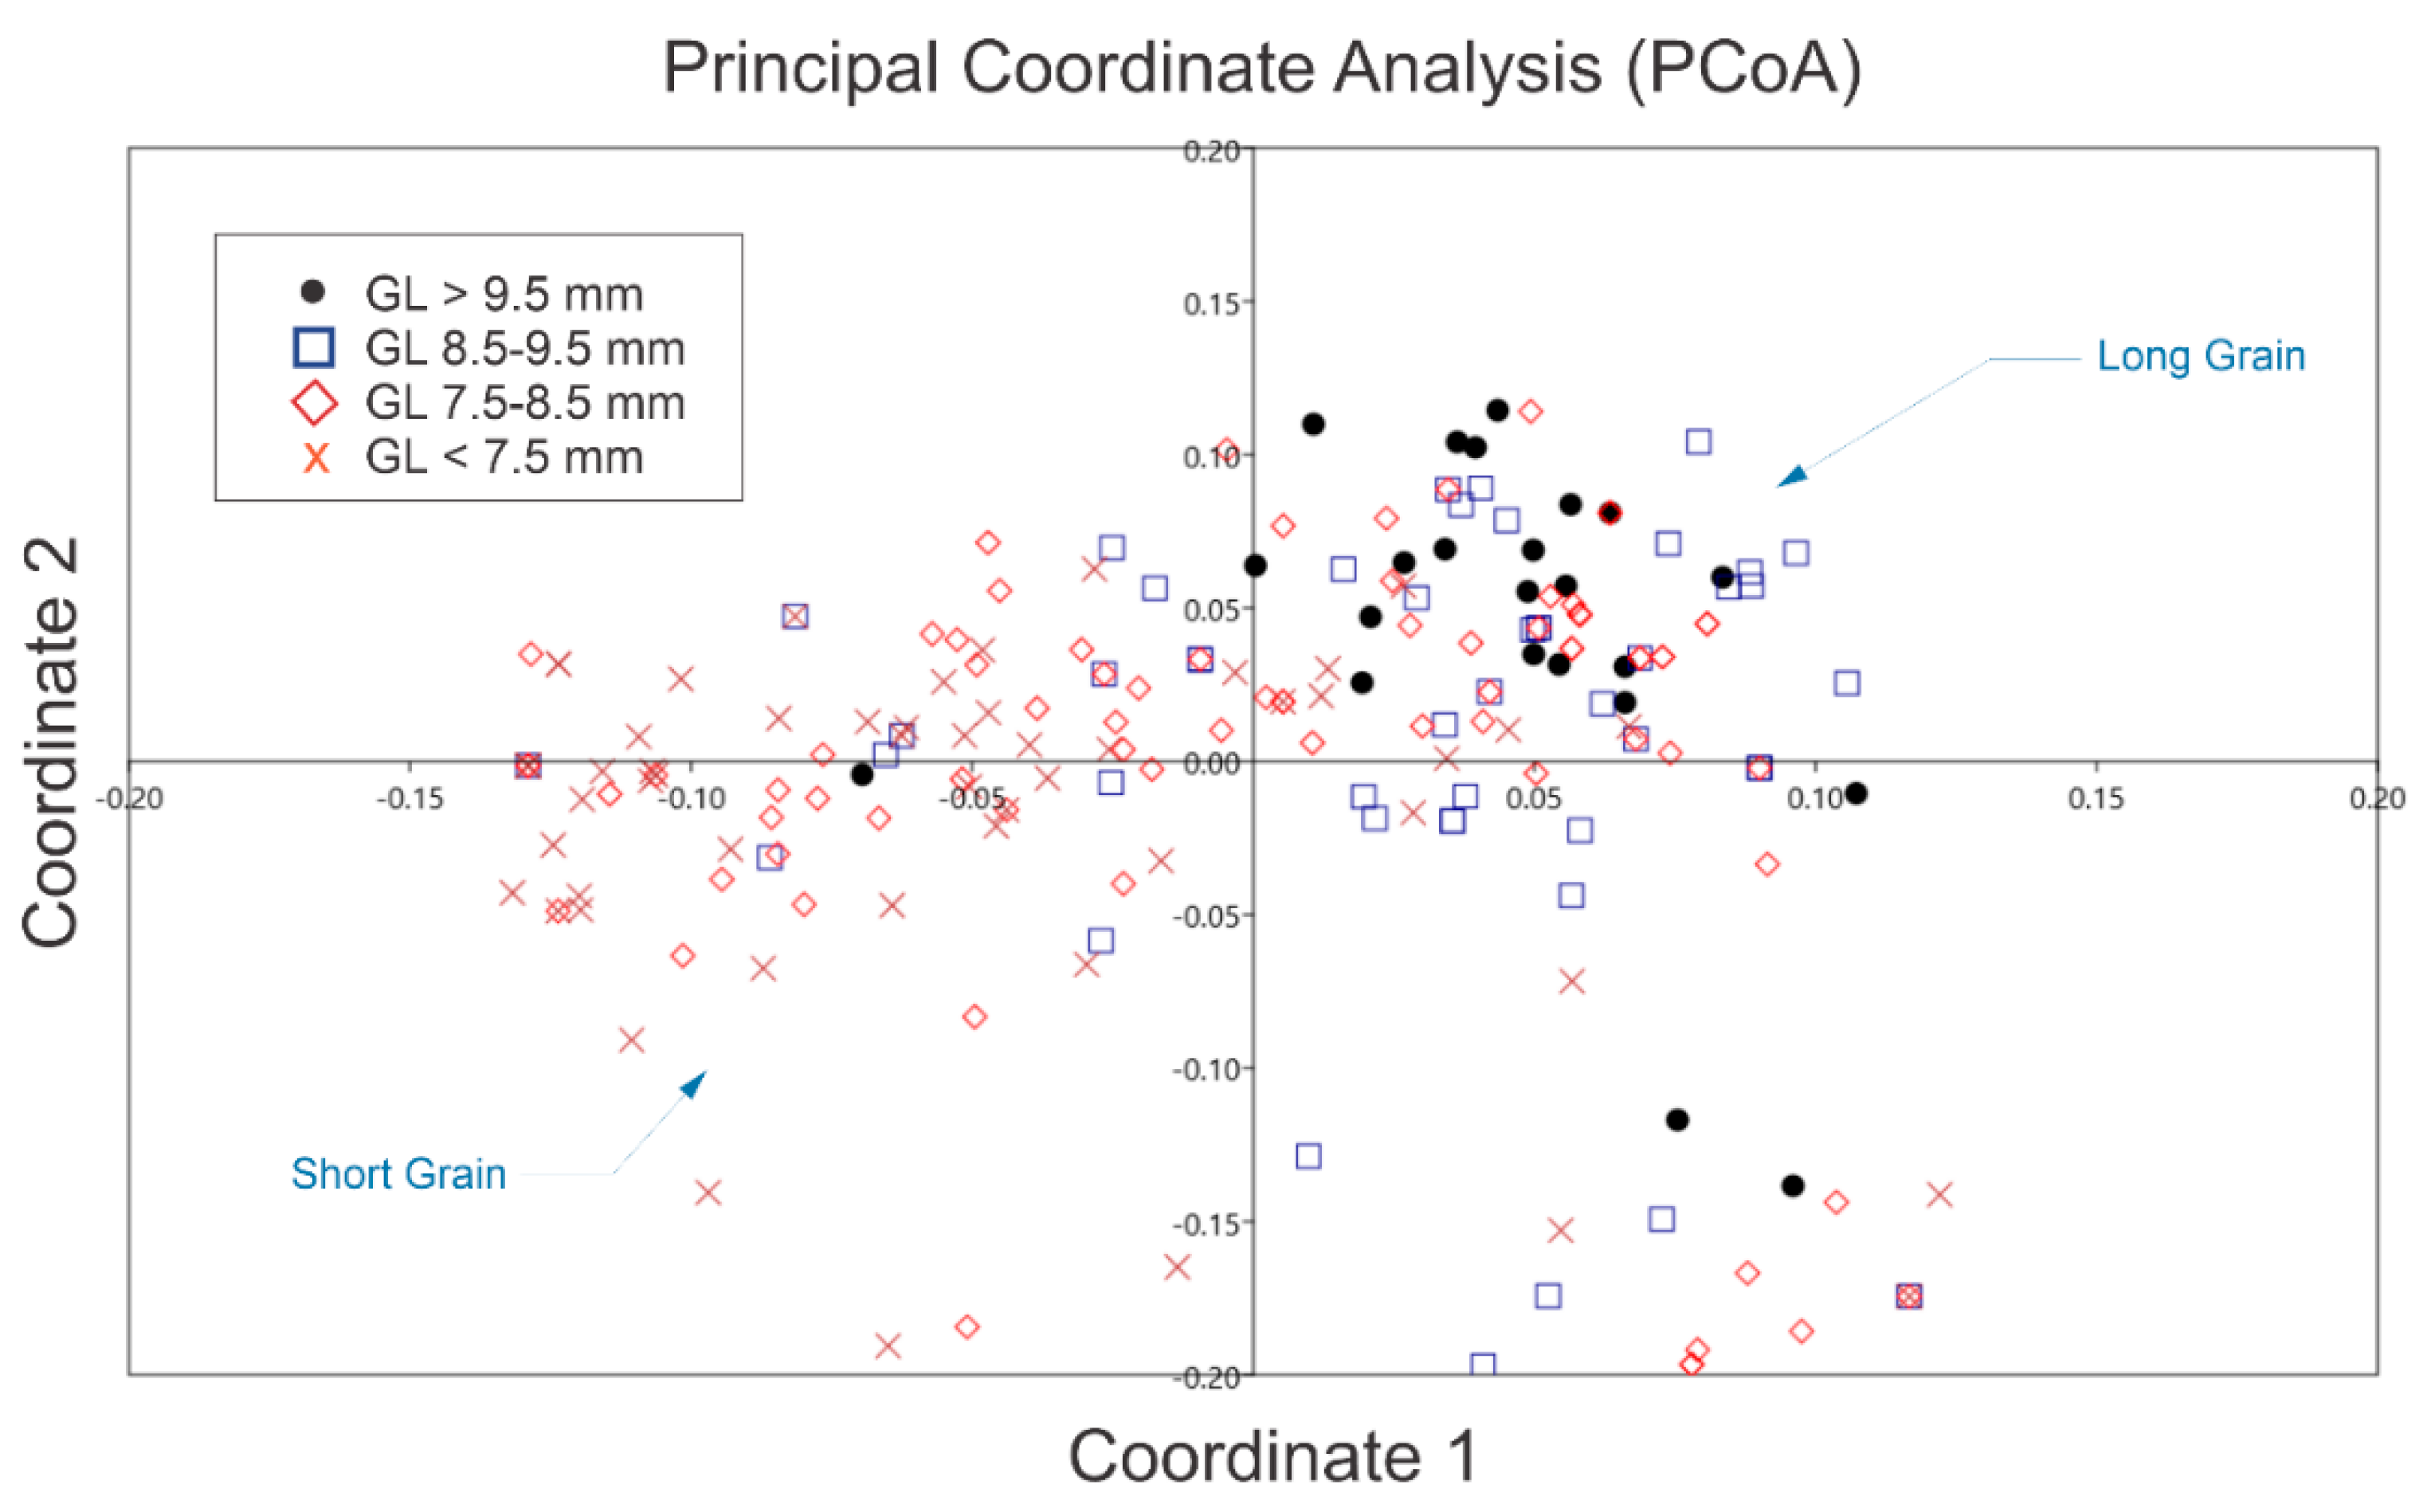
40]. Dendrograms were used to separate the germplasms according to their grain size and weight and divide the InDel marker data into distinguishable clusters that could be used for breeding preferential grain appearances and weights. Results of the genetic diversity (D) analysis and InDel based polymorphism information content (PIC) values (
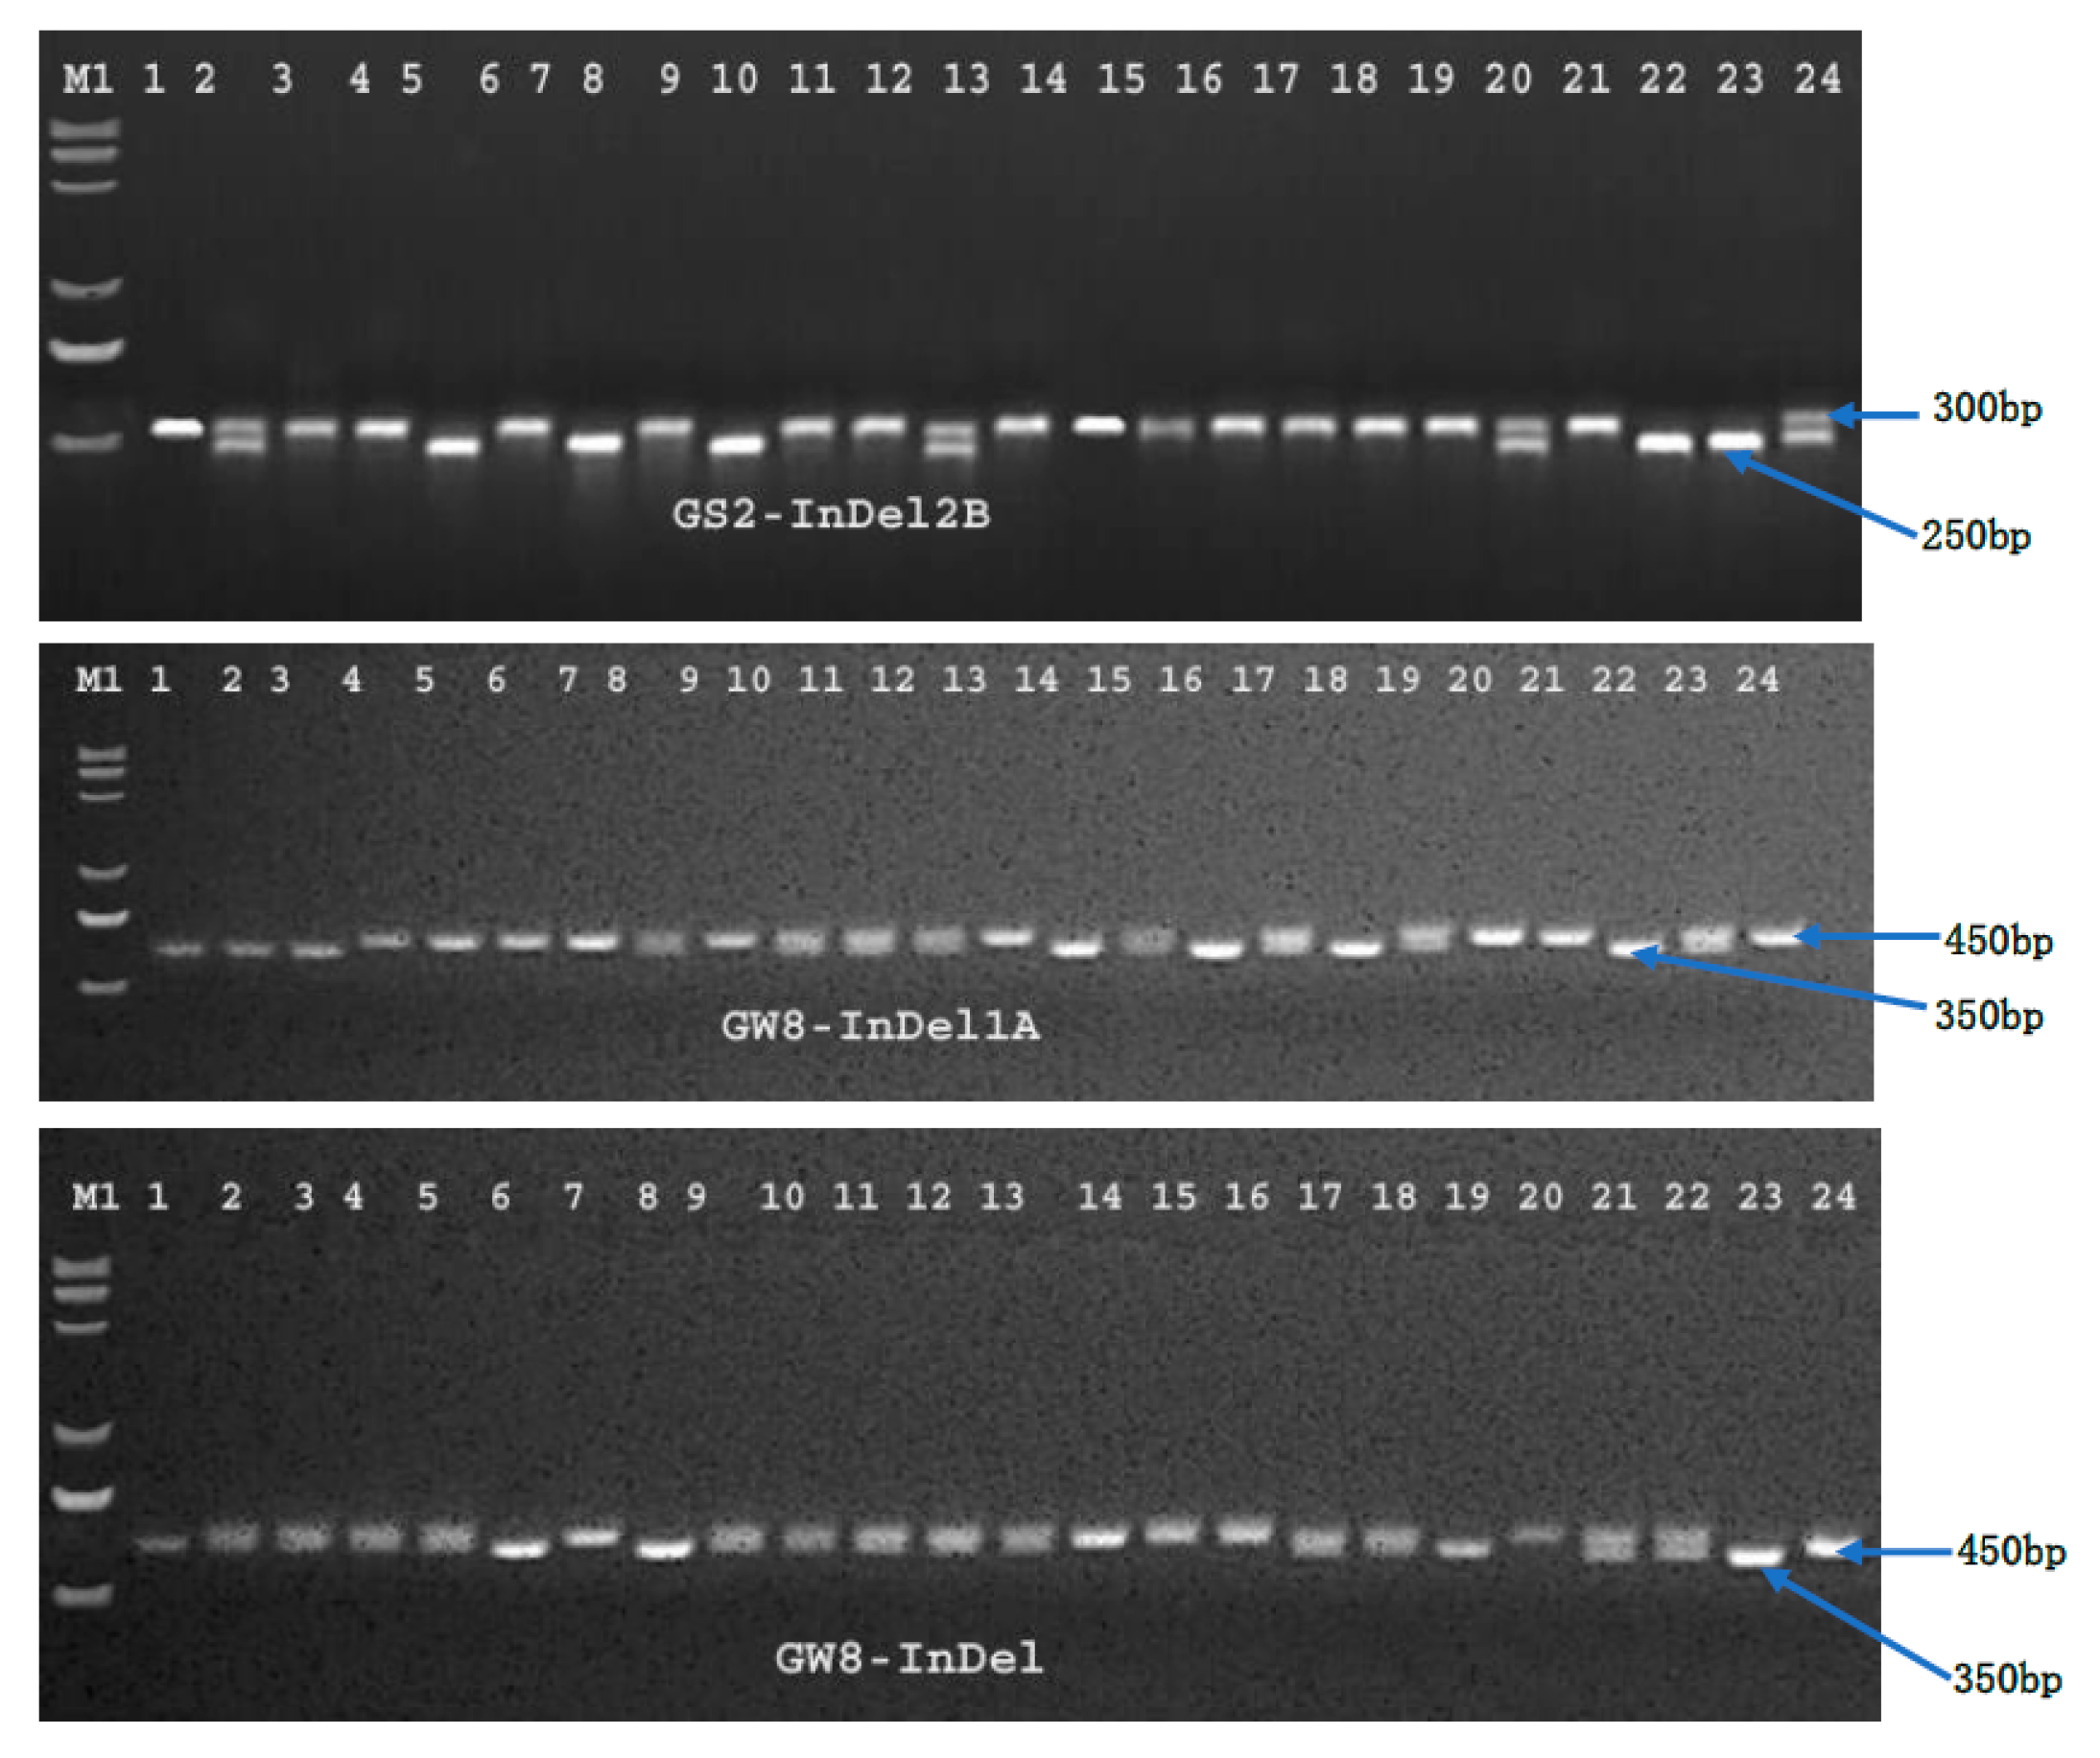
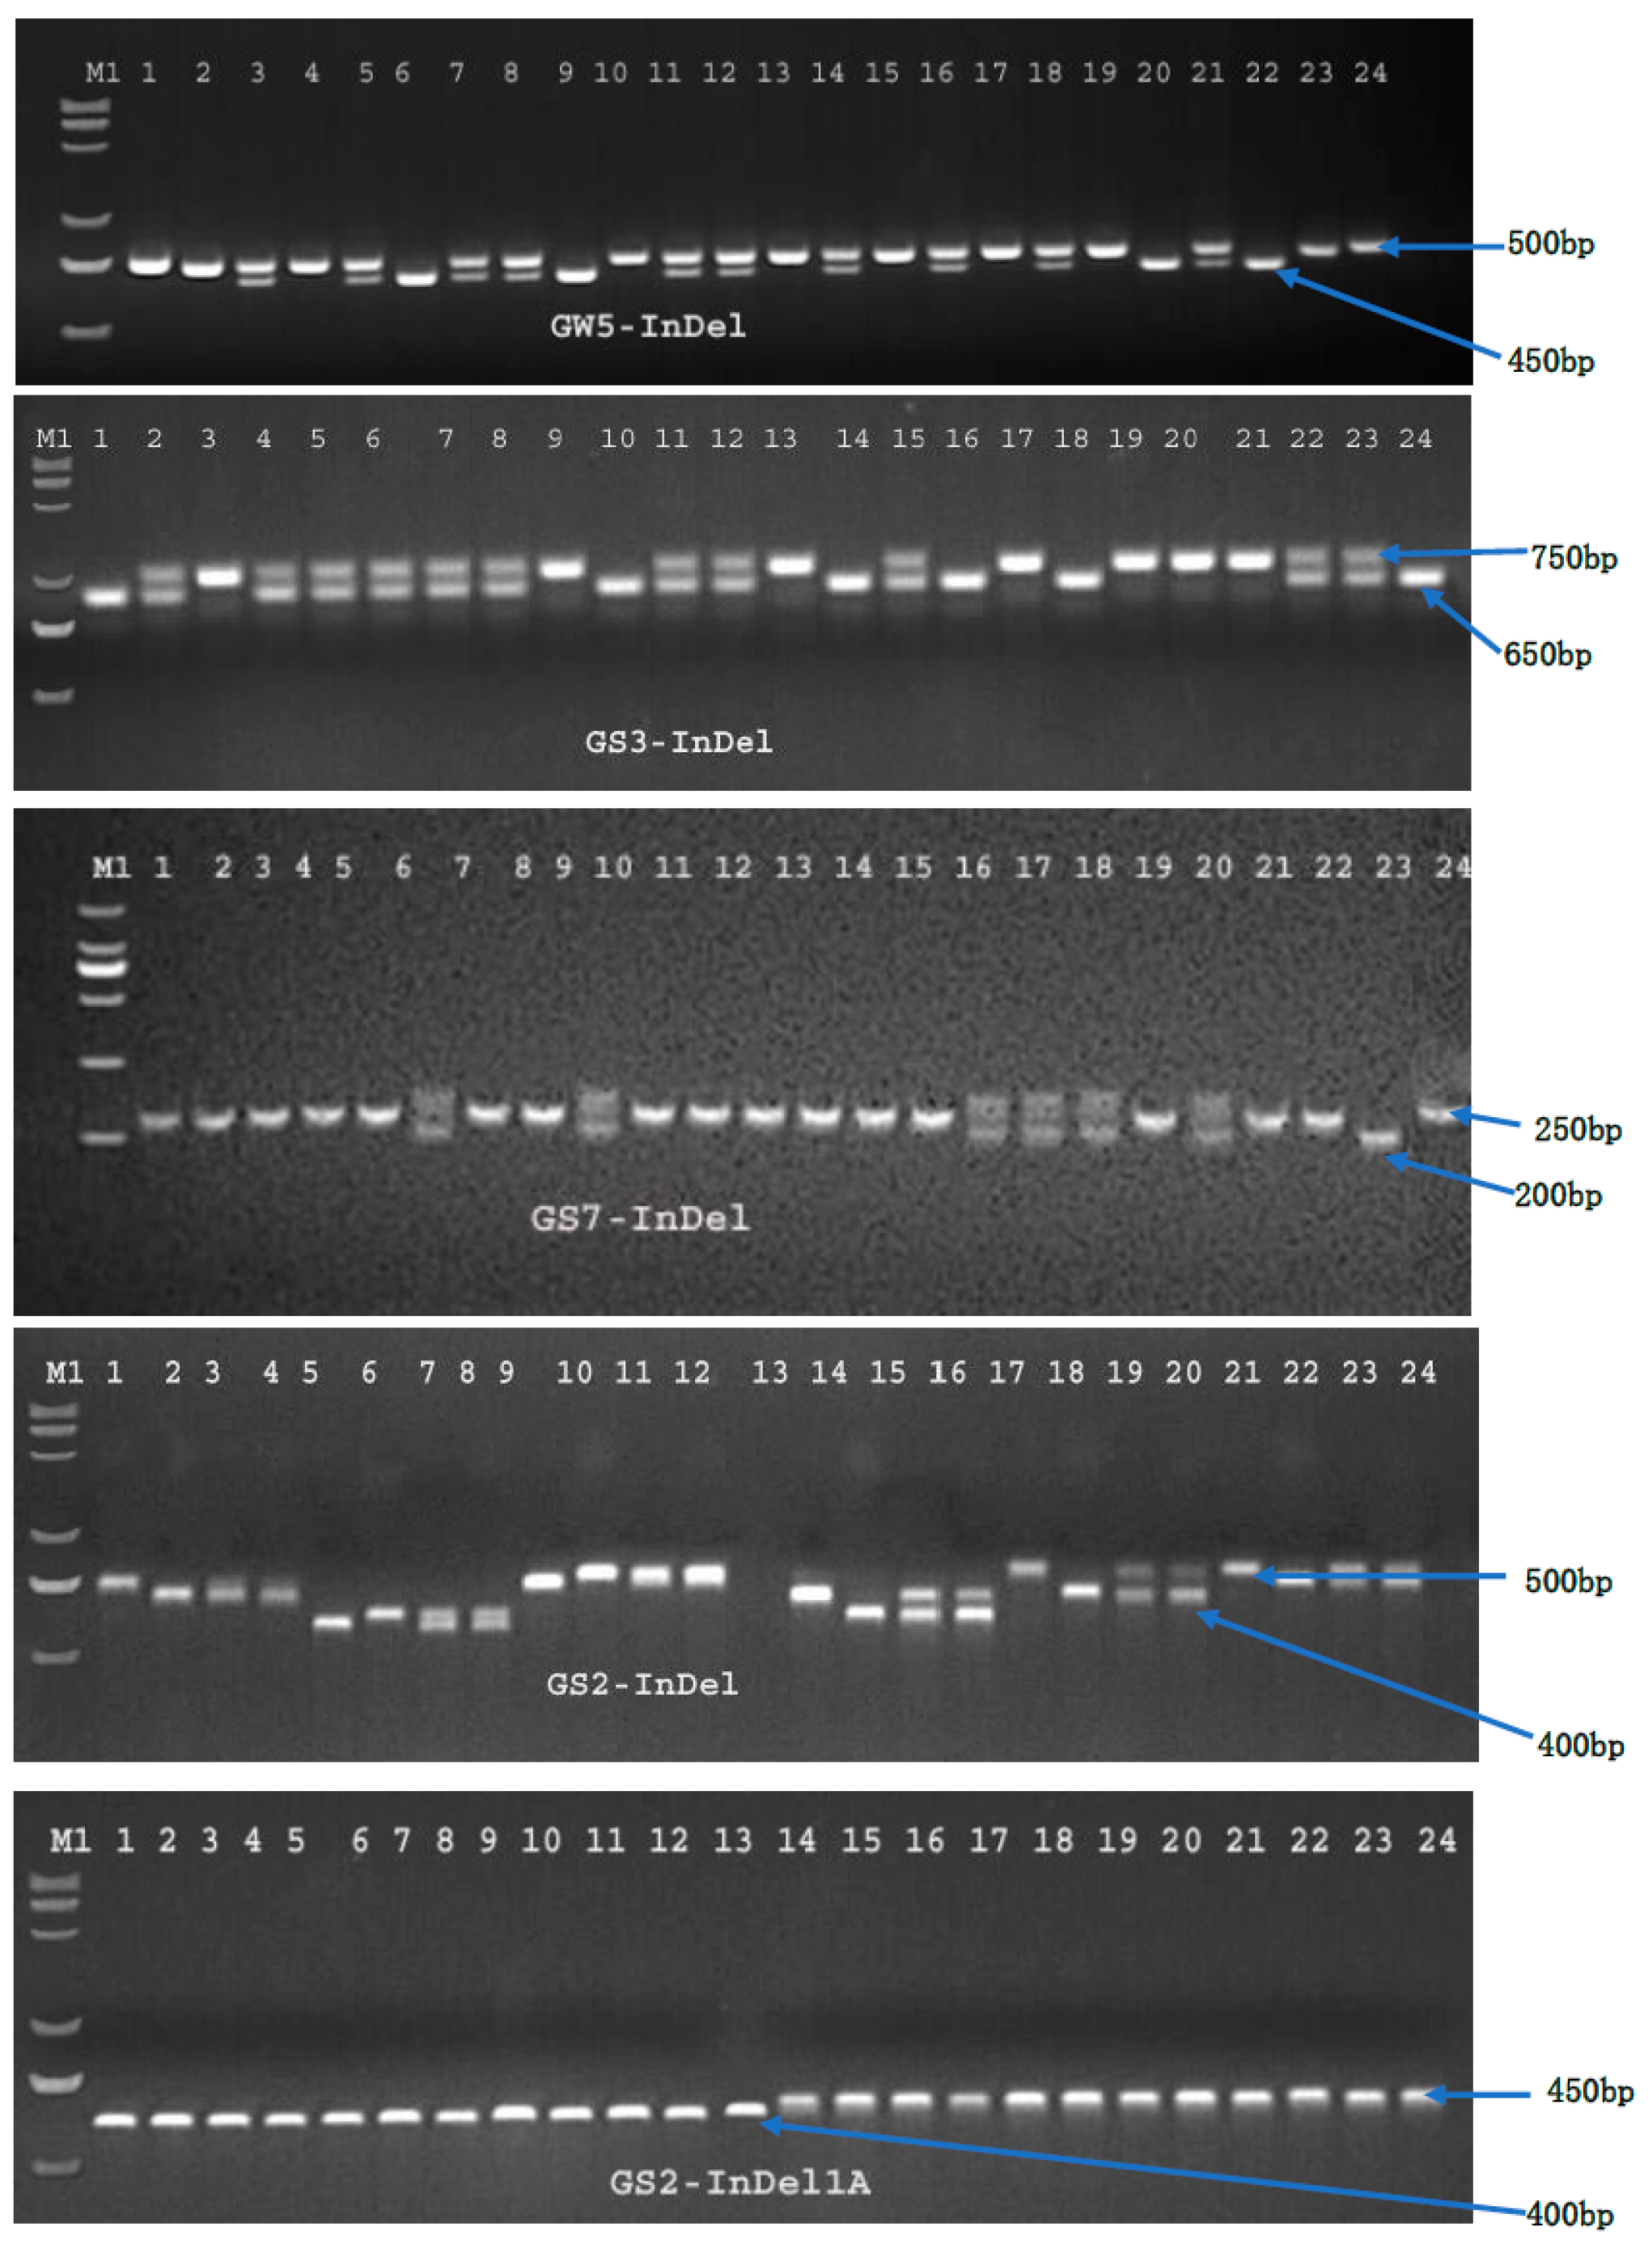
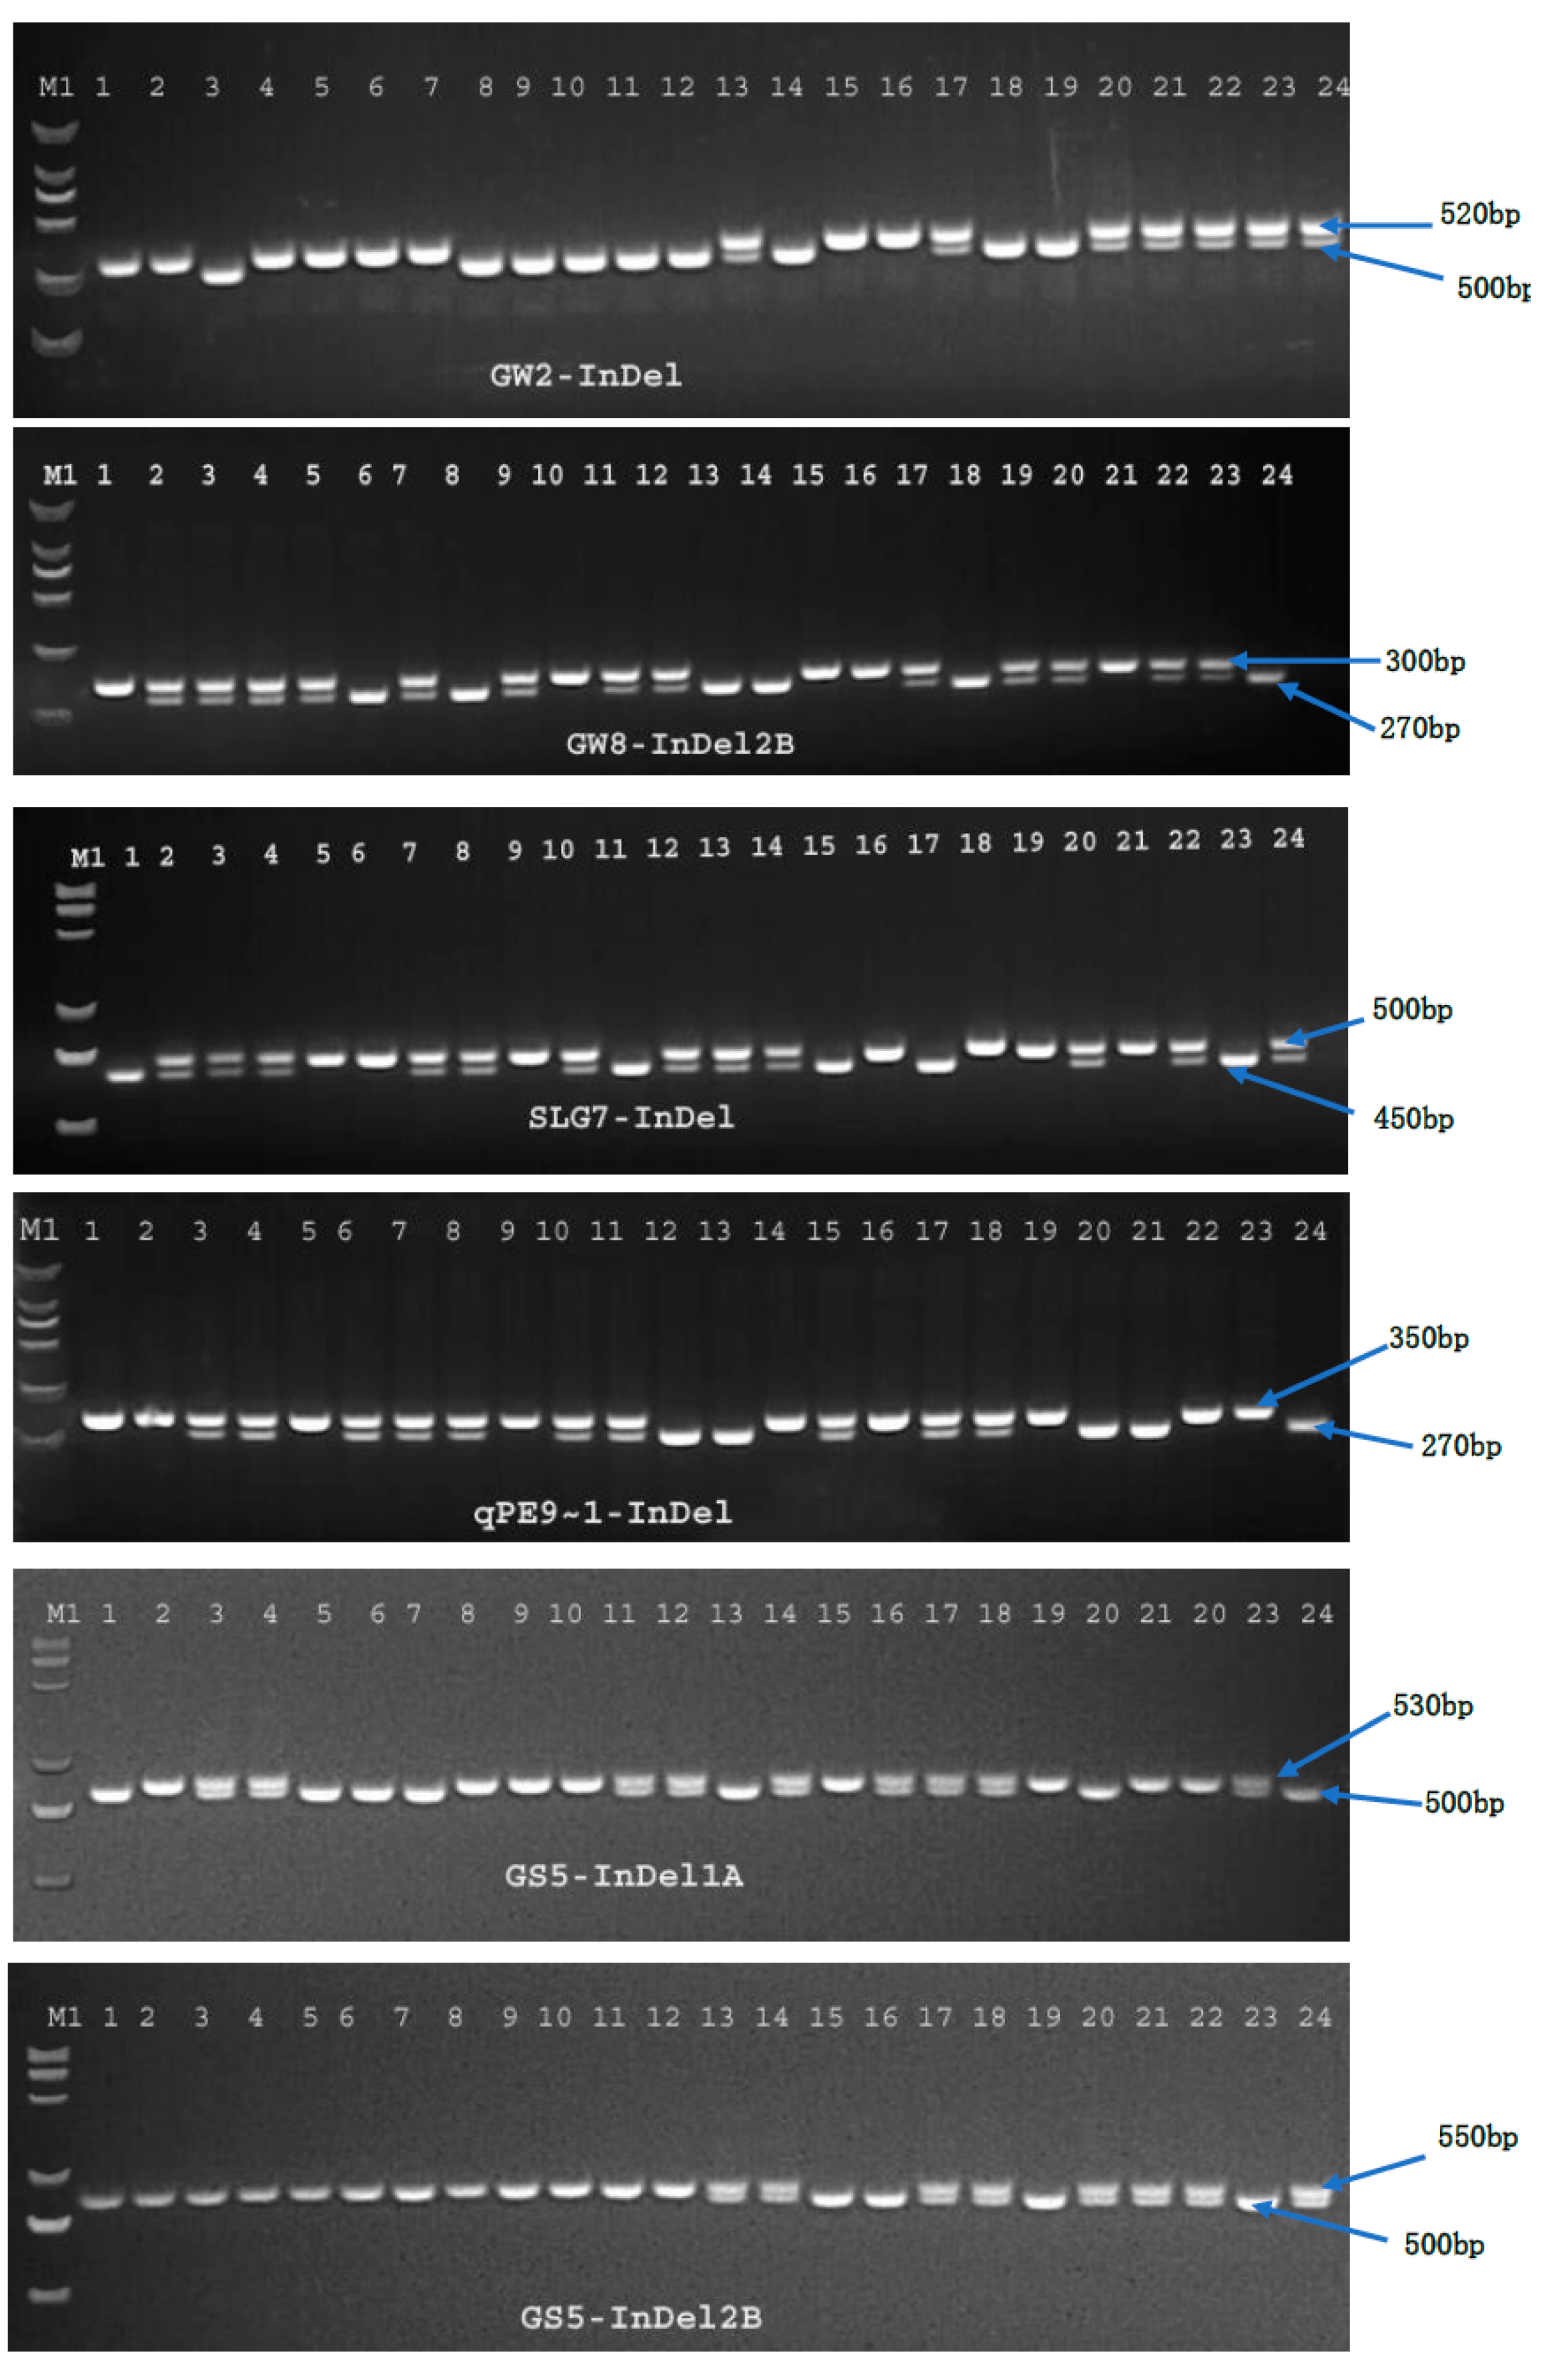
Table 6) indicate that the InDel markers (GW8-InDel, GS5-InDel1A, GW8-InDel2B, GS2-InDel1A) are highly informative (D ≥ 0.5; PIC ≥ 0.4) for the studied traits, whereas the rest of the markers were found to be moderately (D 0.3–0.5; PIC 0.2–0.4) to slightly/less (D ≤ 0.3; PIC ≤ 0.2) informative. These InDel markers show potential to be efficiently used to study the genetic variations (DIVs) in rice germplasm. Only two InDel markers showed very low values (gene diversity ≤0.3; PIC ≤ 0.2) for D and PIC, indicating that the deployed markers were fairly informative [20]. Furthermore, this investigatory research also showed the capability of InDel markers to distinguish a diverse rice germplasm into distinctive groups (Figure 6) with different combinations of grain lengths, widths, thicknesses, and weights that could be used to breed desirable genotypes with better potential for higher market value rice grains and heavier grains for a better yield.
This study successfully identified 25 InDel marker derived loci highly associated (p ≤ 0.05) with grain size and weight in rice (Table 4). A total of 38 alleles were identified, out of which 27 alleles were major and were found in more than 20 genotypes. In the case of GL, five markers (GW8-InDel, GW8-InDel1A, GW8-InDel2B, GS2-InDel1A, and GS2-InDel2B) corresponding to two genes (GW8 and GS2) were found to have a highly significant association with GL at p ≤ 0.01. Similarly, two markers (GS3-InDel and GS5-InDel1A) corresponding to two genes (GS3 and GS5) were found to have a significant association with GL at p ≤ 0.05. In the case of GT, five markers (GW8-InDel, GW8-InDel1A, GW8-InDel2B, GS2-InDel1A, and GS2-InDel2B), corresponding to two genes (GW8 and GS2), were found to have a significant association with GT (at p ≤ 0.01). Similarly, two markers (GS3-InDel and GS7-InDel), corresponding to genes GS3 and GS7, were found to have a significant association with GT (at p ≤ 0.05).
For GW, five markers (GW8-InDel, GW8-InDel1A, GW8-InDel2B, GS2-InDel1A, and GS2-InDel2B), corresponding to genes GW8 and GS2, respectively, were found to have a significant association with GW at p ≤ 0.01. Similarly, one marker (GW5-InDel), corresponding to gene GW5, was found to have a significant association with GW at p ≤ 0.1. For TGW, one marker (GW8-InDel2B), corresponding to gene GW8 was found to have a significant association with GW at p ≤ 0.01. Similarly, three markers (GW5-InDel, GS5-InDel1A, and GS5-InDel2B), corresponding to two genes (GW8 and GS5) were found to have a significant association with GW at p ≤ 0.05.
The SLG7 gene is known to regulate the grain size in rice via increased cell division, longitudinally resulting in longer grains [21]. In the present study, the SLG7-InDel marker showed a significant (p ≤ 0.05) association with the thousand grain weight (TGW), which is also in agreement with the results of other researchers. This gene encodes the TONNEAU1-recruiting motif protein, which was found by many researchers [37] to be responsible for grain appearance by altering cell divisions, thus having significant effects in regulating grain weight, as well. Notably, GW5 gene was found to have a significant contribution in controlling GW and TGW (p ≤ 0.05), also revealed by previous studies [23,24,25,26], which showed that this gene encodes a calmodulin-binding protein and GW5 physically interacts with calmodulin AsCaM1-1, which is responsible for grain width in rice. Recent studies have also demonstrated that this gene is responsible for regulating TGW (a significant correlation with p ≤ 0.05), as TGW is directly and highly associated with GW (Table 4), thereby confirming its utilization in grain yield improving objectives in rice breeding programs. Previous studies also identified this gene for controlling seed width and weight in rice [23,24,63].
Previous studies showed that GS3 was among the first reported genes to have minor effects on grain thickness and width. The domains on its encoded protein have been reported to regulate cell divisions in the upper epidermis of the glume inside the rice seed, causing minor effects on cell size [29]. In the present study, the GS3-InDel marker was found to be significantly associated (p ≤ 0.05) with grain length and grain thickness, which is consistent with previous reports [20,28,31]. Another InDel marker for the GS7 gene (GS7-InDel) was also found to be significantly (p ≤ 0.05) related with grain length and thickness. Our studies showed that the investigated alleles for both genes GS3 and GS7 affectively regulated grain length and thickness in the rice (Table 3). Previous studies [20,30] also reported that the germplasm carrying different alleles of the GS3 gene with different allele combinations of GS7 produced different grain lengths and thicknesses. Shao et al. [30] also reported that GS7 is a strong QTL known to regulate grain size and controls grain length, roundness (thickness), and area (size) in rice. Ngangkham et al. [20] also found this gene to be associated with GL and GT, thereby playing a significant role in regulating grain size. For GW2 gene, the results for gene associations with any trait were non-significant, but in previous studies, the gene was found to control the grain width in rice grains [12]. Ngangkham et al. [20] also found no association of this gene with any of these traits using STS (Sequence-Tagged Sites) markers, thus emphasizing the ineffectuality of the markers used. This might be due to inter- and/or intra-allelic interactions that may be subjected to further studies.
Among all the studied genes for grain size and weight, GW8 was detected to represent a highly significant (p ≤ 0.01) association with all the grain size related traits, thereby suggesting its great importance in regulating grain size in rice. The GW8 bearing genotypes were reported to have a higher grain length and grain length-width ratio [20]. The scanning results of the electron microscopy analysis of the lemma in GW8.1 carrying NILs showed that the inner epidermal cell length was higher than the lines without this gene, indicating that GW8.1 might be responsible for regulating cell elongation [64]. GW8 (OsSPL16) encodes a protein that is positively associated with cell proliferation [31]. Its higher expression promoted cell division and grain filling, consequentially increasing grain width and yield in rice. Another study also suggested that GW8 suppresses the expression of the GW7 gene and plays a significant role in controlling grain size [21]. In the present study, GW8 was determined to regulate grain length, width, and thickness. All three InDel markers successfully distinguished the germplasm into two alleles: the A-allele, which is responsible for shorter, thicker, and wider grains, and the B-allele, which carries genotypes possessing longer but narrower grains. This is due to the fact that grain length (GL) is negatively correlated with grain width (GW) and grain thickness (GT), as depicted by correlation analysis in Table 2. Based on these results, the B-allele carrying germplasm may be selected to breed longer grains, and the A-alleles may be screened for broader, shorter, and thicker grains. However, all three traits (i.e., GL, GT, and GW) contributed to the thousand grain weight (as suggested by the positive correlation between GL, GT, and GW with thousand grain weight), assuming that both alleles contribute to an increased yield. Two markers (i.e., GW8-InDel and GW8-InDel1A) were shown to have highly significant (p ≤ 0.0001) associations with GL, GT, and GW, thus indicating the ample potential of InDel markers in variation studies and genome-wide association studies. The third marker (i.e., GW8-InDel2B) for the GW8 gene was also identified to have a highly significant (p ≤ 0.01) association with GL and GW (Table 5). However, unlike the other two InDel markers for the GW8 gene, GW8-InDel2B also showed a highly significant (p ≤ 0.0001) relationship with GT and the thousand grain weight (Table 4), indicating its potential to be used for all four studied traits to improve the grain size and grain weight in rice.
Two InDel based markers were used for the GS5 gene, and both of these markers showed a significant (p ≤ 0.05) association with only the thousand grain weight. These findings are partially inconsistent with other studies [32,65], which suggested that the GS5 gene is associated with grain width and grain weight in rice. Previously, Lee et al. [63] attained three types of alleles by applying the markers generated from the promoter-region of the GS5 gene, thus demonstrating the relatedness of this gene with grain weight. However, in another study, this gene was reported to participate in the regulation of grain length and grain width [63]. This might be due to higher genetic and/or allelic interactions with other genes/alleles that must be studied more comprehensively. This gene has been reported to have significant importance in regulating grain yield, as concluded by Li et al. [32], who showed that this gene encoded proteins—i.e., the putative serine carboxypeptidase executes its function as a positive regulator of a subset of the transition genes (G1-to-S) of the cell cycle, thereby causing increased cell divisions and resulting in enhanced grain filling and grain weight.
The Present study further explored the previously reported gene GS2 to be highly associated (p ≤ 0.001) with all three-grain size related traits. Out of the three markers, two markers for this gene (including GS2-InDel1A and GS2-InDel2B) showed the potential for GL, GT, and GW, whereas the marker GS2-InDel showed no association with any trait (Table 4). For both markers 1A and 1B for this gene, the germplasm was separated into two groups carrying A- and B-alleles with different grain size traits. In the case of InDel1A, the A-allele was associated (p ≤ 0.001) with a shorter grain length (7.66 ± 0.820 mm) with thicker and wider grains, whereas its B-allele had a germplasm with a longer (8.44 ± 0.908 mm) grain length and narrower and slander grains (Table 5). Conversely, for the other marker, GS2-InDel2B, the A-allele was detected to relate to the germplasm with the longest grain lengths (9.32 ± 0.951 mm) and narrowest grains (the GW average is 2.65 ± 0.303 mm) in the whole germplasm, whereas the genotypes carrying the B-allele possessed shorter grains (7.81 ± 0.742 mm) and wider grains (3.01 ± 201 mm), as depicted in Table 4. This finding suggests that these InDel markers can further be investigated to breed for >9 mm grain lengths. Previous studies also showed that this gene directly controls two important grain size related traits, including grain width and grain length in rice. Researchers showed that its overexpression increased cell enlargement and enhanced cell division in the grain, thus producing longer and wider rice grains [33,34,35,36].
This study further investigated the favorable alleles in the studied germplasm to improve the grain length (>8 mm) with heavier grains. Identifying the beneficial alleles of the target traits is one of the most important prerequisites to improve modern cultivars via introgressions of favorable alleles from a vast gene pool using marker assisted selection approaches. This investigatory research discovered seven favorable alleles for grain length that can be utilized to improve grain size, while keeping in mind the recent criterion for longer grains with improved grain sizes and weights.
This research explored 7 genes and 11 InDel marker associations with grain size and weight related traits in rice. The present study further showed that InDel markers may be used efficiently in research investigations related to genetic variations, genome-wide association studies, germplasm genetic characterization, gene mapping, and other studies to further develop the ease and efficiency of breeding procedures and create more desirable varieties to cope with climate change and food security risks.

4. Materials and Methods

4.1. Rice Material Collection and Phenotyping

The plant material of this experiment included 204 rice germplasms, which included lines with a wide range of grain size related traits. Plant material was received from the Key Laboratory of Crop Genetics and Breeding section, Yangzhou University, Jiangsu province, P.R. China, comprising rice lines with higher yields. The field experiment was carried out in the experimental fields of the research capacity in Yangzhou University (E, N) during the normal rice season (from May to November) in 2018. Sowing of the material was carried out in the nursery for the grain cell, and then the 30 day old nursery was transplanted into well prepared fields following standard agronomic practices in order to assure full expression of the traits. Plant to Plant distance was maintained at 10 cm, whereas row to row distance was maintained at 15 cm. For grain trait phenotyping, data were collected during the stage of plant maturity from the middle plants in the central row of each entry. Grain size related traits (i.e., grain length (GL), grain width (GW), and grain thickness (GT)) were measured in (millimeters) as the average from ten completely mature and filled grains using digital Vernier calipers. Likewise, data for grain weight related traits (i.e., thousand grain weight (TGW)) were measured for 250 carefully counted, filled, and fully mature rice grains using an electronic digital weighing balance, and the values were multiplied by a factor of 4 to obtain the 1000 grain weight.

4.2. DNA Extraction and PCR

DNA was extracted from fresh rice leaves according to the method described in [66], with minor modifications. PCR (polymerase chain reaction) was conducted, and the products were separated by agarose gel electrophoresis [67]. A set of newly developed insertion/deletion (InDel) markers was selected as the primary markers, as found in the open rice genome sequence library (http://www.ncbi.nlm.nih.gov). Amplified DNA products were analyzed on 3% agarose gels stained with ethidium bromide and photographed with a UVP system.

4.3. Marker Genotyping

The germplasm comprising 204 rice germplasms was mined for the presence of 9 grain size and weight related genes (i.e., qPE9~1, GW2, SLG7, GW5, GS3, GS7, GW8, GS5, and GS2) using the 14 InDel markers given in Table 8, along with detailed information of the primer pairs for each marker. All the markers were scored visually as 1 for their presence and 0 for their absence.

4.4. Statistical Analyses

Descriptive statistics and factorial analyses for the trait association of GL, GT, GW, and TGW were conducted using the statistical package SYSTAT, version 13.1. Principal Component Analysis (PCA) for testimation of the phenotypic variability within the germplasm was performed using Minitab software, version 18. Correlation coefficients among the grain size and weight related traits were determined using the computer-based software, IBM-SPSS, version 25.
For allele scoring, the genetic variations, expected heterozygosity, and polymorphism information content (PIC) values of the 14 markers were calculated using binary data in the POWER MARKER software, version 3.25 [68]. The presence of alleles was scored as 1, whereas the absence of alleles was scored as 0 to generate a binary matrix for each genotype. An un-weighted neighbour joining UPGMA tree was built based on the marker data using the DARwin 6 software [69]. Another UPGMA dendrogram (to categorize different groups based on phenotypic data) was constructed using the PAST version 3.25 software. A scatter plot was constructed using the PAST version 3.25 software to disperse the germplasm further into the sub-populations based on the InDel marker data [63,70]. The Principal Coordinate Analysis (PCoA) analysis and Analysis of Molecular Variance (AMOVA) were conducted from the binary data of the InDel markers using GenAlEx version 6.502. The binary data of the genetic markers were constructed according to grain size, which was used to separate the total molecular variance between and within the groups. ΦPT was also calculated using GenAlEx v. 6.502.

5. Conclusions

Collectively, it can be concluded that allelic variations of the nine genes are extensively distributed in the studied germplasm. Further, we observed that most of these alleles are significantly associated with variations in one or more of the studied traits related to grain size and grain weight in rice. The results also suggest that several genotypes have similar grain size characteristics and share particular allele and/or allele combinations of the nine key genes examined in this study. The examinations of allelic contributions from different genes in regulating grain size and weight related traits undertaken in the study will further strengthen our understanding of the complex mechanisms involved in rice grain appearance and the grain weight to be utilized in rice breeding programs. The identified genes and their linked InDel markers could be highly informative in pyramided breeding strategies and selecting parental lines for developing rice varieties according to consumer needs.

Supplementary Materials

Supplementary materials can be found at https://www.mdpi.com/1422-0067/20/19/4824/s1.

Author Contributions

S.G., H.G. and Z.H. analyzed genotype data for InDel marker development/ Estimation; Z.H. and R.A.R.K. analyzed all statistical analyses; H.G., J.M. and T.W. conducted phenotype experiment; G.L., S.G., Z.H., S.U. and I.A. helped conceive the basic idea, gave suggestions, G.L., Z.H. and S.G. arranged the outline of the content in the manuscript and prepared a draft article; corrected the entire article, and improved on the prospects in breeding programs. All authors read and approved the research article.

Acknowledgments

This work was financially supported by grants from the National Natural Science Foundation of China (31771350, 31471458) and the Key Science and Technology Support Program of Jiangsu Province (BE2018336) the Priority Academic Program Development of Jiangsu Higher Education Institutions (PAPD).

Conflicts of Interest

The authors declare no conflict of interest.

References

  1. Ngangkham, U.; Parida, S.K.; De, S.; Kumar, K.A.R.; Singh, A.K.; Singh, N.K.; Mohapatra, T. Genic markers for wild abortive (WA) cytoplasm based male sterility and its fertility restoration in rice. Mol. Breed. 2010, 26, 275–292. [Google Scholar] [CrossRef]
  2. Food, U. Agriculture Organization Corporate Statistical Database [Faostat] (2017). Production/Crops, Persimmons, Food and Agriculture Organization of the United Nations: Division of Statistics. Available online: http://faostat3.fao.org/browse/Q/QC/E (accessed on 19 April 2016).
  3. Thornton, P. The emergence of agriculture: Bruce D. Smith. Scientific American Library, distributed by W. H. Freeman & Co. Ltd, New York and Oxford, 1995. 231 pp. ISBN 0 7167 5055 4. Agric. Sci. 1996, 51, 496–497. [Google Scholar]
  4. Redona, E.; Mackill, D. Quantitative trait locus analysis for rice panicle and grain characteristics. Theor. Appl. Genet. 1998, 96, 957–963. [Google Scholar] [CrossRef]
  5. McKenzie, K.; Rutger, J. Genetic Analysis of Amylose Content, Alkali Spreading Score, and Grain Dimensions in Rice 1. Crop Sci. 1983, 23, 306–313. [Google Scholar] [CrossRef]
  6. Melchinger, A.; Messmer, M.; Lee, M.; Woodman, W.; Lamkey, K. Diversity and relationships among US maize inbreds revealed by restriction fragment length polymorphisms. Crop Sci. 1991, 31, 669–678. [Google Scholar] [CrossRef]
  7. Lin, H.; Qian, H.; Zhuang, J.; Lu, J.; Min, S.; Xiong, Z.; Huang, N.; Zheng, K. RFLP mapping of QTLs for yield and related characters in rice (Oryza sativa L.). Theor. Appl. Genet. 1996, 92, 920–927. [Google Scholar] [CrossRef]
  8. Hua, J.; Xing, Y.; Xu, C.; Sun, X.; Yu, S.; Zhang, Q. Genetic dissection of an elite rice hybrid revealed that heterozygotes are not always advantageous for performance. Genetics 2002, 162, 1885–1895. [Google Scholar] [PubMed]
  9. Aluko, G.; Martinez, C.; Tohme, J.; Castano, C.; Bergman, C.; Oard, J. QTL mapping of grain quality traits from the interspecific cross Oryza sativa× O. glaberrima. Theor. Appl. Genet. 2004, 109, 630–639. [Google Scholar] [CrossRef] [PubMed]
  10. Agrama, H.; Eizenga, G.; Yan, W. Association mapping of yield and its components in rice cultivars. Mol. Breed. 2007, 19, 341–356. [Google Scholar] [CrossRef]
  11. Bai, X.; Luo, L.; Yan, W.; Kovi, M.R.; Zhan, W.; Xing, Y. Genetic dissection of rice grain shape using a recombinant inbred line population derived from two contrasting parents and fine mapping a pleiotropic quantitative trait locus qGL7. BMC Genet. 2010, 11, 16. [Google Scholar] [CrossRef]
  12. Song, X.-J.; Huang, W.; Shi, M.; Zhu, M.-Z.; Lin, H.-X. A QTL for rice grain width and weight encodes a previously unknown RING-type E3 ubiquitin ligase. Nat. Genet. 2007, 39, 623–630. [Google Scholar] [CrossRef] [PubMed]
  13. Li, J.; Xiao, J.; Grandillo, S.; Jiang, L.; Wan, Y.; Deng, Q.; Yuan, L.; McCouch, S.R. QTL detection for rice grain quality traits using an interspecific backcross population derived from cultivated Asian (O. sativa L.) and African (O. glaberrima S.) rice. Genome 2004, 47, 697–704. [Google Scholar] [CrossRef] [PubMed]
  14. Wang, L.; Wang, A.; Huang, X.; Zhao, Q.; Dong, G.; Qian, Q.; Sang, T.; Han, B. Mapping 49 quantitative trait loci at high resolution through sequencing-based genotyping of rice recombinant inbred lines. Theor. Appl. Genet. 2011, 122, 327–340. [Google Scholar] [CrossRef] [PubMed]
  15. Thi, T.G.T.; Dang, X.; Liu, Q.; Zhao, K.; Wang, H.; Hong, D. Association analysis of rice grain traits with SSR markers. Chin. J. Rice Sci. 2014, 28, 243–257. [Google Scholar]
  16. Dang, X.; Thi, T.G.T.; Edzesi, W.M.; Liang, L.; Liu, Q.; Liu, E.; Wang, Y.; Qiang, S.; Liu, L.; Hong, D. Population genetic structure of Oryza sativa in East and Southeast Asia and the discovery of elite alleles for grain traits. Sci. Rep. 2015, 5, 11254. [Google Scholar] [CrossRef] [PubMed] [Green Version]
  17. Huang, X.; Qian, Q.; Liu, Z.; Sun, H.; He, S.; Luo, D.; Xia, G.; Chu, C.; Li, J.; Fu, X. Natural variation at the DEP1 locus enhances grain yield in rice. Nat. Genet. 2009, 41, 494–497. [Google Scholar] [CrossRef]
  18. Xing, Y.; Tan, Y.; Hua, J.; Sun, X.; Xu, C.; Zhang, Q. Characterization of the main effects, epistatic effects and their environmental interactions of QTLs on the genetic basis of yield traits in rice. Theor. Appl. Genet. 2002, 105, 248–257. [Google Scholar] [CrossRef]
  19. Edzesi, W.M.; Dang, X.; Liang, L.; Liu, E.; Zaid, I.U.; Hong, D. Genetic diversity and elite allele mining for grain traits in rice (Oryza sativa L.) by association mapping. Front. Plant Sci. 2016, 7, 787. [Google Scholar] [CrossRef]
  20. Ngangkham, U.; Samantaray, S.; Yadav, M.K.; Kumar, A.; Chidambaranathan, P.; Katara, J.L. Effect of multiple allelic combinations of genes on regulating grain size in rice. PLoS ONE 2018, 13, e0190684. [Google Scholar] [CrossRef]
  21. Wang, S.; Li, S.; Liu, Q.; Wu, K.; Zhang, J.; Wang, S.; Wang, Y.; Chen, X.; Zhang, Y.; Gao, C. The OsSPL16-GW7 regulatory module determines grain shape and simultaneously improves rice yield and grain quality. Nat. Genet. 2015, 47, 949–954. [Google Scholar] [CrossRef]
  22. Zhou, Y.; Miao, J.; Gu, H.; Peng, X.; Leburu, M.; Yuan, F.; Gu, H.; Gao, Y.; Tao, Y.; Zhu, J. Natural diversity in SLG7 regulate grain shape in rice. Genetics 2015, 201, 1591–1599. [Google Scholar] [CrossRef]
  23. Shomura, A.; Izawa, T.; Ebana, K.; Ebitani, T.; Kanegae, H.; Konishi, S.; Yano, M. Deletion in a gene associated with grain size increased yields during rice domestication. Nat. Genet. 2008, 40, 1023–1028. [Google Scholar] [CrossRef] [PubMed]
  24. Weng, J.; Gu, S.; Wan, X.; Gao, H.; Guo, T.; Su, N.; Lei, C.; Zhang, X.; Cheng, Z.; Guo, X. Isolation and initial characterization of GW5, a major QTL associated with rice grain width and weight. Cell Res. 2008, 18, 1199–1209. [Google Scholar] [CrossRef] [PubMed]
  25. Duan, P.; Xu, J.; Zeng, D.; Zhang, B.; Geng, M.; Zhang, G.; Huang, K.; Huang, L.; Xu, R.; Ge, S. Natural variation in the promoter of GSE5 contributes to grain size diversity in rice. Mol. Plant 2017, 10, 685–694. [Google Scholar] [CrossRef] [PubMed]
  26. Liu, J.; Chen, J.; Zheng, X.; Wu, F.; Lin, Q.; Heng, Y.; Tian, P.; Cheng, Z.; Yu, X.; Zhou, K. GW5 acts in the brassinosteroid signalling pathway to regulate grain width and weight in rice. Nat. Plants 2017, 3, 17043. [Google Scholar] [CrossRef] [PubMed]
  27. Fan, C.; Xing, Y.; Mao, H.; Lu, T.; Han, B.; Xu, C.; Li, X.; Zhang, Q. GS3, a major QTL for grain length and weight and minor QTL for grain width and thickness in rice, encodes a putative transmembrane protein. Theor. Appl. Genet. 2006, 112, 1164–1171. [Google Scholar] [CrossRef]
  28. Mao, H.; Sun, S.; Yao, J.; Wang, C.; Yu, S.; Xu, C.; Li, X.; Zhang, Q. Linking differential domain functions of the GS3 protein to natural variation of grain size in rice. Proc. Natl. Acad. Sci. USA 2010, 107, 19579–19584. [Google Scholar] [CrossRef] [PubMed]
  29. Takano-Kai, N.; Jiang, H.; Powell, A.; McCouch, S.; Takamure, I.; Furuya, N.; Doi, K.; Yoshimura, A. Multiple and independent origins of short seeded alleles of GS3 in rice. Breed. Sci. 2013, 63, 77–85. [Google Scholar] [CrossRef] [PubMed]
  30. Shao, G.; Wei, X.; Chen, M.; Tang, S.; Luo, J.; Jiao, G.; Xie, L.; Hu, P. Allelic variation for a candidate gene for GS7, responsible for grain shape in rice. Theor. Appl. Genet. 2012, 125, 1303–1312. [Google Scholar] [CrossRef]
  31. Wang, S.; Wu, K.; Yuan, Q.; Liu, X.; Liu, Z.; Lin, X.; Zeng, R.; Zhu, H.; Dong, G.; Qian, Q. Control of grain size, shape and quality by OsSPL16 in rice. Nat. Genet. 2012, 44, 950–954. [Google Scholar] [CrossRef]
  32. Li, Y.; Fan, C.; Xing, Y.; Jiang, Y.; Luo, L.; Sun, L.; Shao, D.; Xu, C.; Li, X.; Xiao, J. Natural variation in GS5 plays an important role in regulating grain size and yield in rice. Nat. Genet. 2011, 43, 1266–1269. [Google Scholar] [CrossRef] [PubMed]
  33. Che, R.; Tong, H.; Shi, B.; Liu, Y.; Fang, S.; Liu, D.; Xiao, Y.; Hu, B.; Liu, L.; Wang, H. Control of grain size and rice yield by GL2-mediated brassinosteroid responses. Nat. Plants 2016, 2, 15195. [Google Scholar] [CrossRef] [PubMed]
  34. Duan, P.; Ni, S.; Wang, J.; Zhang, B.; Xu, R.; Wang, Y.; Chen, H.; Zhu, X.; Li, Y. Regulation of OsGRF4 by OsmiR396 controls grain size and yield in rice. Nat. Plants 2016, 2, 15203. [Google Scholar] [CrossRef] [PubMed]
  35. Hu, J.; Wang, Y.; Fang, Y.; Zeng, L.; Xu, J.; Yu, H.; Shi, Z.; Pan, J.; Zhang, D.; Kang, S. A rare allele of GS2 enhances grain size and grain yield in rice. Mol. Plant 2015, 8, 1455–1465. [Google Scholar] [CrossRef] [PubMed]
  36. Sun, P.; Zhang, W.; Wang, Y.; He, Q.; Shu, F.; Liu, H.; Wang, J.; Wang, J.; Yuan, L.; Deng, H. OsGRF4 controls grain shape, panicle length and seed shattering in rice. J. Integr. Plant Biol. 2016, 58, 836–847. [Google Scholar] [CrossRef] [PubMed]
  37. Wang, Y.; Xiong, G.; Hu, J.; Jiang, L.; Yu, H.; Xu, J.; Fang, Y.; Zeng, L.; Xu, E.; Xu, J. Copy number variation at the GL7 locus contributes to grain size variations in rice. Nat. Genet. 2015, 47, 944–948. [Google Scholar] [CrossRef] [PubMed]
  38. Xu, H.; Zhao, M.; Zhang, Q.; Xu, Z.; Xu, Q. The DENSE AND ERECT PANICLE 1 (DEP1) gene offering the potential in the breeding of high-yielding rice. Breed. Sci. 2016, 66, 659–667. [Google Scholar] [CrossRef] [Green Version]
  39. Li, X.; Tao, Q.; Miao, J.; Yang, Z.; Gu, M.; Liang, G.; Zhou, Y. Evaluation of differential qPE9-1/DEP1 protein domains in rice grain length and weight variation. Rice 2019, 12, 5. [Google Scholar] [CrossRef]
  40. Vasemägi, A.; Gross, R.; Palm, D.; Paaver, T.; Primmer, C.R. Discovery and application of insertion-deletion (INDEL) polymorphisms for QTL mapping of early life-history traits in Atlantic salmon. BMC Genom. 2010, 11, 156. [Google Scholar] [CrossRef]
  41. Li, W.; Cheng, J.; Wu, Z.; Qin, C.; Tan, S.; Tang, X.; Cui, J.; Zhang, L.; Hu, K. An InDel-based linkage map of hot pepper (Capsicum annuum). Mol. Breed. 2015, 32–35. [Google Scholar] [CrossRef]
  42. Lister, R.; Gregory, B.D.; Ecker, J.R. Next is now: New technologies for sequencing of genomes, transcriptomes, and beyond. Curr. Opin. Plant Biol. 2009, 12, 107–118. [Google Scholar] [CrossRef] [PubMed]
  43. Liu, B.; Wang, Y.; Zhai, W.; Deng, J.; Wang, H.; Cui, Y.; Cheng, F.; Wang, X.; Wu, J. Development of INDEL markers for Brassica rapa based on whole-genome re-sequencing. Theor. Appl. Genet. 2013, 126, 231–239. [Google Scholar] [CrossRef] [PubMed]
  44. Moghaddam, S.M.; Song, Q.; Mamidi, S.; Schmutz, J.; Lee, R.; Cregan, P.; Osorno, J.M.; McClean, P.E. Developing market class specific InDel markers from next generation sequence data in Phaseolus vulgaris L. Front. Plant Sci. 2014, 5, 185. [Google Scholar] [CrossRef] [PubMed]
  45. Păcurar, D.I.; Păcurar, M.L.; Street, N.; Bussell, J.D.; Pop, T.I.; Gutierrez, L.; Bellini, C. A collection of INDEL markers for map-based cloning in seven Arabidopsis germplasm. J. Exp. Bot. 2012, 63, 2491–2501. [Google Scholar] [CrossRef]
  46. Schneeberger, K.; Weigel, D. Fast-forward genetics enabled by new sequencing technologies. Trends Plant Sci. 2011, 16, 282–288. [Google Scholar] [CrossRef]
  47. Wu, K.; Yang, M.; Liu, H.; Tao, Y.; Mei, J.; Zhao, Y. Genetic analysis and molecular characterization of Chinese sesame (Sesamum indicum L.) cultivars using insertion-deletion (InDel) and simple sequence repeat (SSR) markers. BMC Genet. 2014, 15, 35. [Google Scholar] [CrossRef] [PubMed]
  48. Yamaki, S.; Ohyanagi, H.; Yamasaki, M.; Eiguchi, M.; Miyabayashi, T.; Kubo, T.; Kurata, N.; Nonomura, K.-I. Development of INDEL markers to discriminate all genome types rapidly in the genus Oryza. Breed. Sci. 2013, 63, 246–254. [Google Scholar] [CrossRef]
  49. Wu, D.-H.; Wu, H.-P.; Wang, C.-S.; Tseng, H.-Y.; Hwu, K.-K. Genome-wide InDel marker system for application in rice breeding and mapping studies. Euphytica 2013, 192, 131–143. [Google Scholar] [CrossRef]
  50. Zeng, Y.; Wen, Z.; Ma, L.; Ji, Z.; Li, X.; Yang, C. Development of 1047 insertion-deletion markers for rice genetic studies and breeding. Genet. Mol. Res. 2013, 12, 5226–5235. [Google Scholar] [CrossRef]
  51. Fisher, R.; Immer, F.; Tedin, O. The genetical interpretation of statistics of the third degree in the study of quantitative inheritance. Genetics 1932, 17, 107–124. [Google Scholar]
  52. Robson, D.S. Applications of the k 4 Statistic to Genetic Variance Component Analyses. Biometrics 1956, 12, 433–444. [Google Scholar] [CrossRef]
  53. Nachimuthu, V.V.; Robin, S.; Sudhakar, D.; Raveendran, M.; Rajeswari, S.; Manonmani, S. Evaluation of rice genetic diversity and variability in a population panel by principal component analysis. Indian J. Sci. Technol. 2014, 7, 1555–1562. [Google Scholar]
  54. Romesburg, C. Cluster Analysis for Researchers; Lulu.com: Morrisville, North Carolina, 2004. [Google Scholar]
  55. Haider, Z.; Farooq, U.; Naseem, I.; Zia, S.; Alamgeer, M. Impact of drought stress on some grain quality traits in rice (Oryza sativa). Agric. Res. 2015, 4, 132–138. [Google Scholar] [CrossRef]
  56. Schneider, A.; Hommel, G.; Blettner, M. Linear regression analysis: Part 14 of a series on evaluation of scientific publications. Dtsch. Ärztebl. Int. 2010, 107, 776–782. [Google Scholar] [PubMed]
  57. Seo, H.; Yang, G.; Kim, N.; Kim, H.; Kim, M. SPSS (PASW) Regression Analysis; Hannarae Publishing Co.: Seoul, Korea, 2009. [Google Scholar]
  58. Ochiai, A. Zoogeographic studies on the soleoid fishes found in Japan and its neighbouring regions. Bull. Jpn. Soc. Sci. Fish. 1957, 22, 526–530. [Google Scholar] [CrossRef]
  59. Mogga, M.; Sibiya, J.; Shimelis, H.; Lamo, J.; Yao, N. Diversity analysis and genome-wide association studies of grain shape and eating quality traits in rice (Oryza sativa L.) using DArT markers. PLoS ONE 2018, 13, e0198012. [Google Scholar] [CrossRef] [PubMed]
  60. Li, N.; Xu, R.; Duan, P.; Li, Y. Control of grain size in rice. Plant Reprod. 2018, 31, 237–251. [Google Scholar] [CrossRef]
  61. Huang, R.; Jiang, L.; Zheng, J.; Wang, T.; Wang, H.; Huang, Y.; Hong, Z. Genetic bases of rice grain shape: So many genes, so little known. Trends Plant Sci. 2013, 18, 218–226. [Google Scholar] [CrossRef]
  62. Tan, Y.-F.; Xing, Y.-Z.; Li, J.-X.; Yu, S.-B.; Xu, C.-G.; Zhang, Q. Genetic bases of appearance quality of rice grains in Shanyou 63, an elite rice hybrid. Theor. Appl. Genet. 2000, 101, 823–829. [Google Scholar] [CrossRef]
  63. Lee, C.-M.; Park, J.; Kim, B.; Seo, J.; Lee, G.; Jang, S.; Koh, H.-J. Influence of multi-gene allele combinations on grain size of rice and development of a regression equation model to predict grain parameters. Rice 2015, 8, 33. [Google Scholar] [CrossRef]
  64. Kang, Y.-J.; Shim, K.-C.; Lee, H.-S.; Jeon, Y.-A.; Kim, S.-H.; Kang, J.-W.; Yun, Y.-T.; Park, I.-K.; Ahn, S.-N. Fine mapping and candidate gene analysis of the quantitative trait locus GW8. 1 associated with grain length in rice. Genes Genom. 2018, 40, 389–397. [Google Scholar] [CrossRef] [PubMed]
  65. Xu, C.; Liu, Y.; Li, Y.; Xu, X.; Xu, C.; Li, X.; Xiao, J.; Zhang, Q. Differential expression of GS5 regulates grain size in rice. J. Exp. Bot. 2015, 66, 2611–2623. [Google Scholar] [CrossRef] [PubMed]
  66. Murray, M.; Thompson, W.F. Rapid isolation of high molecular weight plant DNA. Nucleic Acids Res. 1980, 8, 4321–4326. [Google Scholar] [CrossRef] [PubMed] [Green Version]
  67. Panaud, O.; Chen, X.; McCouch, S. Development of microsatellite markers and characterization of simple sequence length polymorphism (SSLP) in rice (Oryza sativa L.). Mol. Gen. Genet. 1996, 252, 597–607. [Google Scholar] [CrossRef] [PubMed]
  68. Liu, K.; Muse, S.V. PowerMarker: An integrated analysis environment for genetic marker analysis. Bioinformatics 2005, 21, 2128–2129. [Google Scholar] [CrossRef]
  69. Perrier, X. DARwin Software (2006). Available online: http://darwin.cirad.fr/darwin (accessed on 11 July 2014).
  70. Lestari, P.; Ham, T.-H.; Lee, H.-H.; Woo, M.-O.; Jiang, W.; Chu, S.-H.; Kwon, S.-W.; Ma, K.; Lee, J.-H.; Cho, Y.-C. PCR marker-based evaluation of the eating quality of japonica rice (Oryza sativa L.). J. Agric. Food Chem. 2009, 57, 2754–2762. [Google Scholar] [CrossRef]
Figure 1. Longitudinal and radial-pattern cross section diagrams of rice grain showing the grain length (GL), grain width (GW), and grain thickness (GT).
Ijms 20 04824 g001
Figure 2. Score plot showing variability within the germplasms of 204 rice germplasms on a biplot using principal component analysis, with the first two components representing the maximum proportion (87.9%) of the total phenotypic variation for the studied traits.
Ijms 20 04824 g002
Figure 3. UPGMA Dendrogram showing variability in 204 rice germplasms in three distinct clusters for the studied traits estimated on the similarity index using the Euclidean distances between the groups.
Ijms 20 04824 g003
Figure 4. Factor analysis of the four grain size and weight related traits in rice germplasm comprising 204 genotypes; the first two factors represent more than 85% of the total variation. Traits with a positive association have vectors with an acute angle (<90) between their vectors and are closer to one another, while traits with negative associations have an obtuse (>90) angle between their vectors and are found far from one another in the biplot.
Ijms 20 04824 g004
Figure 5. Amplification profile of the 14 Insertion/Deletion (InDel) markers of nine genes related to grain size and weight in 204 rice germplasms. M1 represents a 2000 base pair (bp) DNA ladder, 1–24 represent the rice germplasm. The size of the DNA fragment is depicted on the right side of the gel picture.
Ijms 20 04824 g005aIjms 20 04824 g005bIjms 20 04824 g005c
Figure 6. InDel marker based genetic relationship among the 204 rice germplasm entries, estimated using an un-weighted neighbor joining tree (bootstraps value of 10,000).
Ijms 20 04824 g006
Figure 7. Principal Coordinate Analysis (PCoA) of 204 rice germplasms based on 14 InDel markers. A 2D scatter plot distributed the 204 germplasms based on InDel markers into four distinct groups according to the average grain length. Extra-long grains (with AGL > 9.5 mm) are shifted towards the right side, whereas short grain (AGL < 7.5 mm) germplasms shifted towards the left side. Medium grain germplasm is dispersed over the central region of the biplot.
Ijms 20 04824 g007
Figure 8. Percentages of molecular variation within and among populations.
Ijms 20 04824 g008
Table 1. Descriptive statistics for grain length (GL), grain width (GW), grain thickness (GT), and thousand grain weight (TGW) of germplasms containing two hundred and four (204) rice germplasms.
ParametersGL (mm)GW (mm)GT (mm)TGW (g)
Minimum6.0102.0501.86017.0
Maximum10.6503.8502.86037.0
Range4.6401.8001.00020.0
Arithmetic Mean8.1622.9322.15625.858
Standard Error of Arithmetic Mean0.0650.0190.0120.199
Standard Deviation0.9290.2700.1652.841
Variance0.8640.0730.0278.070
Coefficient of Variation (CV)0.1140.0920.0770.110
Skewness (G1)0.514−0.1481.0751.501
Kurtosis (G2)−0.5111.0921.9651.591
Table 2. Correlation coefficient analysis among the four studied traits for grain size and weight.
TraitsGLGWGT
Grain length (GL)1.000
Grain width (GW)−0.604 **1.000
Grain thickness (GT)−0.398 *0.686 **1.000
Thousand grain weight (TGW)0.249 *0.374 *0.491 **
** highly significant at p ≤ 0.01; * significant at p ≤ 0.05.
Table 3. Fragment lengths on electrophoresis gel, expected frequency estimates, allelic variance, and standard deviation (SD) estimates of each allele of the 14 InDel loci.
MarkerAlleleBand Length (bp)GenotypeExpected FrequencyVarianceSD
qPE9~1-InDelA2703640.89220.00050.0217
B350440.10780.00050.0217
GW2-InDelA5002900.71080.00100.0317
B5201160.28430.00100.0316
SLG7-InDelA4503080.75490.00090.0301
B5001000.24510.00090.0301
GW5-InDelA4502940.72060.00100.0314
B5001140.27940.00100.0314
GS3-InDelA6502840.69610.00100.0322
B7501240.30390.00100.0322
GS7-InDelA2002300.56370.00090.0301
B2501760.43140.00090.0300
GW8-InDelA3501220.29900.00100.0321
B4502560.62750.00110.0339
GW8-InDel1AA3501270.31130.00100.0323
B4502710.66420.00110.0330
GW8-InDel2BA2701880.46080.00120.0349
B3002120.51960.00120.0350
GS5-InDel1AA5001810.44360.00120.0347
B5302150.52700.00120.0349
GS5-InDel2BA500140.03430.00020.0127
B5503700.90690.00040.0203
GS2-InDelA400650.15930.00070.0255
B5003390.83090.00070.0261
GS2-InDel1AA4002150.52700.00120.0349
B4501850.45340.00120.0348
GS2-InDel2BA2501010.24750.00090.0301
B3002950.72300.00100.0312
Table 4. Allelic variations of the grain size and weight regulating genes in 204 rice germplasms, based on InDel marker loci.
MarkersAllelesGermplasmGrain Length (mm)Grain Width (mm)Grain Thickness (mm)Thousand Grain Weight (g)
Mean ± SDp ValueMean ± SDp ValueMean ± SDp ValueMean ± SDp Value
qPE9~1-InDelA1827.94 ± 0.920 b0.322.95 ± 0.275 b0.492.13 ± 0.167 a0.8626.0 ± 2.837 a0.32
B228.24 ± 0.961 a3.06 ± 0.209 a2.12 ± 0.149 a26.5 ± 2.672 a
GW2-InDelA1457.98 ± 0.934 a0.562.95 ± 0.273 b0.172.13 ± 0.167 a0.4726.0 ± 2.984 a0.52
B588.03 ± 0.907 a3.02 ± 0.253 a2.12 ± 0.160 a26.0 ± 2.441 a
SLG7-InDelA1547.97 ± 0.933 a0.892.95 ± 0.268 a0.982.12 ± 0.160 a0.2326.0 ±2.857 a0.027 *
B508.03 ± 0.907 a2.99 ± 0.273 a2.16 ± 0.178 a26.0 ± 2.695 a
GW5-InDelA1477.98 ± 0.894 a0.932.95 ± 0.261 a0.047 *2.13 ± 0.163 a0.2925.0 ± 2.847 b0.031 *
B577.93 ± 1.008 a3.00 ± 0.285 a2.13 ± 0.170 a26.0 ± 2.708 a
GS3-InDelA1427.90 ± 0.926 a0.019 *2.97 ± 0.279 a0.442.14 ± 0.166 a0.012 *26.0 ± 2.729 a0.61
B628.16 ± 0.917 a2.95 ± 0.244 a2.11 ± 0.159 a25.5 ± 3.054 a
GS7-InDelA908.19 ± 0.921 a0.022 *2.95 ± 0.299 a0.562.10 ± 0.162 b0.0194 *26.0 ±2.889 a0.96
B638.08 ± 0.828 a2.97 ± 0.190 a2.12 ± 0.162 b26.0 ± 2.504 a
AB507.57 ± 0.974 b2.95 ± 0.293 a2.20 ± 0.159 a25.0 ± 3.116 b
GW8-InDelA607.34 ± 0.578 b≤0.0001 *3.05 ± 0.203 b≤0.0001 *2.27 ± 0.133 a≤0.0001 *25.0 ± 2.694 b0.06
B1288.41 ± 0.890 a2.92 ± 0.259 a2.08 ± 0.118 b26.0 ± 2.583 a
GW8-InDel1AA637.42 ± 0.667 b≤0.0001 *3.06 ± 0.231 b≤0.0001 *2.27 ± 0.169 a≤0.0001 *26.0 ± 3.309 a0.0620
B1358.40 ± 0.901 a2.91 ± 0.260 a2.09 ± 0.118 b26.0 ± 2.615 a
GW8-InDel2BA947.64 ±0.965 b0.0045 *3.00 ± 0.238 a0.003 *2.19 ± 0.158 a≤0.0001 *26.0 ± 2.824 a≤0.0001 *
B1068.35 ± 0.852 a2.92 ± 0.274 b2.10 ± 0.129 b25.0 ± 2.611 b
GS5-InDel1AA907.79 ± 0.921 b0.122.97 ± 0.259 a0.752.13 ± 0.165 a0.2224.0 ± 3.180 b0.016 *
B1078.16 ± 0.925 a2.94 ± 0.272 a2.12 ± 0.150 a27.0 ± 2.535 a
GS5-InDel2BA77.40 ± 0.900 b0.872.78 ± 0.261 b0.332.14 ± 0.161 a0.4423.0 ± 2.729 b0.038 *
B1858.24 ± 0.934 a2.99 ± 0.265 a2.21 ± 0.161 b26.2 ± 2.899 a
GS2-InDelA327.57 ± 1.035 a0.963.03 ± 0.314 a0.992.22 ± 0.180 a0.1827.0 ± 3.258 a0.58
B1697.98 ± 0.900 a2.94 ± 0.261 b2.12 ± 0.161 b25.0 ± 2.729 b
GS2-InDel1AA1077.66 ± 0.820 b≤0.0001 *3.01 ± 0.246 a0.0005 *2.19 ± 0.180 a≤0.0001 *26.0 ± 2.943 a0.89
B928.44 ± 0.908 a2.84 ± 0.275 b2.09 ± 0.126 b26.0 ± 2.754 a
GS2-InDel2BA509.32 ± 0.951 a≤0.0001 *2.65 ± 0.303 b≤0.0001 *2.08 ± 0.153 b0.0074 *26.0 ± 3.136 a0.12
B1477.81 ± 0.742 b3.01 ± 0.201 a2.16 ± 0.155 a25.0 ± 2.761 b
Data present the mean values ± standard deviation; ANOVA test for significant at the level of p level <0.05 and <0.01. * significant at p ≤ 0.05. a, b and c were ranked by Duncan’s test.
Table 5. Pyramiding of the favorable alleles of the studied genes for Grain Length (GL).
GenesMarkersAllelesGrain Length (mm)Grain Width (mm)Grain Thickness (mm)Thousand Grain Weight (g)
FA (Mean ± SD)N-FA (Mean ± SD)FA (Mean ± SD)N-FA (Mean ± SD)FA (Mean ± SD)N-FA (Mean ± SD)FA (Mean ± SD)N-FA (Mean ± SD)
GS3GS3-InDelA-7.90 ± 0.926 a2.97 ± 0.279 a-----
B8.16 ± 0.917 a--2.95 ± 0.244 a---25.5 ± 3.054 a
GS7GS7-InDelA8.19 ± 0.921 a-----26.0 ± 2.889 a-
B8.08 ± 0.828 a--2.97 ± 0.190 a-2.12 ±0.162 b-26.0 ± 2.504 a
GW8GW8-InDelA-7.34 ± 0.578 b-3.05 ± 0.203 b-2.27 ± 0.133 a-25.0 ± 2.694 b
B8.41 ± 0.890 a-----26.0 ± 2.583 a-
GW8-InDel1AA-7.42 ± 0.667 b-3.06 ± 0.231 b-2.27 ± 0.169 a-26.0 ±3.309 a
B8.40 ± 0.901 a-----26.0 ± 2.615 a-
GW8-InDel2BA-7.64 ± 0.965 b-3.00 ± 0.238 a-2.19 ± 0.158 a-26.0 ±2.824 a
B8.35 ± 0.852 a-------
GS2GS2-InDel1AA-7.66 ± 0.820 b-3.01 ± 0.246 a-2.19 ± 0.180 a-26.0 ±2.943 a
B8.44 ± 0.908 a-----26.0 ± 2.754 a-
GS2-InDel2BA9.32 ± 0.951 a-----26.0 ± 3.136 a-
B-7.81 ± 0.742 b-3.01 ± 0.201 a-2.16 ± 0.155 a-25.0 ±2.761 b
Mean ± SD8.47 ± 0.39 a7.62 ± 0.22 b2.97 ± 0.279 a3.01 ± 0.030 a-2.20 ± 0.06026.0 ± 0.00 a25.6 ±0.51 b
FA and N-FA symbolize favorable and non-favorable alleles, respectively; a and b represent significantly (p value < 0.01) different mean values. Sign (-) symbolizes no FA/N-FA allele under this category
Table 6. Estimation of the number of alleles per locus, the major allele frequency, gene diversity (D), expected heterozygosity, and the polymorphism information content (PIC) values in the 204 rice germplasms.
MarkerApmaDHExpPIC
qPE9~1-InDel20.89220.19240.00000.1739
GW2-InDel30.71080.41390.00000.3322
SLG7-InDel20.75490.37000.00000.3016
GW5-InDel20.72060.40270.00000.3216
GS3-InDel20.69610.42310.00000.3336
GS7-InDel30.56370.49610.24510.3778
GW8-InDel30.62750.51150.00000.4359
GW8-InDel1A30.66420.46130.00490.3752
GW8-InDel2B30.51960.51730.00000.4023
GS5-InDel1A30.52700.52460.00490.4145
GS5-InDel2B30.90690.17300.00000.1653
GS2-InDel30.83090.28420.00490.2490
GS2-InDel1A30.52700.51630.00490.4018
GS2-InDel2B30.72300.41510.00490.3500
Mean30.69030.40730.01930.3310
A = alleles per locus; pma = major allele frequency; D = gene diversity; HExp = expected heterozygosity; PIC = polymorphism information content.
Table 7. Pair-wise population ɸPT value estimates among the four sub-populations of 204 rice germplasms.
Extra-Long GrainLong GrainMedium Grain
Long grain0.097
Medium grain0.2120.035
Short grain0.4490.2640.129
ΦPT values given below the diagonal; calculated for 10,000 permutations.
Table 8. Detailed information for the 14 molecular markers for the 9 grain size and weight related genes.
S.N.GenesMarkersForward (5’ to 3’)Reverse (5’ to 3’)Tm(°C)Types
1qPE9~1qPE9~1-InDelAGTGGTGCCTATAACTCTGCAGCAAAGAGGACGTCATACT55InDel
2GW2GW2-InDelGCAATGCAAAAGCATATGGCAAAGCCAAAGATGCACACAG53InDel
3SLG7SLG7-InDelTGGTTTCGATTAGGTTCCTCTAAAACGCCGTTTAGCTATCC52InDel
4GW5GW5-InDelGAACTACATGTCCAACACGCCTCCACCACCACCACCTC58InDel
5GS3GS3-InDelATGACCACGTCGATCATCAAACTCCACCTGCAGATTTCTT53InDel
6GS7GS7-InDelTGGTCAAATCATGGGCTAATTATTATTGTGCCTGCGATCC51InDel
7GW8GW8-InDelAAAAGAGACAGCCACGGAATTCTTGAGATCCCACTCCATG54InDel
8GW8-InDel1AAAAAGAGACAGCCACGGAATTCTTGAGATCCCACTCCATG55InDel
9GW8-InDel2BTTTCAGTGTCCTCCTGTCTGACCACTAAACCAGGTGCTAC56InDel
10GS5GS5-InDel1ATGACGCCGTTGACTTTTTGAGAATCCGGCGTTGATTTCGA55InDel
11GS5-InDel2BAGGTGTTGTTCGAAACTCACGTGAAAATTTGGATATTCGTGGCA54InDel
12GS2GS2-InDelCCCACCGCATGATACATCTAATGTGGGAATTTCTAGCCCC55InDel
13GS2-InDel1AGCCGCGGTCTTTAGTAATGGCCTTCTCGTGTCGGGCTC59InDel
14GS2-InDel2BAAATTGCAGCCGACCGTAGAAATTGTGACGAGTCCCAGC55InDel

