Membrane Transporters in Human Parotid Gland-Targeted Proteomics Approach


Abstract
:1. Introduction
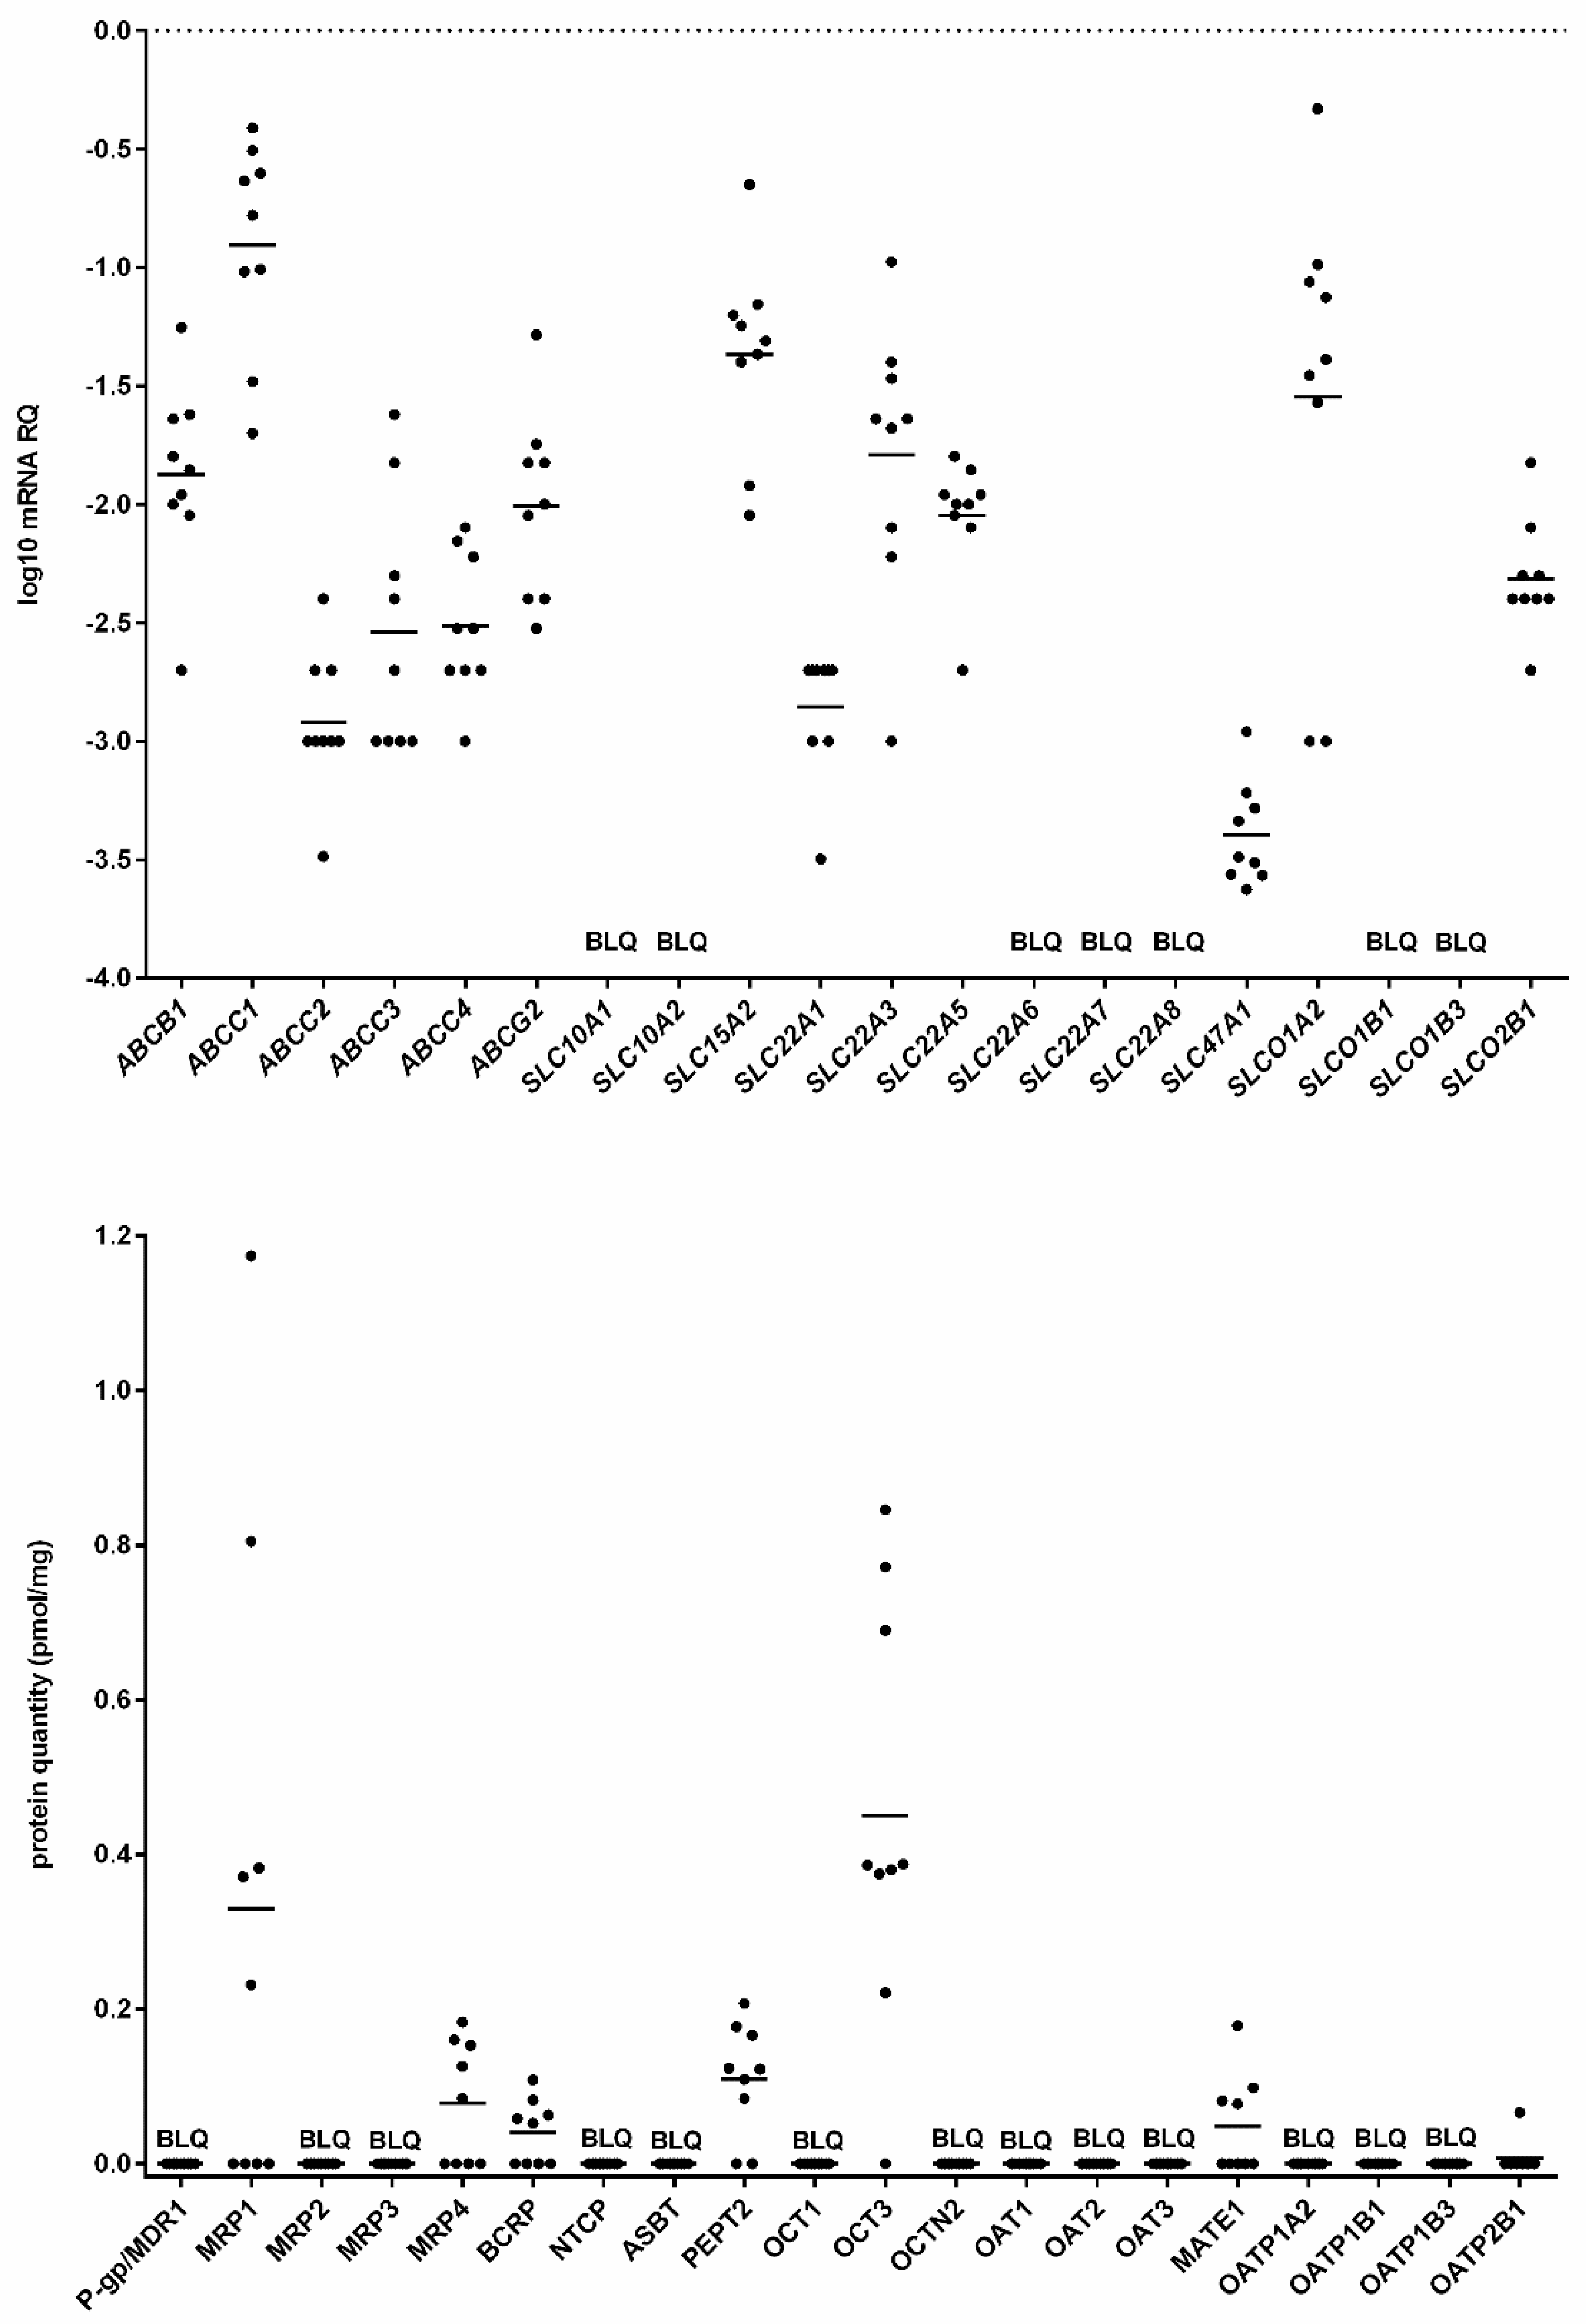
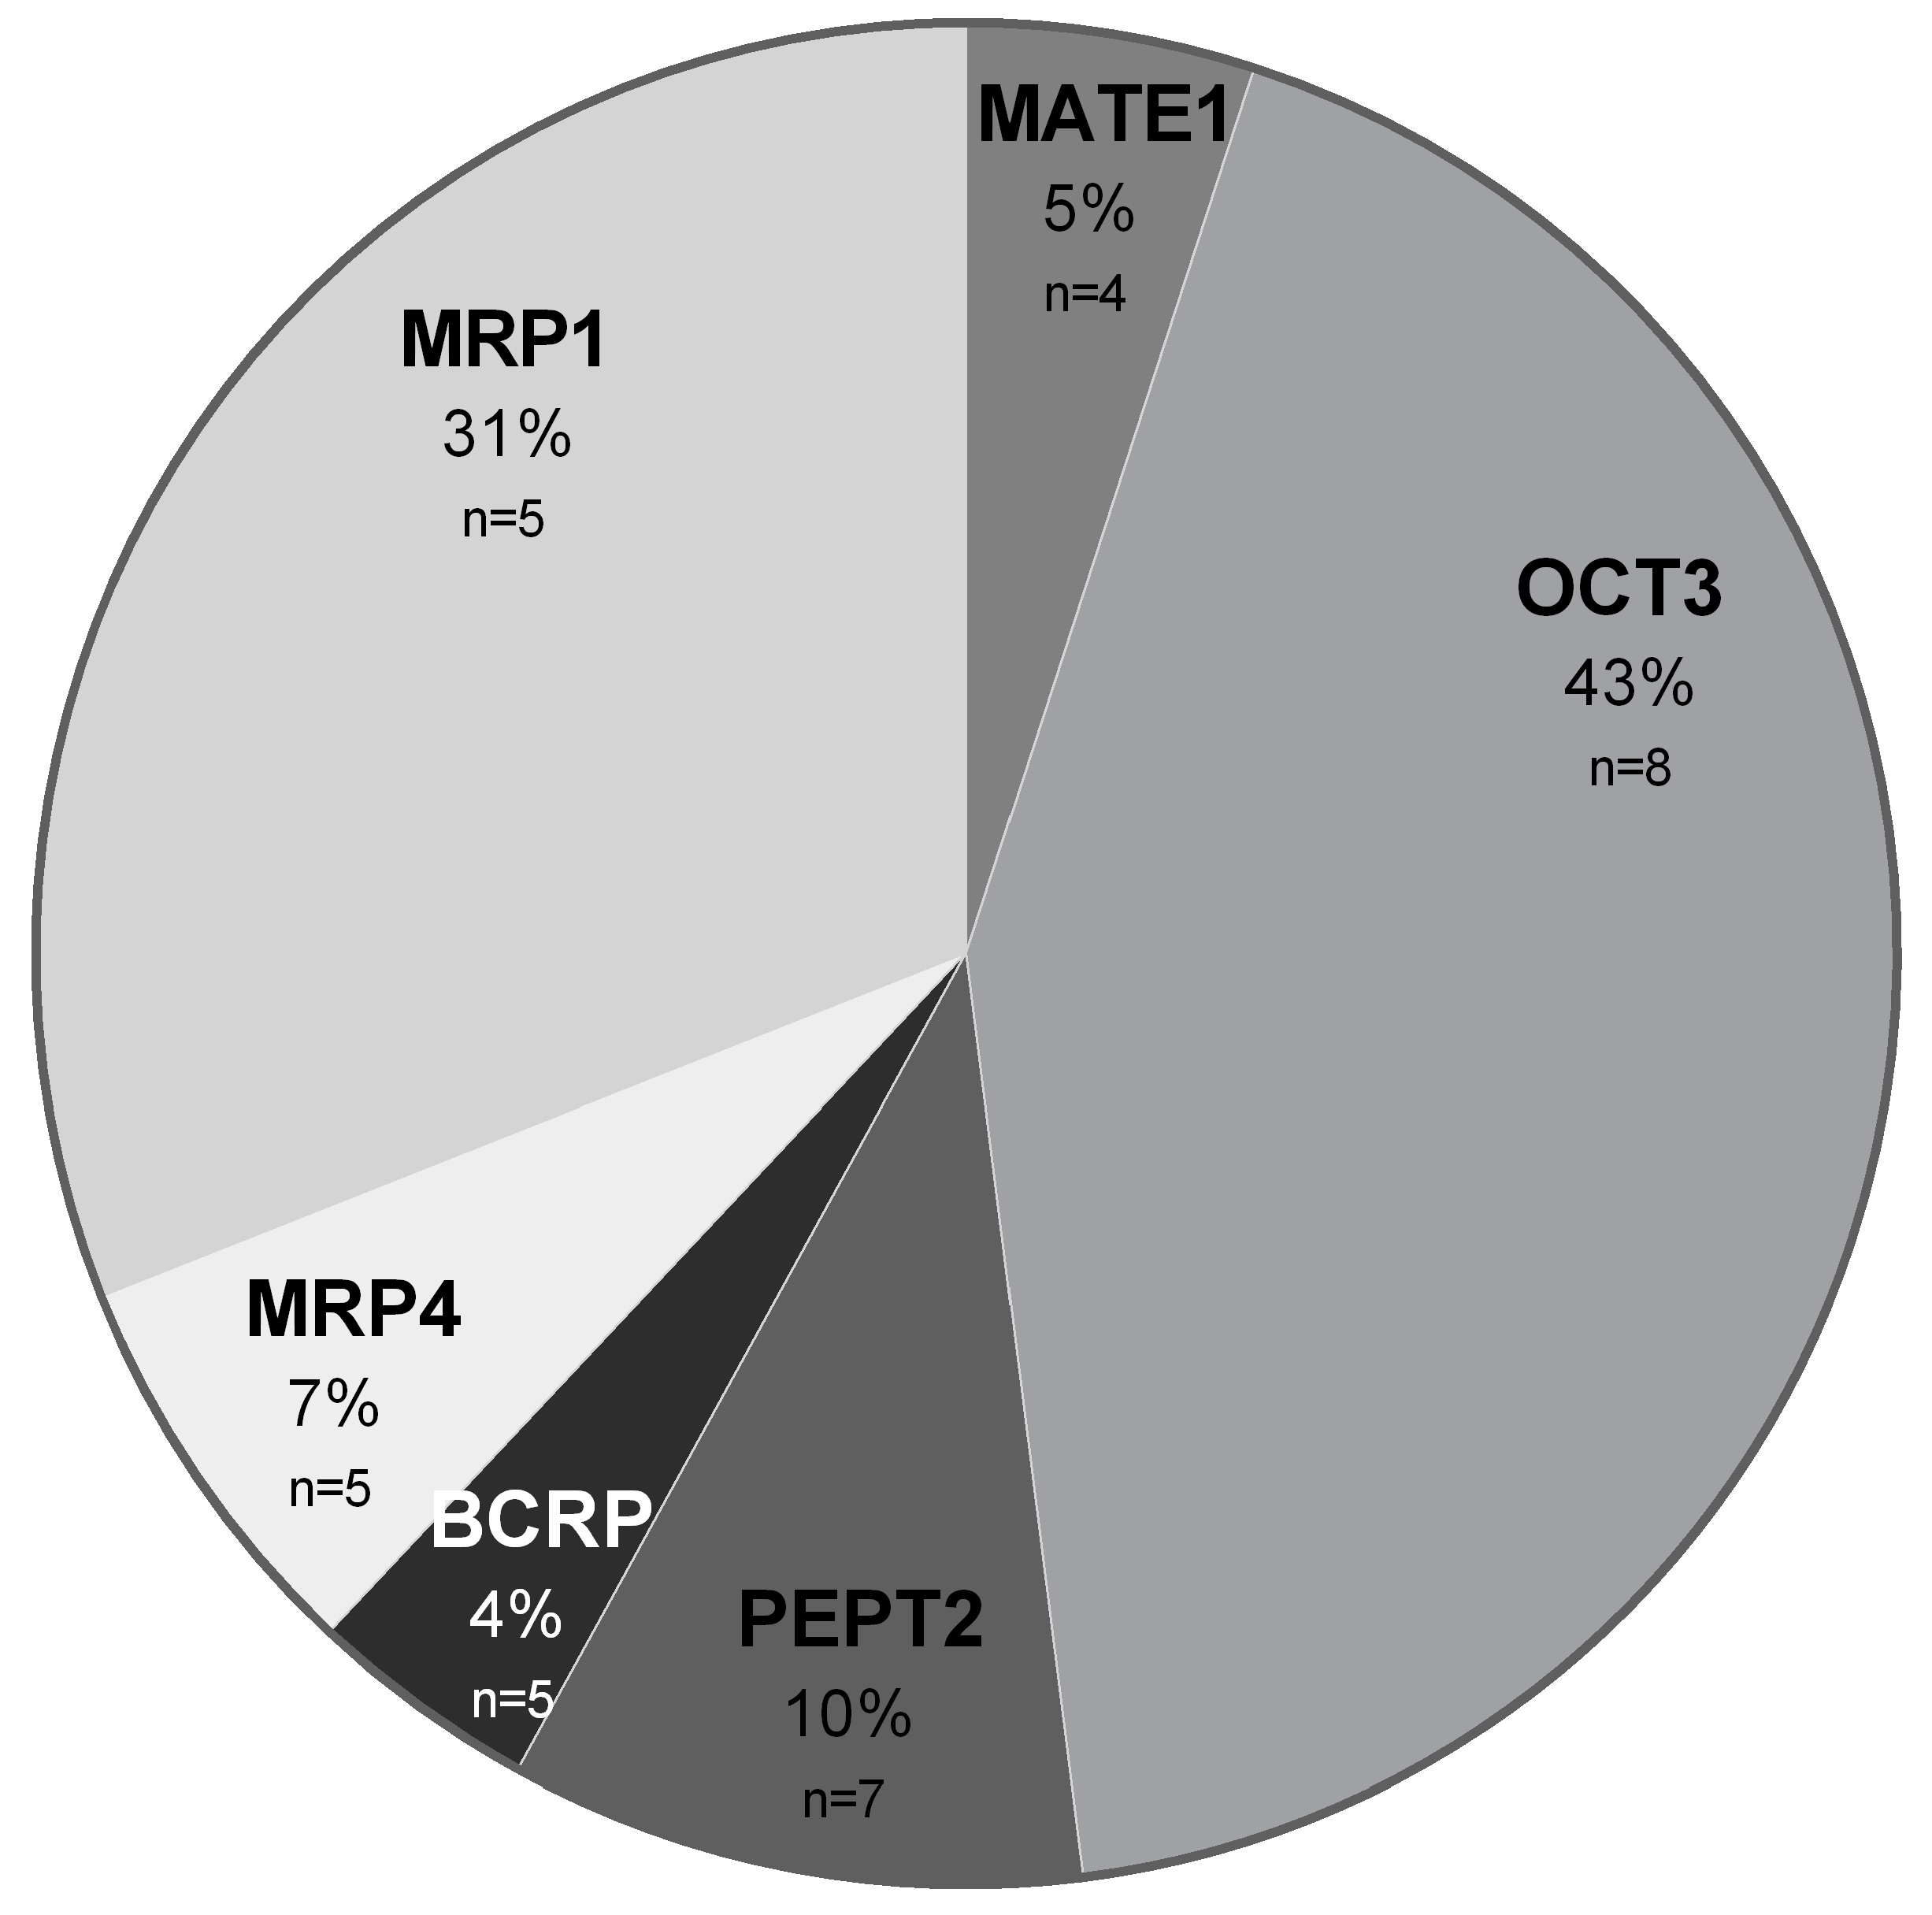
2. Results
3. Discussion
4. Materials and Methods
4.1. Parotid Gland Specimens
4.2. mRNA Isolation and Quantitative Real Time PCR
4.3. Protein Quantification Using LC–MS/MS
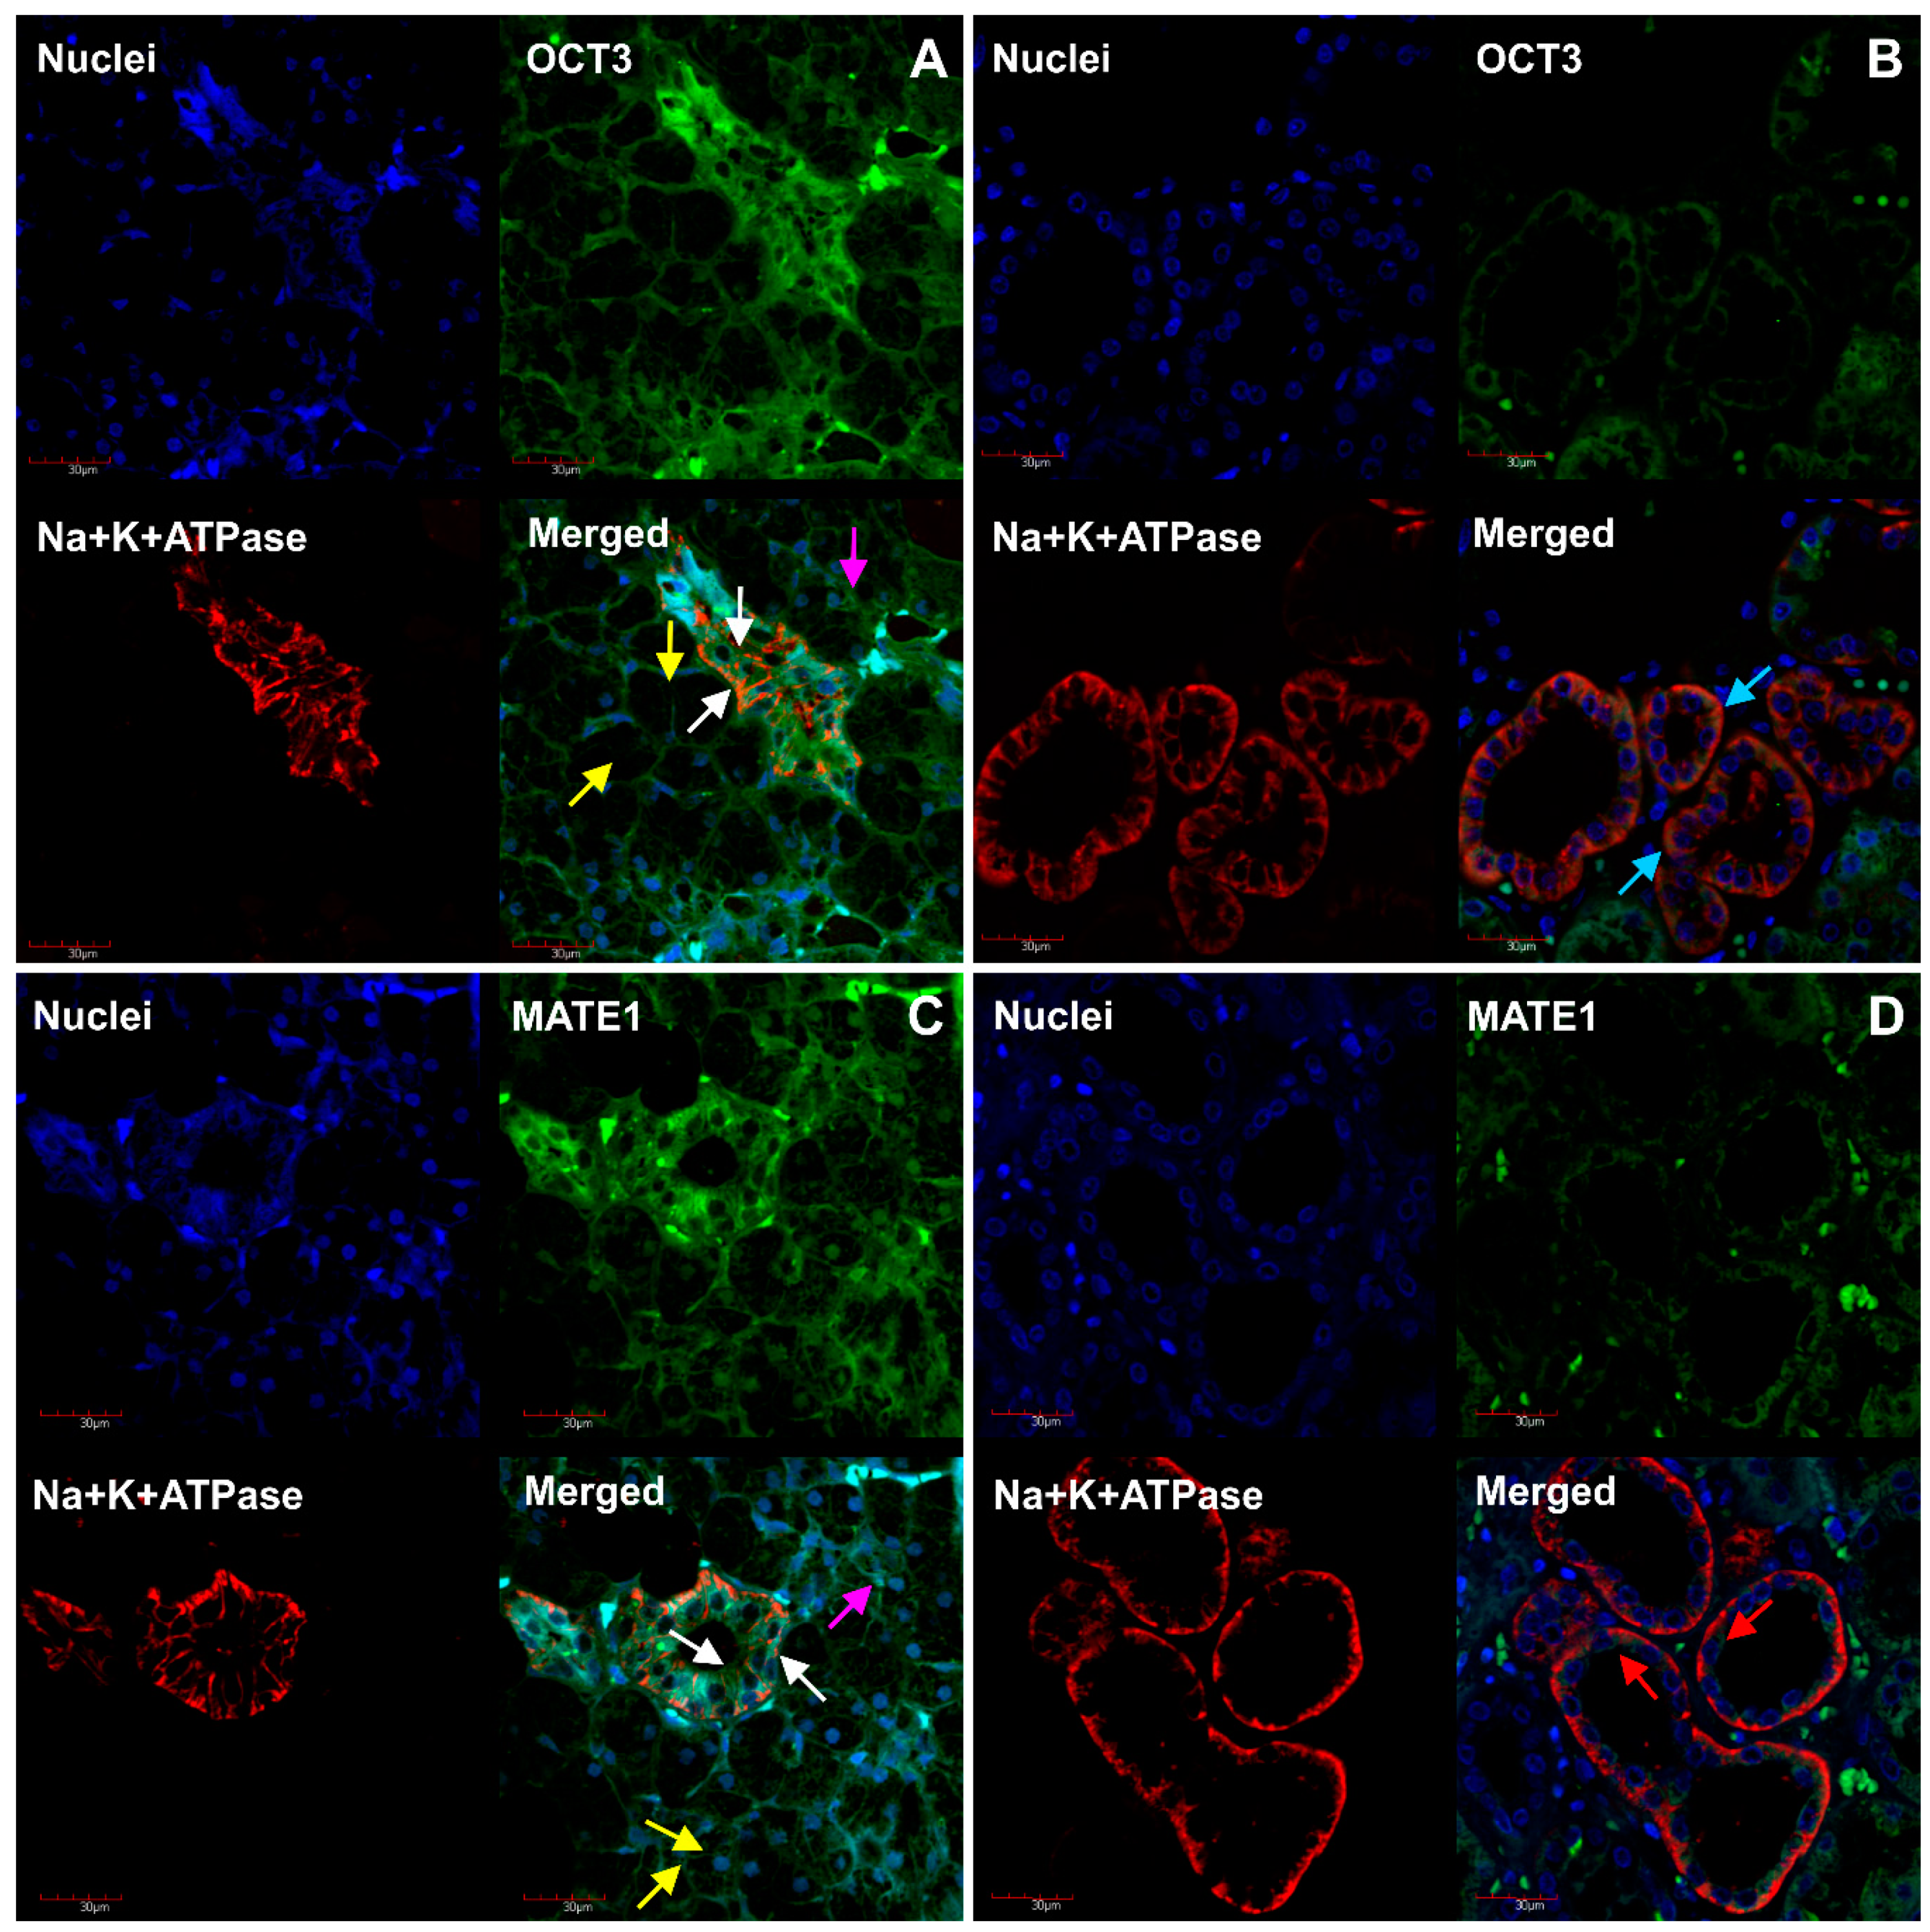
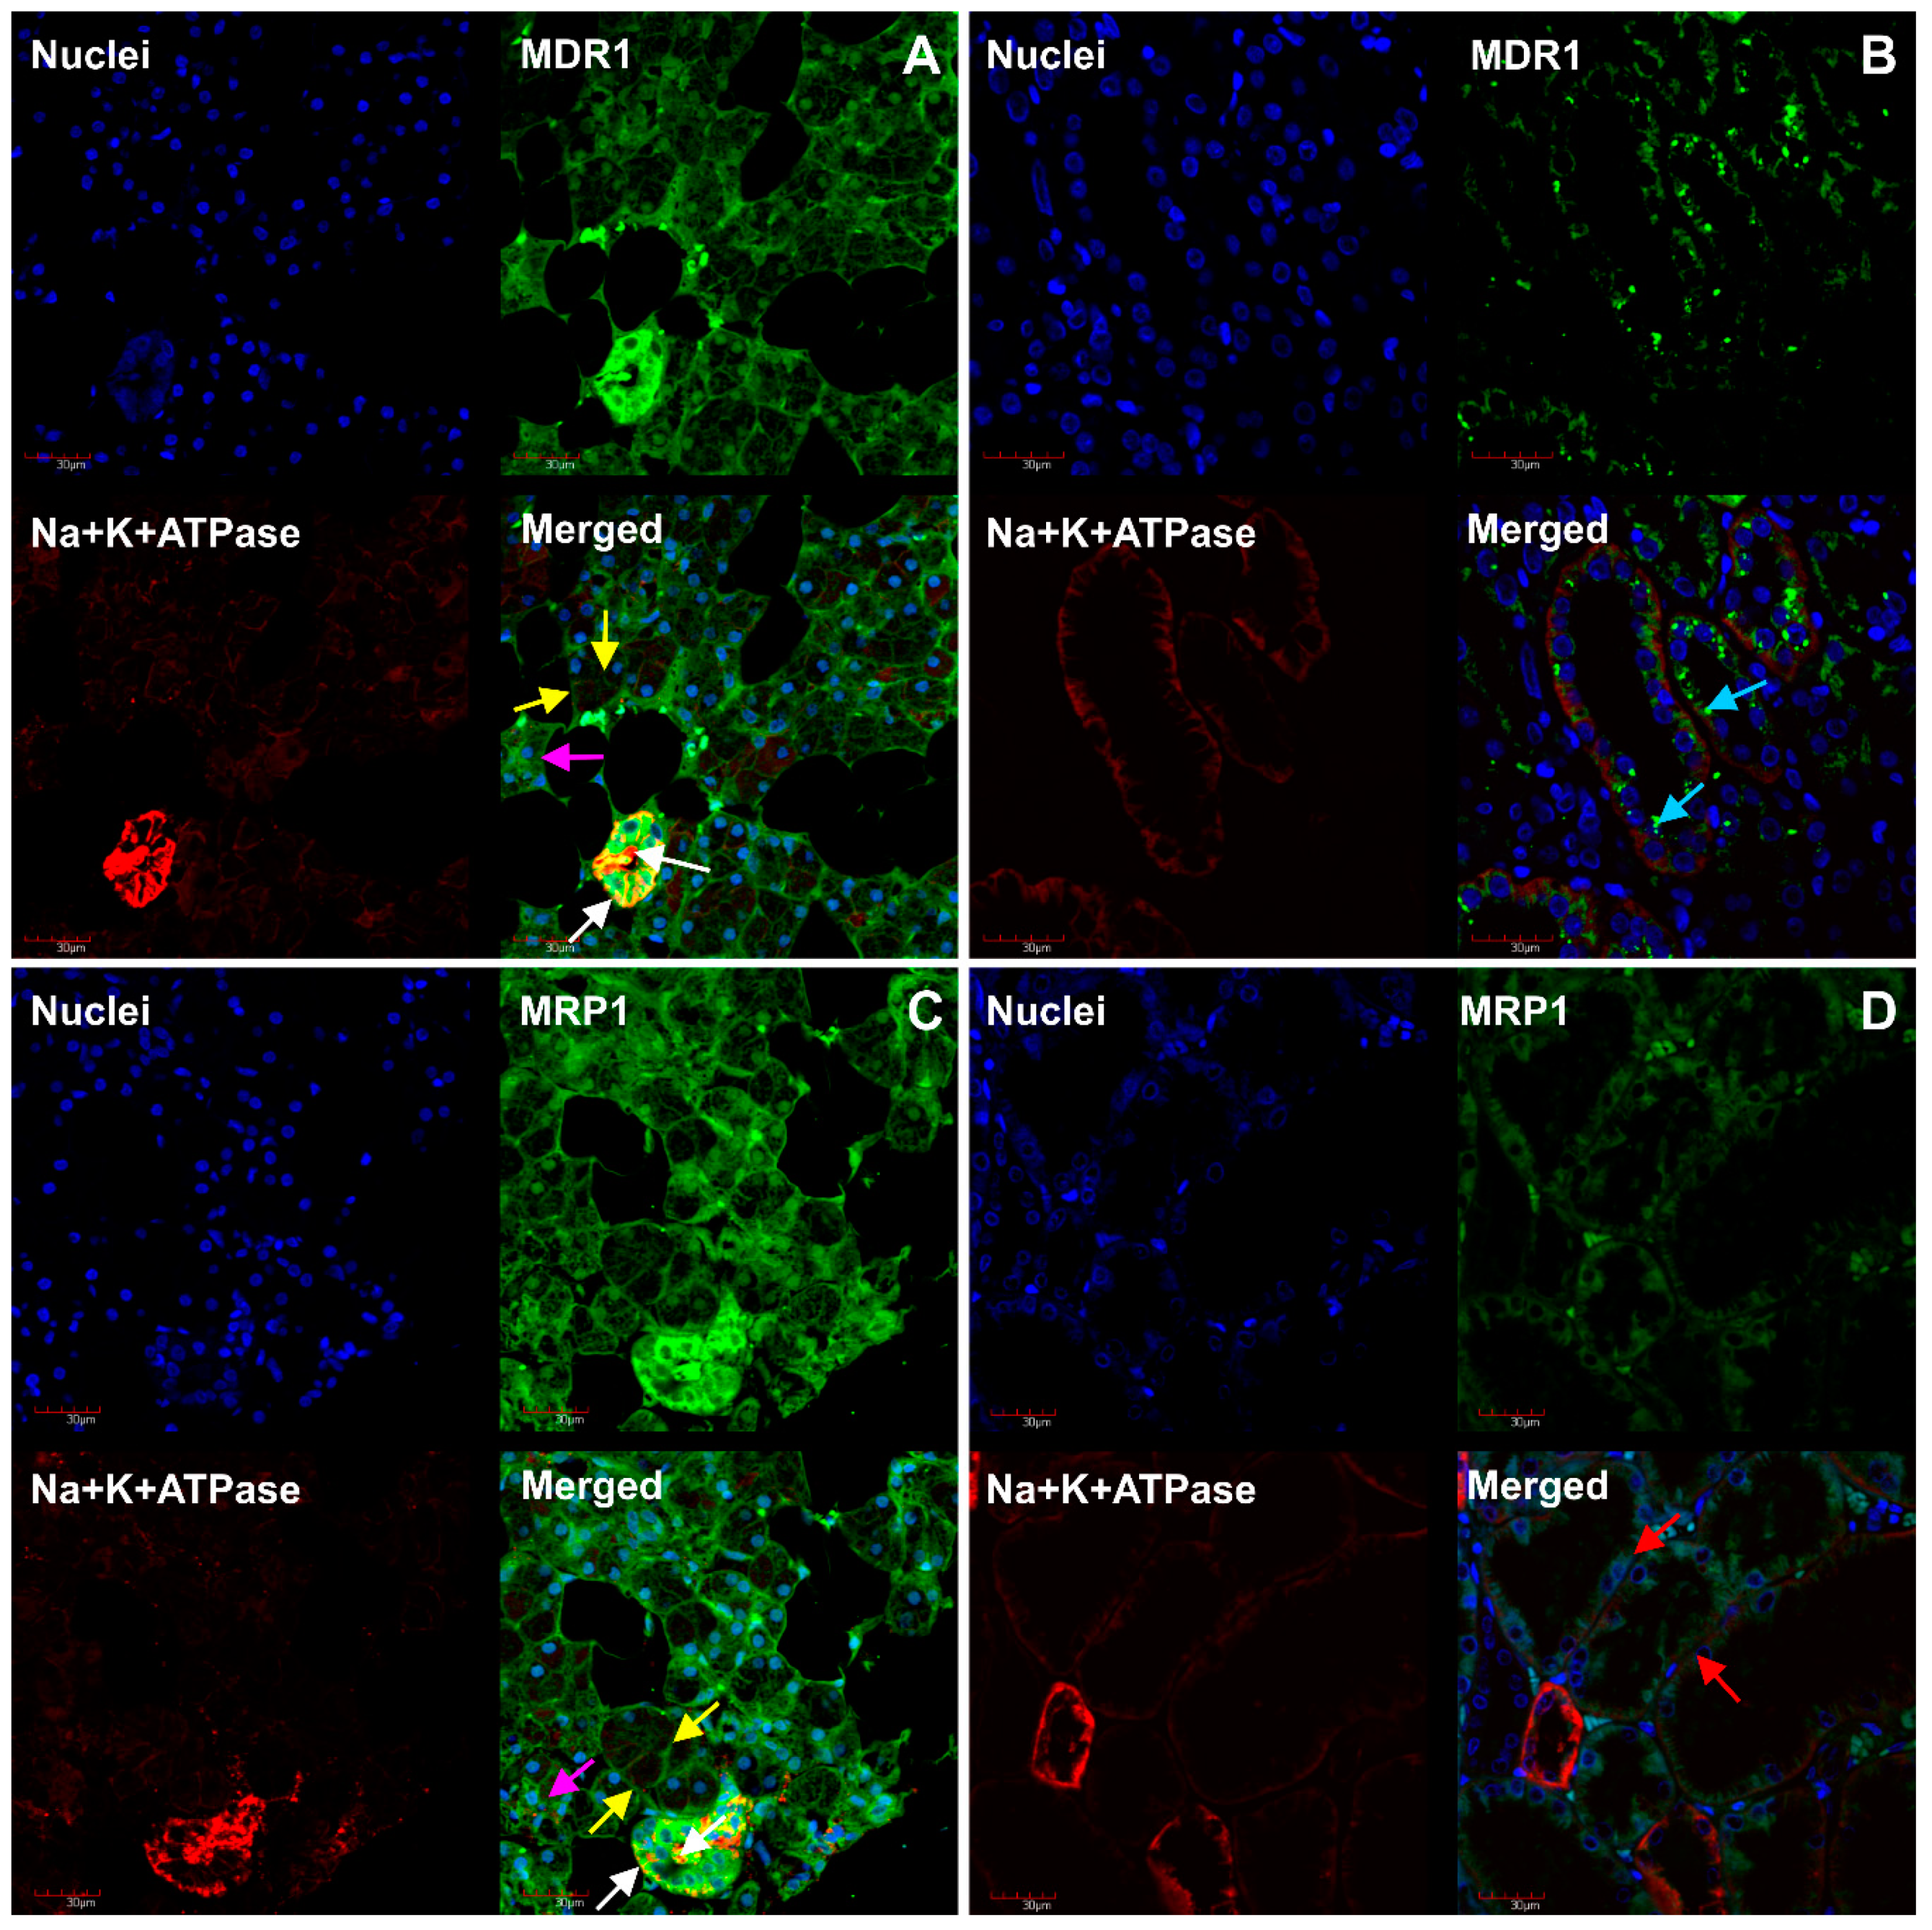
4.4. Immunofluorescent Analysis of MDR1, MRP1, OCT3, MATE1 and Na+/K+-ATPase
4.5. Statistical Analysis
Supplementary Materials
Author Contributions
Funding
Conflicts of Interest
References
- Vasiliou, V.; Vasiliou, K.; Nebert, D.W. Human ATP-binding cassette (ABC) transporter family. Hum. Genom. 2009, 3, 281–290. [Google Scholar] [CrossRef]
- Zamek-Gliszczynski, M.J.; Taub, M.E.; Chothe, P.P.; Chu, X.; Giacomini, K.M.; Kim, R.B.; Ray, A.S.; Stocker, S.L.; Unadkat, J.D.; Wittwer, M.B.; et al. Transporters in drug development: 2018 ITC recommendations for transporters of emerging clinical importance. Clin. Pharm. Ther. 2018, 104, 890–899. [Google Scholar] [CrossRef] [PubMed]
- Catalán, M.A.; Nakamoto, T.; Melvin, J.E. The salivary gland fluid secretion mechanism. J. Med. Investig. 2009, 56, 192–196. [Google Scholar] [CrossRef] [Green Version]
- Roussa, E. Channels and transporters in salivary glands. Cell Tissue Res. 2011, 343, 263–287. [Google Scholar] [CrossRef] [PubMed]
- Nishimura, M.; Naito, S. Tissue-specific mRNA expression profiles of human ATP-binding cassette and solute carrier transporter superfamilies. Drug Metab. Pharm. 2005, 20, 452–477. [Google Scholar] [CrossRef]
- Sun, Q.F.; Sun, Q.H.; Du, J.; Wang, S. Differential gene expression profiles of normal human parotid and submandibular glands. Oral Dis. 2008, 14, 500–509. [Google Scholar] [CrossRef]
- Drozdzik, M.; Mysliwiec, K.; Lewinska-Chelstowska, M.; Banach, J.; Drozdzik, A.; Grabarek, J. P-glycoprotein drug transporter MDR1 gene polymorphism in renal transplant patients with and without gingival overgrowth. J. Clin. Periodontol. 2004, 31, 758–763. [Google Scholar] [CrossRef]
- Uematsu, T.; Yamaoka, M.; Matsuura, T.; Doto, R.; Hotomi, H.; Yamada, A.; Hasumi-Nakayama, Y.; Kayamoto, D. P-glycoprotein expression in human major and minor salivary glands. Arch. Oral Biol. 2001, 46, 521–527. [Google Scholar] [CrossRef]
- Uematsu, T.; Yamaoka, M.; Doto, R.; Tanaka, H.; Matsuura, T.; Furusawa, K. Expression of ATP-binding cassette transporter in human salivary ducts. Arch. Oral Biol. 2003, 48, 87–90. [Google Scholar] [CrossRef]
- Ikarashi, R.; Shibasaki, K.; Yamaguchi, A. Immunohistochemical studies of organic anion transporters and urate transporter 1 expression in human salivary gland. Acta Odontol. Scand. 2013, 71, 312–316. [Google Scholar] [CrossRef]
- Lee, N.; Duan, H.; Hebert, M.F.; Liang, C.J.; Rice, K.M.; Wang, J. Taste of a pill: Organic cation transporter-3 (OCT3) mediates metformin accumulation and secretion in salivary glands. J. Biol. Chem. 2014, 289, 27055–27064. [Google Scholar] [CrossRef] [PubMed]
- Dawes, C.; Wong, D.T.W. Role of saliva and salivary diagnostics in the advancement of oral health. J Dent. Res. 2019, 98, 133–141. [Google Scholar] [CrossRef] [PubMed]
- Glaeser, H.; Bailey, D.G.; Dresser, G.K.; Gregor, J.C.; Schwarz, U.I.; McGrath, J.S.; Jolicoeur, E.; Lee, W.; Leake, B.F.; Tirona, R.G.; et al. Intestinal drug transporter expression and the impact of grapefruit juice in humans. Clin. Pharmacol. Ther. 2007, 81, 362–370. [Google Scholar] [CrossRef] [PubMed]
- Drozdzik, M.; Gröer, C.; Penski, J.; Lapczuk, J.; Ostrowski, M.; Lai, Y.; Prasad, B.; Unadkat, J.D.; Siegmund, W.; Oswald, S. Protein abundance of clinically relevant multidrug transporters along the entire length of the human intestine. Mol. Pharm. 2014, 11, 3547–3555. [Google Scholar] [CrossRef] [PubMed]
- Bruckmueller, H.; Martin, P.; Kähler, M.; Haenisch, S.; Ostrowski, M.; Drozdzik, M.; Siegmund, W.; Cascorbi, I.; Oswald, S. Clinically relevant multidrug transporters are regulated by microRNAs along the human intestine. Mol. Pharm. 2017, 14, 2245–2253. [Google Scholar] [CrossRef]
- Gameiro, M.; Silva, R.; Rocha-Pereira, C.; Carmo, H.; Carvalho, F.; Bastos, M.L.; Remião, F. Cellular Models and In Vitro Assays for the Screening of modulators of P-gp, MRP1 and BCRP. Molecules 2017, 22, 600. [Google Scholar] [CrossRef]
- Oliff, A.; Bleyer, W.A.; Poplack, D.G. Methotrexate-induced oral mucositis and salivary methotrexate concentrations. Cancer Chemother. Pharmacol. 1979, 2, 225–226. [Google Scholar] [CrossRef] [PubMed]
- Celio, L.A.; DiGregorio, G.J.; Ruch, E.; Pace, J.; Piraino, A.J. Doxorubicin and 5-fluorouracil plasma concentrations and detectability in parotid saliva. Eur. J. Clin. Pharmacol. 1983, 24, 261–266. [Google Scholar] [CrossRef]
- Ritschel, W.A.; Bykadi, G.; Norman, E.J.; Cluxton, R.J.; Denton, D. Salivary elimination of cyclophosphamide in man. J. Clin. Pharmacol. 1981, 21, 461–465. [Google Scholar] [CrossRef]
- Piercy, E.A.; Bawdon, R.E.; Mackowiak, P.A. Penetration of ciprofloxacin into saliva and nasal secretions and effect of the drug on the oropharyngeal flora of ill subjects. Antimicrob. Agents Chemother. 1989, 33, 1645–1646. [Google Scholar] [CrossRef] [Green Version]
- MacPhee, D.J. Methodological considerations for improving Western blot analysis. J. Pharmcol. Toxicol. Methods 2010, 61, 171–177. [Google Scholar] [CrossRef] [PubMed]
- Kamiie, J.; Ohtsuki, S.; Iwase, R.; Ohmine, K.; Katsukura, Y.; Yanai, K.; Sekine, Y.; Uchida, Y.; Ito, S.; Terasaki, T. Quantitative atlas of membrane transporter proteins: Development and application of a highly sensitive simultaneous LC/MS/MS method combined with novel in-silico peptide selection criteria. Pharm. Res. 2008, 25, 1469–1483. [Google Scholar] [CrossRef] [PubMed]
- Ohtsuki, S.; Schaefer, O.; Kawakami, H.; Inoue, T.; Liehner, S.; Saito, A.; Ishiguro, N.; Kishimoto, W.; Ludwig Schwellinger, E.; Ebner, T.; et al. Simultaneous absolute protein quantification of transporters, cytochromes P450, and UDP-glucuronosyltransferases as a novel approach for the characterization of individual human liver: Comparison with mRNA levels and activities. Drug Metab. Dispos. 2012, 40, 83–92. [Google Scholar] [CrossRef] [PubMed]
- Oswald, S.; Gröer, C.; Drozdzik, M.; Siegmund, W. Mass spectrometry-based targeted proteomics as a tool to elucidate the expression and function of intestinal drug transporters. AAPS J. 2013, 15, 1128–1140. [Google Scholar] [CrossRef] [PubMed]
- Bhatt, D.K.; Prasad, B. Critical Issues and Optimized Practices in Quantification of Protein Abundance Level to Determine Interindividual Variability in DMET Proteins by LC-MS/MS Proteomics. Clin. Pharmacol. Ther. 2018, 103, 619–630. [Google Scholar] [CrossRef]
- Gröer, C.; Brück, S.; Lai, Y.; Paulick, A.; Busemann, A.; Heidecke, C.D.; Siegmund, W.; Oswald, S. LC-MS/MS-based quantification of clinically relevant intestinal uptake and efflux transporter proteins. J. Pharm. Biomed. Anal. 2013, 85, 253–261. [Google Scholar] [CrossRef]
- Sakamoto, A.; Matsumaru, T.; Ishiguro, N.; Schaefer, O.; Ohtsuki, S.; Inoue, T.; Kawakami, H.; Terasaki, T. Reliability and robustness of simultaneous absolute quantification of drug transporters, cytochrome P450 enzymes, and Udp-glucuronosyltransferases in human liver tissue by multiplexed MRM/selected reaction monitoring mode tandem mass spectrometry with nano-liquid chromatography. J. Pharm. Sci. 2011, 100, 4037–4043. [Google Scholar]
- Gröer, C.; Busch, D.; Patrzyk, M.; Beyer, K.; Busemann, A.; Heidecke, C.D.; Drozdzik, M.; Siegmund, W.; Oswald, S. Absolute protein quantification of clinically relevant cytochrome P450 enzymes and UDP-glucuronosyltransferases by mass spectrometry-based targeted proteomics. J. Pharm. Biomed. Anal. 2014, 100, 393–401. [Google Scholar] [CrossRef]
- Kamal, M.A.; Keep, R.F.; Smith, D.E. Role and relevance of PEPT2 in drug disposition, dynamics, and toxicity. Drug Metab. Pharmacokinet. 2008, 23, 236–242. [Google Scholar] [CrossRef]
- Luckner, P.; Brandsch, M. Interaction of 31 beta-lactam antibiotics with the H+/peptide symporter PEPT2: Analysis of affinity constants and comparison with PEPT1. Eur. J. Pharm. Biopharm. 2005, 59, 17–24. [Google Scholar] [CrossRef]
- Idkaidek, N.; Arafat, T. Saliva versus plasma pharmacokinetics: Theory and application of a salivary excretion classification system. Mol. Pharm. 2012, 9, 2358–2363. [Google Scholar] [CrossRef] [PubMed]
- Troeltzsch, M.; Pache, C.; Probst, F.A.; Troeltzsch, M.; Ehrenfeld, M.; Otto, S. Antibiotic concentrations in saliva: A systematic review of the literature, with clinical implications for the treatment of sialadenitis. J. Oral Maxillofac. Surg. 2014, 72, 67–75. [Google Scholar] [CrossRef] [PubMed]
- Kurzawski, M.; Szelag-Pieniazek, S.; Lapczuk, J.; Wrzesinski, M.; Sienko, J.; Oswald, S.; Drozdzik, M. The reference liver—ABC and SLC drug transporters in healthy donor and metastatic livers. Pharmacol. Rep. 2019, 71, 738–745. [Google Scholar] [CrossRef] [PubMed]
- Nies, A.T.; Koepsell, H.; Winter, S.; Burk, O.; Klein, K.; Kerb, R.; Zanger, U.M.; Keppler, D.; Schwab, M.; Schaeffeler, E. Expression of organic cation transporters OCT1 (SLC22A1) and OCT3 (SLC22A3) is affected by genetic factors and cholestasis in human liver. Hepatology 2009, 50, 1227–1240. [Google Scholar] [CrossRef] [PubMed]
- Riches, Z.; Abanda, N.; Collier, A.C. BCRP protein levels do not differ regionally in adult human livers, but decline in the elderly. Chem. Biol. Interact. 2015, 242, 203–210. [Google Scholar] [CrossRef] [PubMed] [Green Version]
- Deo, A.K.; Prasad, B.; Balogh, L.; Lai, Y.; Unadkat, J.D. Interindividual variability in hepatic expression of the multidrug resistance-associated protein 2 (MRP2/ABCC2): Quantification by liquid chromatography/tandem mass spectrometry. Drug Metab. Dispos. 2012, 40, 852–855. [Google Scholar] [CrossRef]
- Urquhart, B.L.; Ware, J.A.; Tirona, R.G.; Ho, R.H.; Leake, B.F.; Schwarz, U.I.; Zaher, H.; Palandra, J.; Gregor, J.C.; Dresser, G.K.; et al. Breast cancer resistance protein (ABCG2) and drug disposition: Intestinal expression, polymorphisms and sulfasalazine as an in vivo probe. Pharmacogenet. Genom. 2008, 18, 439–448. [Google Scholar] [CrossRef] [PubMed]
- Han, X.; Aslanian, A.; Yates, J.R. Mass spectrometry for proteomics. Curr. Opin. Chem. Biol. 2008, 12, 483–490. [Google Scholar] [CrossRef] [Green Version]
- Bartnicka, L.; Kurzawski, M.; Drozdzik, A.; Plonska-Gosciniak, E.; Gornik, W.; Drozdzik, M. Effect of ABCB1 (MDR1) 3435C >T and 2677G >A,T polymorphisms and P-glycoprotein inhibitors on salivary digoxin secretion in congestive heart failure patients. Pharmacol. Rep. 2007, 59, 323–329. [Google Scholar]
- Schaiquevich, P.; Viviana, N.; Omar, T.; Modesto, R. Evaluation of acetaminophen P-glycoprotein-mediated salivary secretion by rat submandibular glands. Arch. Oral Biol. 2004, 49, 895–901. [Google Scholar] [CrossRef]
- Wagner, D.J.; Hu, T.; Wang, J. Polyspecific organic cation transporters and their impact on drug intracellular levels and pharmacodynamics. Pharmacol. Res. 2016, 111, 237–246. [Google Scholar] [CrossRef] [PubMed] [Green Version]
- Koike, Y.; Mineshita, S.; Uchiyama, Y.; Shudo, I.; Shimamura, K.; Togashi, H.; Saito, H. Monitoring of procainamide and N-acetylprocainamide concentration in saliva after oral administration of procainamide. Am. J. Ther. 1996, 3, 708–714. [Google Scholar] [CrossRef] [PubMed]
- Wagner, D.J.; Shireman, L.M.; Ahn, S.; Shen, D.D.; Wang, J. Disposition of methamphetamine and major metabolites in mice: Role of organic cation transporter 3 in tissue-selective accumulation of para-hydroxymethamphetamine. Drug Metab. Dispos. 2018, 46, 1277–1284. [Google Scholar] [CrossRef] [PubMed]
- Dobson, N.R.; Liu, X.; Rhein, L.M.; Darnall, R.A.; Corwin, M.J.; McEntire, B.L.; Ward, R.M.; James, L.P.; Sherwin, C.M.; Heeren, T.C.; et al. Salivary caffeine concentrations are comparable to plasma concentrations in preterm infants receiving extended caffeine therapy. Br. J. Clin. Pharmacol. 2016, 82, 754–761. [Google Scholar] [CrossRef] [PubMed] [Green Version]
- Stegaev, V.; Nies, A.T.; Porola, P.; Mieliauskaite, D.; Sánchez-Jiménez, F.; Urdiales, J.L.; Sillat, T.; Schwelberger, H.G.; Chazot, P.L.; Katebe, M.; et al. Histamine transport and metabolism are deranged in salivary glands in Sjogren’s syndrome. Rheumatology 2013, 52, 1599–1608. [Google Scholar] [CrossRef] [PubMed]
- Mullangi, R.; Agrawal, S.; Srinivas, N.R. Measurement of xenobiotics in saliva: Is saliva an attractive alternative matrix? Case studies and analytical perspectives. Biomed. Chromatogr. 2009, 23, 3–25. [Google Scholar] [CrossRef] [PubMed]
- Wen, J.; Luo, J.; Huang, W.; Tang, J.; Zhou, H.; Zhang, W. The Pharmacological and Physiological Role of Multidrug-Resistant Protein 4. J. Pharmacol. Exp. Ther. 2015, 354, 358–375. [Google Scholar] [CrossRef] [PubMed]
- Kiang, T.K.; Ensom, M.H. A Qualitative Review on the Pharmacokinetics of Antibiotics in Saliva: Implications on Clinical Pharmacokinetic Monitoring in Humans. Clin. Pharmacokinet. 2016, 55, 313–358. [Google Scholar] [CrossRef] [PubMed]
- Hutchinson, L.; Sinclair, M.; Reid, B.; Burnett, K.; Callan, B. A descriptive systematic review of salivary therapeutic drug monitoring in neonates and infants. Br. J. Clin. Pharmacol. 2018, 84, 1089–1108. [Google Scholar] [CrossRef] [PubMed]
- Shen, H.; Scialis, R.J.; Lehman-McKeeman, L. Xenobiotic Transporters in the Kidney: Function and Role in Toxicity. Semin. Nephrol. 2019, 39, 159–175. [Google Scholar] [CrossRef] [PubMed]

| mRNA vs. Protein | Salivary Gland |
|---|---|
| ABCC1 | 0.305 |
| ABCC4 | 0.392 |
| ABCG2 | −0.783 |
| PEPT2 | 0.000 |
| OCT3 | −0.133 |
| MATE1 | 0.511 |
| Na+/K+ATPase | 0.017 |
© 2019 by the authors. Licensee MDPI, Basel, Switzerland. This article is an open access article distributed under the terms and conditions of the Creative Commons Attribution (CC BY) license (http://creativecommons.org/licenses/by/4.0/).
Share and Cite
Lapczuk-Romanska, J.; Busch, D.; Gieruszczak, E.; Drozdzik, A.; Piotrowska, K.; Kowalczyk, R.; Oswald, S.; Drozdzik, M. Membrane Transporters in Human Parotid Gland-Targeted Proteomics Approach. Int. J. Mol. Sci. 2019, 20, 4825. https://doi.org/10.3390/ijms20194825
Lapczuk-Romanska J, Busch D, Gieruszczak E, Drozdzik A, Piotrowska K, Kowalczyk R, Oswald S, Drozdzik M. Membrane Transporters in Human Parotid Gland-Targeted Proteomics Approach. International Journal of Molecular Sciences. 2019; 20(19):4825. https://doi.org/10.3390/ijms20194825
Chicago/Turabian StyleLapczuk-Romanska, Joanna, Diana Busch, Ewa Gieruszczak, Agnieszka Drozdzik, Katarzyna Piotrowska, Robert Kowalczyk, Stefan Oswald, and Marek Drozdzik. 2019. "Membrane Transporters in Human Parotid Gland-Targeted Proteomics Approach" International Journal of Molecular Sciences 20, no. 19: 4825. https://doi.org/10.3390/ijms20194825
APA StyleLapczuk-Romanska, J., Busch, D., Gieruszczak, E., Drozdzik, A., Piotrowska, K., Kowalczyk, R., Oswald, S., & Drozdzik, M. (2019). Membrane Transporters in Human Parotid Gland-Targeted Proteomics Approach. International Journal of Molecular Sciences, 20(19), 4825. https://doi.org/10.3390/ijms20194825