Genetically Encoded Photosensitizers as Light-Triggered Antimicrobial Agents

 , , ,
, , ,  and
and 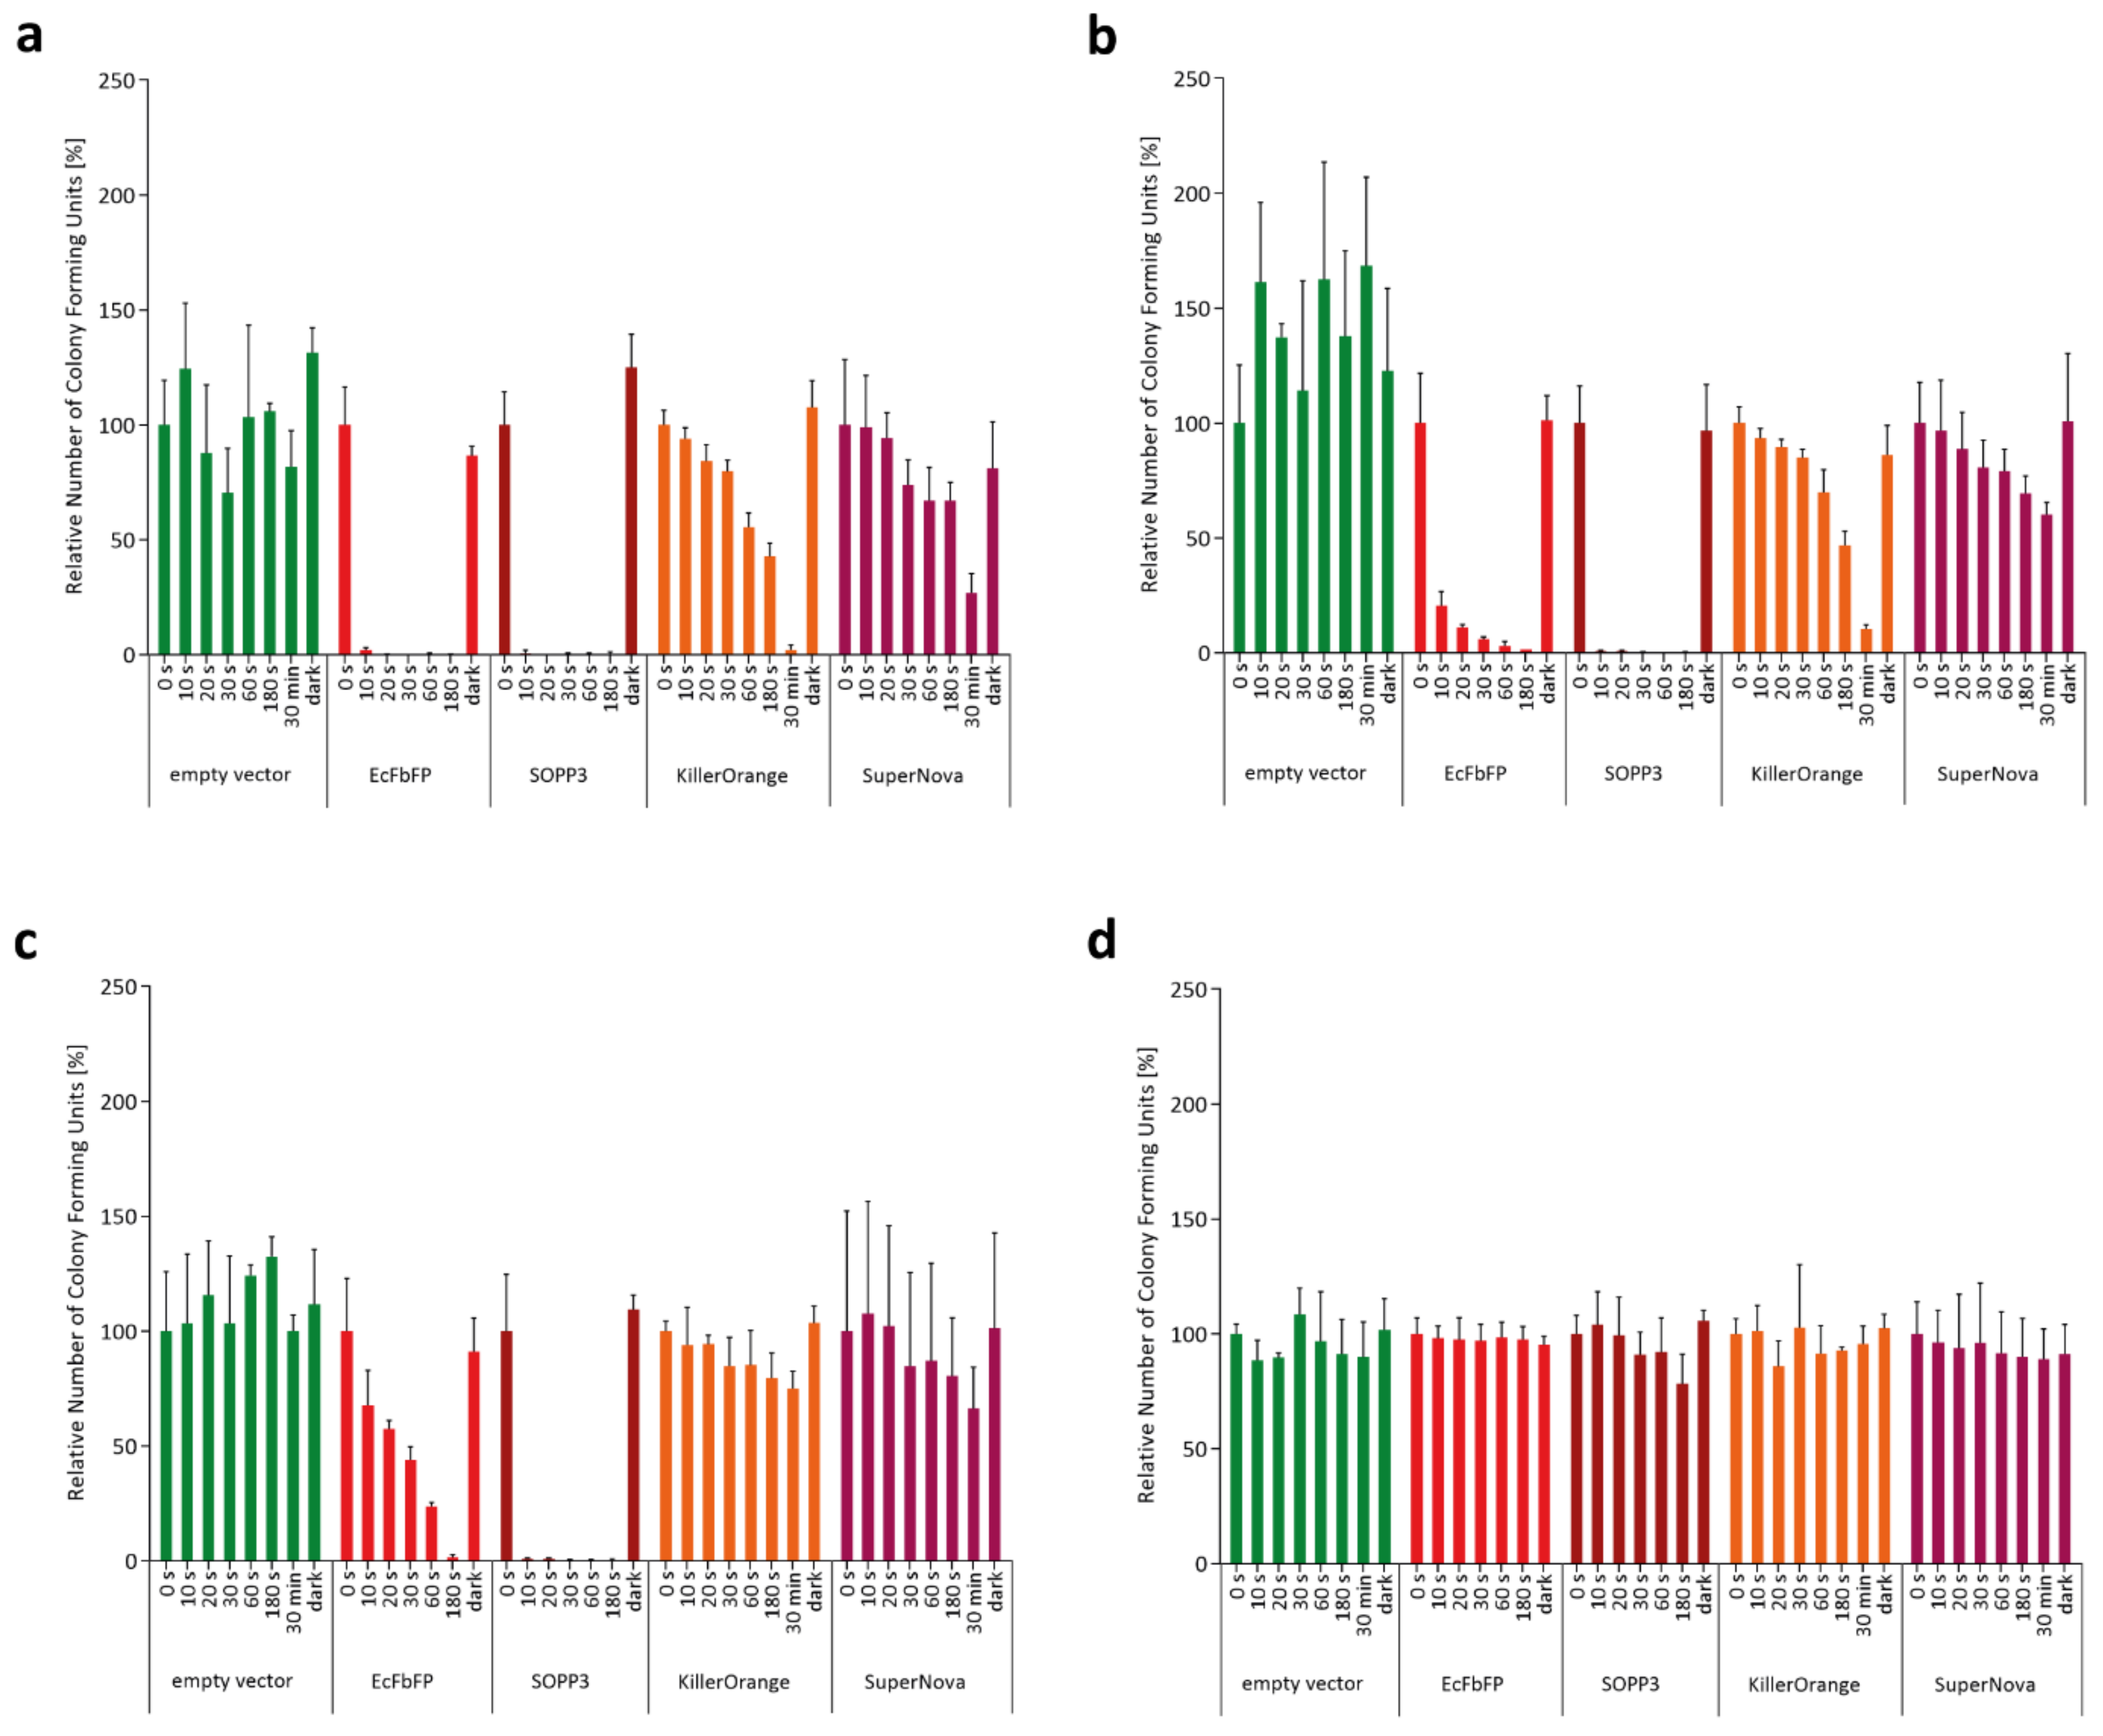
Abstract
:1. Introduction
2. Results and Discussion
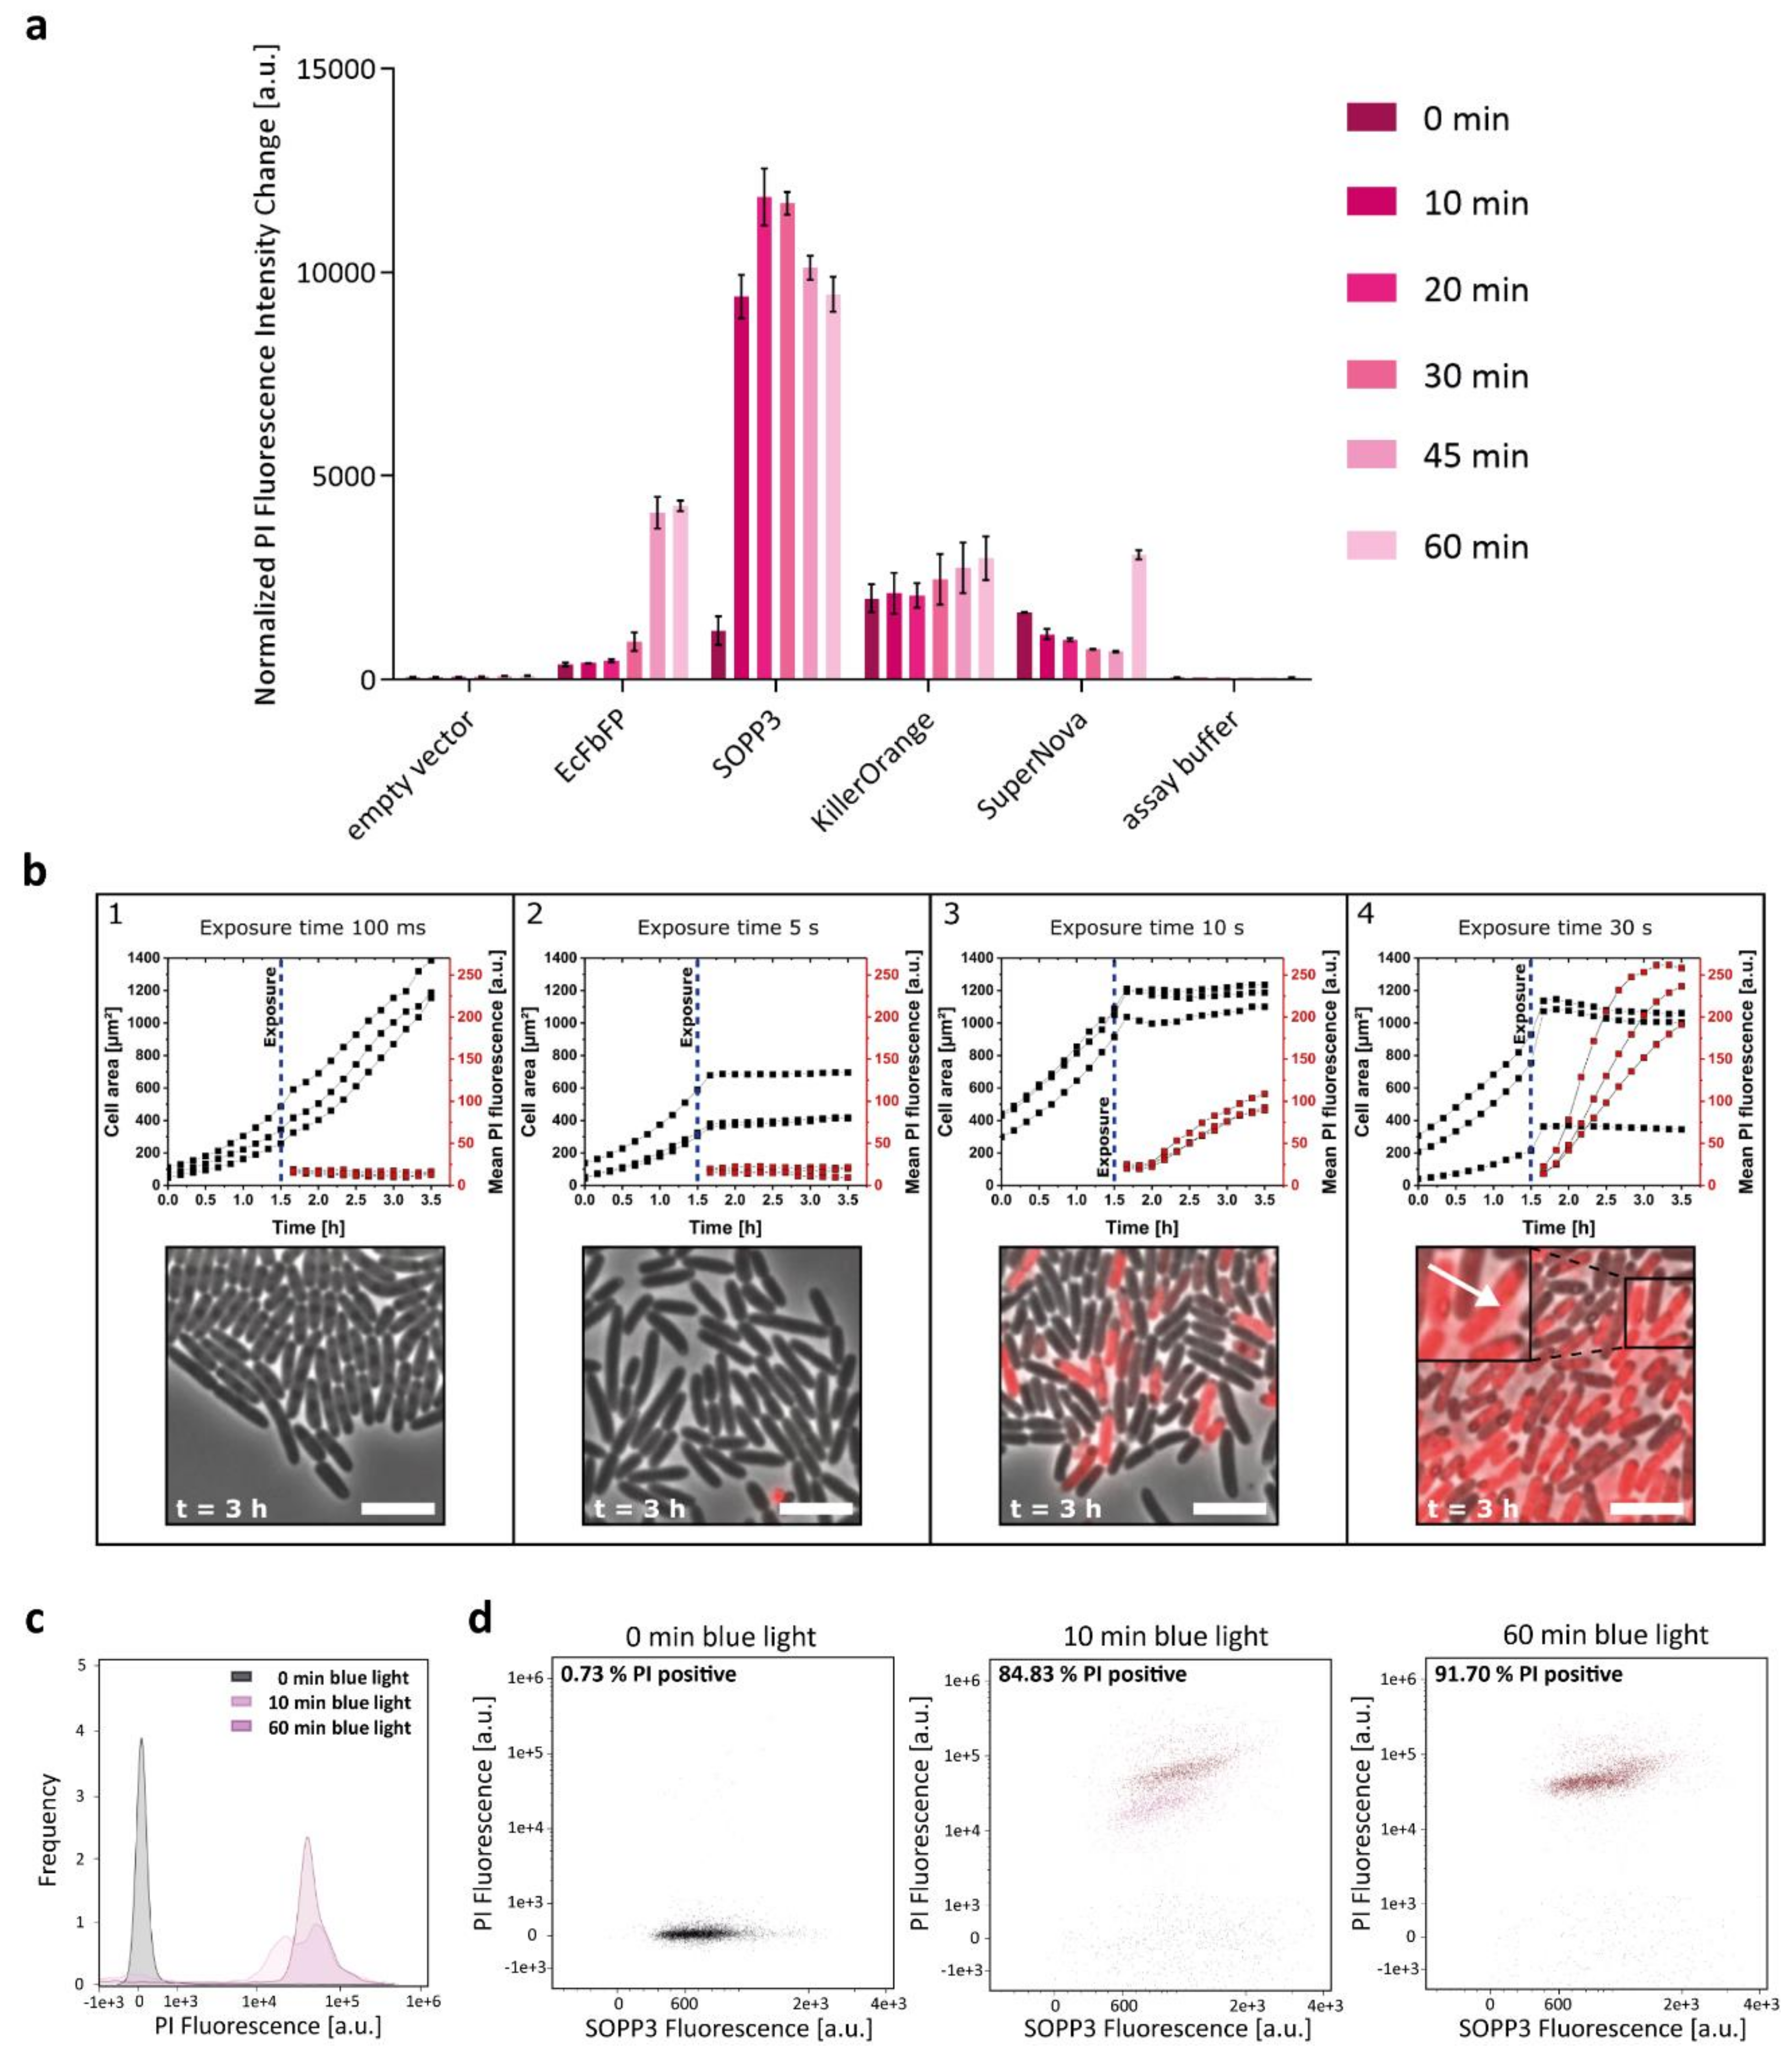
2.1. Phototoxicity of SOPP3, SuperNova, and KillerOrange in the Cytoplasm of E. coli
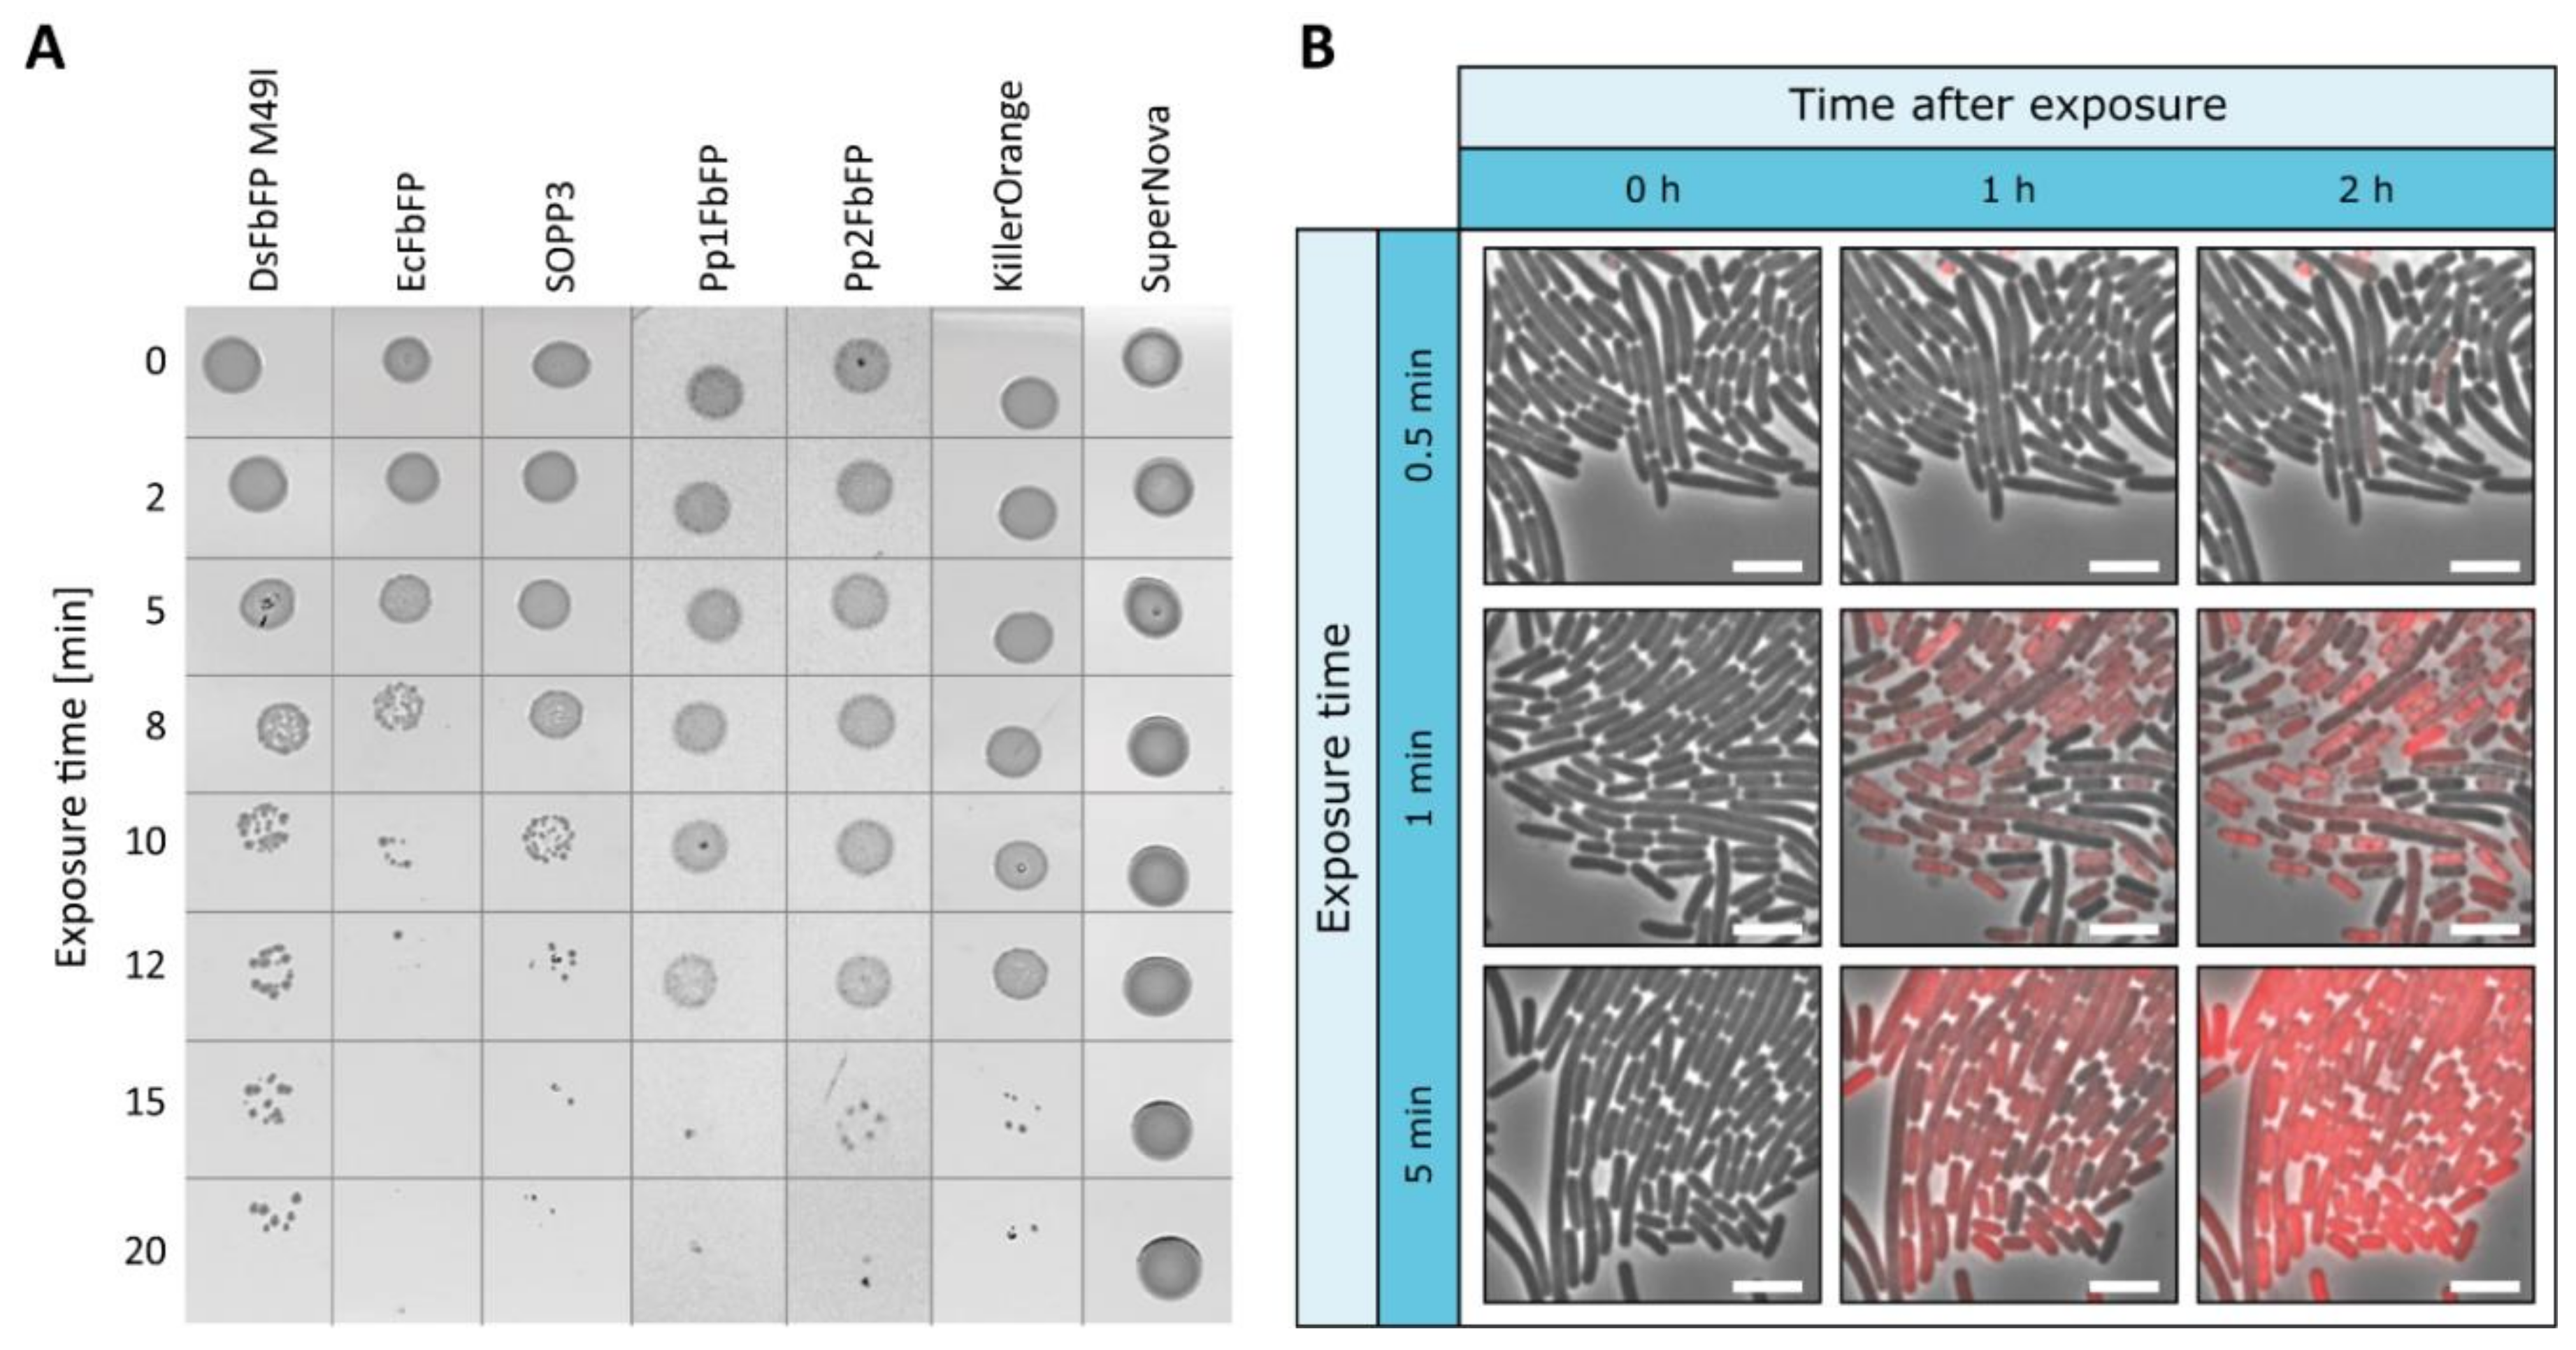
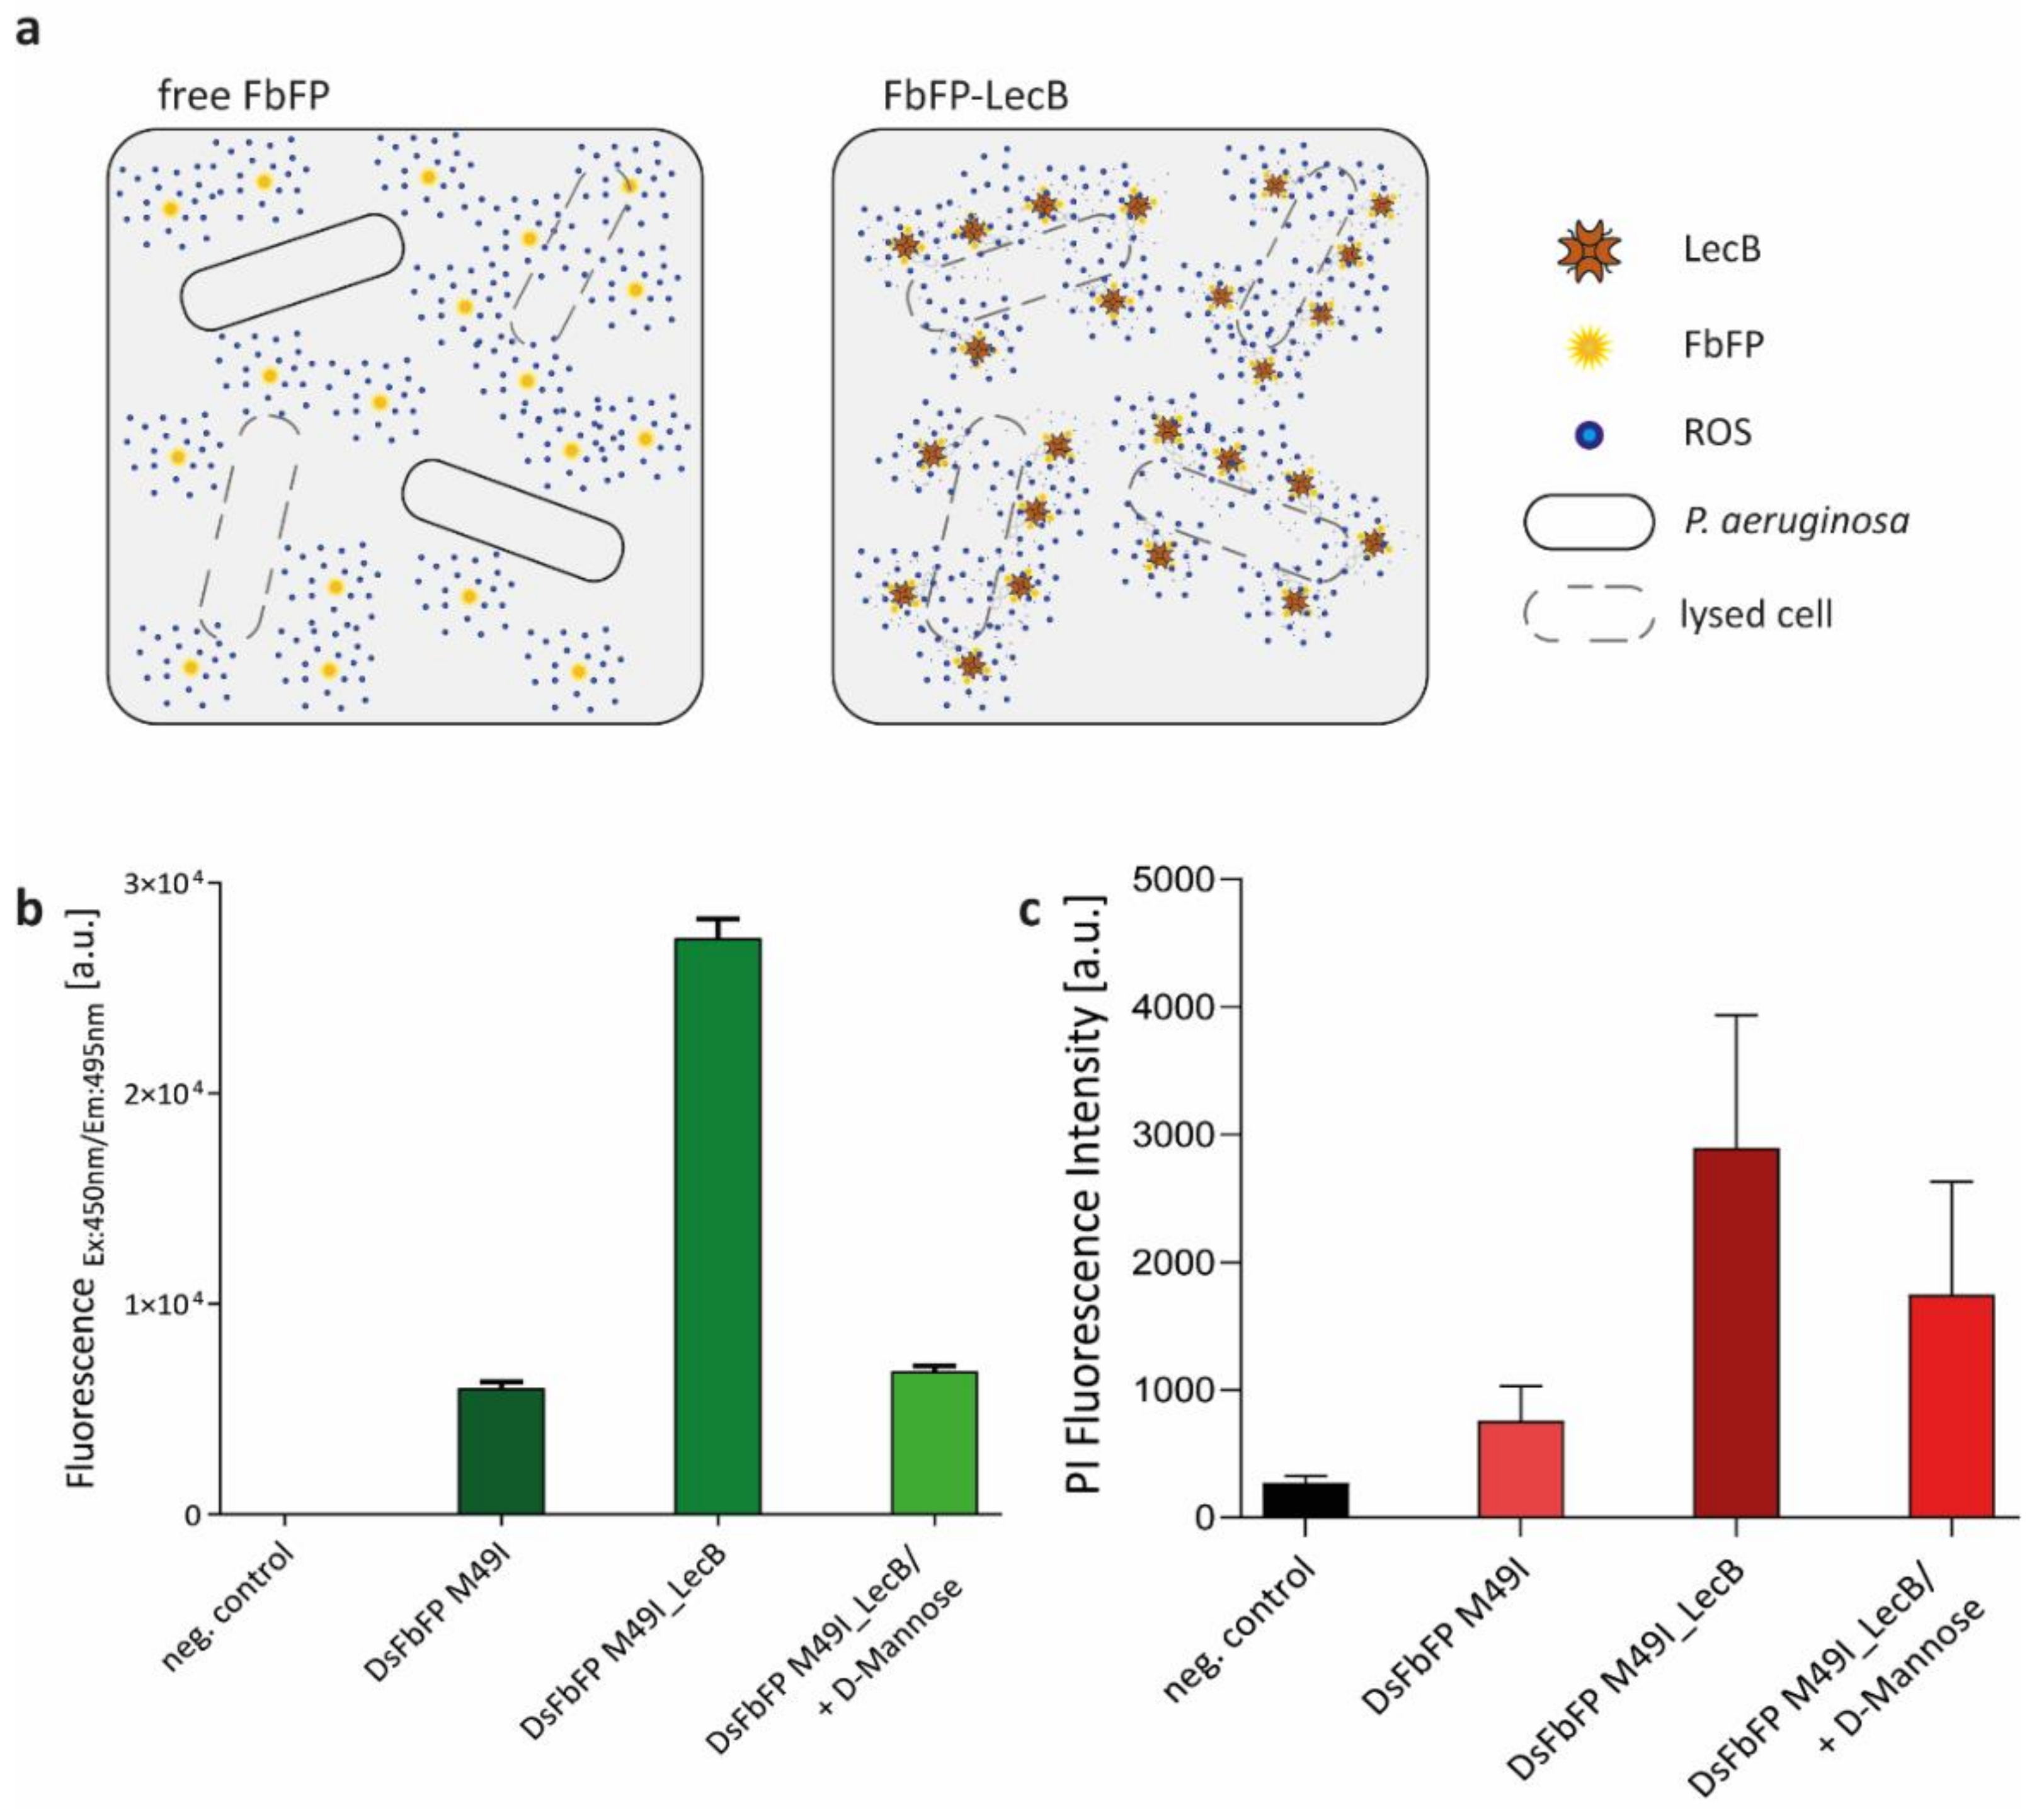
2.2. Extracellular Phototoxicity of Different LOV- and GFP-Photosensitizer Proteins
3. Materials and Methods
3.1. Construction of Expression Vectors
3.2. Heterologous Expression and Purification
3.3. Phototoxicity Analysis in Escherichia coli
3.4. Single-Cell Cultivation and Analysis
3.4.1. Flow Cytometry (FCM)
3.4.2. Microfluidic Chip Design and Fabrication
3.4.3. Microfluidic Single-Cell Cultivation
3.4.4. Live-Cell Imaging and Image Analysis
3.5. Extracellular Phototoxicity Analysis
3.6. Statistical Analysis
4. Conclusions
Supplementary Materials
Author Contributions
Funding
Acknowledgments
Conflicts of Interest
Abbreviations
| aPDI | Antimicrobial photodynamic inactivation |
| PDT | Photodynamic therapy |
| PS | Photosensitizer |
| ROS | Reactive oxygen species |
| ISC | Intersystem crossing |
| FP | Fluorescent protein |
| GFP | Green fluorescent protein |
| FbFP | Flavin-binding protein |
| LOV | Light-oxygen-voltage |
| SOG | Singlet Oxygen Generator |
| CALI | Chromophore-assisted light inactivation |
| SOPP | Singlet oxygen photosensitizing protein |
| LED | Light-emitting diode |
| CFU | Colony forming units |
| PI | Propidium iodide |
| FCM | Flow cytometry |
| FSC | Forward scatter |
| SSC | Side scatter |
| WHO | World Health Organization |
| HRP | Horseradish peroxidase |
| SOD | Superoxide dismutase |
| AI | Auto-induction medium |
| TB | Terrific Broth medium |
| LB | Lysogeny Broth medium |
| NTA | Nitrilotriacetic acid |
| OD | Optical density |
| LB | Lysogeny Broth medium |
| PBS | Phosphate buffer saline |
| ExCo | Extinction coefficient |
| PDMS | Polydimethylsiloxane |
| DM | Dichroic mirror |
| IPTG | Isopropyl-β-d-1-thiogalactopyranoside |
References
- Denis, T.G.; Dai, T.; Izikson, L.; Astrakas, C.; Anderson, R.R.; Hamblin, M.R.; Tegos, G.P. All you need is light. Virulence 2011, 2, 509–520. [Google Scholar] [CrossRef] [PubMed]
- Li, X.-Z.; Plésiat, P.; Nikaido, H. The Challenge of Efflux-Mediated Antibiotic Resistance in Gram-Negative Bacteria. Clin. Microbiol. Rev. 2015, 28, 337–418. [Google Scholar] [CrossRef] [PubMed] [Green Version]
- Jackson, N.; Czaplewski, L.; Piddock, L.J.V. Discovery and development of new antibacterial drugs: Learning from experience? J. Antimicrob. Chemother. 2018, 73, 1452–1459. [Google Scholar] [CrossRef] [PubMed]
- Moan, J.; Peng, Q. An outline of the hundred-year history of PDT. Anticancer. Res. 2003, 23, 3591–3600. [Google Scholar] [PubMed]
- Vatansever, F.; de Melo, W.C.M.A.; Avci, P.; Vecchio, D.; Sadasivam, M.; Gupta, A.; Chandran, R.; Karimi, M.; Parizotto, N.A.; Yin, R.; et al. Antimicrobial strategies centered around reactive oxygen species—Bactericidal antibiotics, photodynamic therapy, and beyond. FEMS Microbiol. Rev. 2013, 37, 955–989. [Google Scholar] [CrossRef] [PubMed]
- Robertson, C.A.; Evans, D.H.; Abrahamse, H. Photodynamic therapy (PDT): A short review on cellular mechanisms and cancer research applications for PDT. J. Photochem. Photobiol. B 2009, 96, 1–8. [Google Scholar] [CrossRef] [PubMed]
- Halliwell, B.; Gutteridge, J.M.C. Free Radicals in Biology and Medicine, 5th ed.; Oxford University Press: New York, NY, USA, 2015; ISBN 0198717482. [Google Scholar]
- Hamblin, M.R.; Abrahamse, H. Can light-based approaches overcome antimicrobial resistance? Drug Dev. Res. 2019, 80, 48–67. [Google Scholar] [CrossRef]
- Grinholc, M.; Szramka, B.; Olender, K.; Graczyk, A. Bactericidal effect of photodynamic therapy against methicillin-resistant Staphylococcus aureus strain with the use of various porphyrin photosensitizers. Acta Biochim. Pol. 2007, 54, 665–670. [Google Scholar] [PubMed]
- Maisch, T.; Spannberger, F.; Regensburger, J.; Felgenträger, A.; Bäumler, W. Fast and effective: Intense pulse light photodynamic inactivation of bacteria. J. Ind. Microbiol. Biotechnol. 2012, 39, 1013–1021. [Google Scholar] [CrossRef]
- Maisch, T. Resistance in antimicrobial photodynamic inactivation of bacteria. Photochem. Photobiol. Sci. 2015, 14, 1518–1526. [Google Scholar] [CrossRef] [Green Version]
- Jensen, R.L.; Arnbjerg, J.; Birkedal, H.; Ogilby, P.R. Singlet Oxygen’s Response to Protein Dynamics. J. Am. Chem. Soc. 2011, 133, 7166–7173. [Google Scholar] [CrossRef] [PubMed]
- Ogilby, P.R. Singlet oxygen: There is indeed something new under the sun. Chem. Soc. Rev. 2010, 39, 3181. [Google Scholar] [CrossRef] [PubMed]
- Mishina, N.M.; Tyurin-Kuzmin, P.A.; Markvicheva, K.N.; Vorotnikov, A.V.; Tkachuk, V.A.; Laketa, V.; Schultz, C.; Lukyanov, S.; Belousov, V.V. Does Cellular Hydrogen Peroxide Diffuse or Act Locally? Antioxid. Redox Signal. 2011, 14, 1–7. [Google Scholar] [CrossRef] [PubMed] [Green Version]
- Reth, M. Hydrogen peroxide as second messenger in lymphocyte activation. Nat. Immunol. 2002, 3, 1129–1134. [Google Scholar] [CrossRef] [PubMed]
- Sharma, S.K.; Mroz, P.; Dai, T.; Huang, Y.; St Denis, T.G.; Hamblin, M.R. Photodynamic Therapy for Cancer and for Infections: What Is the Difference? Isr. J. Chem. 2012, 52, 691–705. [Google Scholar] [CrossRef] [PubMed] [Green Version]
- Hamblin, M.R. Antimicrobial photodynamic inactivation: A bright new technique to kill resistant microbes. Curr. Opin. Microbiol. 2016, 33, 67–73. [Google Scholar] [CrossRef] [PubMed]
- Wainwright, M.; Maisch, T.; Nonell, S.; Plaetzer, K.; Almeida, A.; Tegos, G.P.; Hamblin, M.R. Photoantimicrobials—Are we afraid of the light? Lancet Infect. Dis. 2017, 17, e49–e55. [Google Scholar] [CrossRef]
- Sobotta, L.; Skupin-Mrugalska, P.; Piskorz, J.; Mielcarek, J. Porphyrinoid photosensitizers mediated photodynamic inactivation against bacteria. Eur. J. Med. Chem. 2019, 175, 72–106. [Google Scholar] [CrossRef]
- Huang, L.; Huang, Y.-Y.; Mroz, P.; Tegos, G.P.; Zhiyentayev, T.; Sharma, S.K.; Lu, Z.; Balasubramanian, T.; Krayer, M.; Ruzie, C.; et al. Stable Synthetic Cationic Bacteriochlorins as Selective Antimicrobial Photosensitizers. Antimicrob. Agents Chemother. 2010, 54, 3834–3841. [Google Scholar] [CrossRef] [Green Version]
- Tegos, G.P.; Demidova, T.N.; Arcila-Lopez, D.; Lee, H.; Wharton, T.; Gali, H.; Hamblin, M.R. Cationic Fullerenes Are Effective and Selective Antimicrobial Photosensitizers. Chem. Biol. 2005, 12, 1127–1135. [Google Scholar] [CrossRef] [Green Version]
- Wainwright, M. The development of phenothiazinium photosensitisers. Photodiagn. Photodyn. Ther. 2005, 2, 263–272. [Google Scholar] [CrossRef]
- Westberg, M.; Etzerodt, M.; Ogilby, P.R. Rational design of genetically encoded singlet oxygen photosensitizing proteins. Curr. Opin. Struct. Biol. 2019, 57, 56–62. [Google Scholar] [CrossRef] [PubMed]
- Vegh, R.B.; Solntsev, K.M.; Kuimova, M.K.; Cho, S.; Liang, Y.; Loo, B.L.W.; Tolbert, L.M.; Bommarius, A.S. Reactive oxygen species in photochemistry of the red fluorescent protein “Killer Red”. Chem. Commun. 2011, 47, 4887–4889. [Google Scholar] [CrossRef] [PubMed]
- Takemoto, K.; Matsuda, T.; Sakai, N.; Fu, D.; Noda, M.; Uchiyama, S.; Kotera, I.; Arai, Y.; Horiuchi, M.; Fukui, K.; et al. SuperNova, a monomeric photosensitizing fluorescent protein for chromophore-assisted light inactivation. Sci. Rep. 2013, 3, 2629. [Google Scholar] [CrossRef] [PubMed] [Green Version]
- Sarkisyan, K.S.; Zlobovskaya, O.A.; Gorbachev, D.A.; Bozhanova, N.G.; Sharonov, G.V.; Staroverov, D.B.; Egorov, E.S.; Ryabova, A.V.; Solntsev, K.M.; Mishin, A.S.; et al. KillerOrange, a Genetically Encoded Photosensitizer Activated by Blue and Green Light. PLoS ONE 2015, 10, e0145287. [Google Scholar] [CrossRef]
- Souslova, E.A.; Mironova, K.E.; Deyev, S.M. Applications of genetically encoded photosensitizer miniSOG: From correlative light electron microscopy to immunophotosensitizing. J. Biophotonics 2017, 10, 338–352. [Google Scholar] [CrossRef] [PubMed]
- Bulina, M.E.; Chudakov, D.M.; Britanova, O.V.; Yanushevich, Y.G.; Staroverov, D.B.; Chepurnykh, T.V.; Merzlyak, E.M.; Shkrob, M.A.; Lukyanov, S.; Lukyanov, K.A. A genetically encoded photosensitizer. Nat. Biotechnol. 2006, 24, 95–99. [Google Scholar] [CrossRef]
- Shu, X.; Lev-Ram, V.; Deerinck, T.J.; Qi, Y.; Ramko, E.B.; Davidson, M.W.; Jin, Y.; Ellisman, M.H.; Tsien, R.Y. A Genetically Encoded Tag for Correlated Light and Electron Microscopy of Intact Cells, Tissues, and Organisms. PLoS Biol. 2011, 9, e1001041. [Google Scholar] [CrossRef]
- Shibuya, T.; Tsujimoto, Y. Deleterious effects of mitochondrial ROS generated by KillerRed photodynamic action in human cell lines and C. elegans. J. Photochem. Photobiol. B Biol. 2012, 117, 1–12. [Google Scholar] [CrossRef]
- Wang, B.; Van Veldhoven, P.P.; Brees, C.; Rubio, N.; Nordgren, M.; Apanasets, O.; Kunze, M.; Baes, M.; Agostinis, P.; Fransen, M. Mitochondria are targets for peroxisome-derived oxidative stress in cultured mammalian cells. Free Radic. Biol. Med. 2013, 65, 882–894. [Google Scholar] [CrossRef] [Green Version]
- Serebrovskaya, E.O.; Edelweiss, E.F.; Stremovskiy, O.A.; Lukyanov, K.A.; Chudakov, D.M.; Deyev, S.M. Targeting cancer cells by using an antireceptor antibody-photosensitizer fusion protein. Proc. Natl. Acad. Sci. USA 2009, 106, 9221–9225. [Google Scholar] [CrossRef] [Green Version]
- Shirmanova, M.V.; Serebrovskaya, E.O.; Lukyanov, K.A.; Snopova, L.B.; Sirotkina, M.A.; Prodanetz, N.N.; Bugrova, M.L.; Minakova, E.A.; Turchin, I.V.; Kamensky, V.A.; et al. Phototoxic effects of fluorescent protein KillerRed on tumor cells in mice. J. Biophotonics 2013, 6, 283–290. [Google Scholar] [CrossRef]
- Liao, Z.-X.; Li, Y.-C.; Lu, H.-M.; Sung, H.-W. A genetically encoded KillerRed protein as an intrinsically generated photosensitizer for photodynamic therapy. Biomaterials 2014, 35, 500–508. [Google Scholar] [CrossRef]
- Mironova, K.E.; Proshkina, G.M.; Ryabova, A.V.; Stremovskiy, O.A.; Lukyanov, S.A.; Petrov, R.V.; Deyev, S.M. Genetically Encoded Immunophotosensitizer 4D5scFv-miniSOG is a Highly Selective Agent for Targeted Photokilling of Tumor Cells in vitro. Theranostics 2013, 3, 831–840. [Google Scholar] [CrossRef]
- Ryumina, A.P.; Serebrovskaya, E.O.; Shirmanova, M.V.; Snopova, L.B.; Kuznetsova, M.M.; Turchin, I.V.; Ignatova, N.I.; Klementieva, N.V.; Fradkov, A.F.; Shakhov, B.E.; et al. Flavoprotein miniSOG as a genetically encoded photosensitizer for cancer cells. Biochim. Biophys. Acta Gen. Subj. 2013, 1830, 5059–5067. [Google Scholar] [CrossRef]
- Bulina, M.E.; Lukyanov, K.A.; Britanova, O.V.; Onichtchouk, D.; Lukyanov, S.; Chudakov, D.M. Chromophore-assisted light inactivation (CALI) using the phototoxic fluorescent protein KillerRed. Nat. Protoc. 2006, 1, 947–953. [Google Scholar] [CrossRef]
- Destaing, O.; Planus, E.; Bouvard, D.; Oddou, C.; Badowski, C.; Bossy, V.; Raducanu, A.; Fourcade, B.; Albiges-Rizo, C.; Block, M.R. β1A Integrin Is a Master Regulator of Invadosome Organization and Function. Mol. Biol. Cell 2010, 21, 4108–4119. [Google Scholar] [CrossRef]
- Serebrovskaya, E.O.; Gorodnicheva, T.V.; Ermakova, G.V.; Solovieva, E.A.; Sharonov, G.V.; Zagaynova, E.V.; Chudakov, D.M.; Lukyanov, S.; Zaraisky, A.G.; Lukyanov, K.A. Light-induced blockage of cell division with a chromatin-targeted phototoxic fluorescent protein. Biochem. J. 2011, 435, 65–71. [Google Scholar] [CrossRef]
- Lan, L.; Nakajima, S.; Wei, L.; Sun, L.; Hsieh, C.-L.; Sobol, R.W.; Bruchez, M.; Van Houten, B.; Yasui, A.; Levine, A.S. Novel method for site-specific induction of oxidative DNA damage reveals differences in recruitment of repair proteins to heterochromatin and euchromatin. Nucleic Acids Res. 2014, 42, 2330–2345. [Google Scholar] [CrossRef]
- Westberg, M.; Bregnhøj, M.; Etzerodt, M.; Ogilby, P.R. No Photon Wasted: An Efficient and Selective Singlet Oxygen Photosensitizing Protein. J. Phys. Chem. B 2017, 121, 9366–9371. [Google Scholar] [CrossRef]
- Trewin, A.J.; Berry, B.J.; Wei, A.Y.; Bahr, L.L.; Foster, T.H.; Wojtovich, A.P. Light-induced oxidant production by fluorescent proteins. Free Radic. Biol. Med. 2018, 128, 157–164. [Google Scholar] [CrossRef]
- Pletnev, S.; Gurskaya, N.G.; Pletneva, N.V.; Lukyanov, K.A.; Chudakov, D.M.; Martynov, V.I.; Popov, V.O.; Kovalchuk, M.V.; Wlodawer, A.; Dauter, Z.; et al. Structural Basis for Phototoxicity of the Genetically Encoded Photosensitizer KillerRed. J. Biol. Chem. 2009, 284, 32028–32039. [Google Scholar] [CrossRef] [Green Version]
- Lee, W.; Kim, I.; Rhee, Y.M. A proton transfer network that generates deprotonated tyrosine is a key to producing reactive oxygen species in phototoxic KillerRed protein. Phys. Chem. Chem. Phys. 2018, 20, 22342–22350. [Google Scholar] [CrossRef]
- Drepper, T.; Eggert, T.; Circolone, F.; Heck, A.; Krauß, U.; Guterl, J.-K.; Wendorff, M.; Losi, A.; Gärtner, W.; Jaeger, K.-E. Reporter proteins for in vivo fluorescence without oxygen. Nat. Biotechnol. 2007, 25, 443–445. [Google Scholar] [CrossRef]
- Wingen, M.; Potzkei, J.; Endres, S.; Casini, G.; Rupprecht, C.; Fahlke, C.; Krauss, U.; Jaeger, K.-E.; Drepper, T.; Gensch, T. The photophysics of LOV-based fluorescent proteins—New tools for cell biology. Photochem. Photobiol. Sci. 2014, 13, 875–883. [Google Scholar] [CrossRef]
- Endres, S.; Wingen, M.; Torra, J.; Ruiz-González, R.; Polen, T.; Bosio, G.; Bitzenhofer, N.L.; Hilgers, F.; Gensch, T.; Nonell, S.; et al. An optogenetic toolbox of LOV-based photosensitizers for light-driven killing of bacteria. Sci. Rep. 2018, 8, 15021. [Google Scholar] [CrossRef]
- Binder, D.; Grünberger, A.; Loeschcke, A.; Probst, C.; Bier, C.; Pietruszka, J.; Wiechert, W.; Kohlheyer, D.; Jaeger, K.-E.; Drepper, T. Light-responsive control of bacterial gene expression: Precise triggering of the lac promoter activity using photocaged IPTG. Integr. Biol. 2014, 6, 755–765. [Google Scholar] [CrossRef]
- Otto, M. Staphylococcus Epidermidis—The “Accidental” Pathogen. Nat. Rev. Microbiol. 2009, 7, 555–567. [Google Scholar] [CrossRef]
- Van Wamel, W.J.B. Staphylococcus aureus infections, some second thoughts. Curr. Opin. Infect. Dis. 2017, 30, 303–308. [Google Scholar] [CrossRef]
- Barraud, O.; Badell, E.; Denis, F.; Guiso, N.; Ploy, M.-C. Antimicrobial Drug Resistance in Corynebacterium diphtheriae mitis. Emerg. Infect. Dis. 2011, 17, 2078–2080. [Google Scholar] [CrossRef]
- Miotto, P.; Cirillo, D.M.; Migliori, G.B. Drug Resistance in Mycobacterium tuberculosis: Molecular Mechanisms Challenging Fluoroquinolones and Pyrazinamide Effectiveness. Chest 2015, 147, 1135–1143. [Google Scholar] [CrossRef]
- Tacconelli, E.; Magrini, N.; Kahlmeter, G.; Singh, N. Global Priority List of Antibiotic-Resistant Bacteria to Guide Research, Discovery, and Development of New Antibiotics; World Health Organization: Geneva, Switzerland, 2017; Volume 27, p. 7. [Google Scholar]
- Wang, D.; Li, Q.; Qiu, J.; Zhang, X.; Ge, N.; Liu, X. Corrosion Motivated ROS Generation Helps Endow Titanium with Broad-Spectrum Antibacterial Abilities. Adv. Mater. Interfaces 2019, 6, 1900514. [Google Scholar] [CrossRef]
- Huang, L.; Xuan, Y.; Koide, Y.; Zhiyentayev, T.; Tanaka, M.; Hamblin, M.R. Type I and Type II mechanisms of antimicrobial photodynamic therapy: An in vitro study on gram-negative and gram-positive bacteria. Lasers Surg. Med. 2012, 44, 490–499. [Google Scholar] [CrossRef] [Green Version]
- Mai-Prochnow, A.; Clauson, M.; Hong, J.; Murphy, A.B. Gram positive and Gram negative bacteria differ in their sensitivity to cold plasma. Sci. Rep. 2016, 6, 38610. [Google Scholar] [CrossRef] [Green Version]
- Dahl, T.A.; Midden, W.R.; Hartman, P.E. Comparison of killing of gram-negative and gram-positive bacteria by pure singlet oxygen. J. Bacteriol. 1989, 171, 2188–2194. [Google Scholar] [CrossRef] [Green Version]
- Passos da Silva, D.; Matwichuk, M.L.; Townsend, D.O.; Reichhardt, C.; Lamba, D.; Wozniak, D.J.; Parsek, M.R. The Pseudomonas aeruginosa lectin LecB binds to the exopolysaccharide Psl and stabilizes the biofilm matrix. Nat. Commun. 2019, 10, 2183. [Google Scholar] [CrossRef]
- Bücher, K.S.; Babic, N.; Freichel, T.; Kovacic, F.; Hartmann, L. Monodisperse Sequence-Controlled α-L-Fucosylated Glycooligomers and Their Multivalent Inhibitory Effects on LecB. Macromol. Biosci. 2018, 18, 1800337. [Google Scholar] [CrossRef]
- Cott, C.; Thuenauer, R.; Landi, A.; Kühn, K.; Juillot, S.; Imberty, A.; Madl, J.; Eierhoff, T.; Römer, W. Pseudomonas aeruginosa lectin LecB inhibits tissue repair processes by triggering β-catenin degradation. Biochim. Biophys. Acta Mol. Cell Res. 2016, 1863, 1106–1118. [Google Scholar] [CrossRef]
- Imberty, A.; Wimmerová, M.; Mitchell, E.P.; Gilboa-Garber, N. Structures of the lectins from Pseudomonas aeruginosa: Insights into the molecular basis for host glycan recognition. Microbes Infect. 2004, 6, 221–228. [Google Scholar] [CrossRef]
- Tielker, D.; Rosenau, F.; Bartels, K.-M.; Rosenbaum, T.; Jaeger, K.-E. Lectin-based affinity tag for one-step protein purification. Biotechniques 2006, 41, 327–332. [Google Scholar] [CrossRef]
- Bodenberger, N.; Kubiczek, D.; Halbgebauer, D.; Rimola, V.; Wiese, S.; Mayer, D.; Rodriguez Alfonso, A.A.; Ständker, L.; Stenger, S.; Rosenau, F. Lectin-Functionalized Composite Hydrogels for “Capture-and-Killing” of Carbapenem-Resistant Pseudomonas aeruginosa. Biomacromolecules 2018, 19, 2472–2482. [Google Scholar] [CrossRef]
- Hanahan, D. Studies on transformation of Escherichia coli with plasmids. J. Mol. Biol. 1983, 166, 557–580. [Google Scholar] [CrossRef]
- Hennemann, J.; Iwasaki, R.S.; Grund, T.N.; Diensthuber, R.P.; Richter, F.; Möglich, A. Optogenetic Control by Pulsed Illumination. ChemBioChem 2018, 19, 1296–1304. [Google Scholar] [CrossRef]
- Crowley, L.C.; Scott, A.P.; Marfell, B.J.; Boughaba, J.A.; Chojnowski, G.; Waterhouse, N.J. Measuring Cell Death by Propidium Iodide Uptake and Flow Cytometry. Cold Spring Harb. Protoc. 2016, 2016. [Google Scholar] [CrossRef]
- Gruenberger, A.; Probst, C.; Heyer, A.; Wiechert, W.; Frunzke, J.; Kohlheyer, D. Microfluidic Picoliter Bioreactor for Microbial Single-Cell Analysis: Fabrication, System Setup, and Operation. J. Vis. Exp. 2013. [Google Scholar] [CrossRef]
- Grünberger, A.; Probst, C.; Helfrich, S.; Nanda, A.; Stute, B.; Wiechert, W.; von Lieres, E.; Nöh, K.; Frunzke, J.; Kohlheyer, D. Spatiotemporal microbial single-cell analysis using a high-throughput microfluidics cultivation platform. Cytom. Part A 2015, 87, 1101–1115. [Google Scholar] [CrossRef]
- Burmeister, A.; Hilgers, F.; Langner, A.; Westerwalbesloh, C.; Kerkhoff, Y.; Tenhaef, N.; Drepper, T.; Kohlheyer, D.; von Lieres, E.; Noack, S.; et al. A microfluidic co-cultivation platform to investigate microbial interactions at defined microenvironments. Lab Chip 2019, 19, 98–110. [Google Scholar] [CrossRef]
- Probst, C.; Grünberger, A.; Braun, N.; Helfrich, S.; Nöh, K.; Wiechert, W.; Kohlheyer, D. Rapid inoculation of single bacteria into parallel picoliter fermentation chambers. Anal. Methods 2015, 7, 91–98. [Google Scholar] [CrossRef]
- Ronneberger, O.; Fischer, P.; Brox, T. U-Net: Convolutional Networks for Biomedical Image Segmentation. In Proceedings of the Medical Image Computing and Computer-Assisted Intervention-MICCAI 2015, Munich, Germany, 5–9 October 2015; Navab, N., Hornegger, J., Wells, W.M., Frangi, A.F., Eds.; Springer International Publishing: Cham, Switzerland, 2015; pp. 234–241. [Google Scholar] [Green Version]
- Schindelin, J.; Arganda-Carreras, I.; Frise, E.; Kaynig, V.; Longair, M.; Pietzsch, T.; Preibisch, S.; Rueden, C.; Saalfeld, S.; Schmid, B.; et al. Fiji: An open-source platform for biological-image analysis. Nat. Methods 2012, 9, 676–682. [Google Scholar] [CrossRef]


© 2019 by the authors. Licensee MDPI, Basel, Switzerland. This article is an open access article distributed under the terms and conditions of the Creative Commons Attribution (CC BY) license (http://creativecommons.org/licenses/by/4.0/).
Share and Cite
Hilgers, F.; Bitzenhofer, N.L.; Ackermann, Y.; Burmeister, A.; Grünberger, A.; Jaeger, K.-E.; Drepper, T. Genetically Encoded Photosensitizers as Light-Triggered Antimicrobial Agents. Int. J. Mol. Sci. 2019, 20, 4608. https://doi.org/10.3390/ijms20184608
Hilgers F, Bitzenhofer NL, Ackermann Y, Burmeister A, Grünberger A, Jaeger K-E, Drepper T. Genetically Encoded Photosensitizers as Light-Triggered Antimicrobial Agents. International Journal of Molecular Sciences. 2019; 20(18):4608. https://doi.org/10.3390/ijms20184608
Chicago/Turabian StyleHilgers, Fabienne, Nora Lisa Bitzenhofer, Yannic Ackermann, Alina Burmeister, Alexander Grünberger, Karl-Erich Jaeger, and Thomas Drepper. 2019. "Genetically Encoded Photosensitizers as Light-Triggered Antimicrobial Agents" International Journal of Molecular Sciences 20, no. 18: 4608. https://doi.org/10.3390/ijms20184608
APA StyleHilgers, F., Bitzenhofer, N. L., Ackermann, Y., Burmeister, A., Grünberger, A., Jaeger, K.-E., & Drepper, T. (2019). Genetically Encoded Photosensitizers as Light-Triggered Antimicrobial Agents. International Journal of Molecular Sciences, 20(18), 4608. https://doi.org/10.3390/ijms20184608