Selective Blockade of the Metabotropic Glutamate Receptor mGluR5 Protects Mouse Livers in In Vitro and Ex Vivo Models of Ischemia Reperfusion Injury

 ,
, 

Abstract
: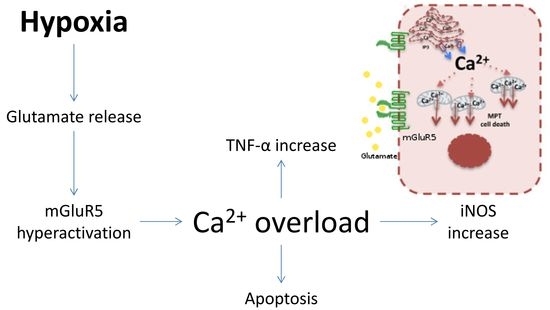
1. Introduction
2. Results
2.1. mGluR5 NAMs Protect Rat Hepatocytes from Ischemic Injury Regardless of Their Ability to Deplete ATP
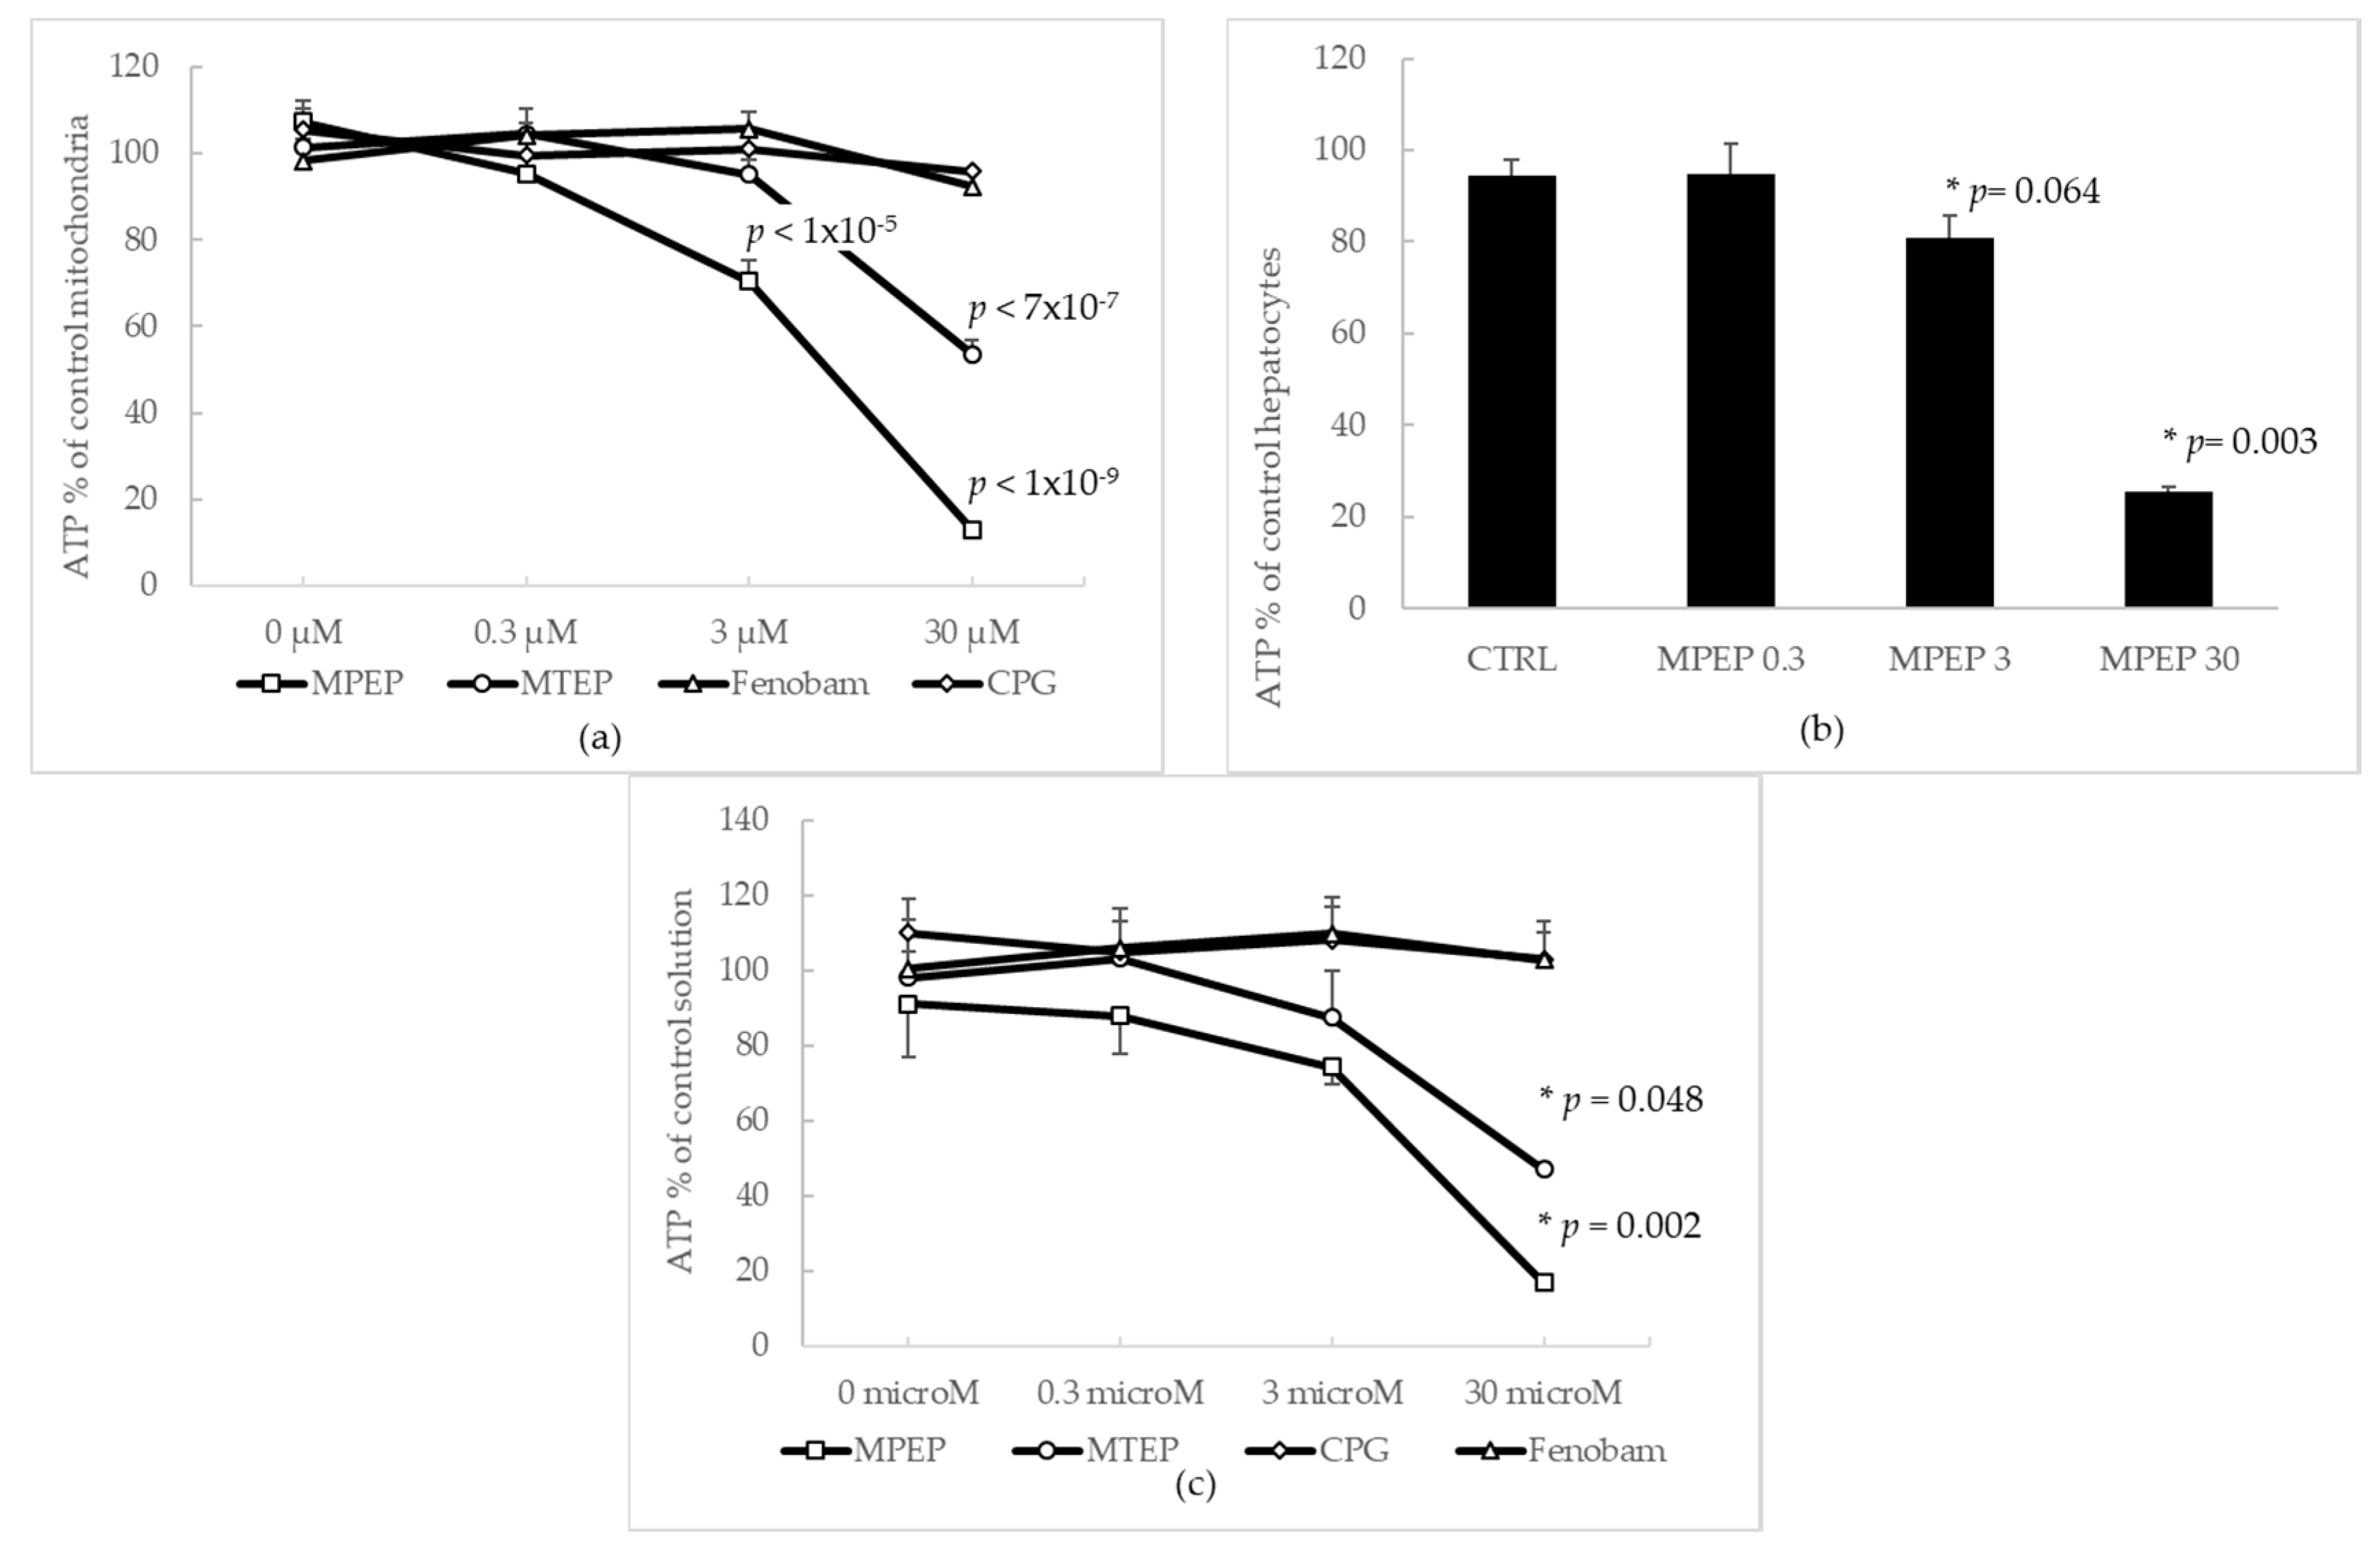
2.1.1. Effects of MPEP and MTEP on Cellular and Mitochondrial ATP Content
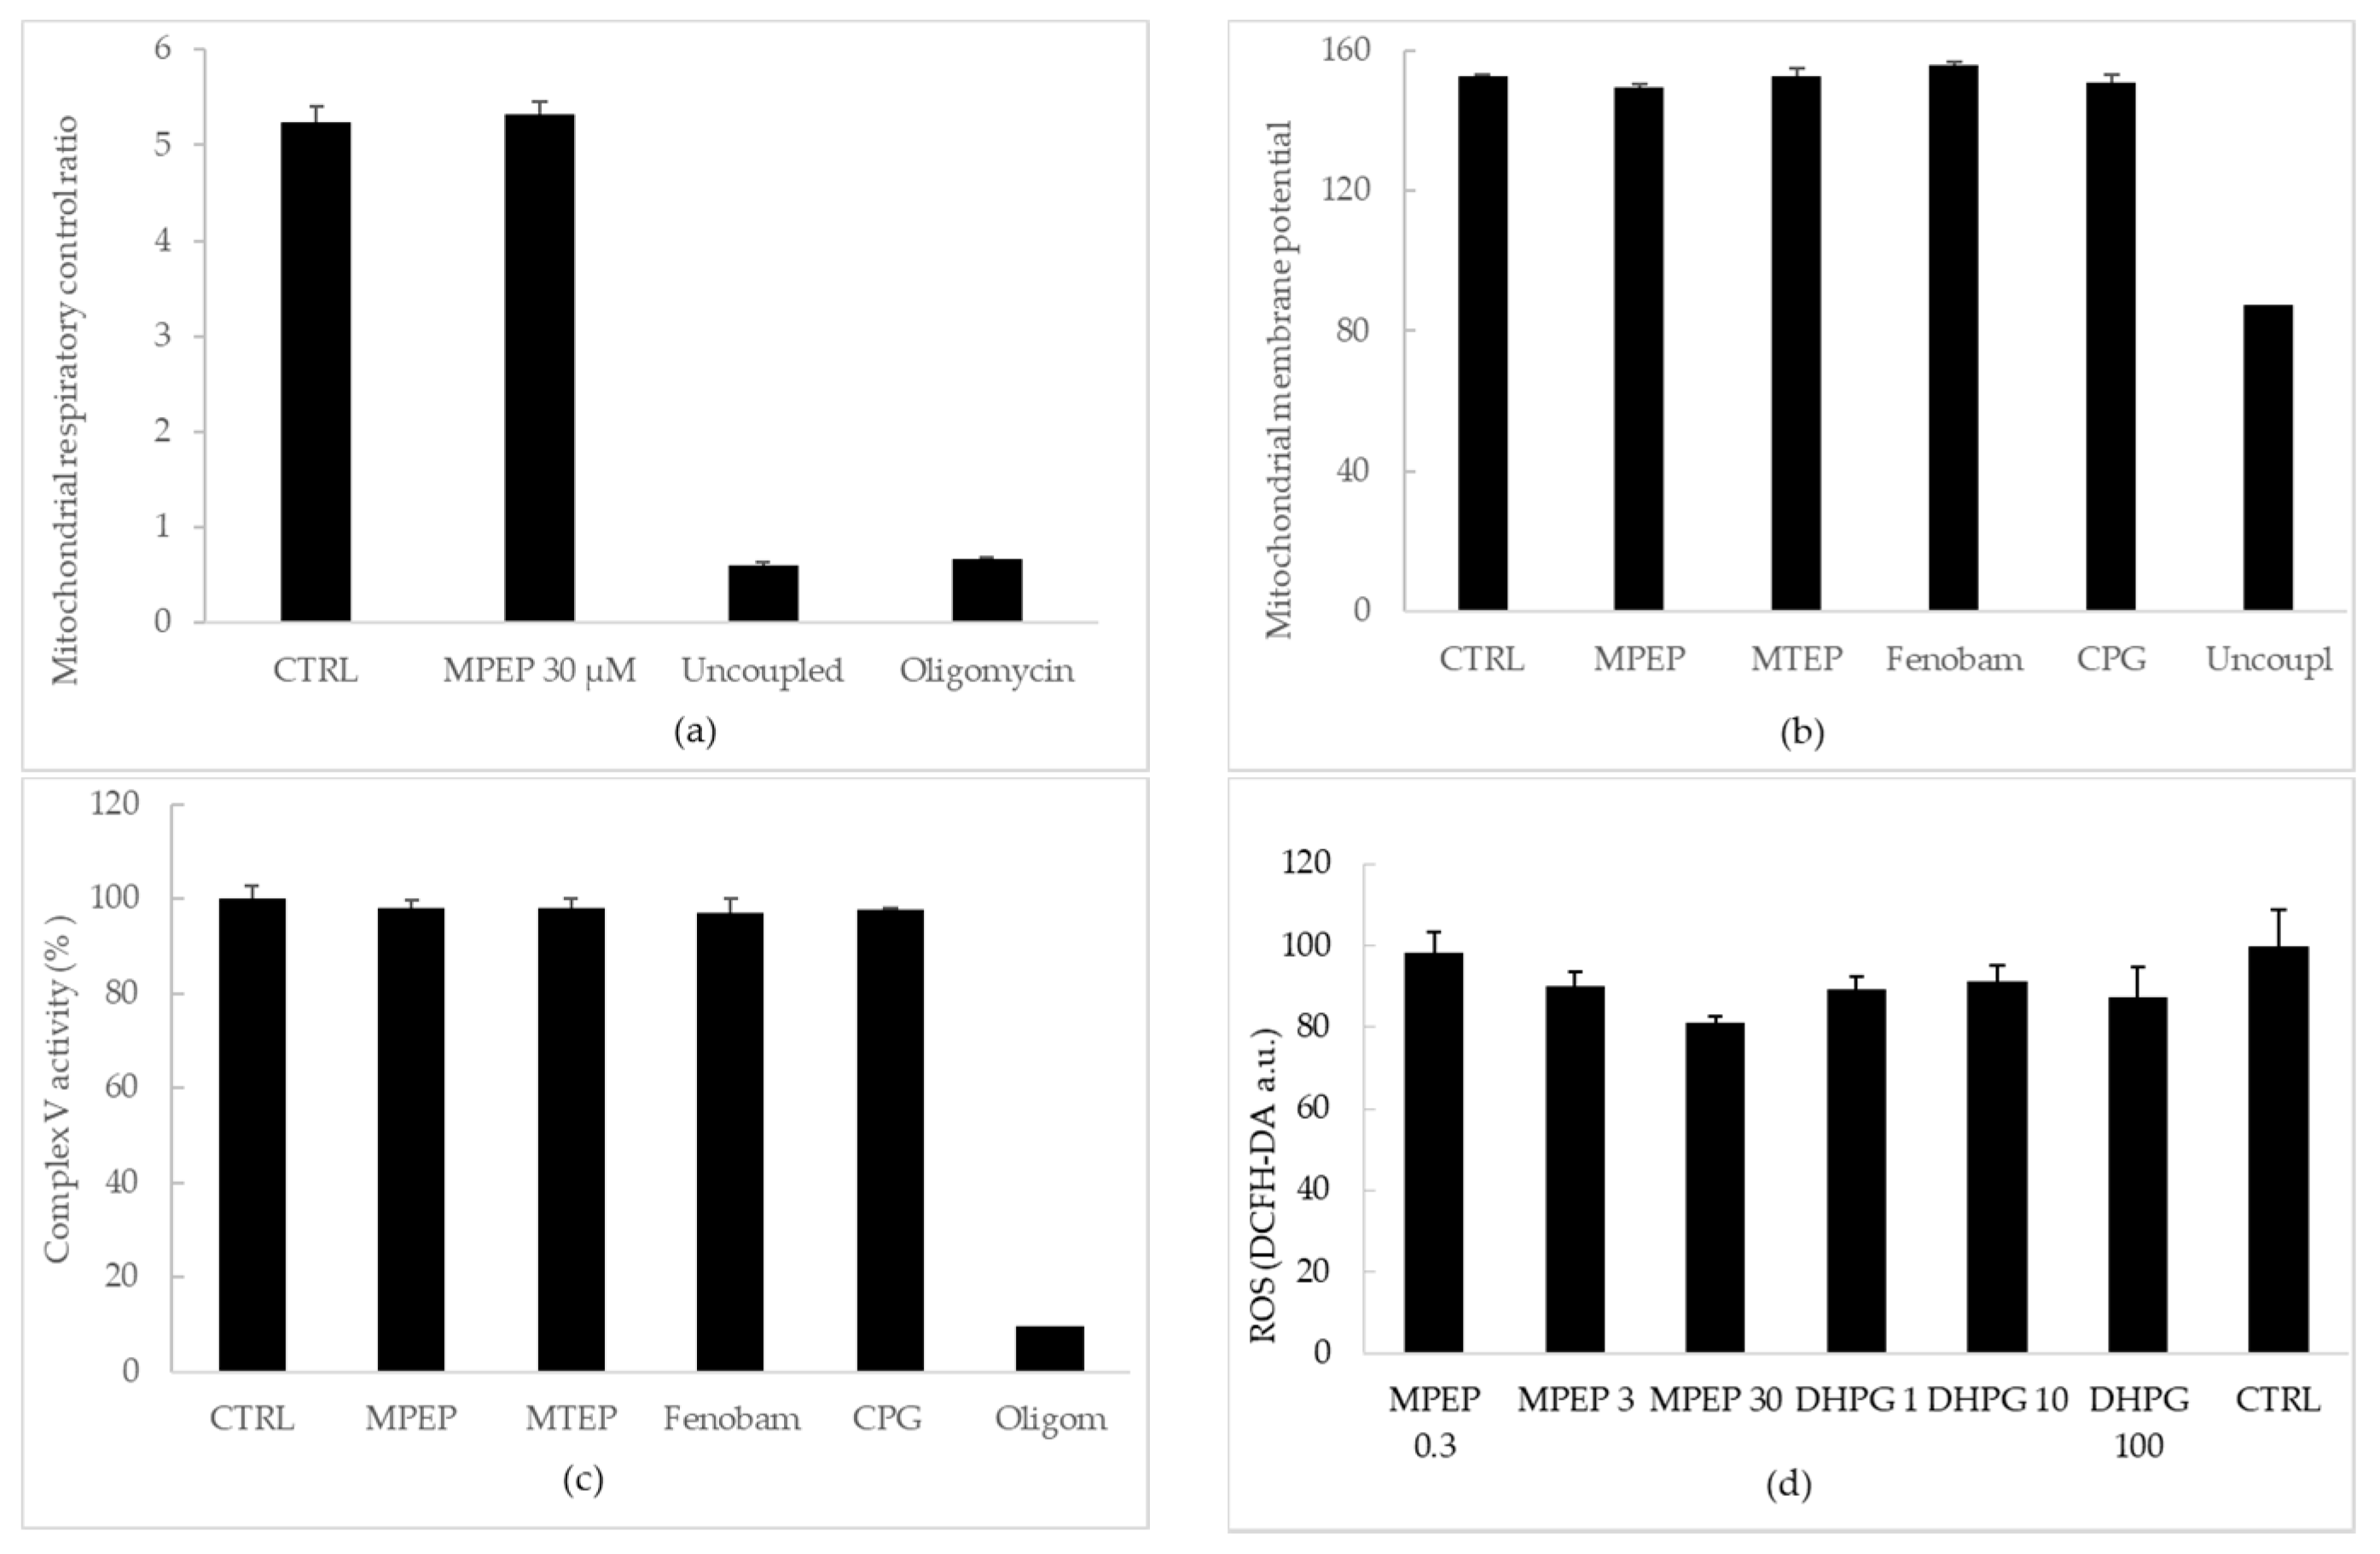
2.1.2. MPEP (30 µM) Does Not Alter Mitochondrial Functionality
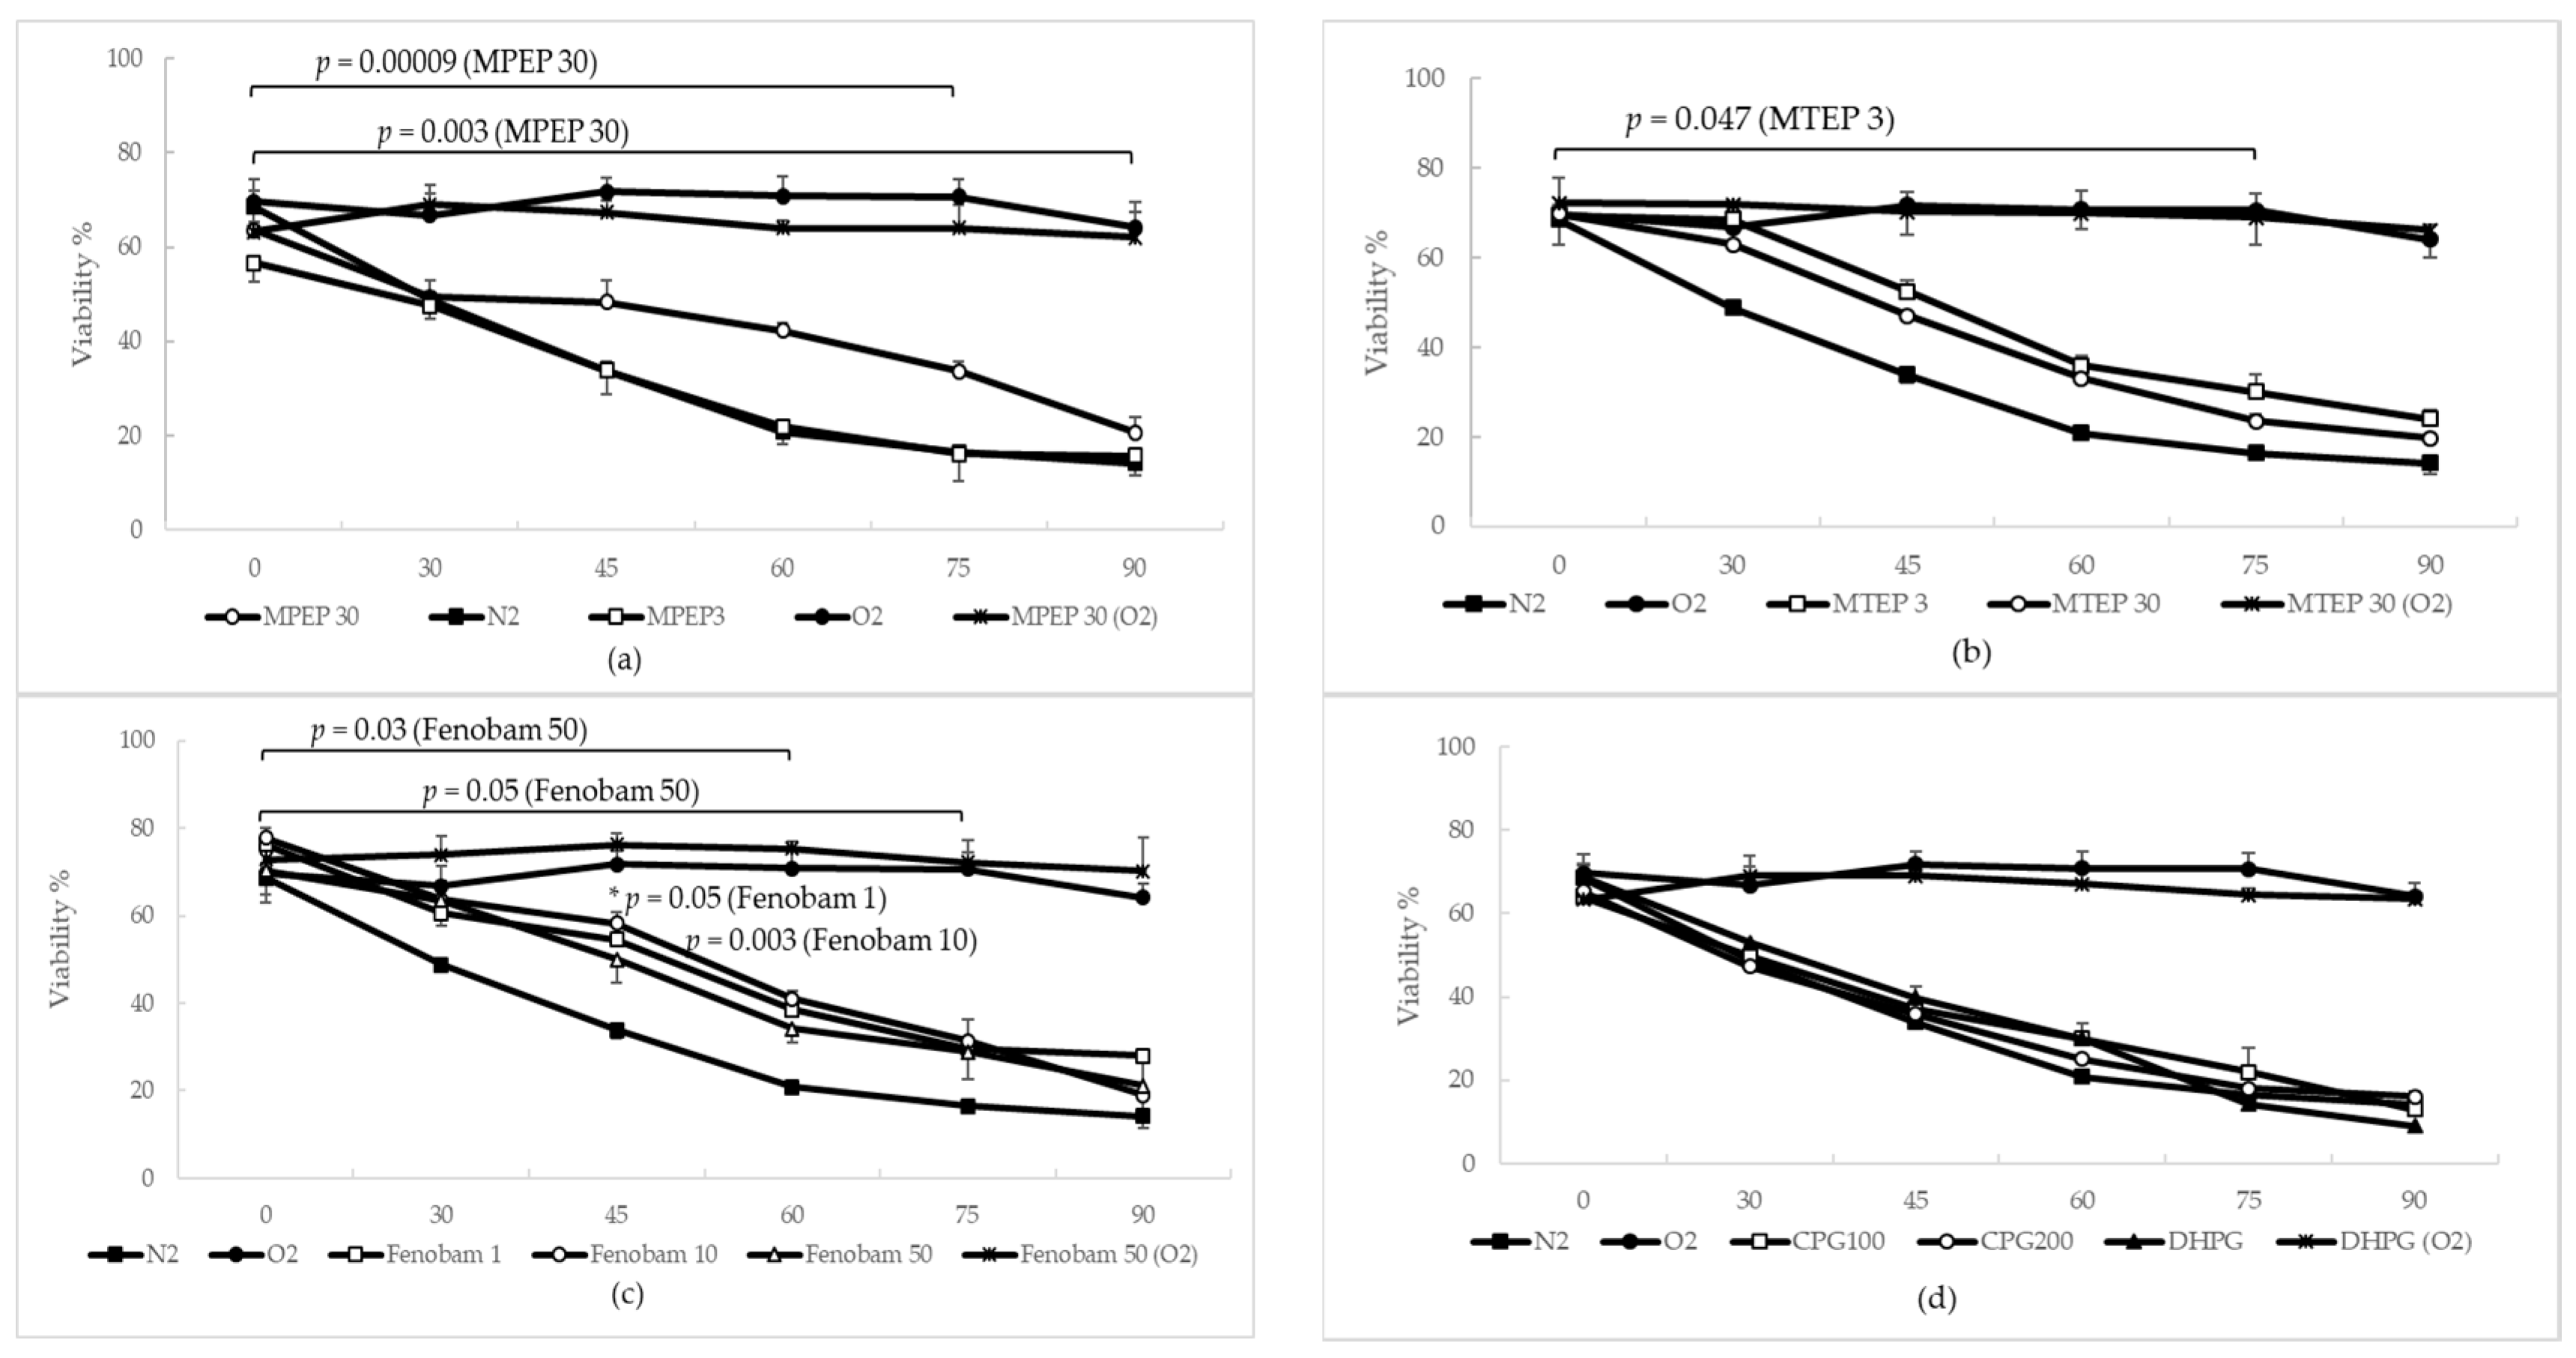
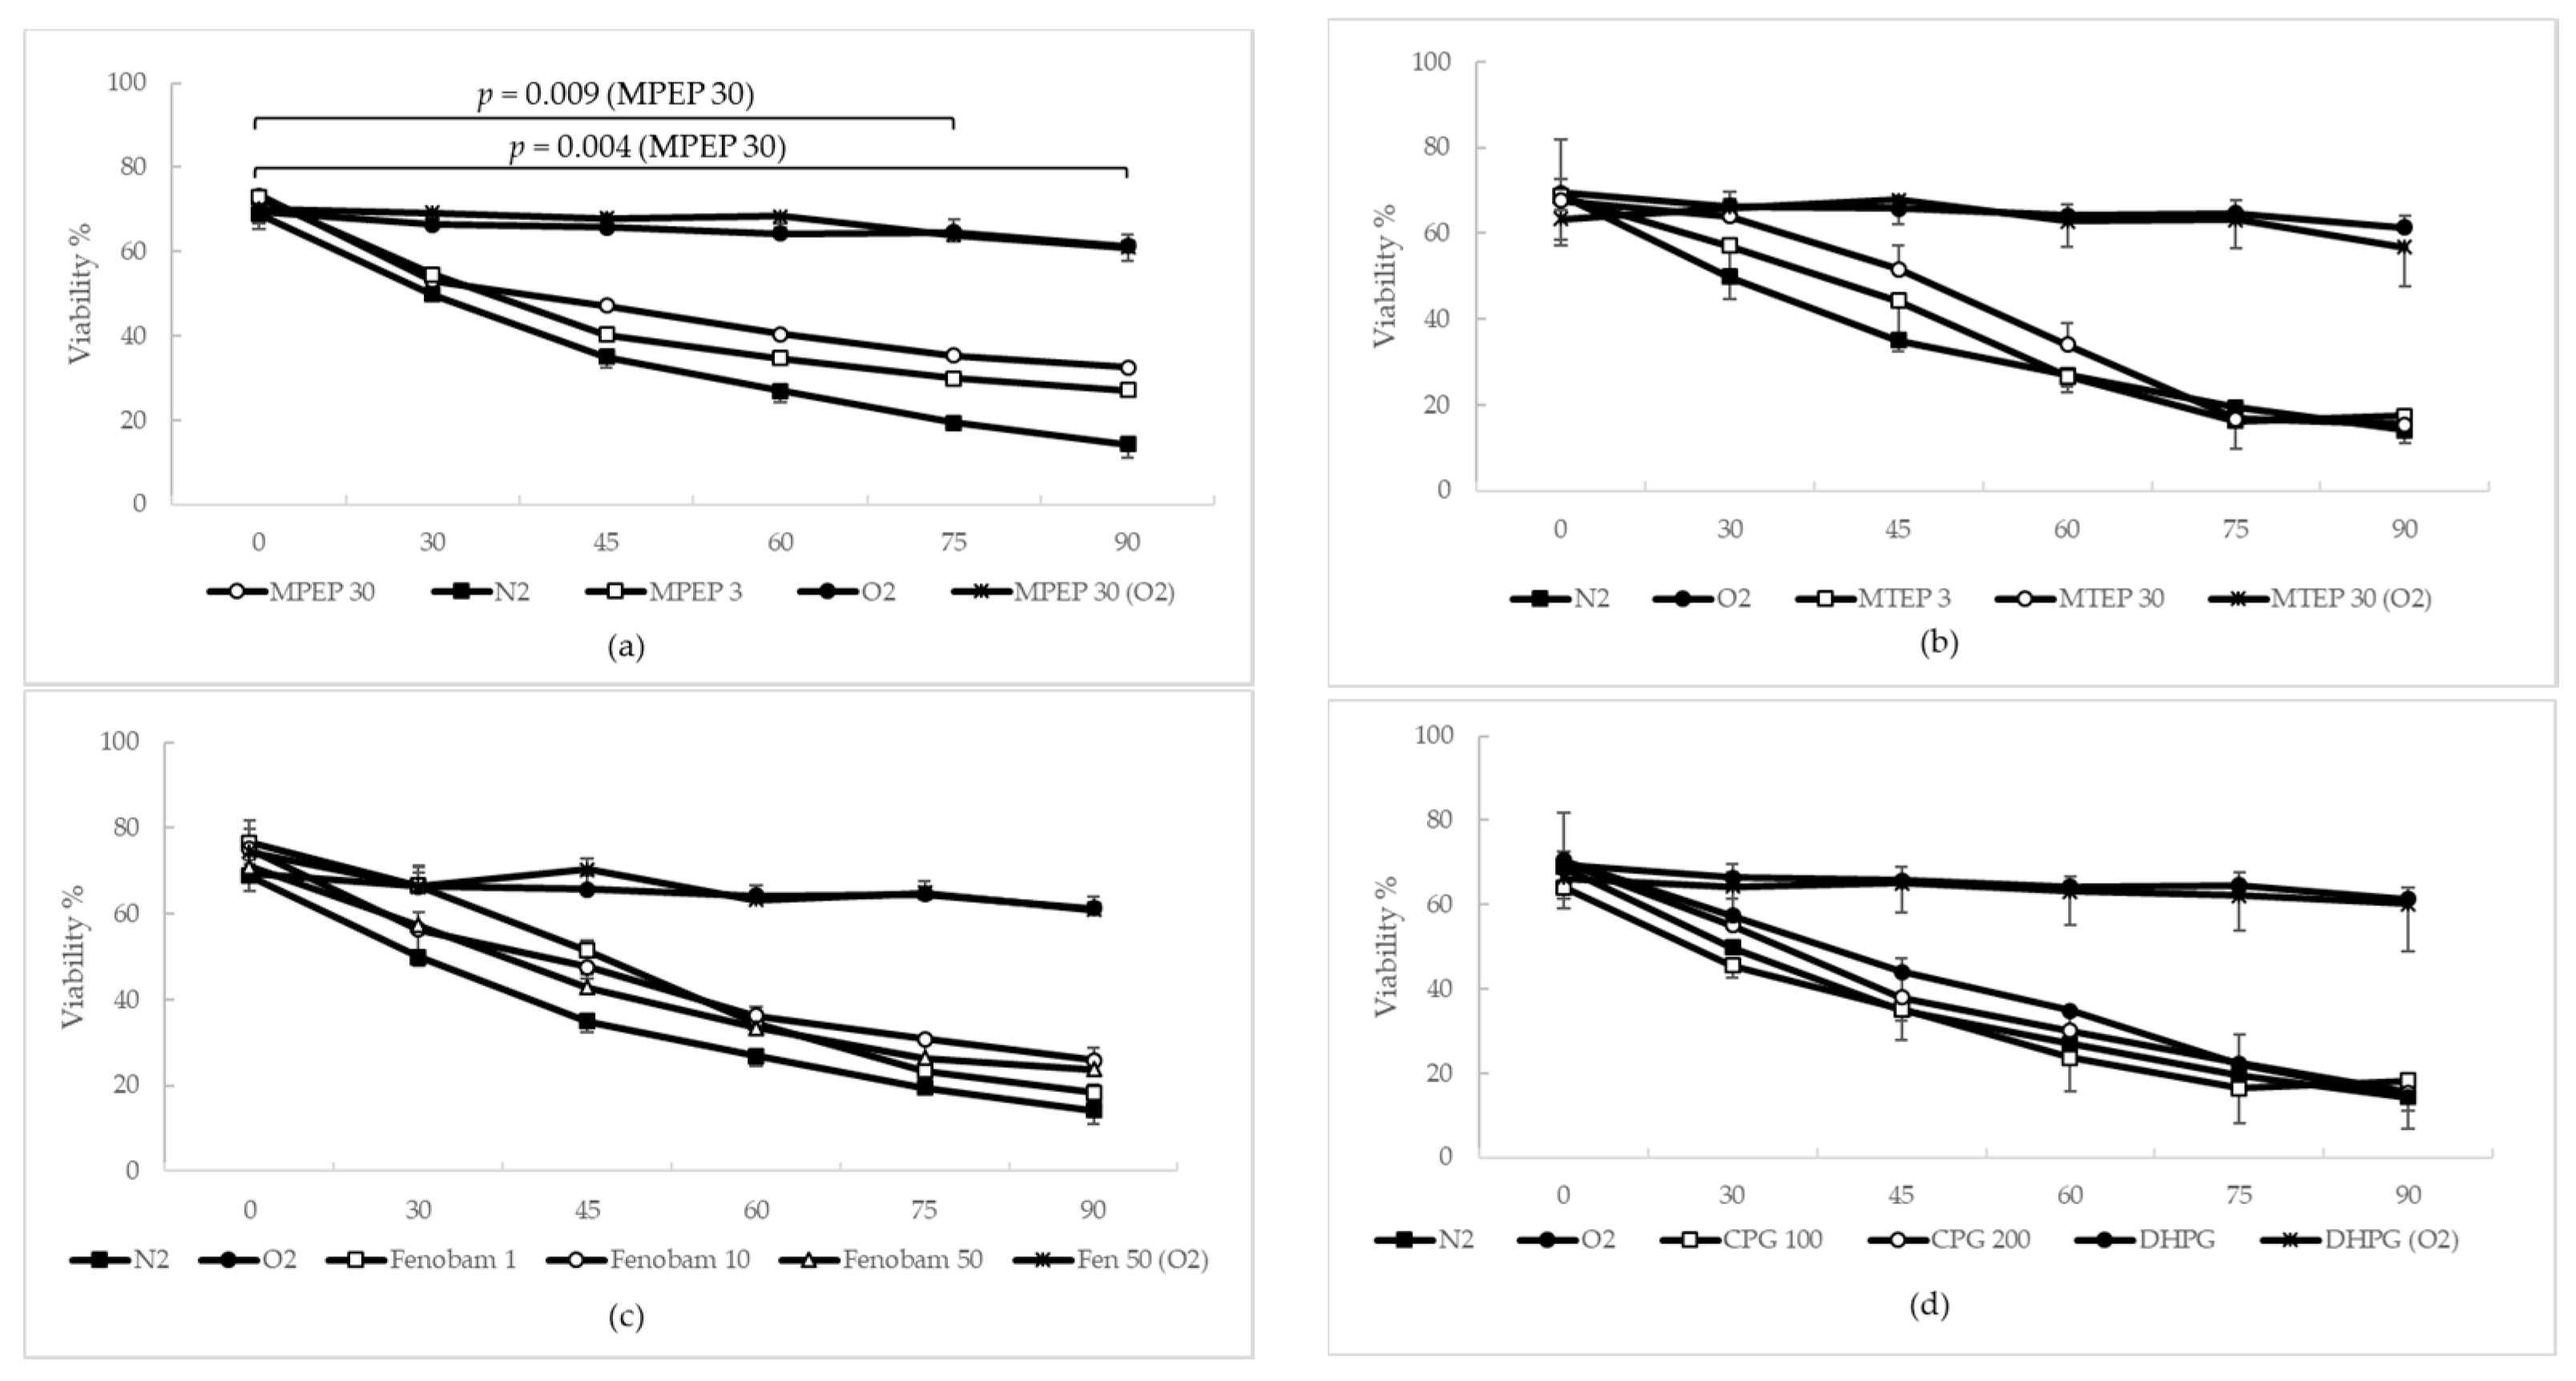
2.1.3. MPEP, MTEP and Fenobam Protect Rat Hepatocytes from Warm Ischemic Injury
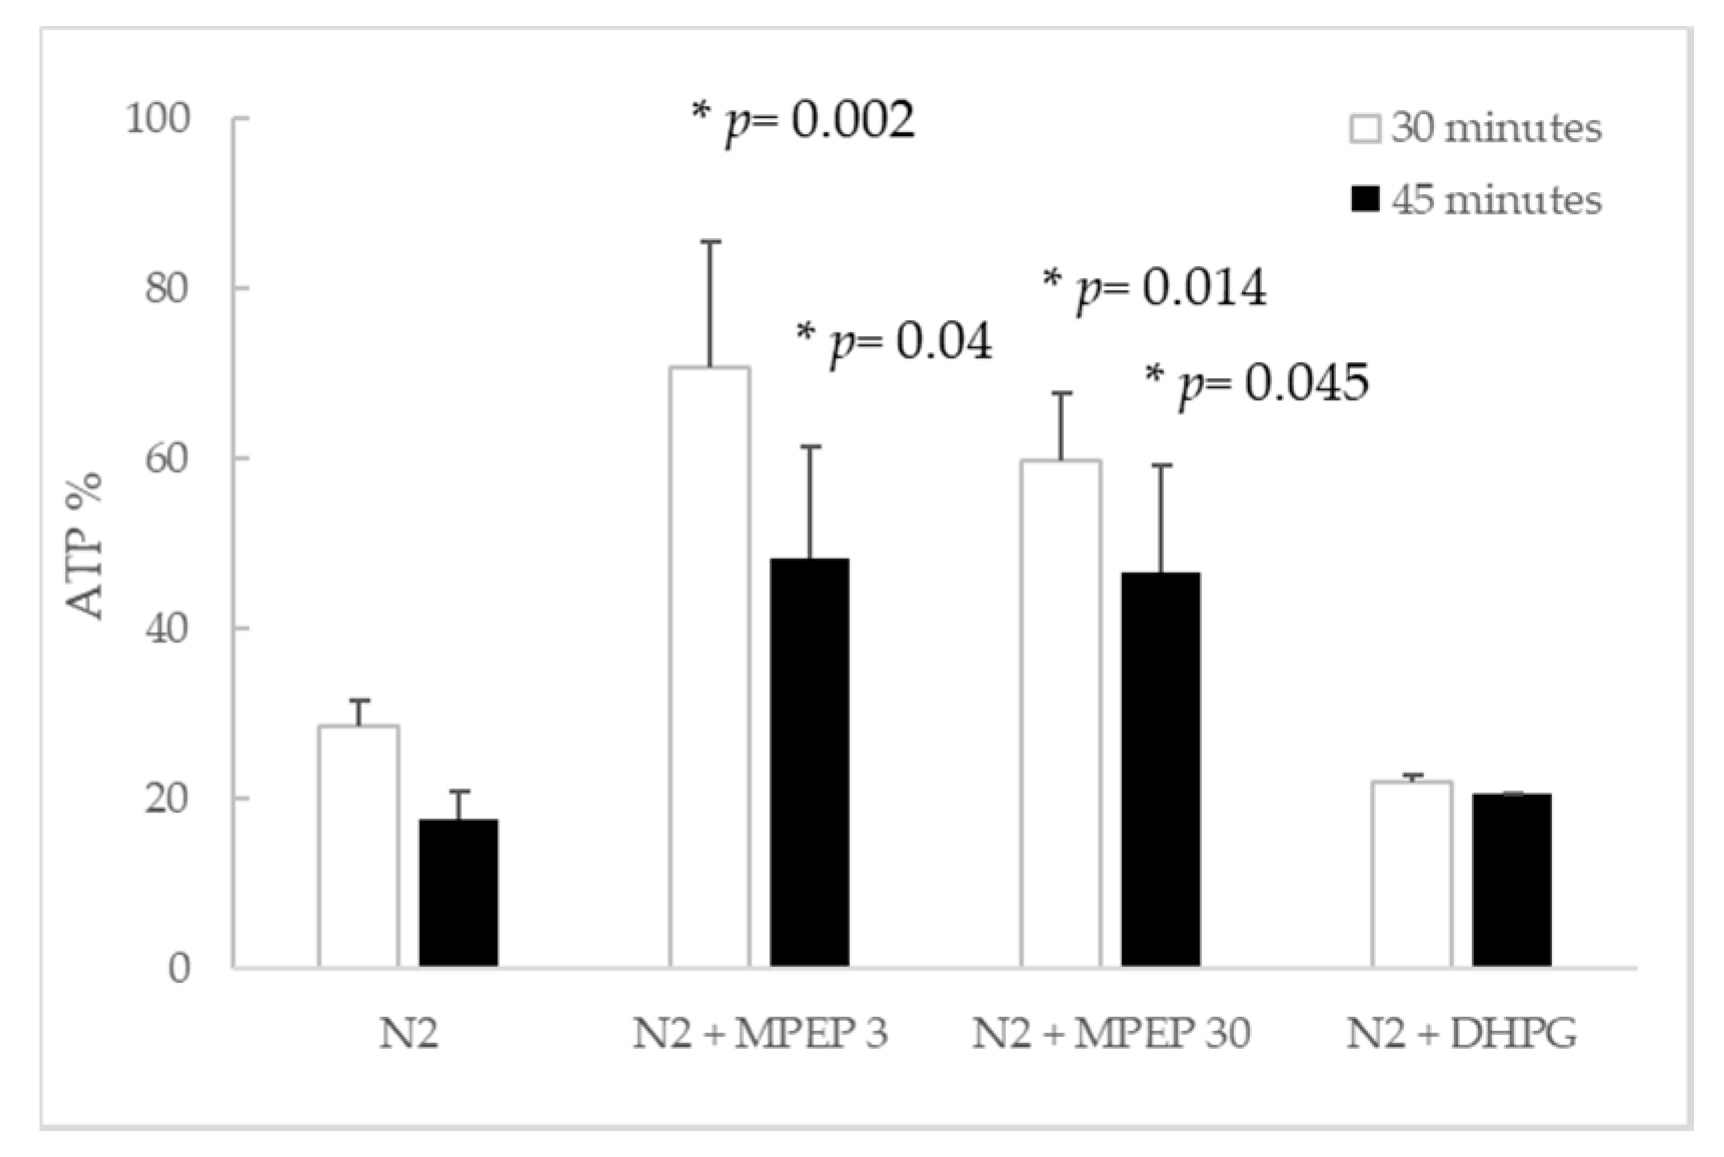
2.1.4. MPEP Prevents ATP Depletion in Hypoxic Hepatocytes
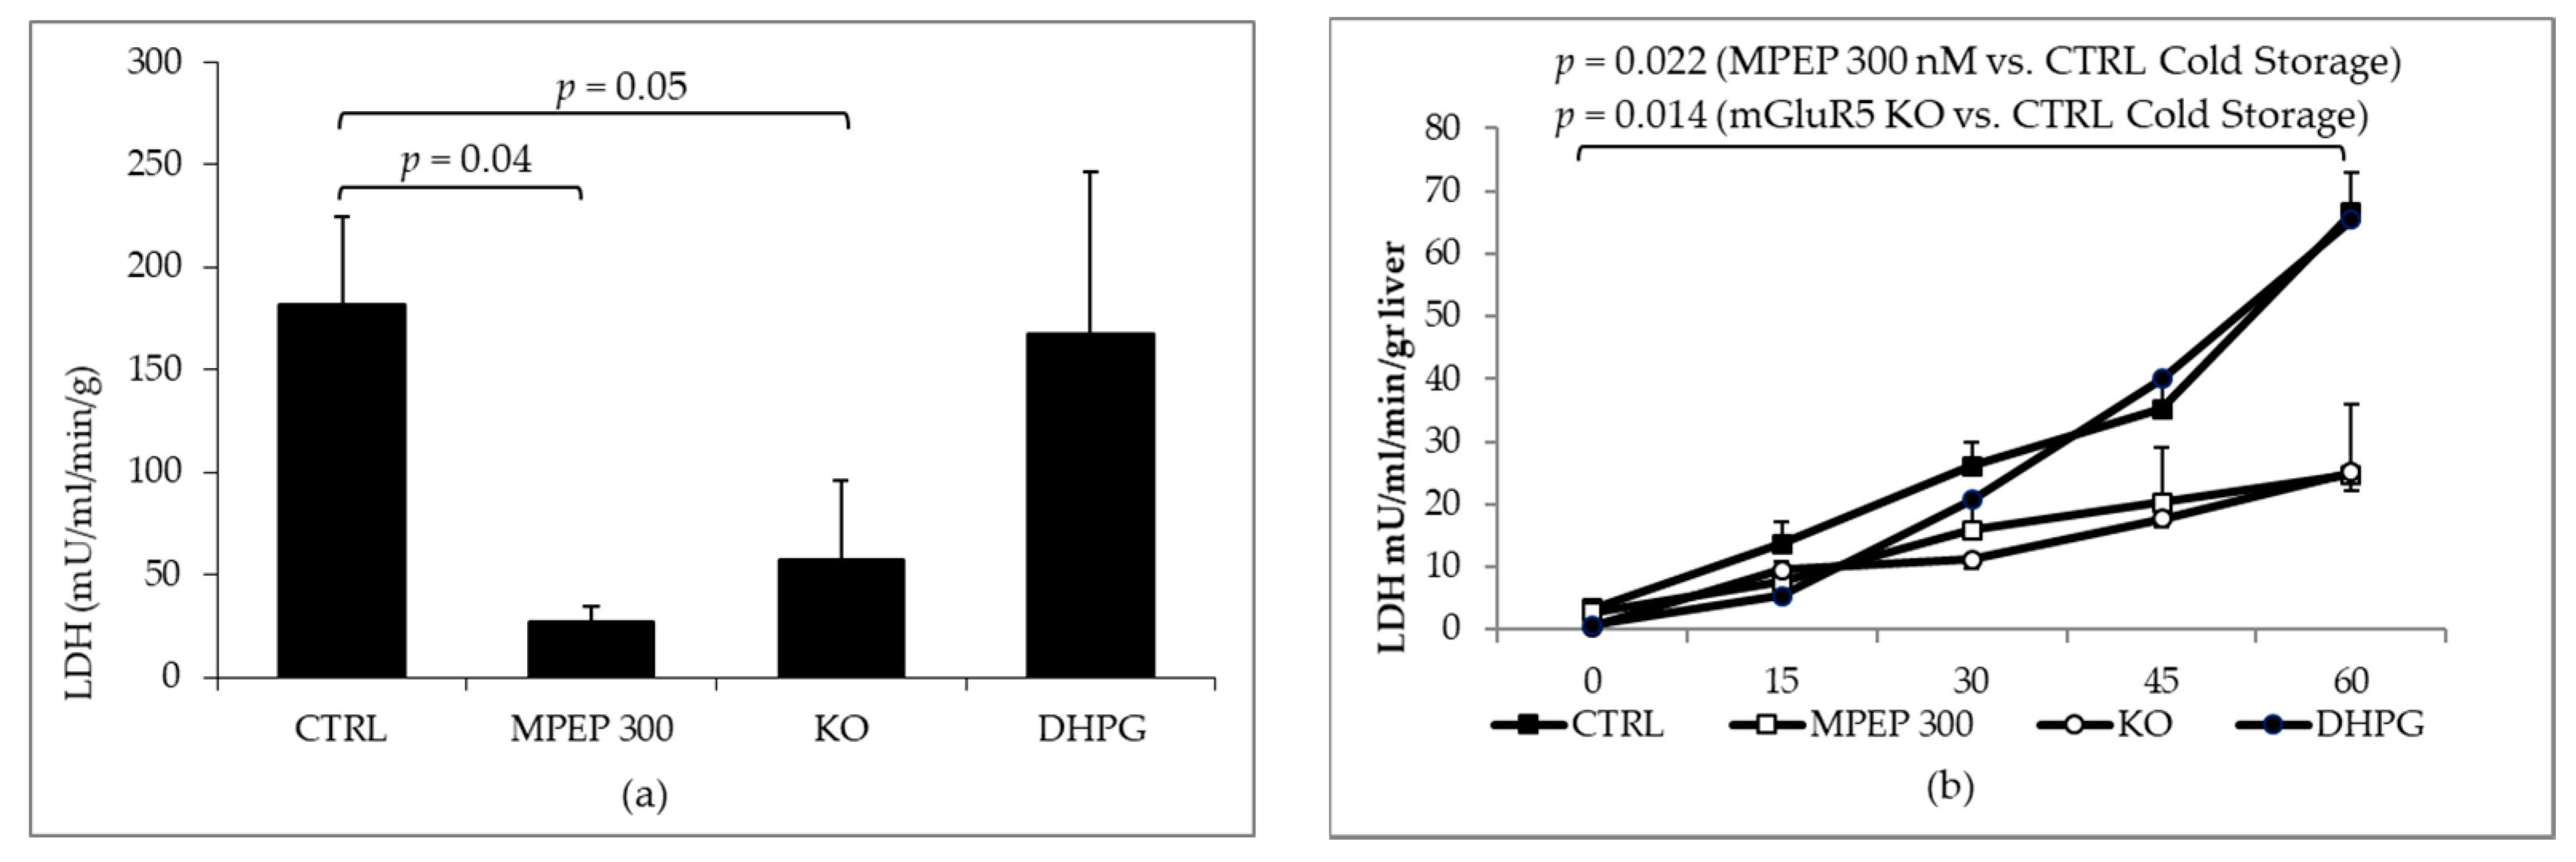
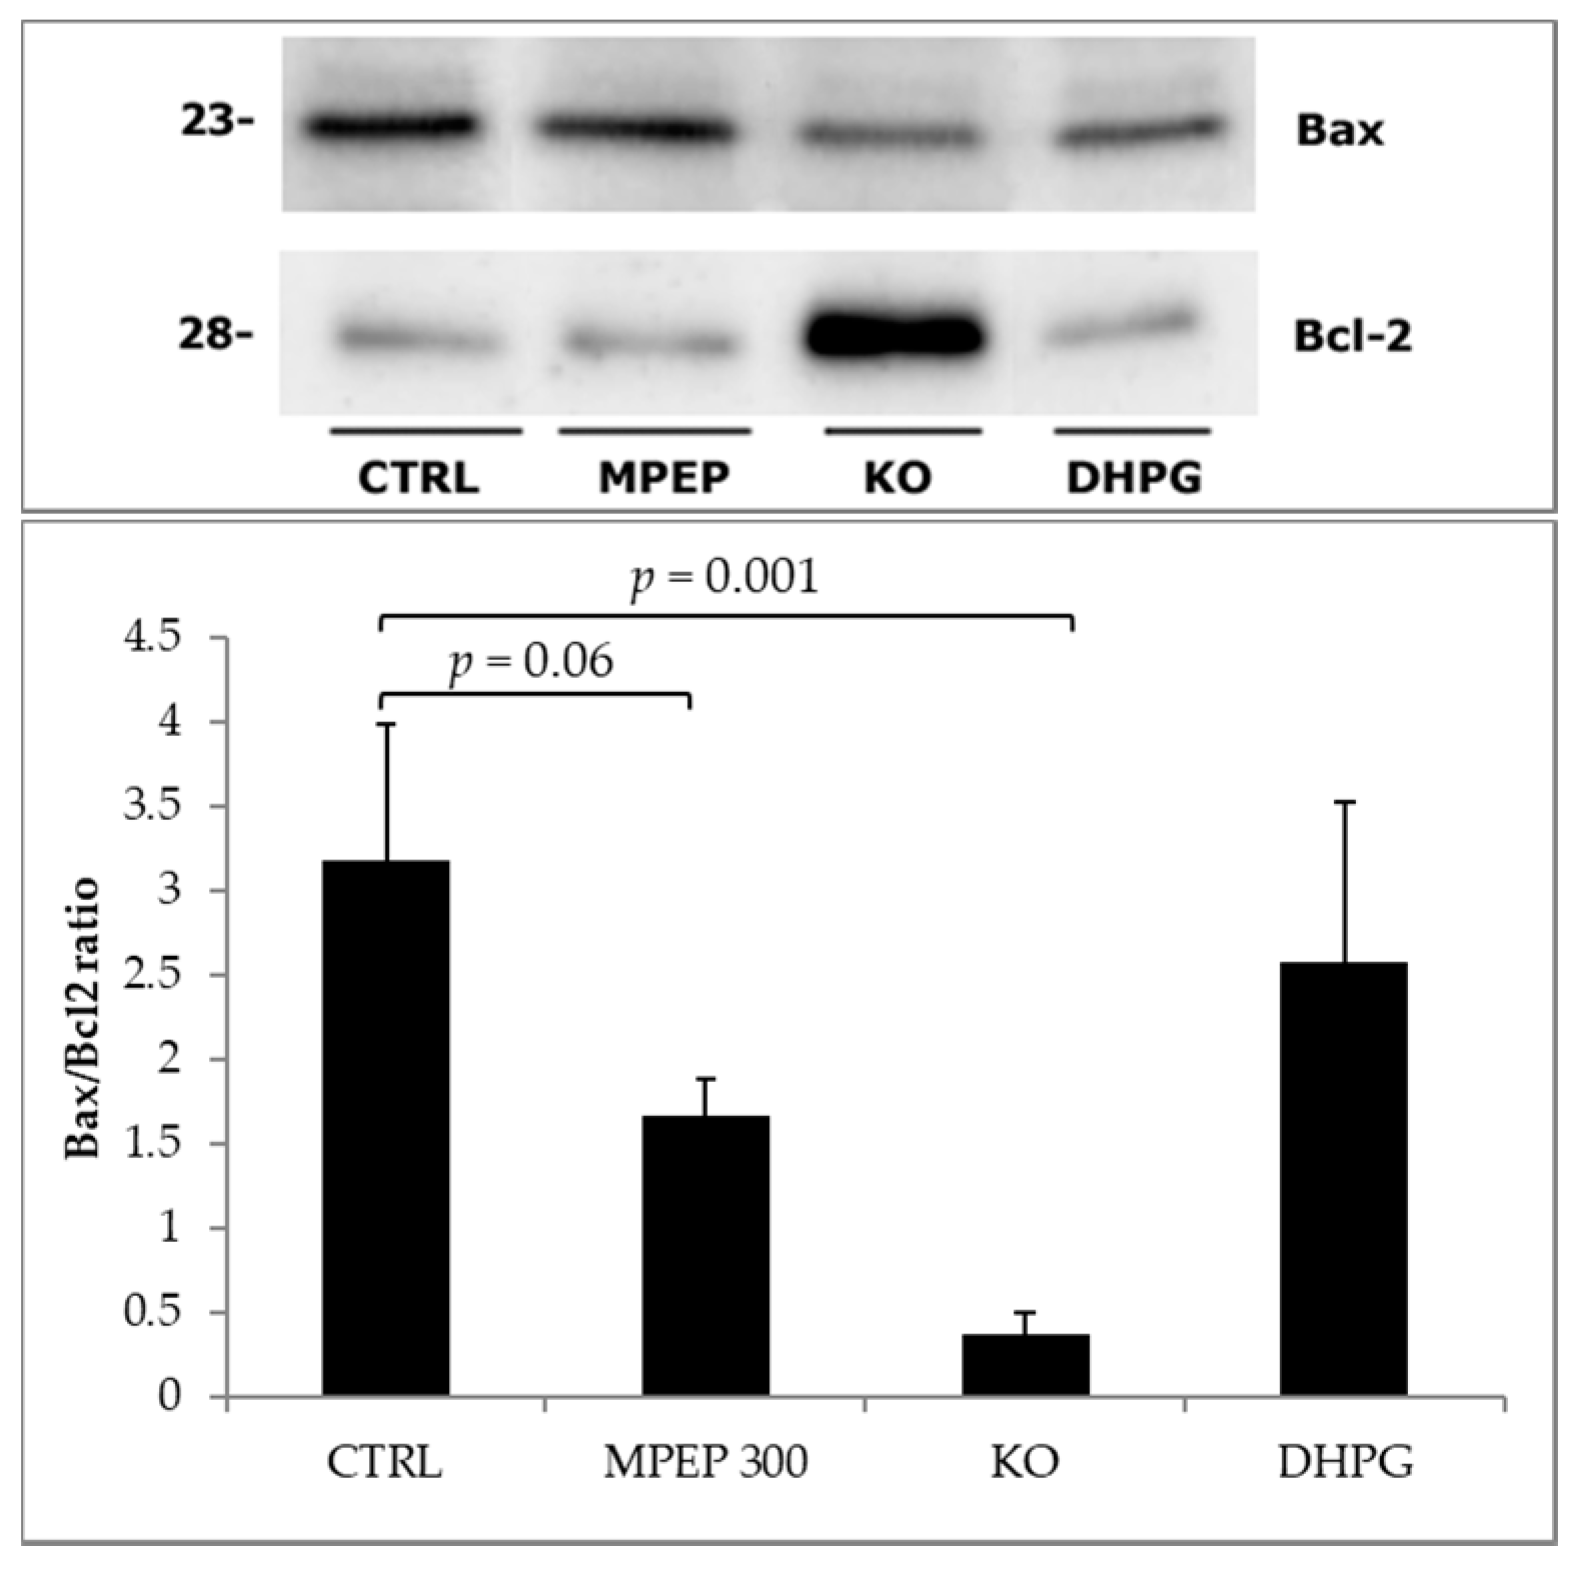
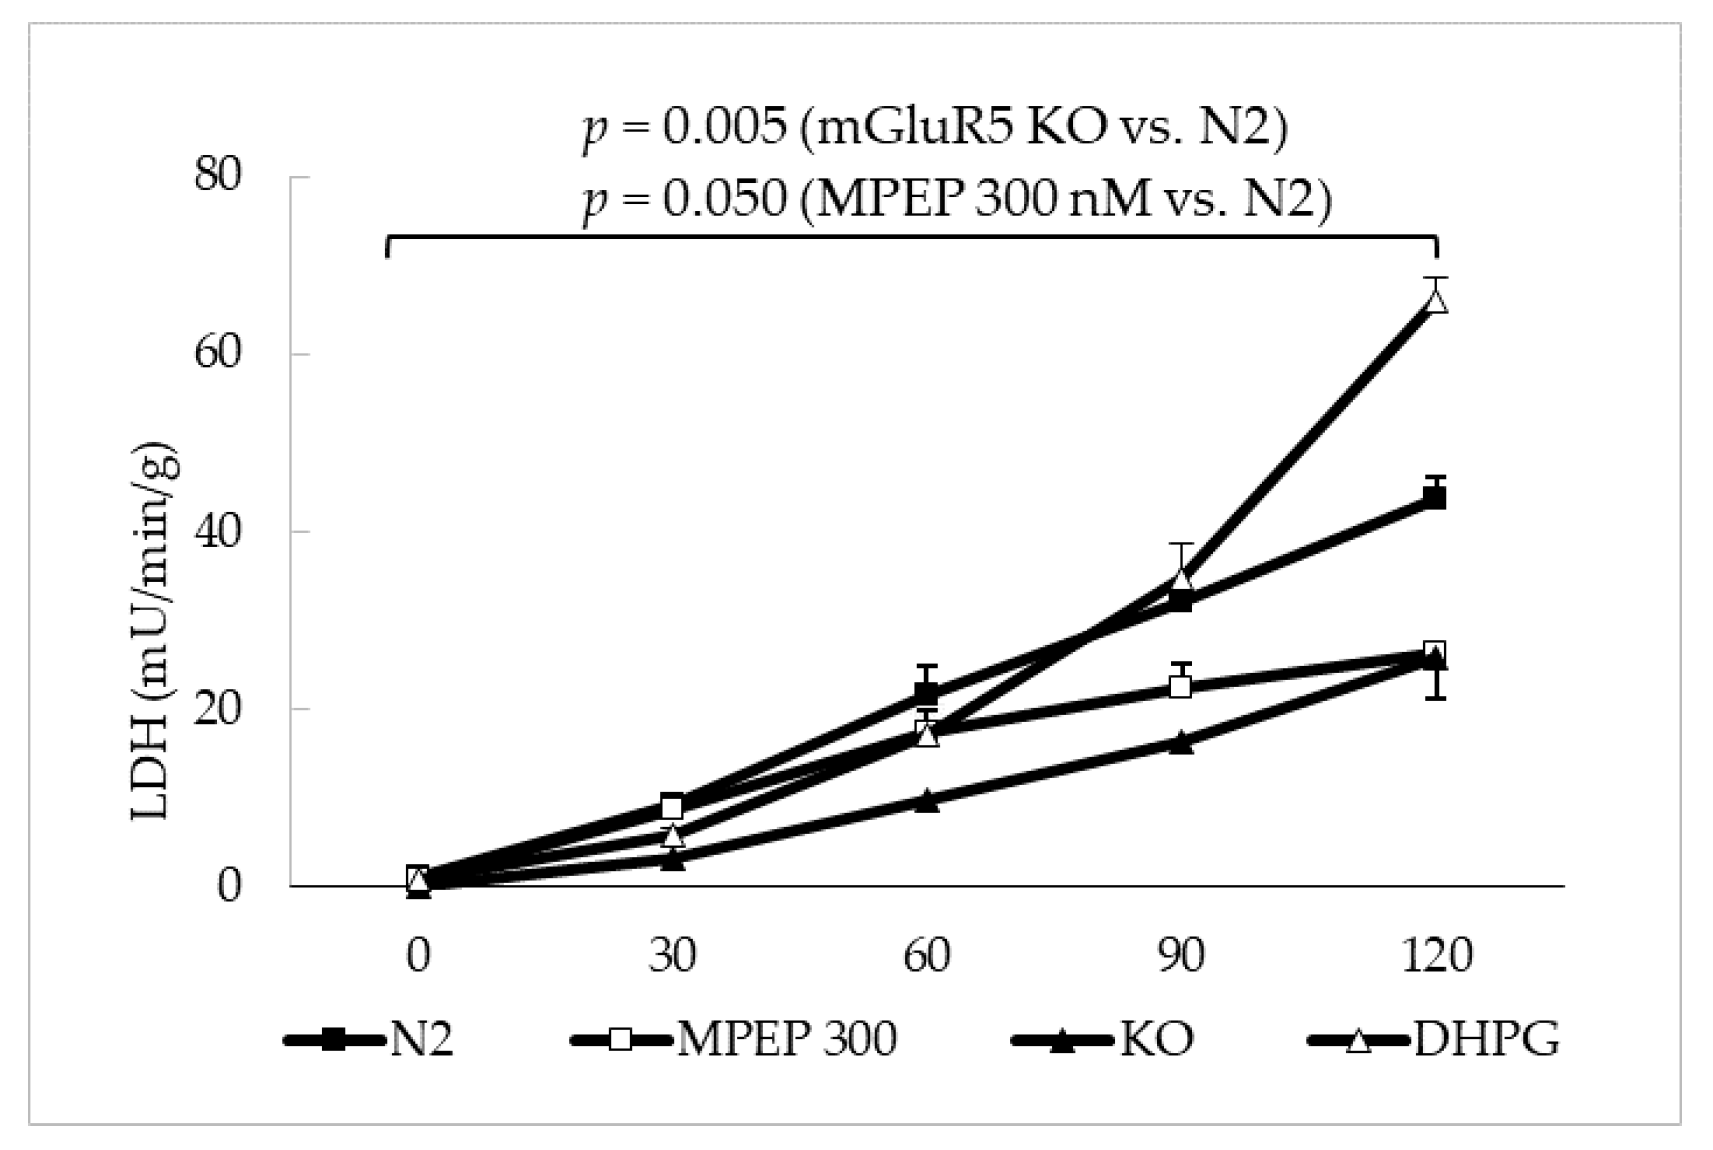
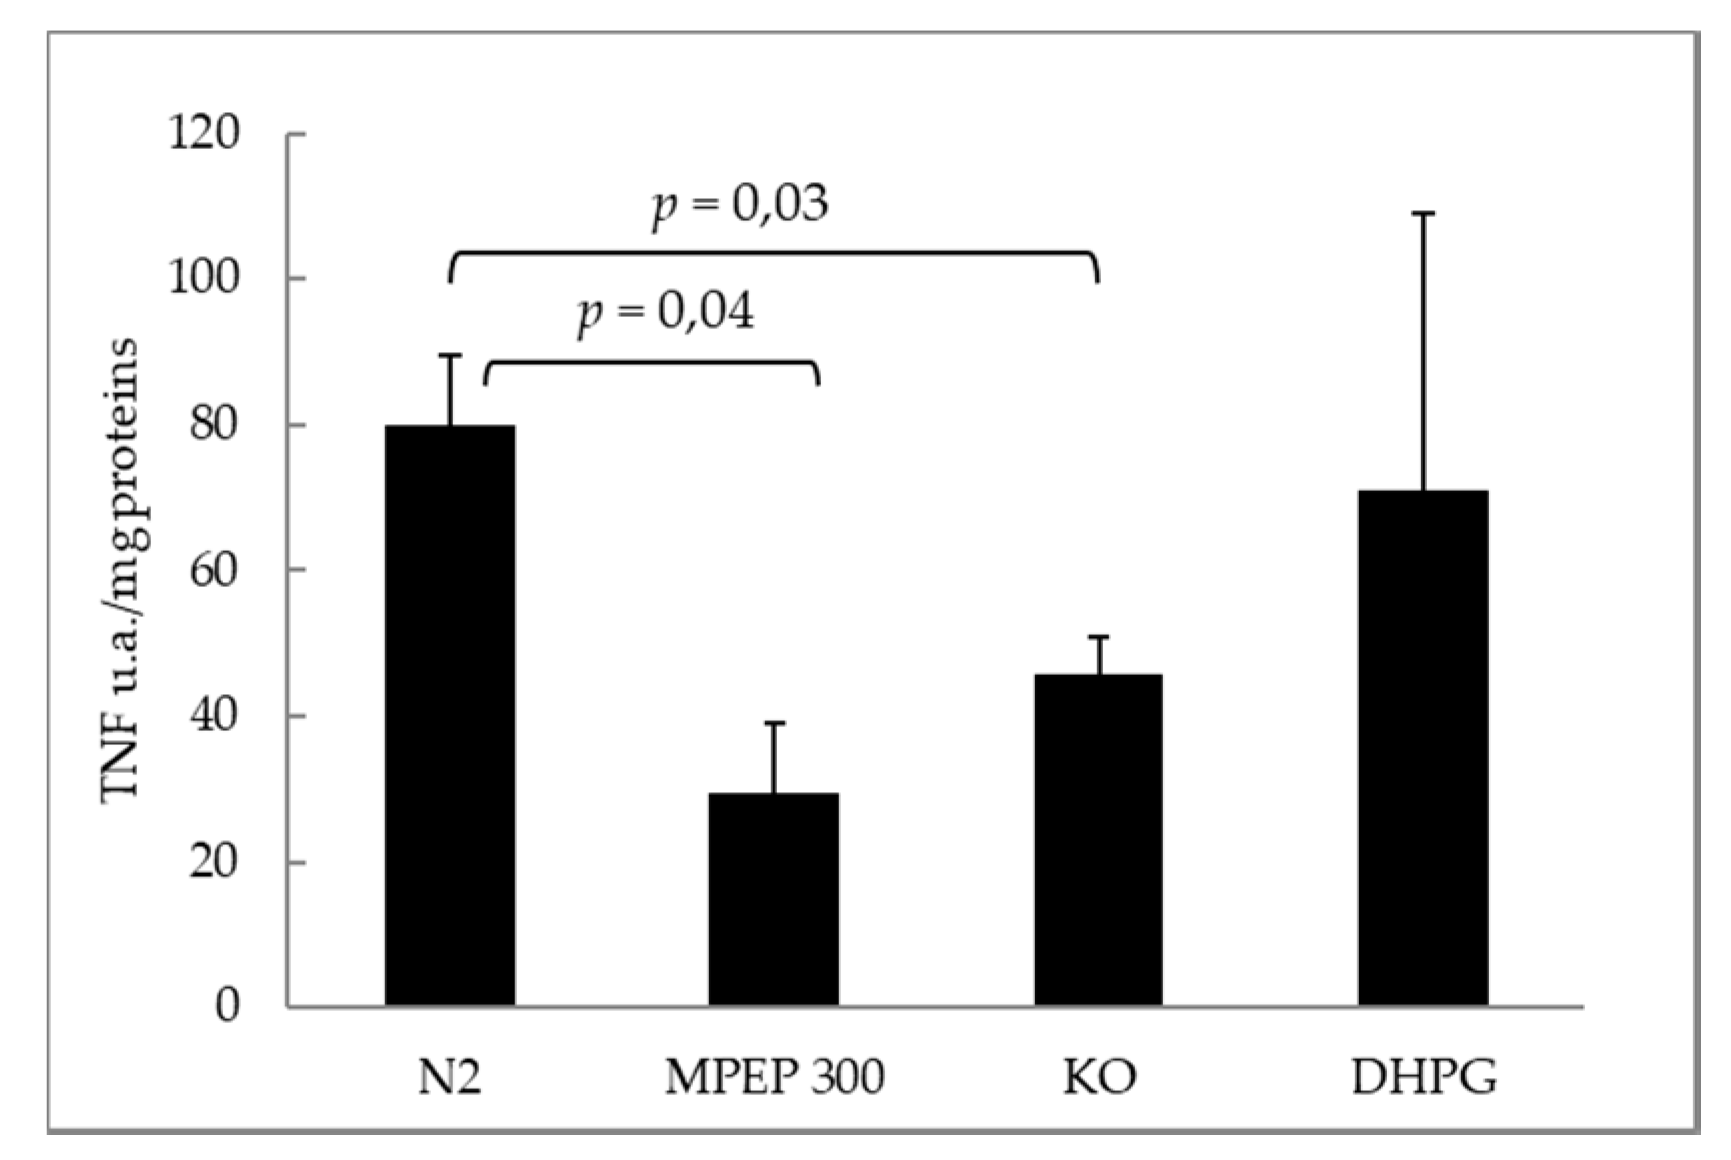
2.2. MPEP Protects Mouse Livers in an Ex Vivo Model of Cold Storage/Reperfusion Injury
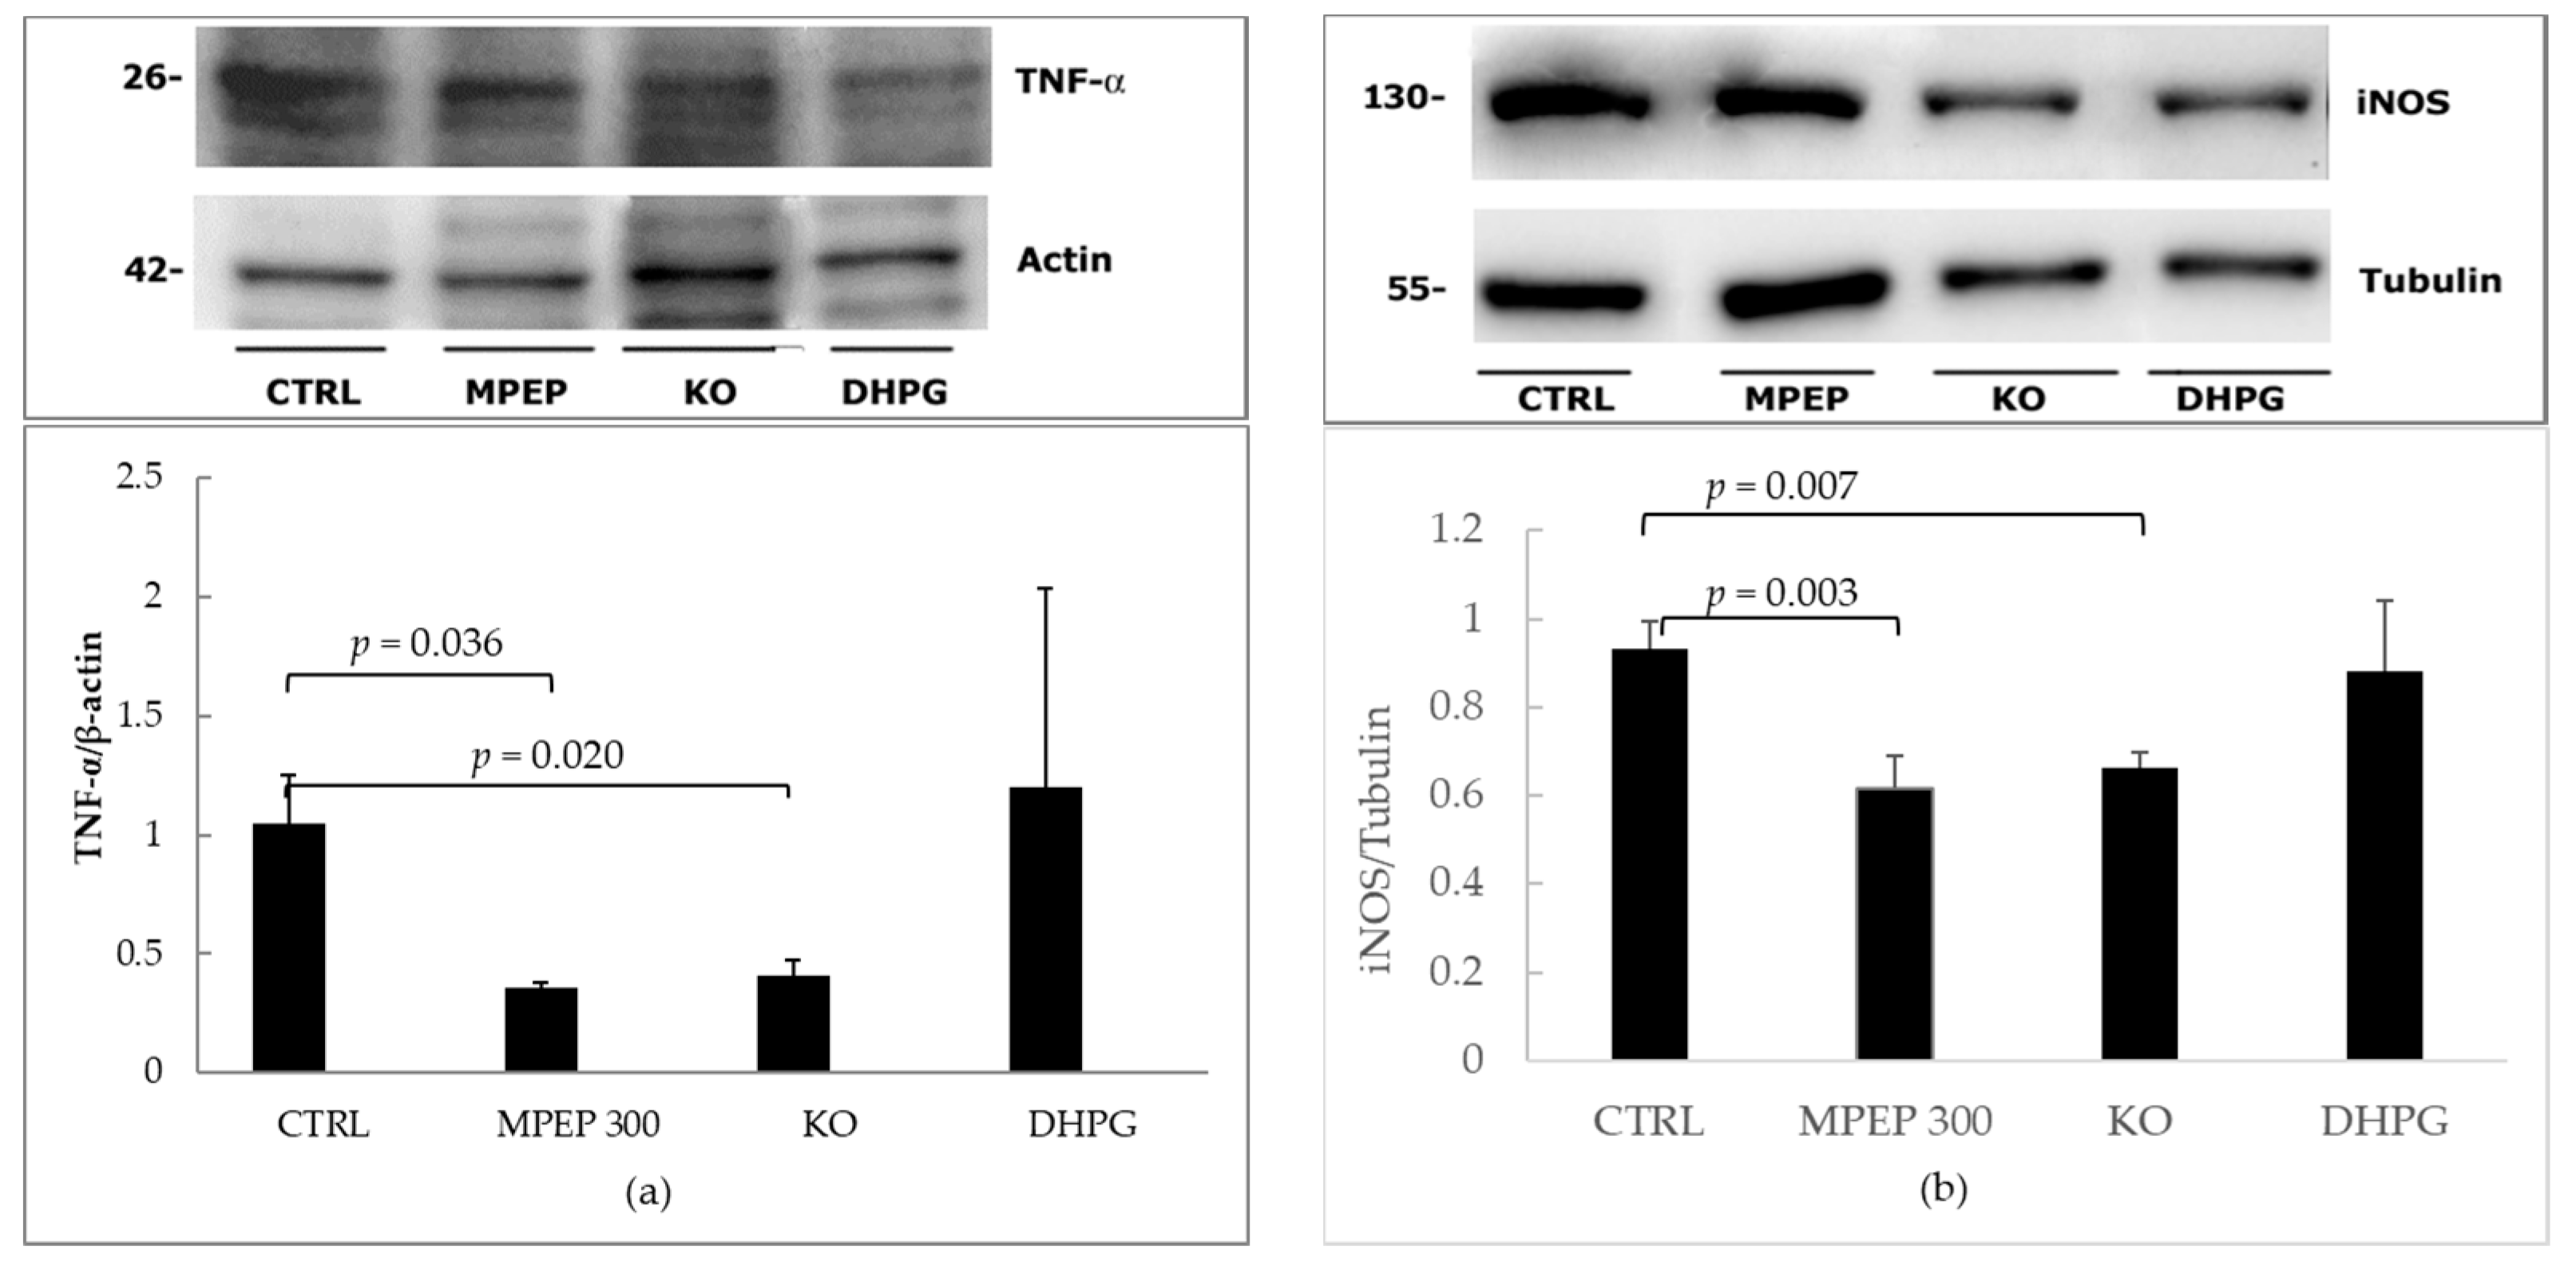
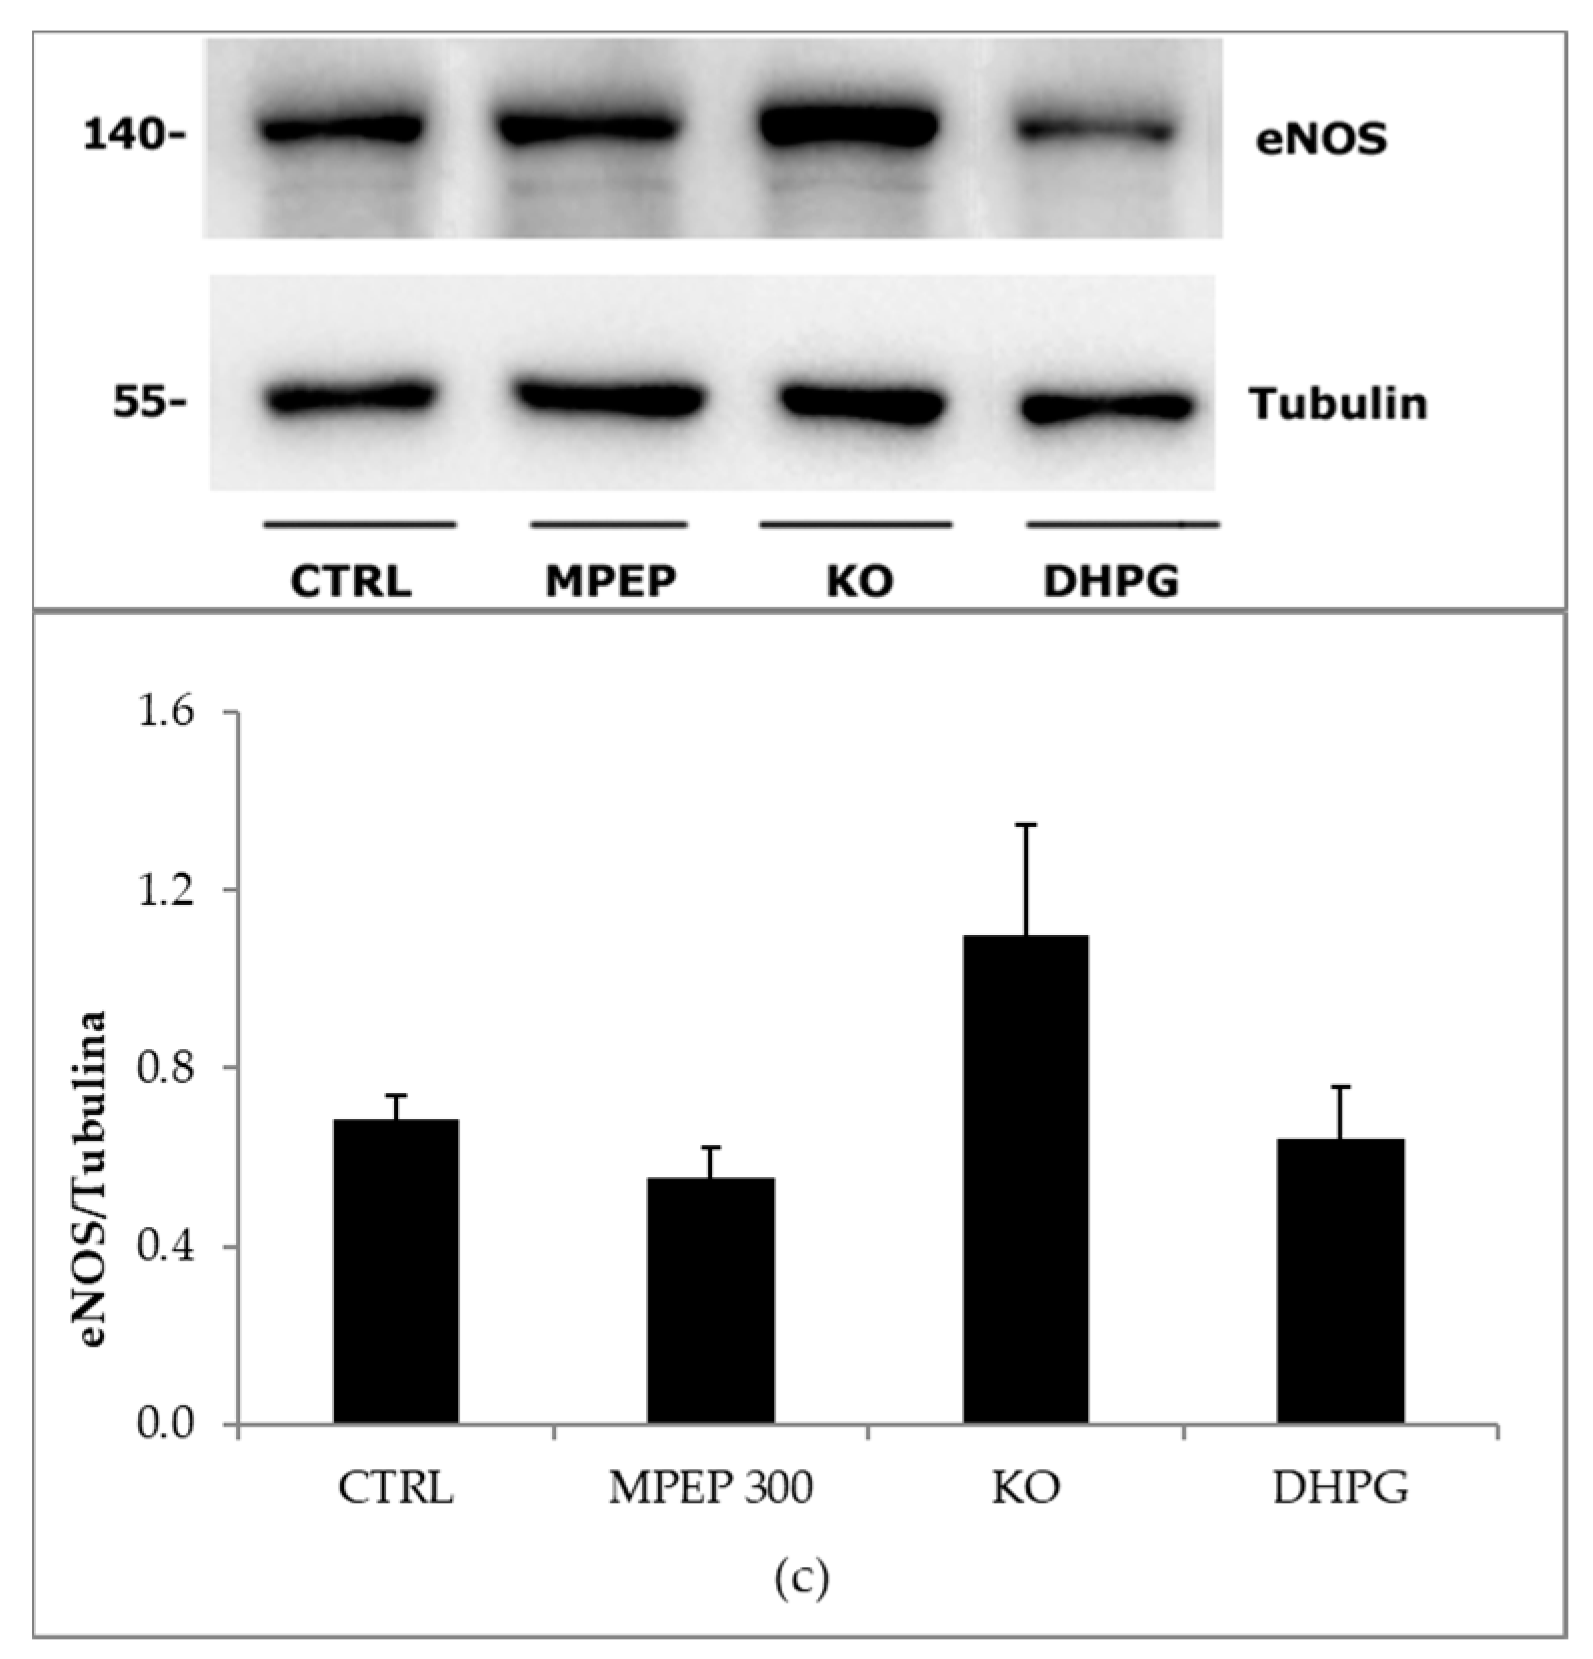
2.3. MPEP Protects Mouse Livers in an Ex Vivo Model of Warm Ischemia Reperfusion Injury
3. Discussion
3.1. MPEP Sequesters ATP from Acellular Solution and Cellular Suspensions
3.2. NAMs Protect Hepatocytes from Ischemic Injury, Regardless of Their Ability to Induce ATP Depletion
3.3. The Blockade of mGluR5 Protects Mouse Livers from Cold Ischemia and Warm Ischemia Reperfusion Injury
4. Materials and Methods
4.1. In Vitro Studies
4.1.1. Mitochondrial Isolation and Assays
4.1.2. Hepatocyte Isolation
4.1.3. Warm Ischemia Experiments on Rat Hepatocytes
4.1.4. Measurement of Cell Viability
4.1.5. Measurement of ATP
4.2. Ex Vivo Studies
4.2.1. Cold Ischemia Reperfusion Model
4.2.2. Warm Ischemia Model
4.2.3. Perfusate Analysis
4.2.4. Western Blot Analysis
4.2.5. Statistical Analysis
Acknowledgments
Author Contributions
Conflicts of Interest
Abbreviations
| [3H]InsP | [3H]inositolmonophosphate |
| ACPD | (1S,3R)-1-aminocyclopentane-1,3-dicarboxylic acid |
| ADP | adenosine diphosphate |
| DCFH-DA | dichlorodilhydrofluorescein diacetate |
| DFB | 3,3′-difluorobenzaldazine |
| DMSO | dimethyl sulfoxide |
| DTT | 1,4-dithiothreitol |
| eNOS | endothelial nitric oxide synthase |
| ER | endoplasmic reticulum |
| Gluk2 | glutamate receptor, ionotropic kainate 2 |
| iNOS | inducible nitric oxide synthase |
| KO | knock-out |
| PCR | polymerase chain reaction |
| PVDF | polyvinylidene difluoride |
| SDS | sodium dodecyl sulfate |
| TBS | tris-buffered saline |
| TNF-α | tumor necrosis factor-α |
References
- Cleva, R.M.; Olive, M.F. Positive allosteric modulators of type 5 metabotropic glutamate receptors (mGluR5) and their therapeutic potential for the treatment of CNS disorders. Molecules 2011, 16, 2097–2106. [Google Scholar] [CrossRef] [PubMed]
- Nicoletti, F.; Bockaert, J.; Collingridge, G.L.; Conn, P.J.; Ferraguti, F.; Schoepp, D.D.; Wroblewski, J.T.; Pin, J.P. Metabotropic glutamate receptors: From the workbench to the bedside. Neuropharmacology 2011, 60, 1017–1041. [Google Scholar] [CrossRef] [PubMed]
- Durand, D.; Carniglia, L.; Caruso, C.; Lasag, M. Metabotropic Glutamate Receptors in Peripheral Tissues: Implications for Toxicology. In Anxiety Disorders; InTech: Rijeka, Croatia, 2011. [Google Scholar]
- Storto, M.; Capobianco, L.; Battaglia, G.; Molinaro, G.; Gradini, R.; Riozzi, B.; di Mambro, A.; Mitchell, K.J.; Bruno, V.; Vairetti, M.P.; et al. Insulin secretion is controlled by mGlu5 metabotropic glutamate receptors. Mol. Pharmacol. 2006, 69, 1234–1241. [Google Scholar] [CrossRef] [PubMed]
- Storto, M.; de Grazia, U.; Knöpfel, T.; Canonico, P.L.; Copani, A.; Richelmi, P.; Nicoletti, F.; Vairetti, M. Selective blockade of mGlu5 metabotropic glutamate receptors protects rat hepatocytes against hypoxic damage. Hepatology 2000, 31, 649–655. [Google Scholar] [CrossRef] [PubMed]
- Nakamura, E.; Hasumura, M.; San Gabriel, A.; Uneyama, H.; Torii, K. New frontiers in gut nutrient sensor research: luminal glutamate-sensing cells in rat gastric mucosa. J. Pharmacol. Sci. 2010, 112, 13–18. [Google Scholar] [CrossRef] [PubMed]
- Storto, M.; Sallese, M.; Salvatore, L.; Poulet, R.; Condorelli, D.F.; Dell’Albani, P.; Marcello, M.F.; Romeo, R.; Piomboni, P.; Barone, N.; et al. Expression of metabotropic glutamate receptors in the rat and human testis. J. Endocrinol. 2001, 170, 71–78. [Google Scholar] [CrossRef] [PubMed]
- Gill, S.; Barker, M.; Pulido, O. Neuroexcitatory targets in the female reproductive system of the nonhuman primate (Macaca fascicularis). Toxicol. Pathol. 2008, 36, 478–484. [Google Scholar] [CrossRef] [PubMed]
- Nicoletti, F.; Battaglia, G.; Storto, M.; Ngomba, R.T.; Iacovelli, L.; Arcella, A.; Gradini, R.; Sale, P.; Rampello, L.; De Vita, T.; et al. Metabotropic glutamate receptors: Beyond the regulation of synaptic transmission. Psychoneuroendocrinology 2007, 32. [Google Scholar] [CrossRef] [PubMed]
- Sureda, F.; Copani, A.; Bruno, V.; Knöpfel, T.; Meltzger, G.; Nicoletti, F. Metabotropic glutamate receptor agonists stimulate polyphosphoinositide hydrolysis in primary cultures of rat hepatocytes. Eur. J. Pharmacol. 1997, 338, R1–R2. [Google Scholar] [CrossRef]
- Storto, M.; Battaglia, G.; Gradini, R.; Bruno, V.; Nicoletti, F.; Vairetti, M. Mouse hepatocytes lacking mGlu5 metabotropic glutamate receptors are less sensitive to hypoxic damage. Eur. J. Pharmacol. 2004, 497, 25–27. [Google Scholar] [CrossRef] [PubMed]
- Chantong, B.; Kratschmar, D.V.; Lister, A.; Odermatt, A. Inhibition of metabotropic glutamate receptor 5 induces cellular stress through pertussis toxin-sensitive Gi-proteins in murine BV-2 microglia cells. J. Neuroinflamm. 2014, 11, 190. [Google Scholar] [CrossRef] [PubMed]
- Xu, J.; Song, D.; Bai, Q.; Zhou, L.; Cai, L.; Hertz, L.; Peng, L. Role of glycogenolysis in stimulation of ATP release from cultured mouse astrocytes by transmitters and high K+ concentrations. ASN Neuro 2014, 6, e00132. [Google Scholar] [CrossRef] [PubMed]
- Papadopoulos, D.; Siempis, T.; Theodorakou, E.; Tsoulfas, G. Hepatic ischemia and reperfusion injury and trauma: Current concepts. Arch. Trauma Res. 2013, 2, 63–70. [Google Scholar] [CrossRef] [PubMed]
- Ferrigno, A.; Berardo, C.; di Pasqua, L.G.; Siciliano, V.; Vairetti, M. 100 microM DHPG Did Not Alter ATP Concentration When Added to Mitochondrial Suspensions or to Primary Rat Hepatocytes, Cellular and Molecular Pharmacology and Toxicology Unit, University Pavia, Pavia, Italy. 2017; unpublished work. [Google Scholar]
- Maienschein, V.; Marxen, M.; Volknandt, W.; Zimmermann, H. A plethora of presynaptic proteins associated with ATP-storing organelles in cultured astrocytes. Glia 1999, 26, 233–244. [Google Scholar] [CrossRef]
- Porter, R.H.P.; Jaeschke, G.; Spooren, W.; Ballard, T.M.; Büttelmann, B.; Kolczewski, S.; Peters, J.-U.; Prinssen, E.; Wichmann, J.; Vieira, E.; et al. Fenobam: A Clinically validated nonbenzodiazepine anxiolytic is a potent, selective, and noncompetitive mGlu5 receptor antagonist with inverse agonist activity. J. Pharmacol. Exp. Ther. 2005, 315, 711–721. [Google Scholar] [CrossRef] [PubMed]
- Acher, F.C.; Bertrand, H.-O. Amino acid recognition by Venus flytrap domains is encoded in an 8-residue motif. Biopolymers 2005, 80, 357–366. [Google Scholar] [CrossRef] [PubMed]
- Song, M.; Yu, S.P. Ionic regulation of cell volume changes and cell death after ischemic stroke. Transl. Stroke Res. 2014, 5, 17–27. [Google Scholar] [CrossRef] [PubMed]
- Kritis, A.A.; Stamoula, E.G.; Paniskaki, K.A.; Vavilis, T.D. Researching glutamate—Induced cytotoxicity in different cell lines: A comparative/collective analysis/study. Front. Cell. Neurosci. 2015, 9, 91. [Google Scholar] [CrossRef] [PubMed]
- Kawabata, S.; Tsutsumi, R.; Kohara, A.; Yamaguchi, T.; Nakanishi, S.; Okada, M. Control of calcium oscillations by phosphorylation of metabotropic glutamate receptors. Nature 1996, 383, 89–92. [Google Scholar] [CrossRef] [PubMed]
- Choi, D.W. Excitotoxic cell death. J. Neurobiol. 1992, 23, 1261–1276. [Google Scholar] [CrossRef] [PubMed]
- Storto, M.; de Grazia, U.; Battaglia, G.; Felli, M.P.; Maroder, M.; Gulino, A.; Ragona, G.; Nicoletti, F.; Screpanti, I.; Frati, L.; et al. Expression of metabotropic glutamate receptors in murine thymocytes and thymic stromal cells. J. Neuroimmunol. 2000, 109, 112–120. [Google Scholar] [CrossRef]
- Elimadi, A.; Haddad, P.S. Cold preservation-warm reoxygenation increases hepatocyte steady-state Ca2+ and response to Ca2+-mobilizing agonist. Am. J. Physiol. Gastrointest. Liv. Physiol. 2001, 281, G809–G815. [Google Scholar] [CrossRef] [PubMed]
- Bessems, M.; ’t Hart, N.A.; Tolba, R.; Doorschodt, B.M.; Leuvenink, H.G.D.; Ploeg, R.J.; Minor, T.; van Gulik, T.M. The isolated perfused rat liver: Standardization of a time-honoured model. Lab. Anim. 2006, 40, 236–246. [Google Scholar] [CrossRef] [PubMed]
- Ferrigno, A.; Richelmi, P.; Vairetti, M. Troubleshooting and improving the mouse and rat isolated perfused liver preparation. J. Pharmacol. Toxicol. Methods 2013, 67, 107–114. [Google Scholar] [CrossRef] [PubMed]
- Van der Plaats, A.; ’t Hart, N.A.; Verkerke, G.J.; Leuvenink, H.G.D.; Ploeg, R.J.; Rakhorst, G. Hypothermic machine preservation in liver transplantation revisited: Concepts and criteria in the new millennium. Ann. Biomed. Eng. 2004, 32, 623–631. [Google Scholar] [CrossRef] [PubMed]
- Jaeschke, H. Molecular mechanisms of hepatic ischemia-reperfusion injury and preconditioning. Am. J. Physiol. Gastrointest. Liv. Physiol. 2003, 284, G15–G26. [Google Scholar] [CrossRef] [PubMed]
- Colletti, L.M.; Remick, D.G.; Burtch, G.D.; Kunkel, S.L.; Strieter, R.M.; Campbell, D.A.J. Role of tumor necrosis factor-alpha in the pathophysiologic alterations after hepatic ischemia/reperfusion injury in the rat. J. Clin. Invest. 1990, 85, 1936–1943. [Google Scholar] [CrossRef] [PubMed]
- Colletti, L.M.; Cortis, A.; Lukacs, N.; Kunkel, S.L.; Green, M.; Strieter, R.M. Tumor necrosis factor up-regulates intercellular adhesion molecule 1, which is important in the neutrophil-dependent lung and liver injury associated with hepatic ischemia and reperfusion in the rat. Shock 1998, 10, 182–191. [Google Scholar] [CrossRef] [PubMed]
- Eberhardt, W.; Kunz, D.; Hummel, R.; Pfeilschifter, J. Molecular cloning of the rat inducible nitric oxide synthase gene promoter. Biochem. Biophys. Res. Commun. 1996, 223, 752–756. [Google Scholar] [CrossRef] [PubMed]
- Nandi, J.; Saud, B.; Zinkievich, J.M.; Yang, Z.; Levine, R.A. TNF-α modulates iNOS expression in an experimental rat model of indomethacin-induced jejunoileitis. Mol. Cell. Biochem. 2010, 336, 17–24. [Google Scholar] [CrossRef] [PubMed]
- Ferrigno, A.; Vairetti, M.; Ambrosi, G.; Rizzo, V.; Richelmi, P.; Blandini, F.; Fuzzati-Armentero, M.-T.; Armentero, M.-T. Selective blockade of mGlu5 metabotropic glutamate receptors is protective against hepatic mitochondrial dysfunction in 6-OHDA lesioned Parkinsonian rats. Clin. Exp. Pharmacol. Physiol. 2015, 42, 695–703. [Google Scholar] [CrossRef] [PubMed]
- Vairetti, M.; Ferrigno, A.; Rizzo, V.; Ambrosi, G.; Bianchi, A.; Richelmi, P.; Blandini, F.; Armentero, M.-T. Impaired hepatic function and central dopaminergic denervation in a rodent model of Parkinson’s disease: A self-perpetuating crosstalk? Biochim. Biophys. Acta 2012, 1822, 176–184. [Google Scholar] [CrossRef] [PubMed]
- Lowry, O.H.; Rosebrough, N.J.; Farr, A.L.; Randall, R.J. Protein measurement with the Folin phenol reagent. J. Biol. Chem. 1951, 193, 265–275. [Google Scholar] [PubMed]
- Plin, C.; Haddad, P.S.; Tillement, J.P.; Elimadi, A.; Morin, D. Protection by cyclosporin A of mitochondrial and cellular functions during a cold preservation-warm reperfusion of rat liver. Eur. J. Pharmacol. 2004, 495, 111–118. [Google Scholar] [CrossRef] [PubMed]
- Storto, M.; Ngomba, R.T.; Battaglia, G.; Freitas, I.; Griffini, P.; Richelmi, P.; Nicoletti, F.; Vairetti, M. Selective blockade of mGlu5 metabotropic glutamate receptors is protective against acetaminophen hepatotoxicity in mice. J. Hepatol. 2003, 38, 179–187. [Google Scholar] [CrossRef]
- Imberti, R.; Ferrigno, A.; Tartaglia, A.; Rizzo, V.; Richelmi, P.; Vairetti, M. Changes in extra- and intracellular pH in hepatocytes exposed to gabexate mesilate. Int. J. Immunopathol. Pharmacol. 2014, 27, 365–370. [Google Scholar] [CrossRef] [PubMed]
- Ferrigno, A.; Gregotti, C.; Richelmi, P.; Vairetti, M. Dexamethasone protects cultured rat hepatocytes against cadmium toxicity: Involvement of cellular thiols. In Vitro Cell. Dev. Biol. Anim. 2010, 46. [Google Scholar] [CrossRef] [PubMed]
- Strober, W. Trypan Blue Exclusion Test of Cell Viability. In Current Protocols in Immunology; John Wiley & Sons, Inc.: Hoboken, NJ, USA, 2001. [Google Scholar]
- Bergmeyer, H.-U.; Bernt, E.; Hess, B. Lactic Dehydrogenase; Springer: Berlin, Germany, 1965. [Google Scholar]
- Di Pasqua, L.G.L.G.; Berardo, C.; Rizzo, V.; Richelmi, P.; Croce, A.C.A.C.; Vairetti, M.; Ferrigno, A. MCD diet-induced steatohepatitis is associated with alterations in asymmetric dimethylarginine (ADMA) and its transporters. Mol. Cell. Biochem. 2016, 419, 147–155. [Google Scholar] [CrossRef] [PubMed]


| CTRL | MPEP 300 nM | KO | DHPG 100 µM |
|---|---|---|---|
| 2.39 ± 0.34 | 3.52 ± 1.56 | 2.81 ± 0.92 | 1.82 ± 0.87 |
| CTRL | MPEP 300 nM | KO | DHPG 100 µM |
|---|---|---|---|
| 2.48 ± 0.55 | 2.90 ± 0.70 | 2.44 ± 0.82 | 2.13 ± 0.77 |
© 2018 by the authors. Licensee MDPI, Basel, Switzerland. This article is an open access article distributed under the terms and conditions of the Creative Commons Attribution (CC BY) license (http://creativecommons.org/licenses/by/4.0/).
Share and Cite
Ferrigno, A.; Berardo, C.; Di Pasqua, L.G.; Siciliano, V.; Richelmi, P.; Nicoletti, F.; Vairetti, M. Selective Blockade of the Metabotropic Glutamate Receptor mGluR5 Protects Mouse Livers in In Vitro and Ex Vivo Models of Ischemia Reperfusion Injury. Int. J. Mol. Sci. 2018, 19, 314. https://doi.org/10.3390/ijms19020314
Ferrigno A, Berardo C, Di Pasqua LG, Siciliano V, Richelmi P, Nicoletti F, Vairetti M. Selective Blockade of the Metabotropic Glutamate Receptor mGluR5 Protects Mouse Livers in In Vitro and Ex Vivo Models of Ischemia Reperfusion Injury. International Journal of Molecular Sciences. 2018; 19(2):314. https://doi.org/10.3390/ijms19020314
Chicago/Turabian StyleFerrigno, Andrea, Clarissa Berardo, Laura Giuseppina Di Pasqua, Veronica Siciliano, Plinio Richelmi, Ferdinando Nicoletti, and Mariapia Vairetti. 2018. "Selective Blockade of the Metabotropic Glutamate Receptor mGluR5 Protects Mouse Livers in In Vitro and Ex Vivo Models of Ischemia Reperfusion Injury" International Journal of Molecular Sciences 19, no. 2: 314. https://doi.org/10.3390/ijms19020314