
Brain RNA-Seq Profiling of the Mucopolysaccharidosis Type II Mouse Model


 , and
, and
Abstract
: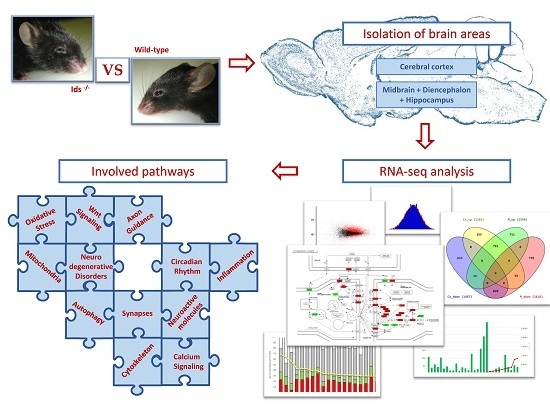
1. Introduction
2. Results
2.1. Reads and Quality Control
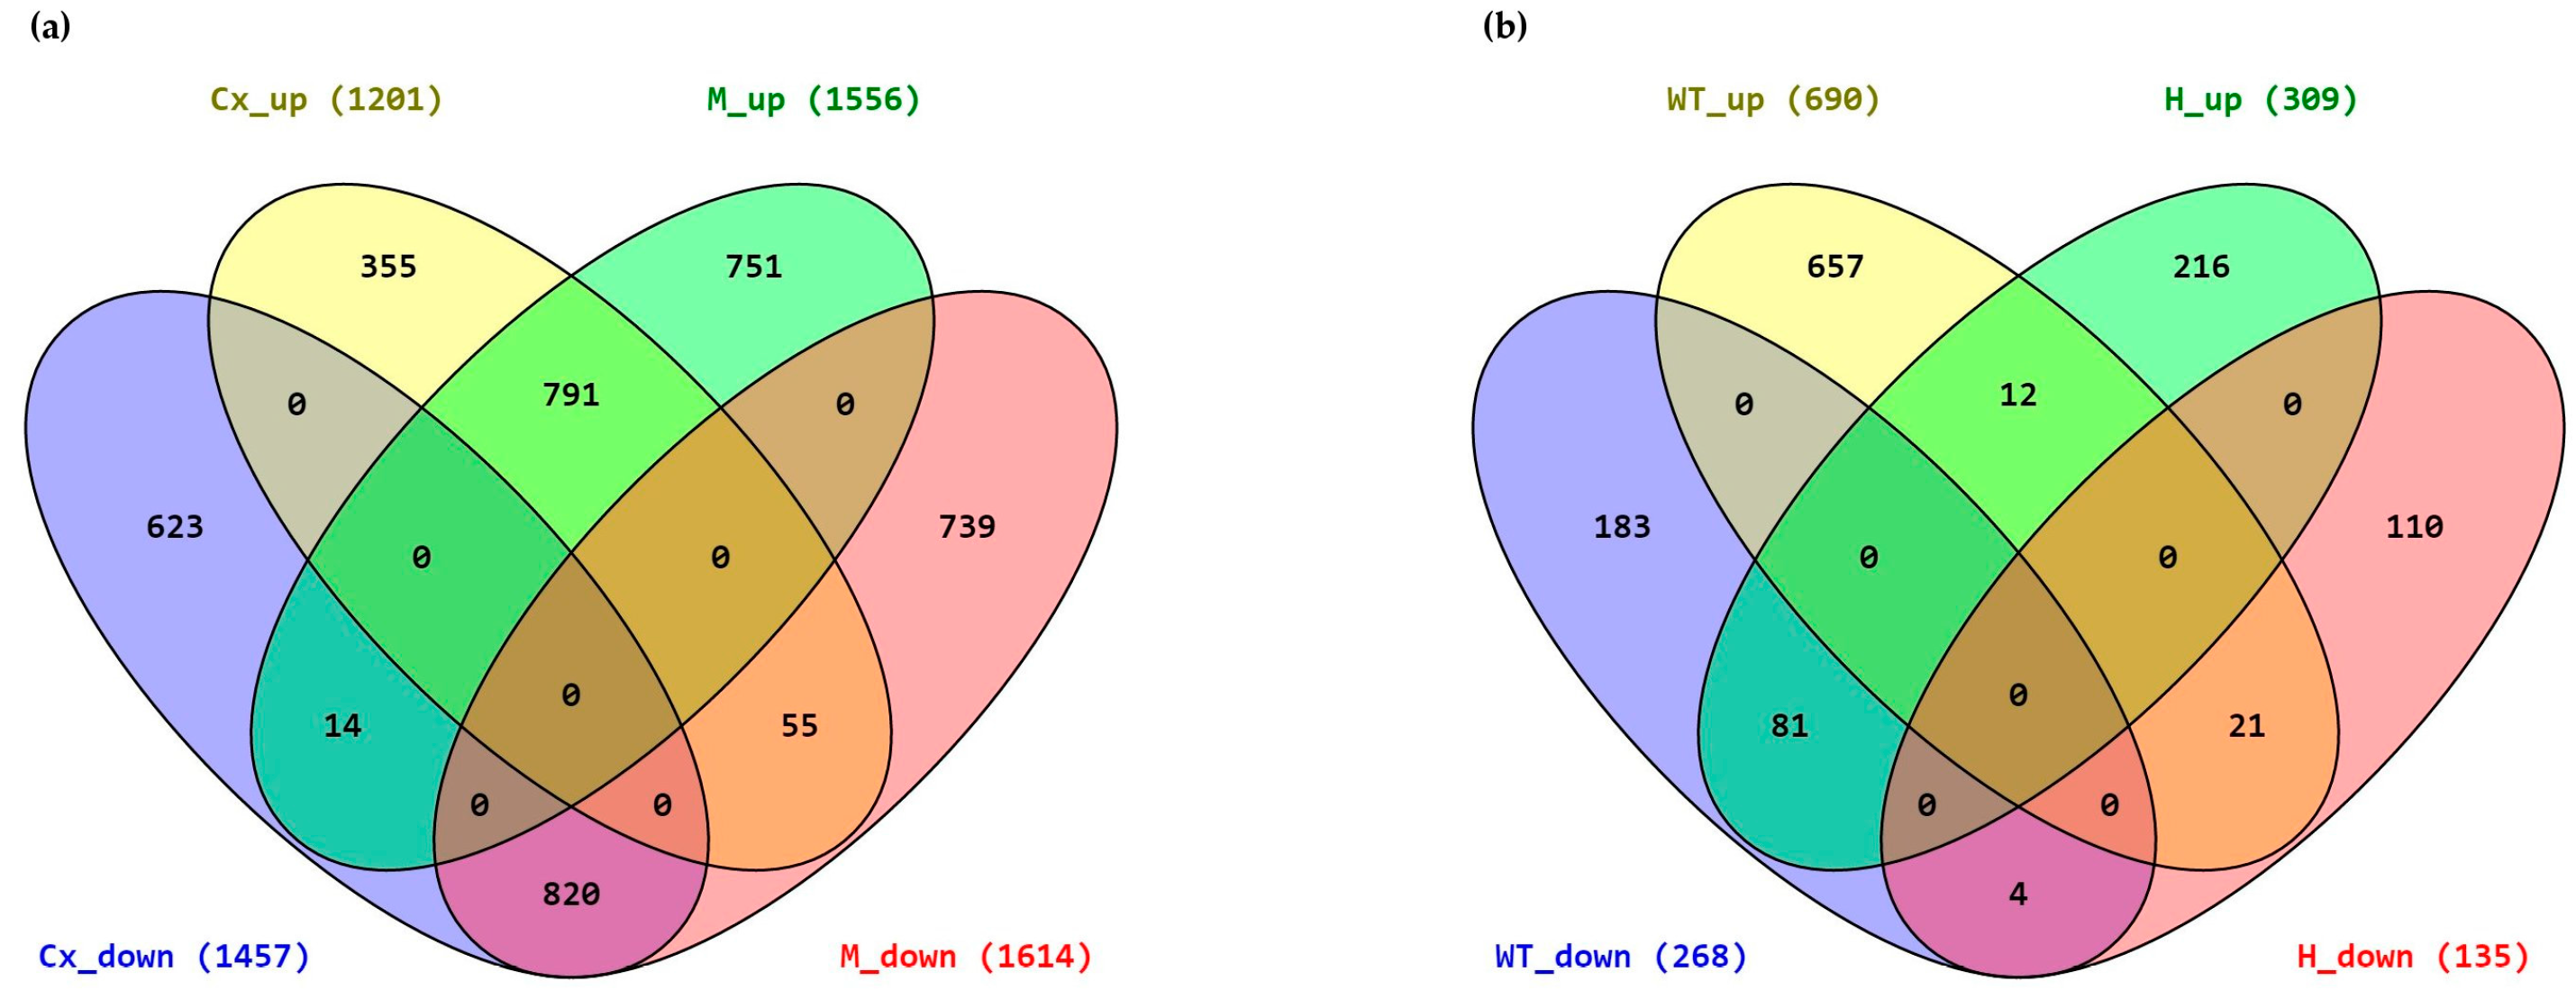
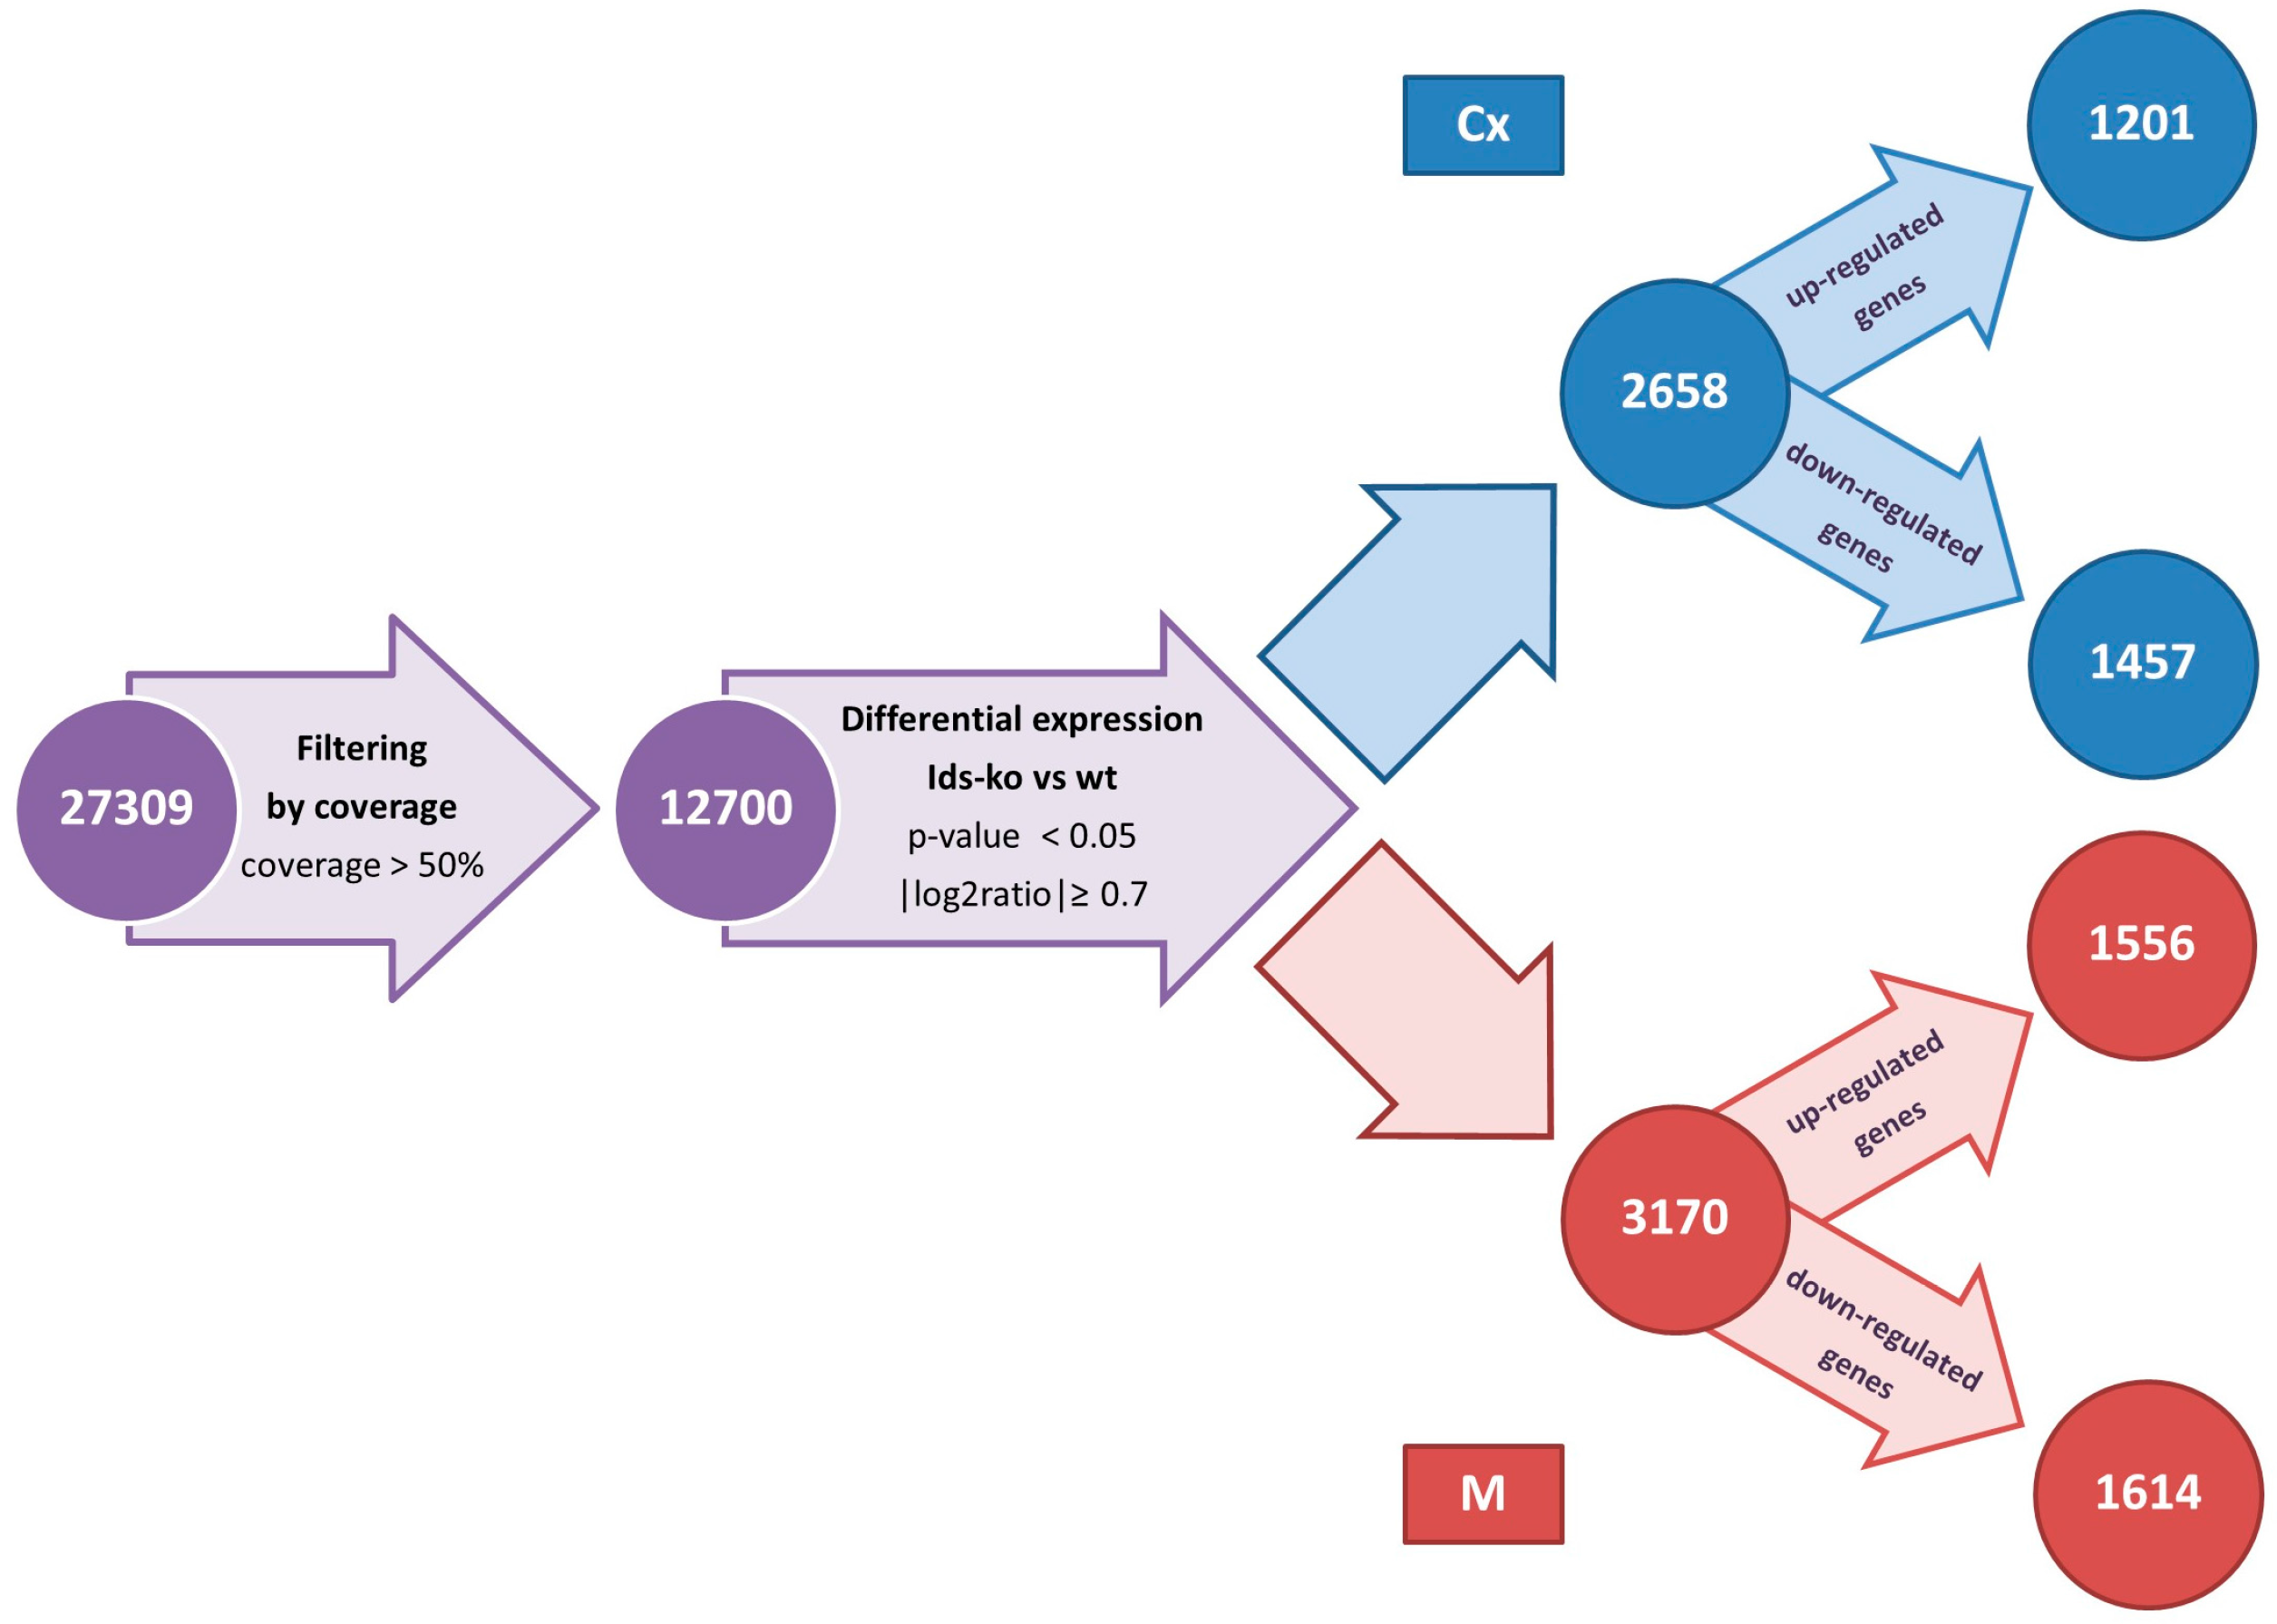
2.2. Differentially Expressed Genes
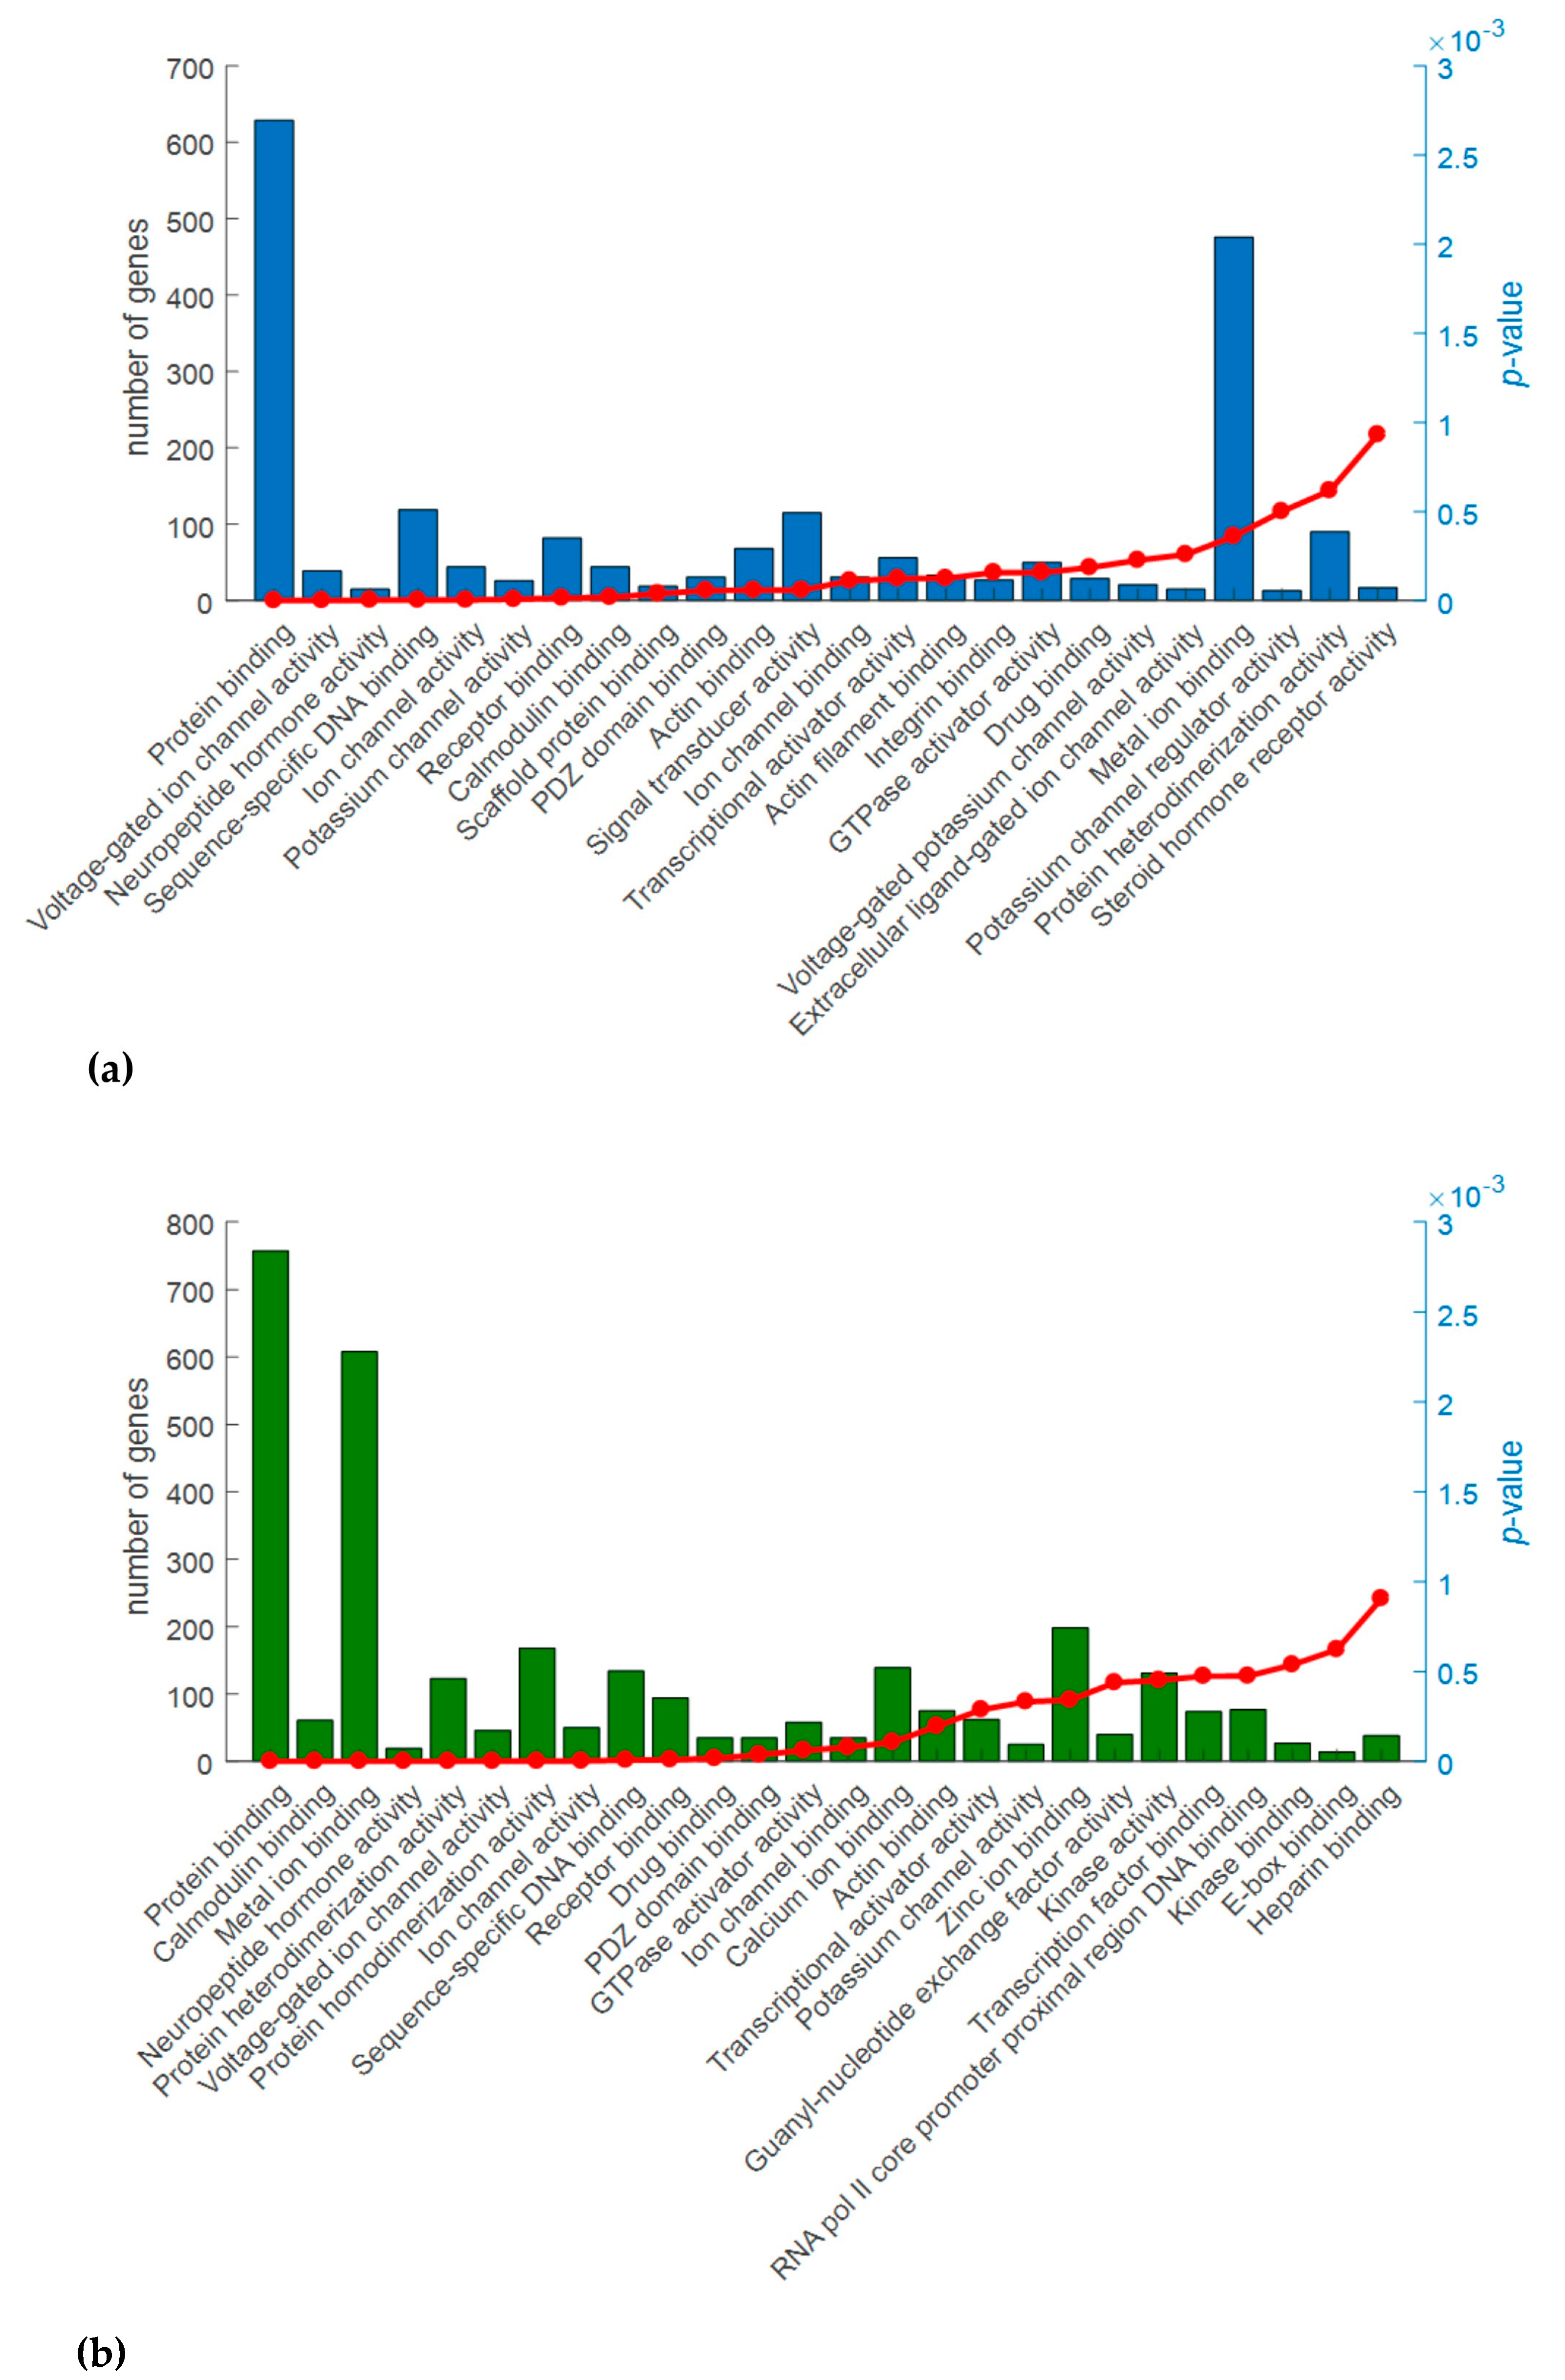
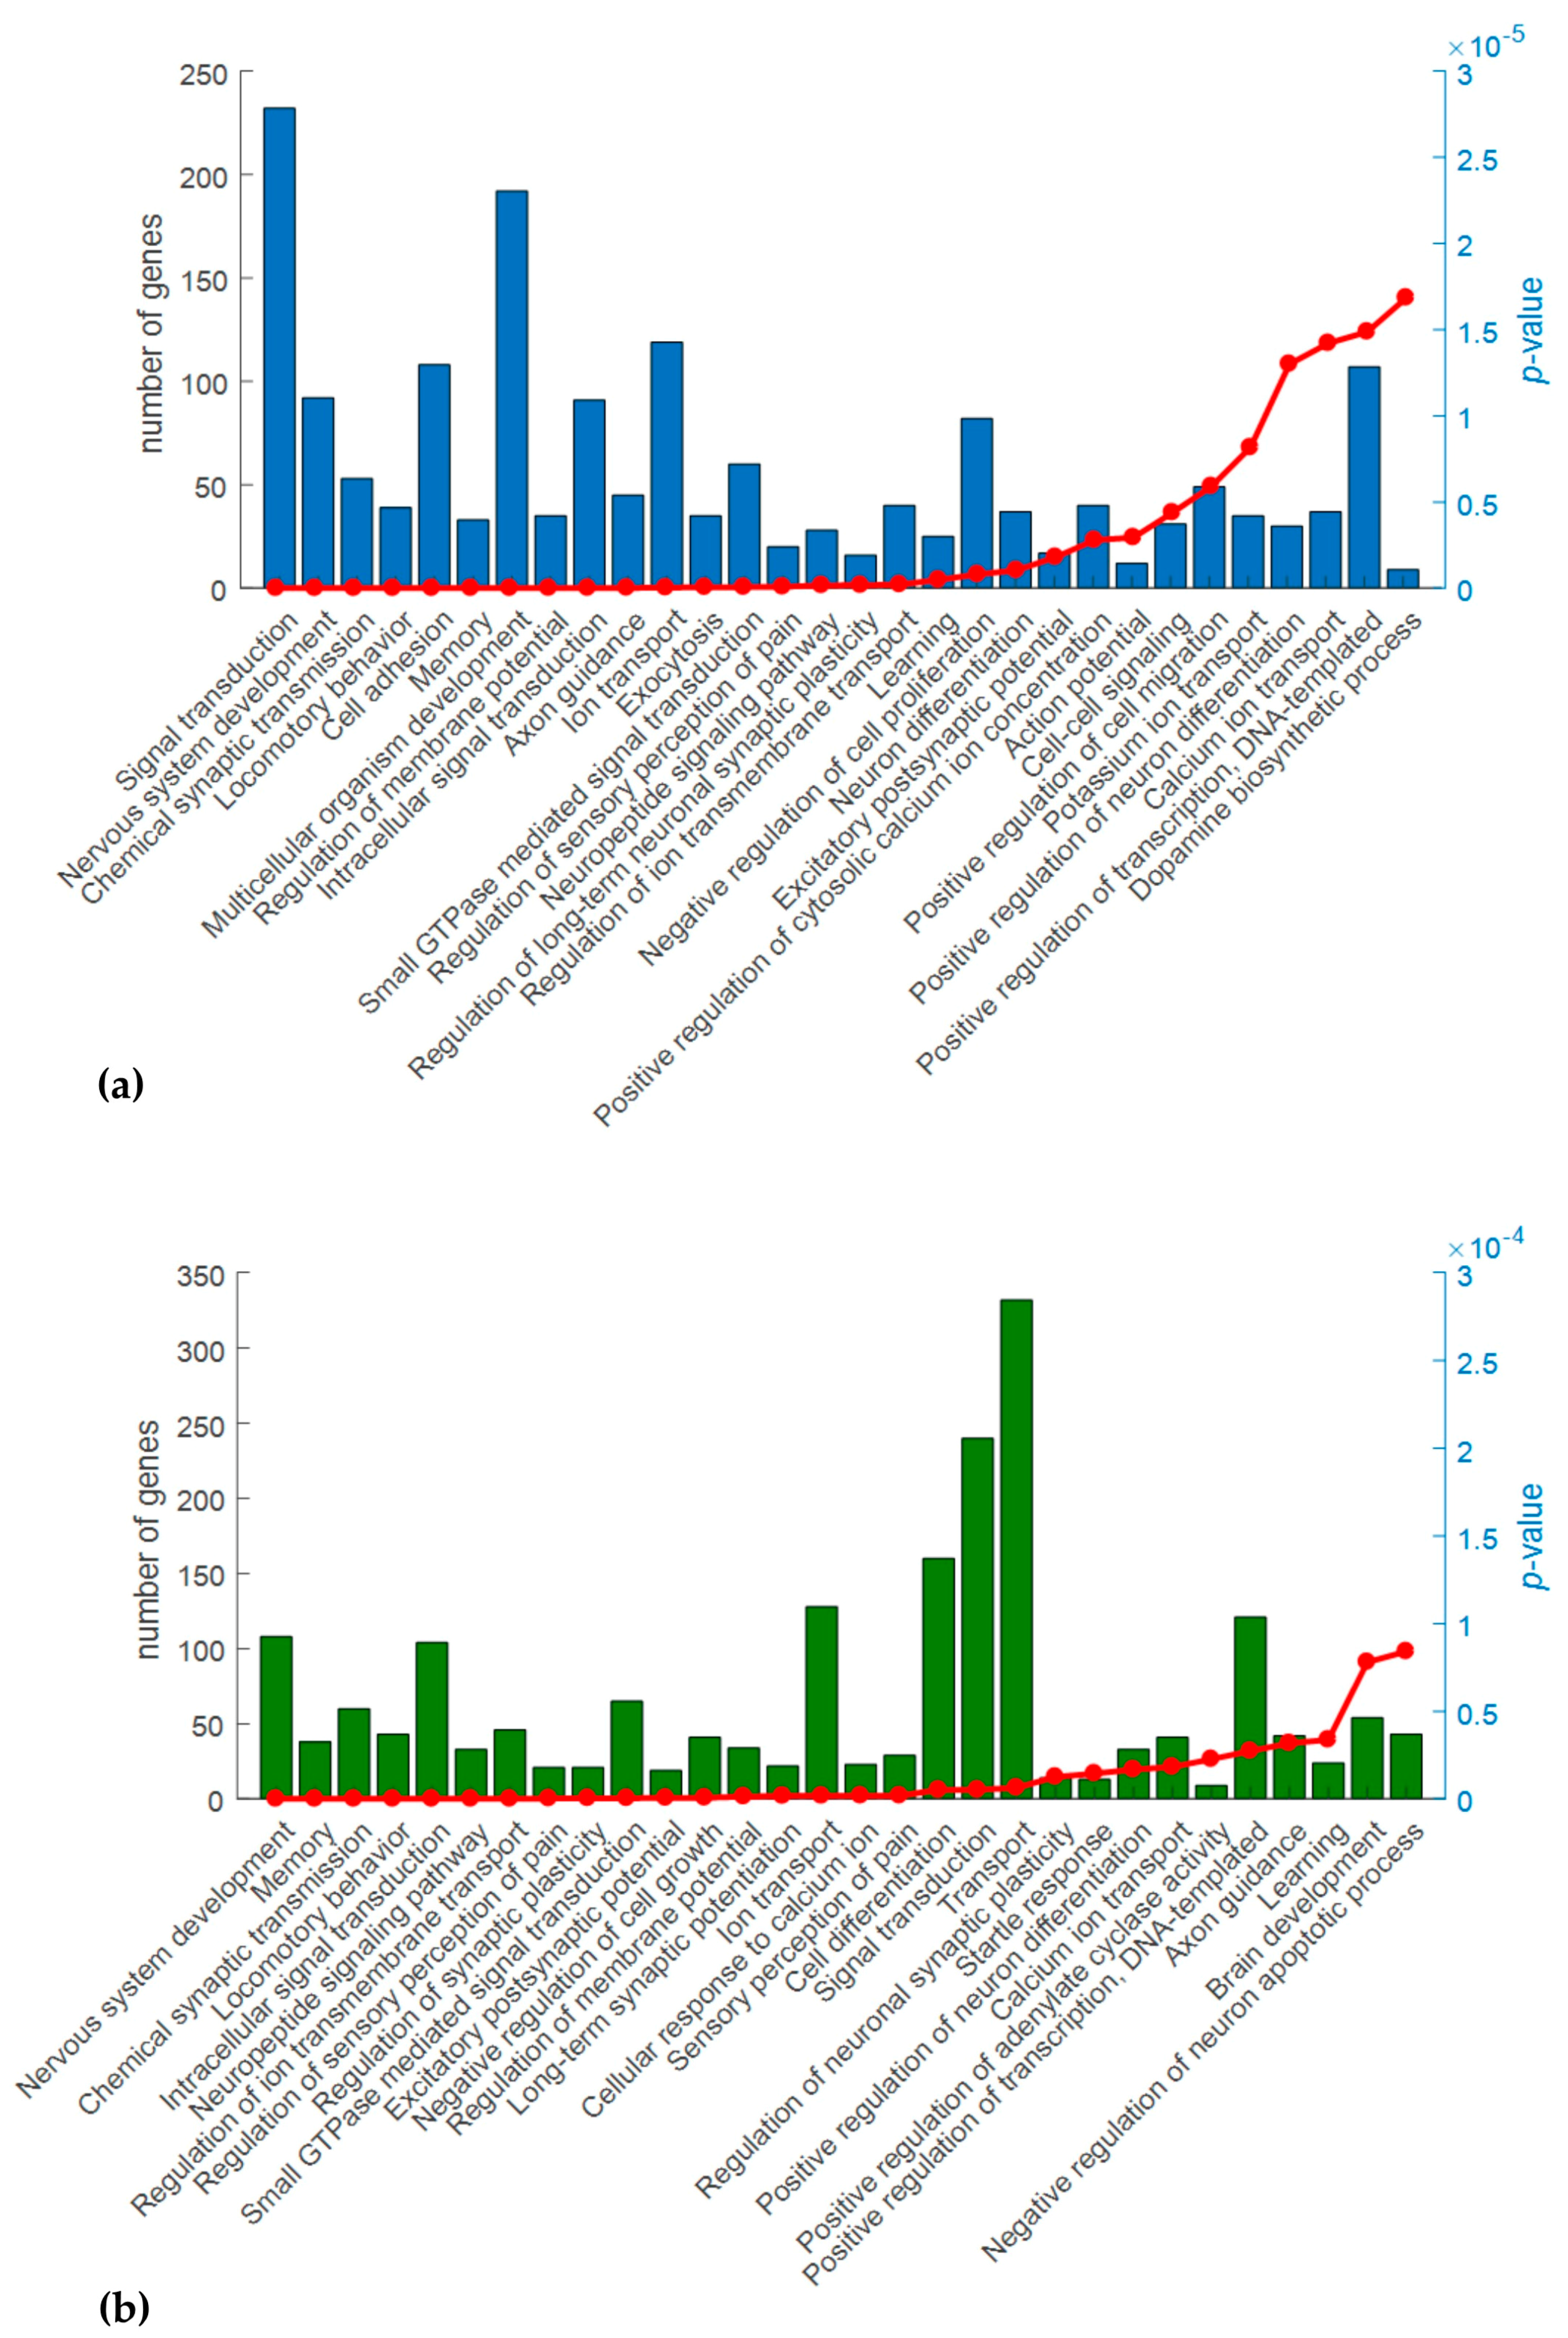
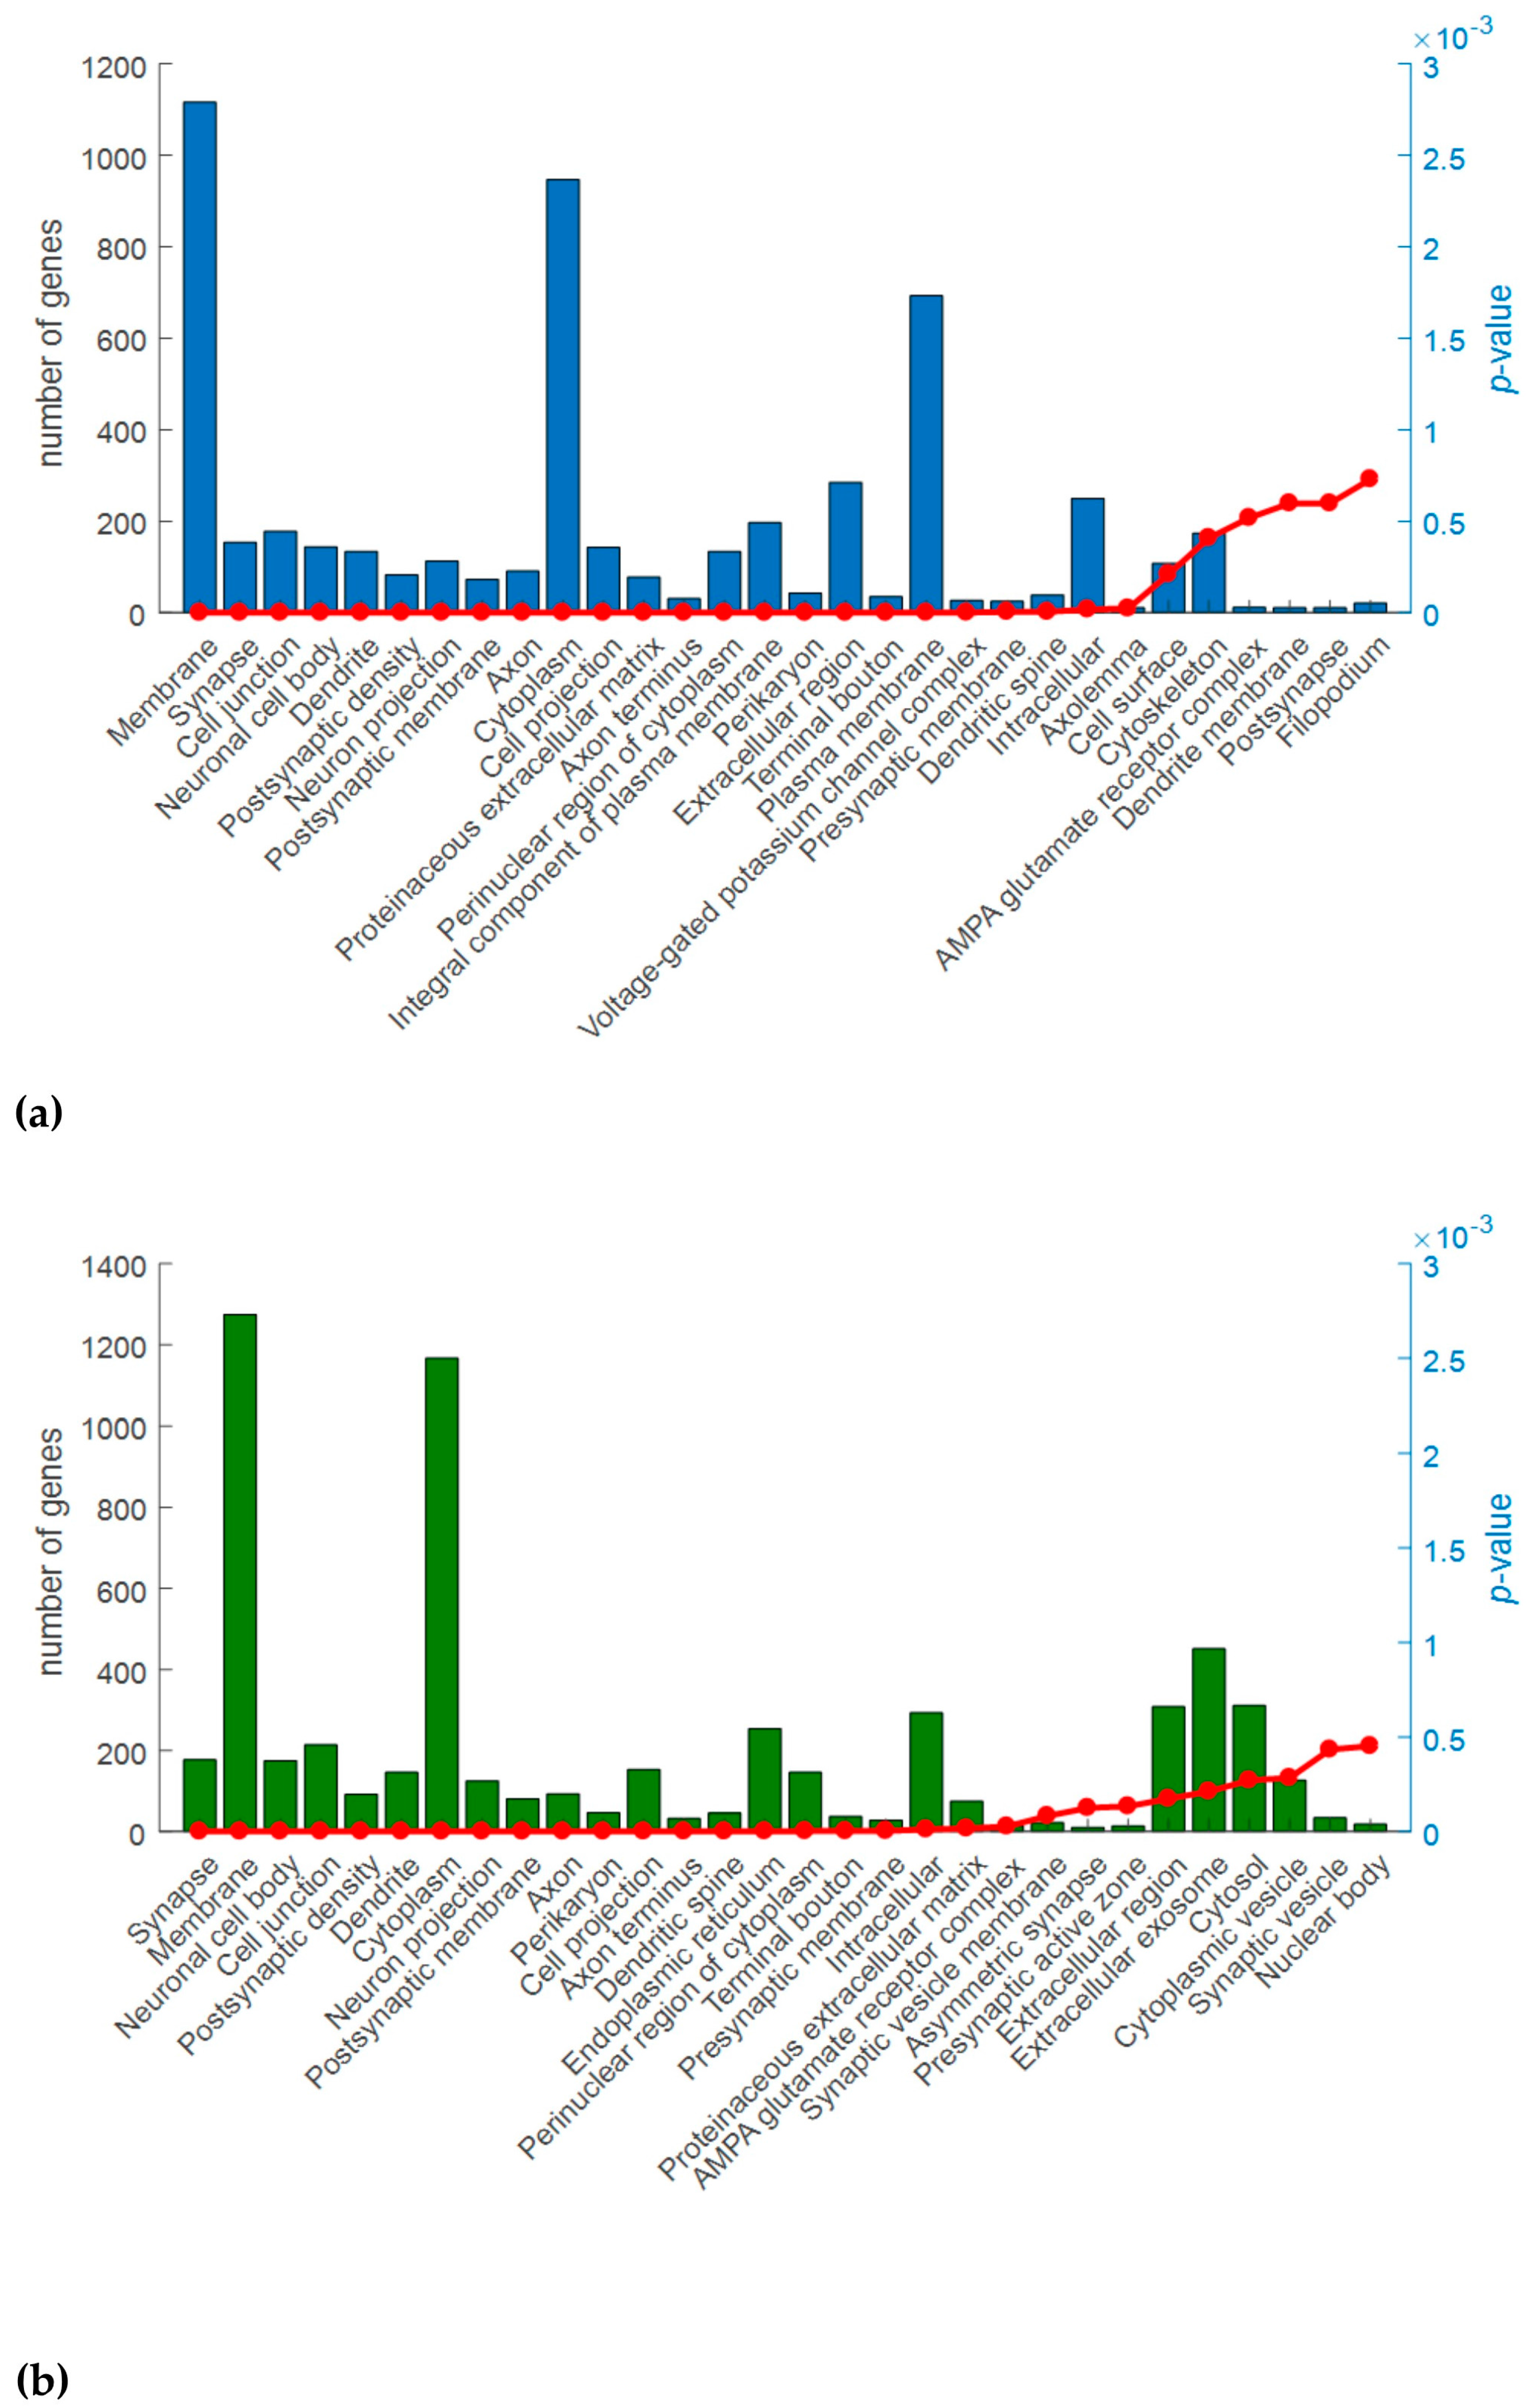
2.3. Gene Ontology (GO) Analysis
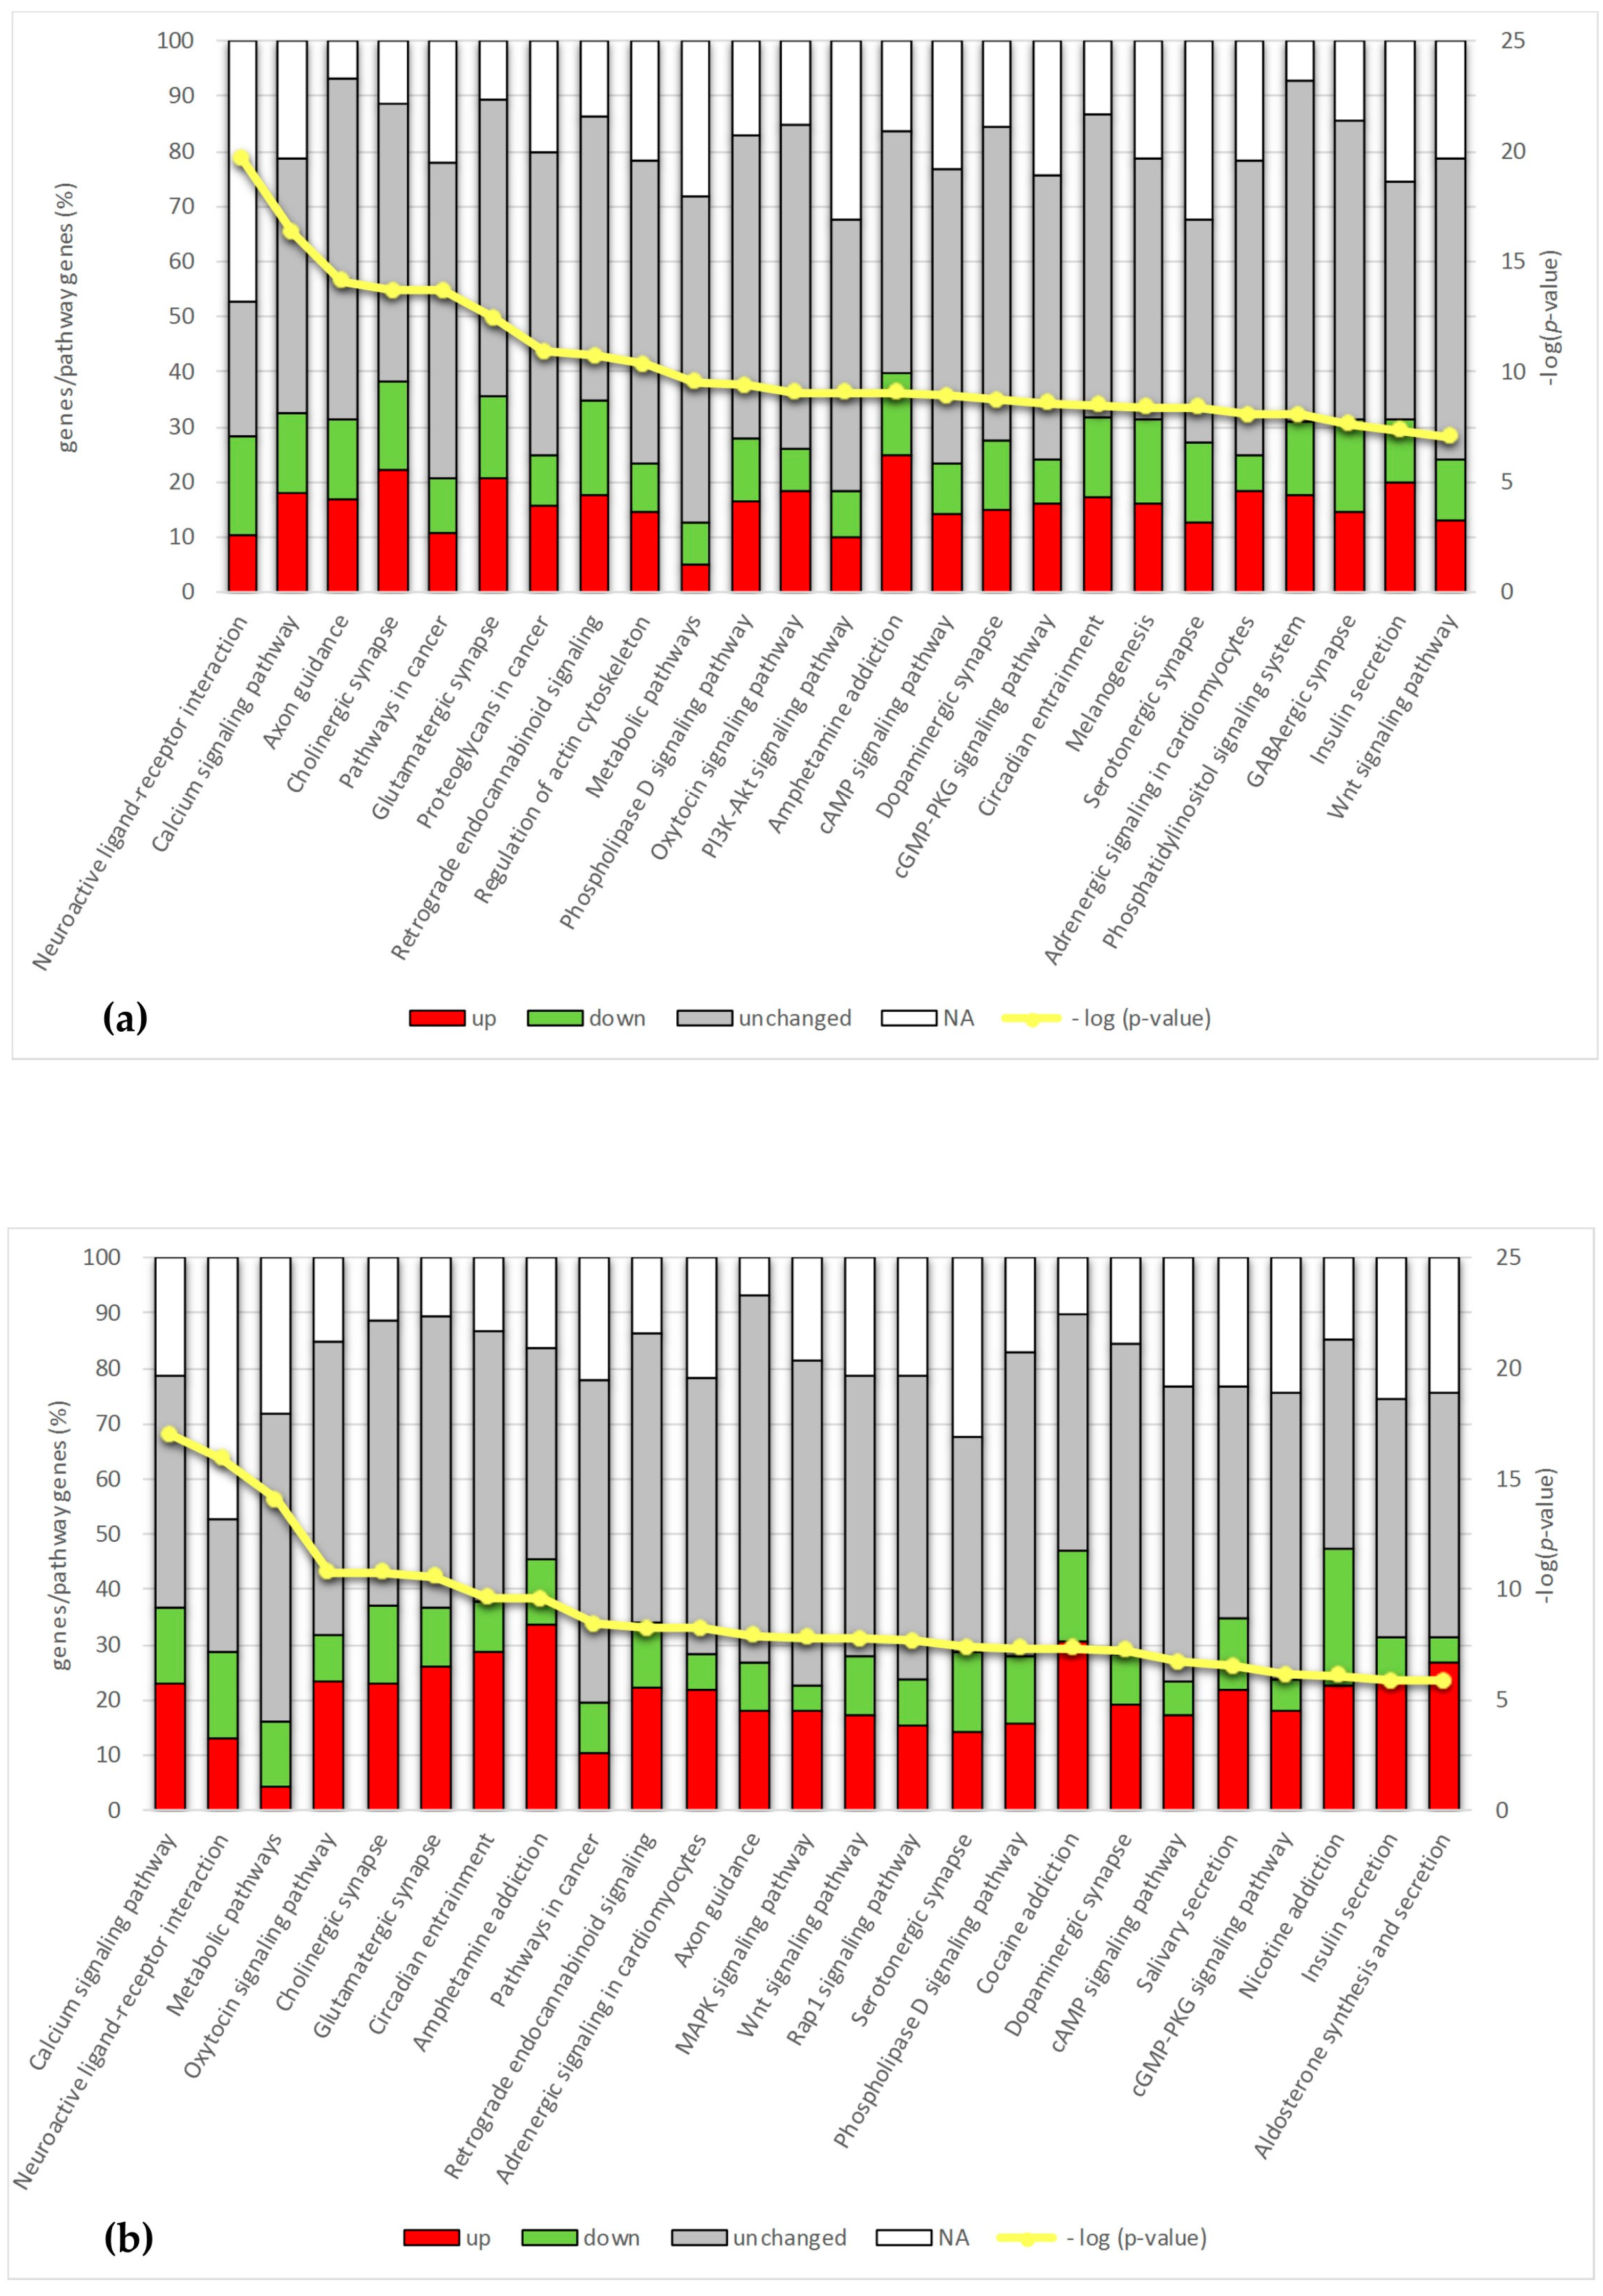
2.4. Pathway Analysis
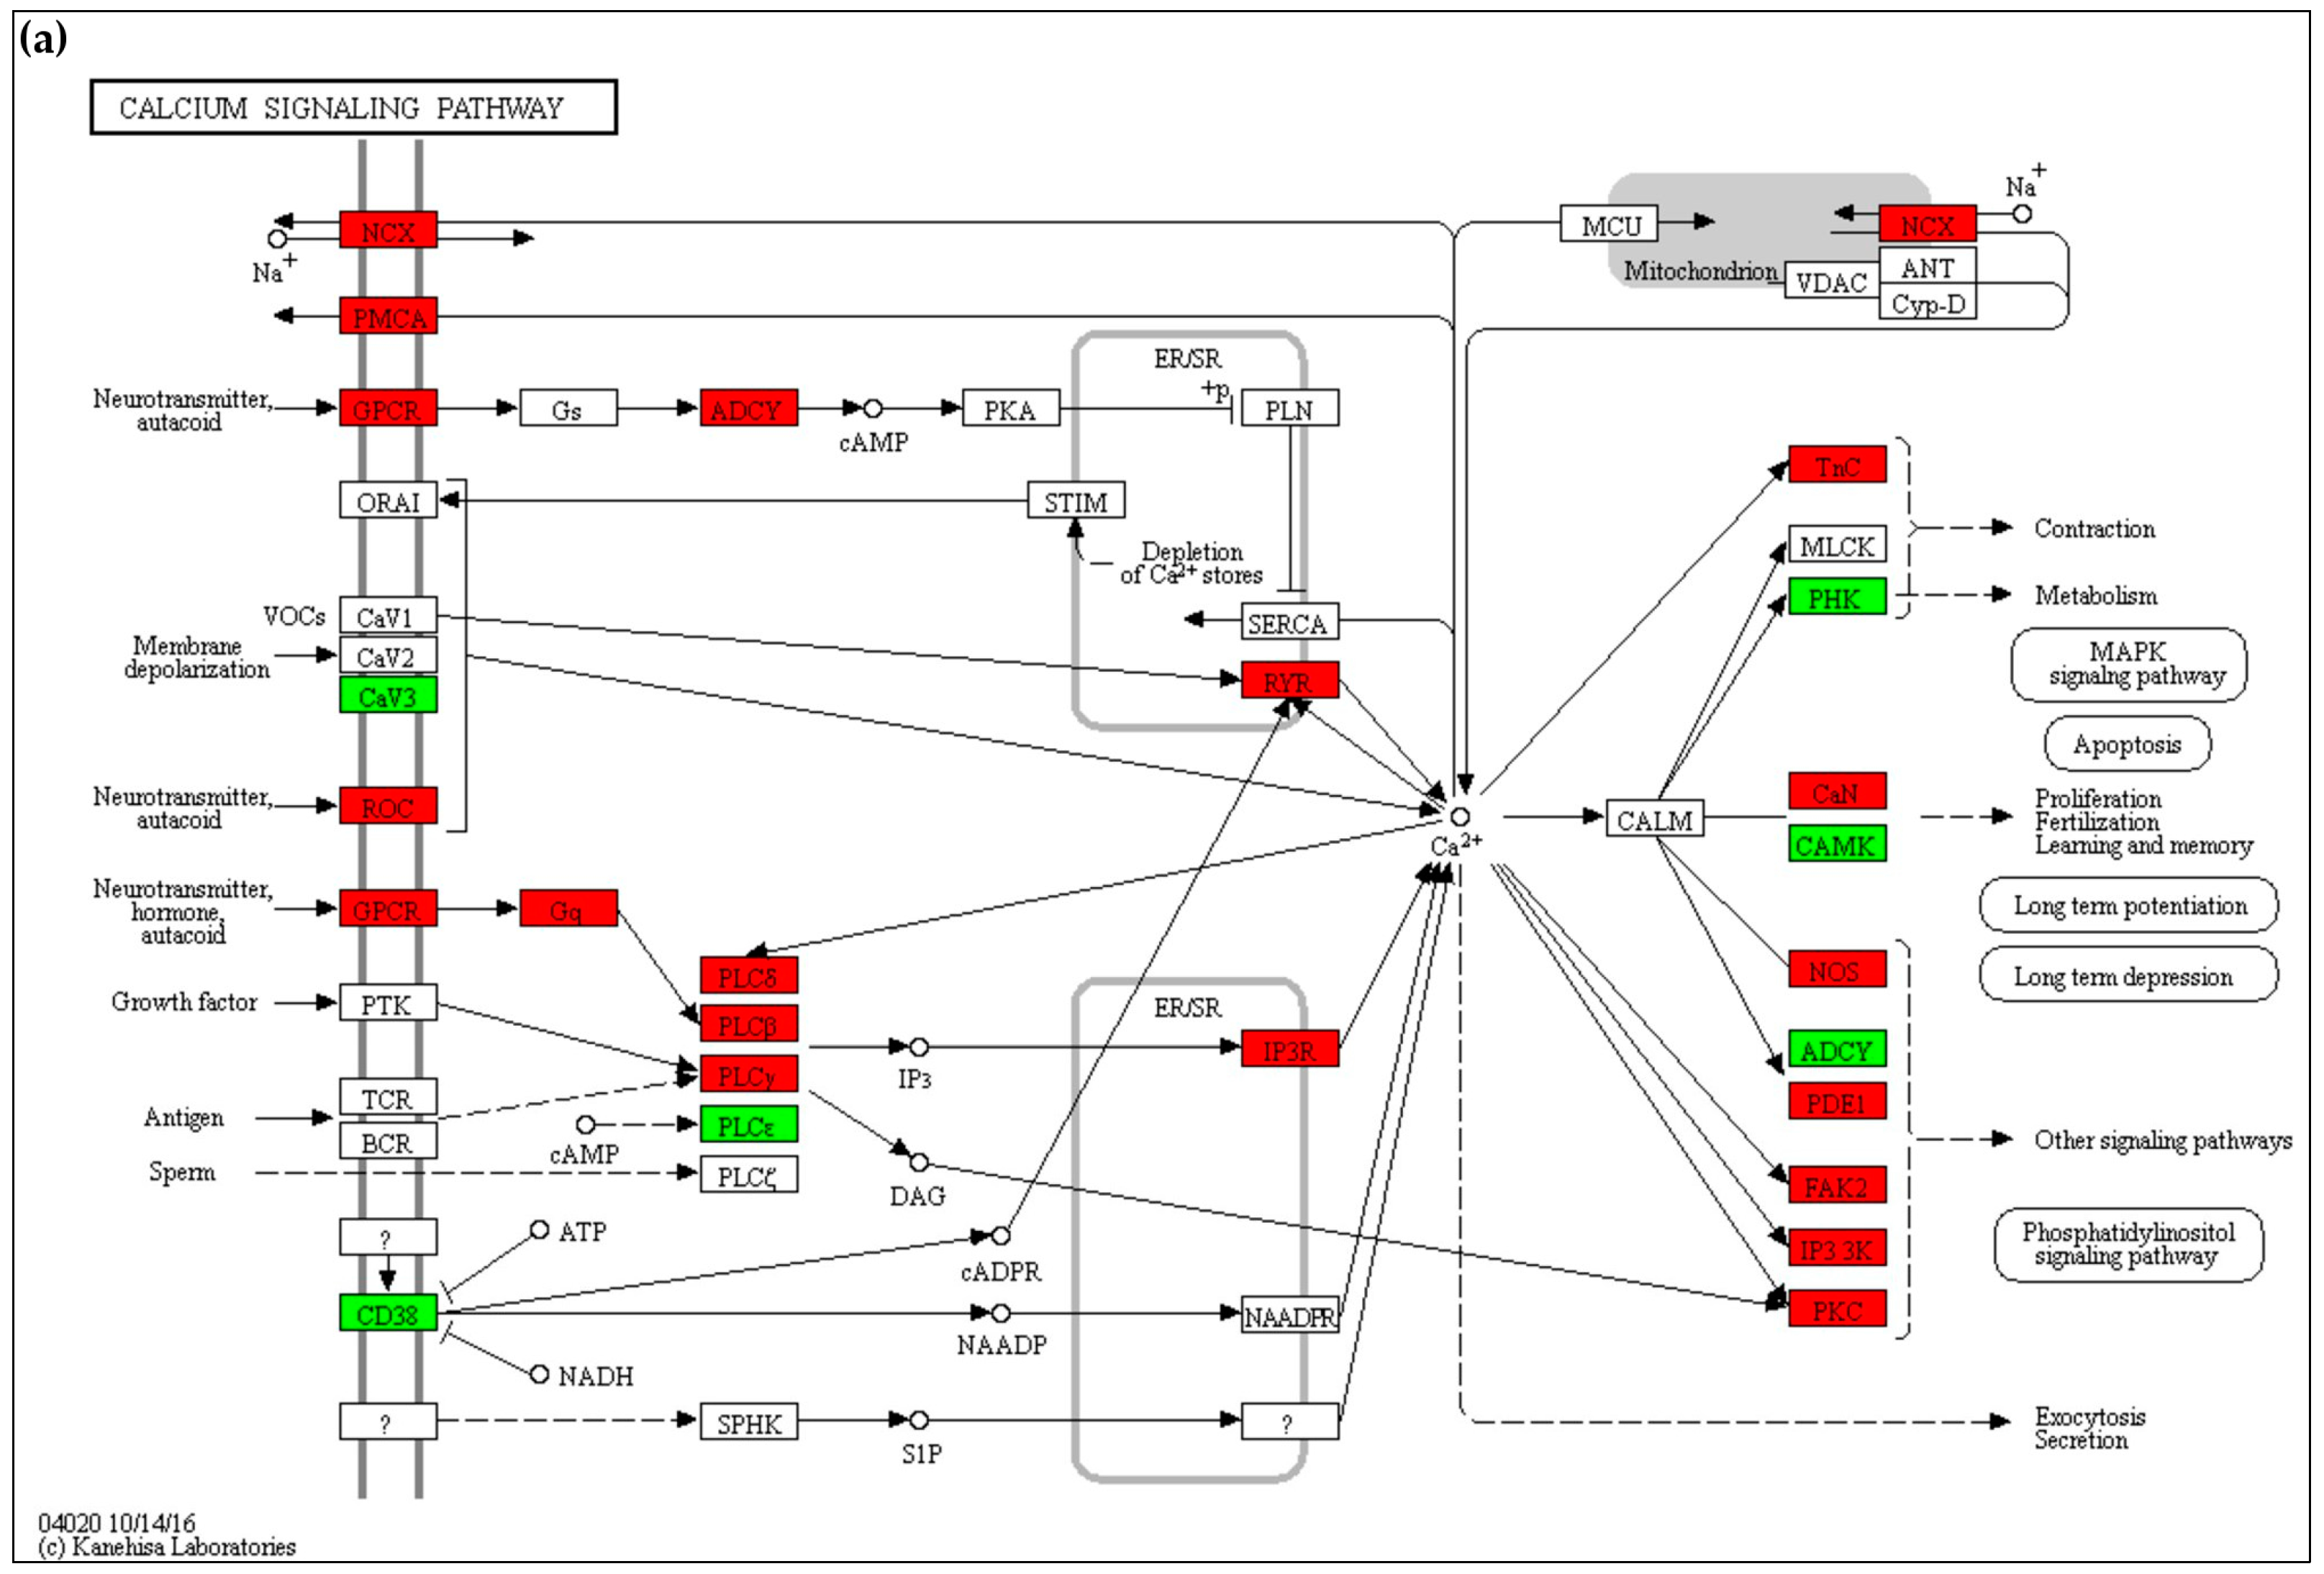
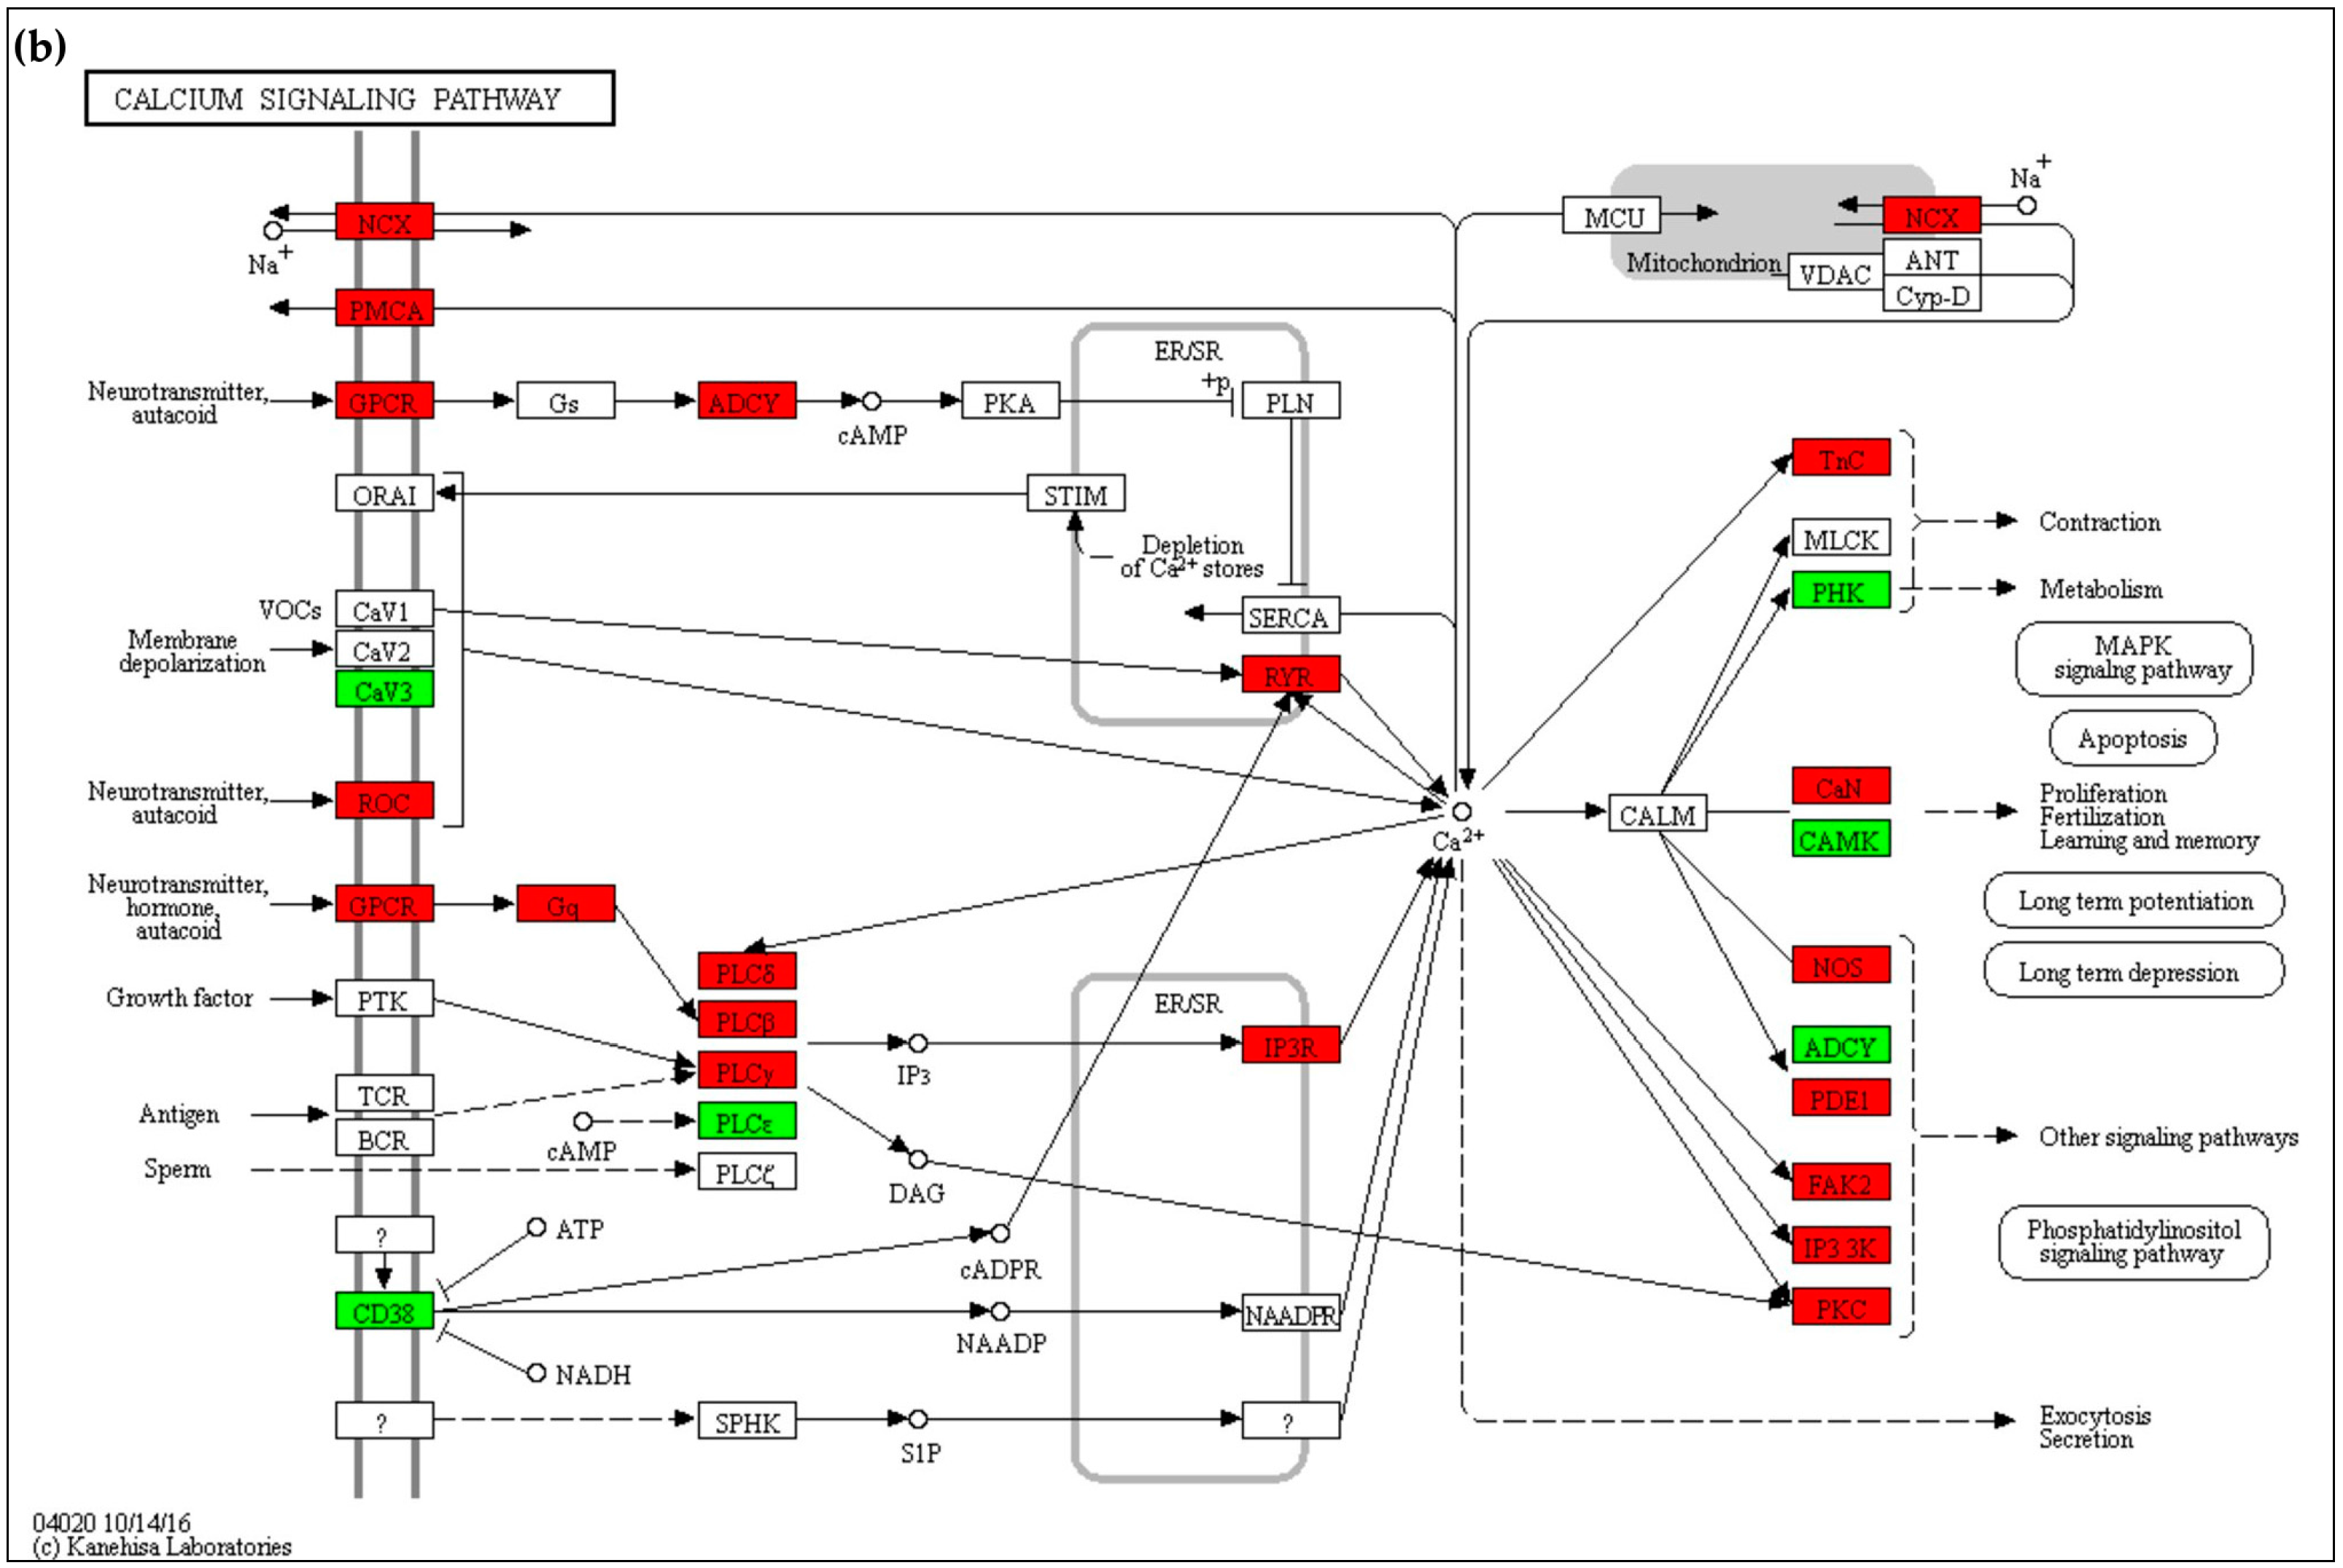
2.4.1. Calcium Signaling
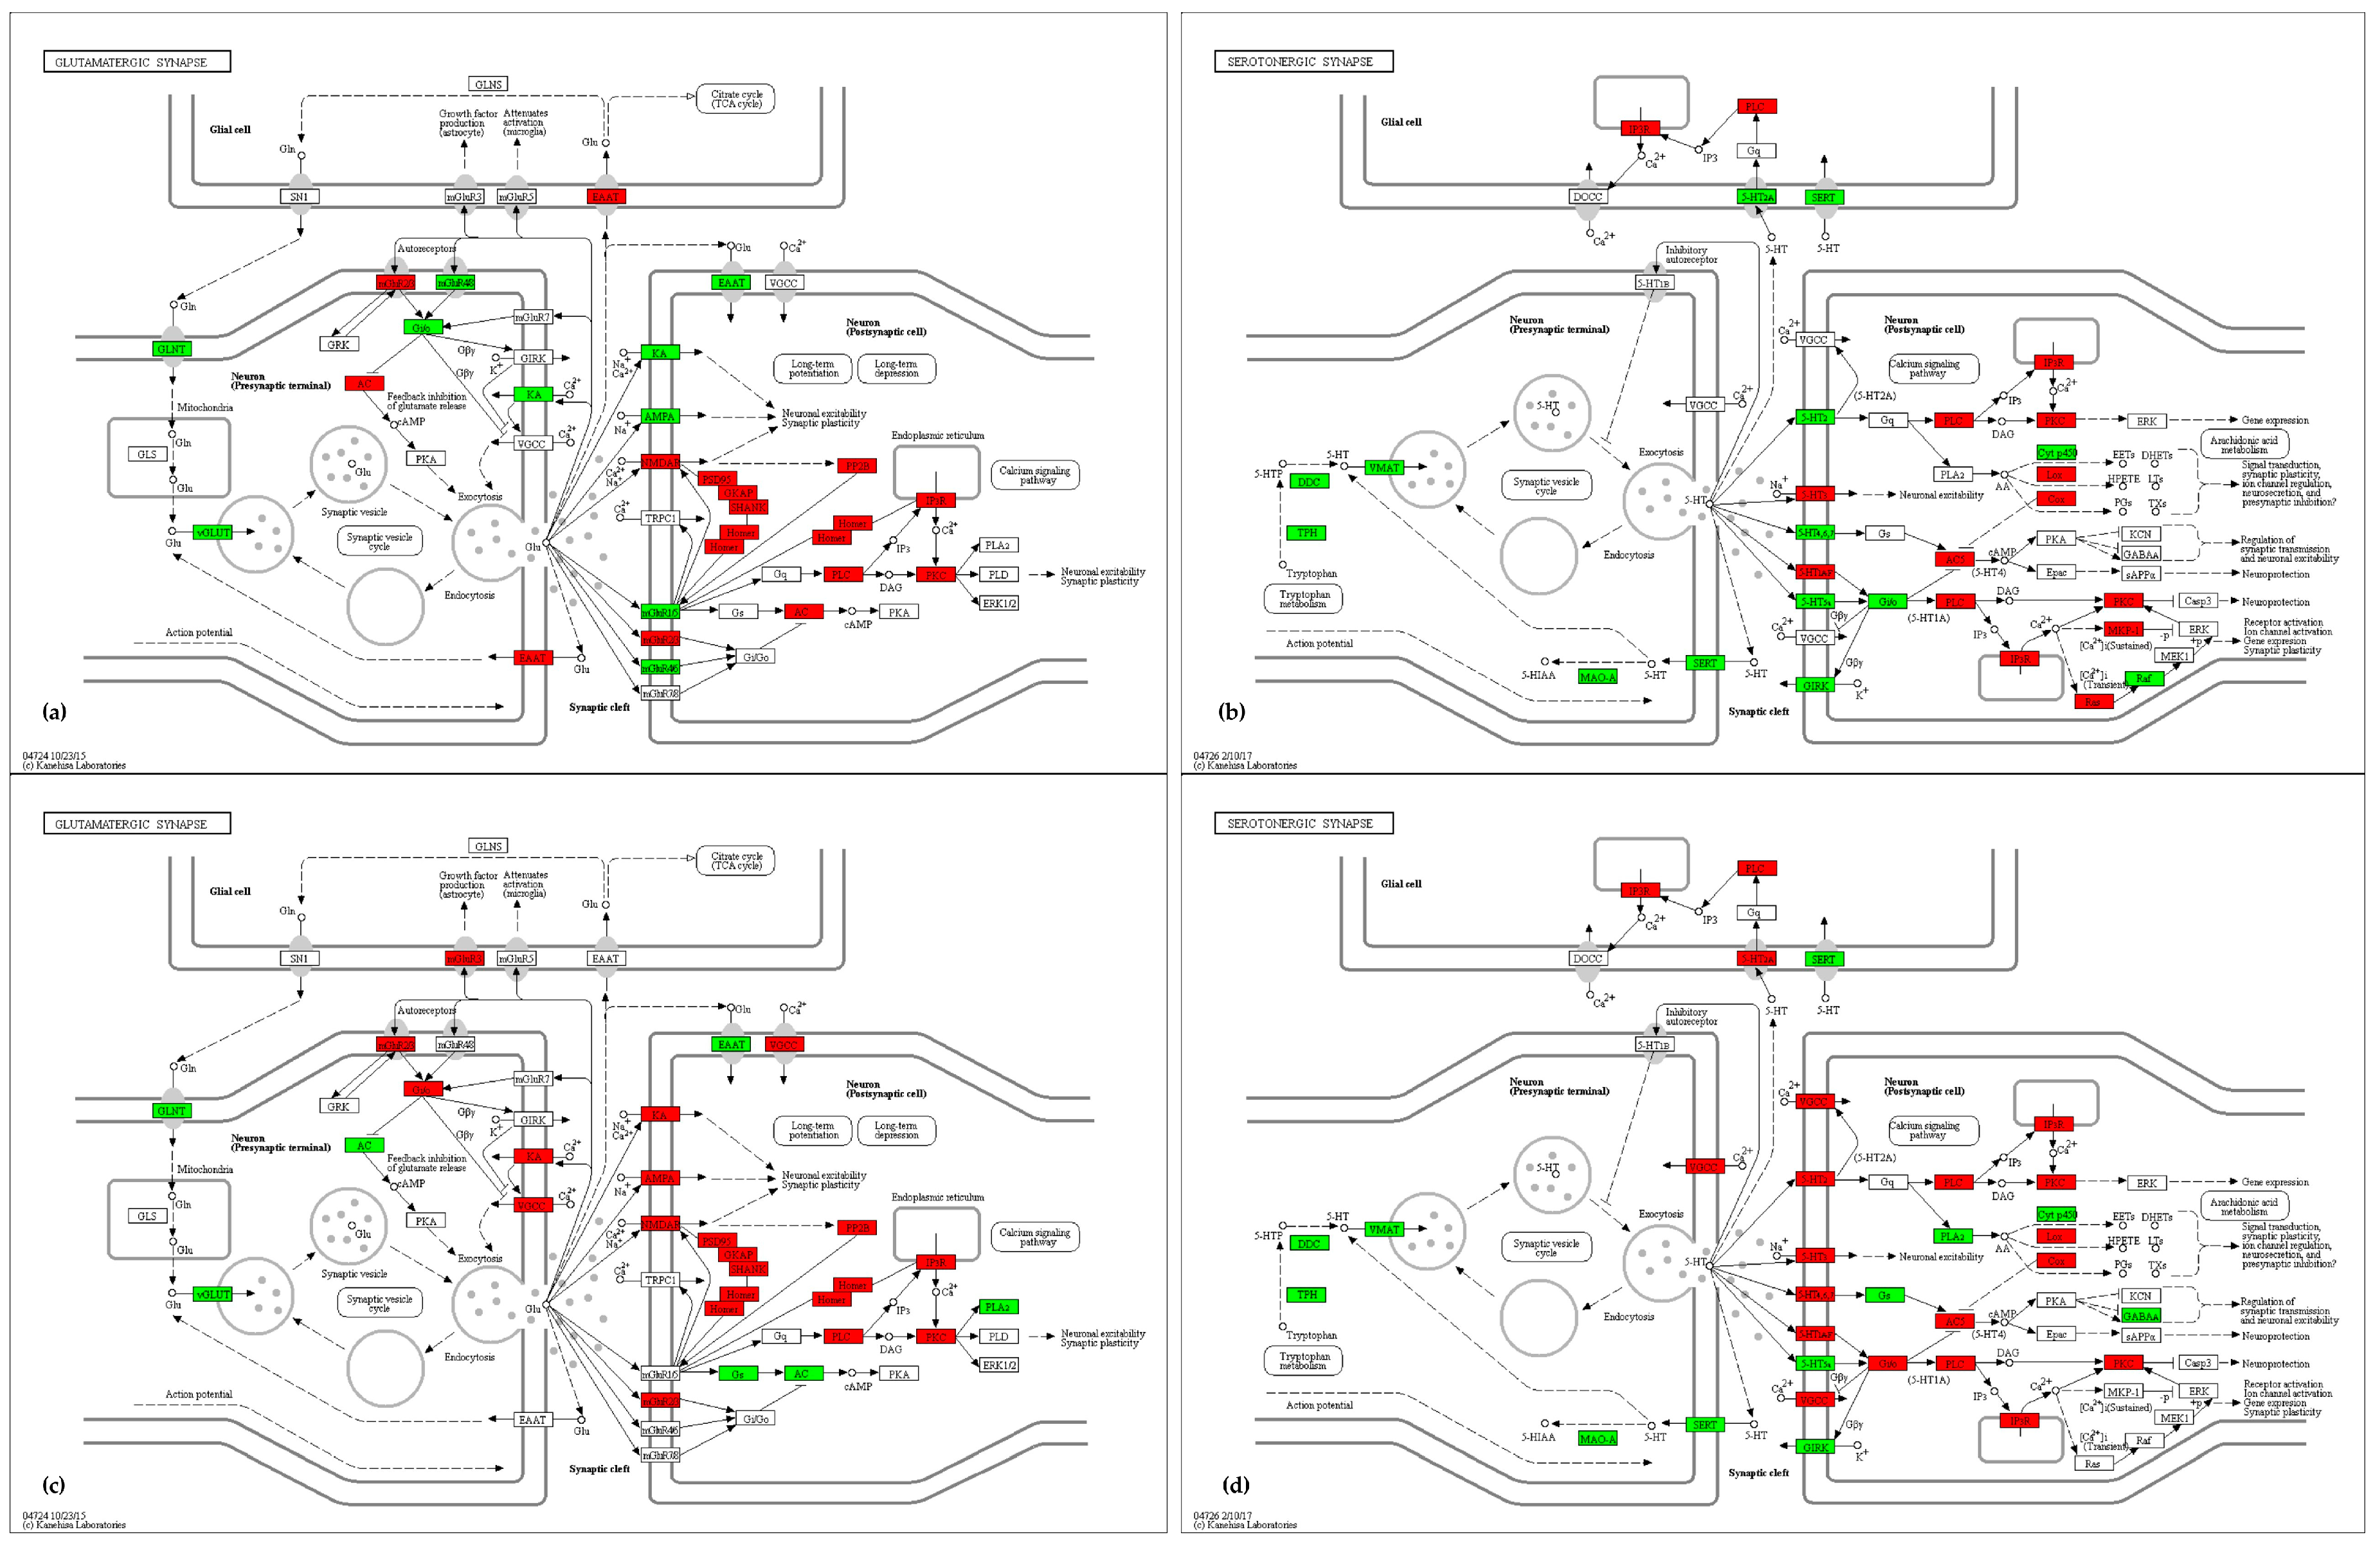
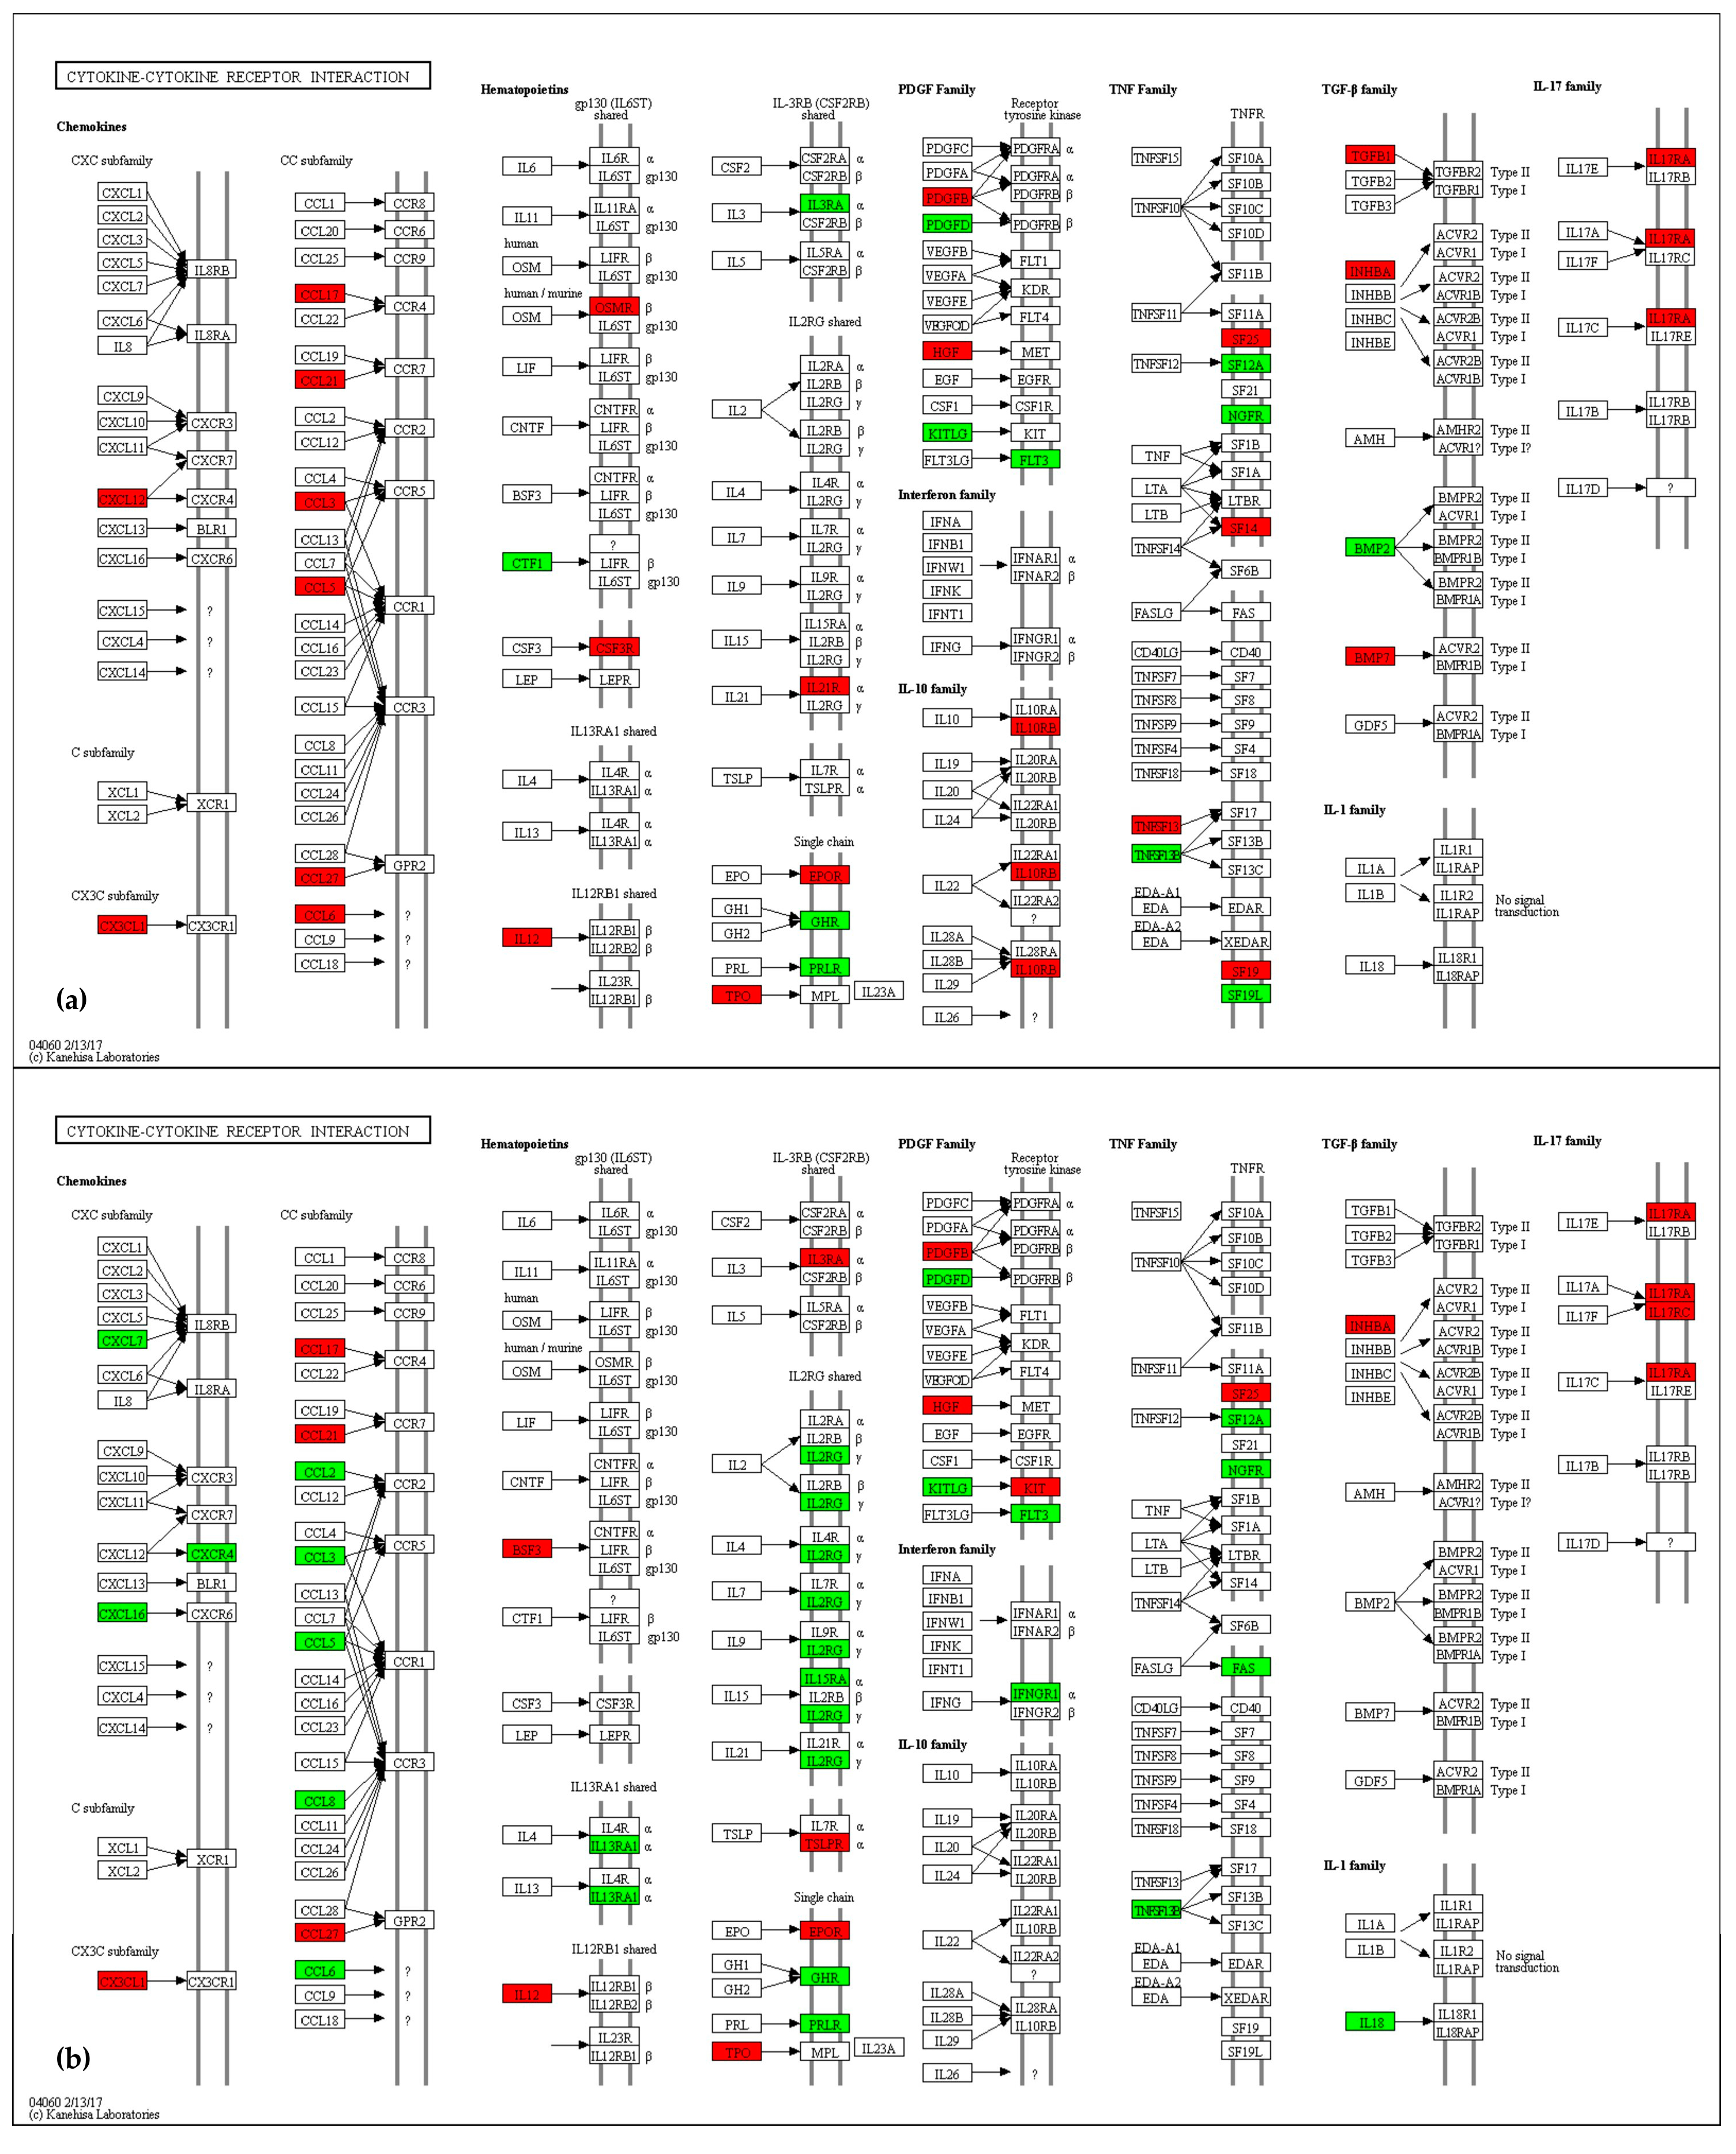
2.4.2. Synapse and Neuroactive Ligand–Receptor Interaction
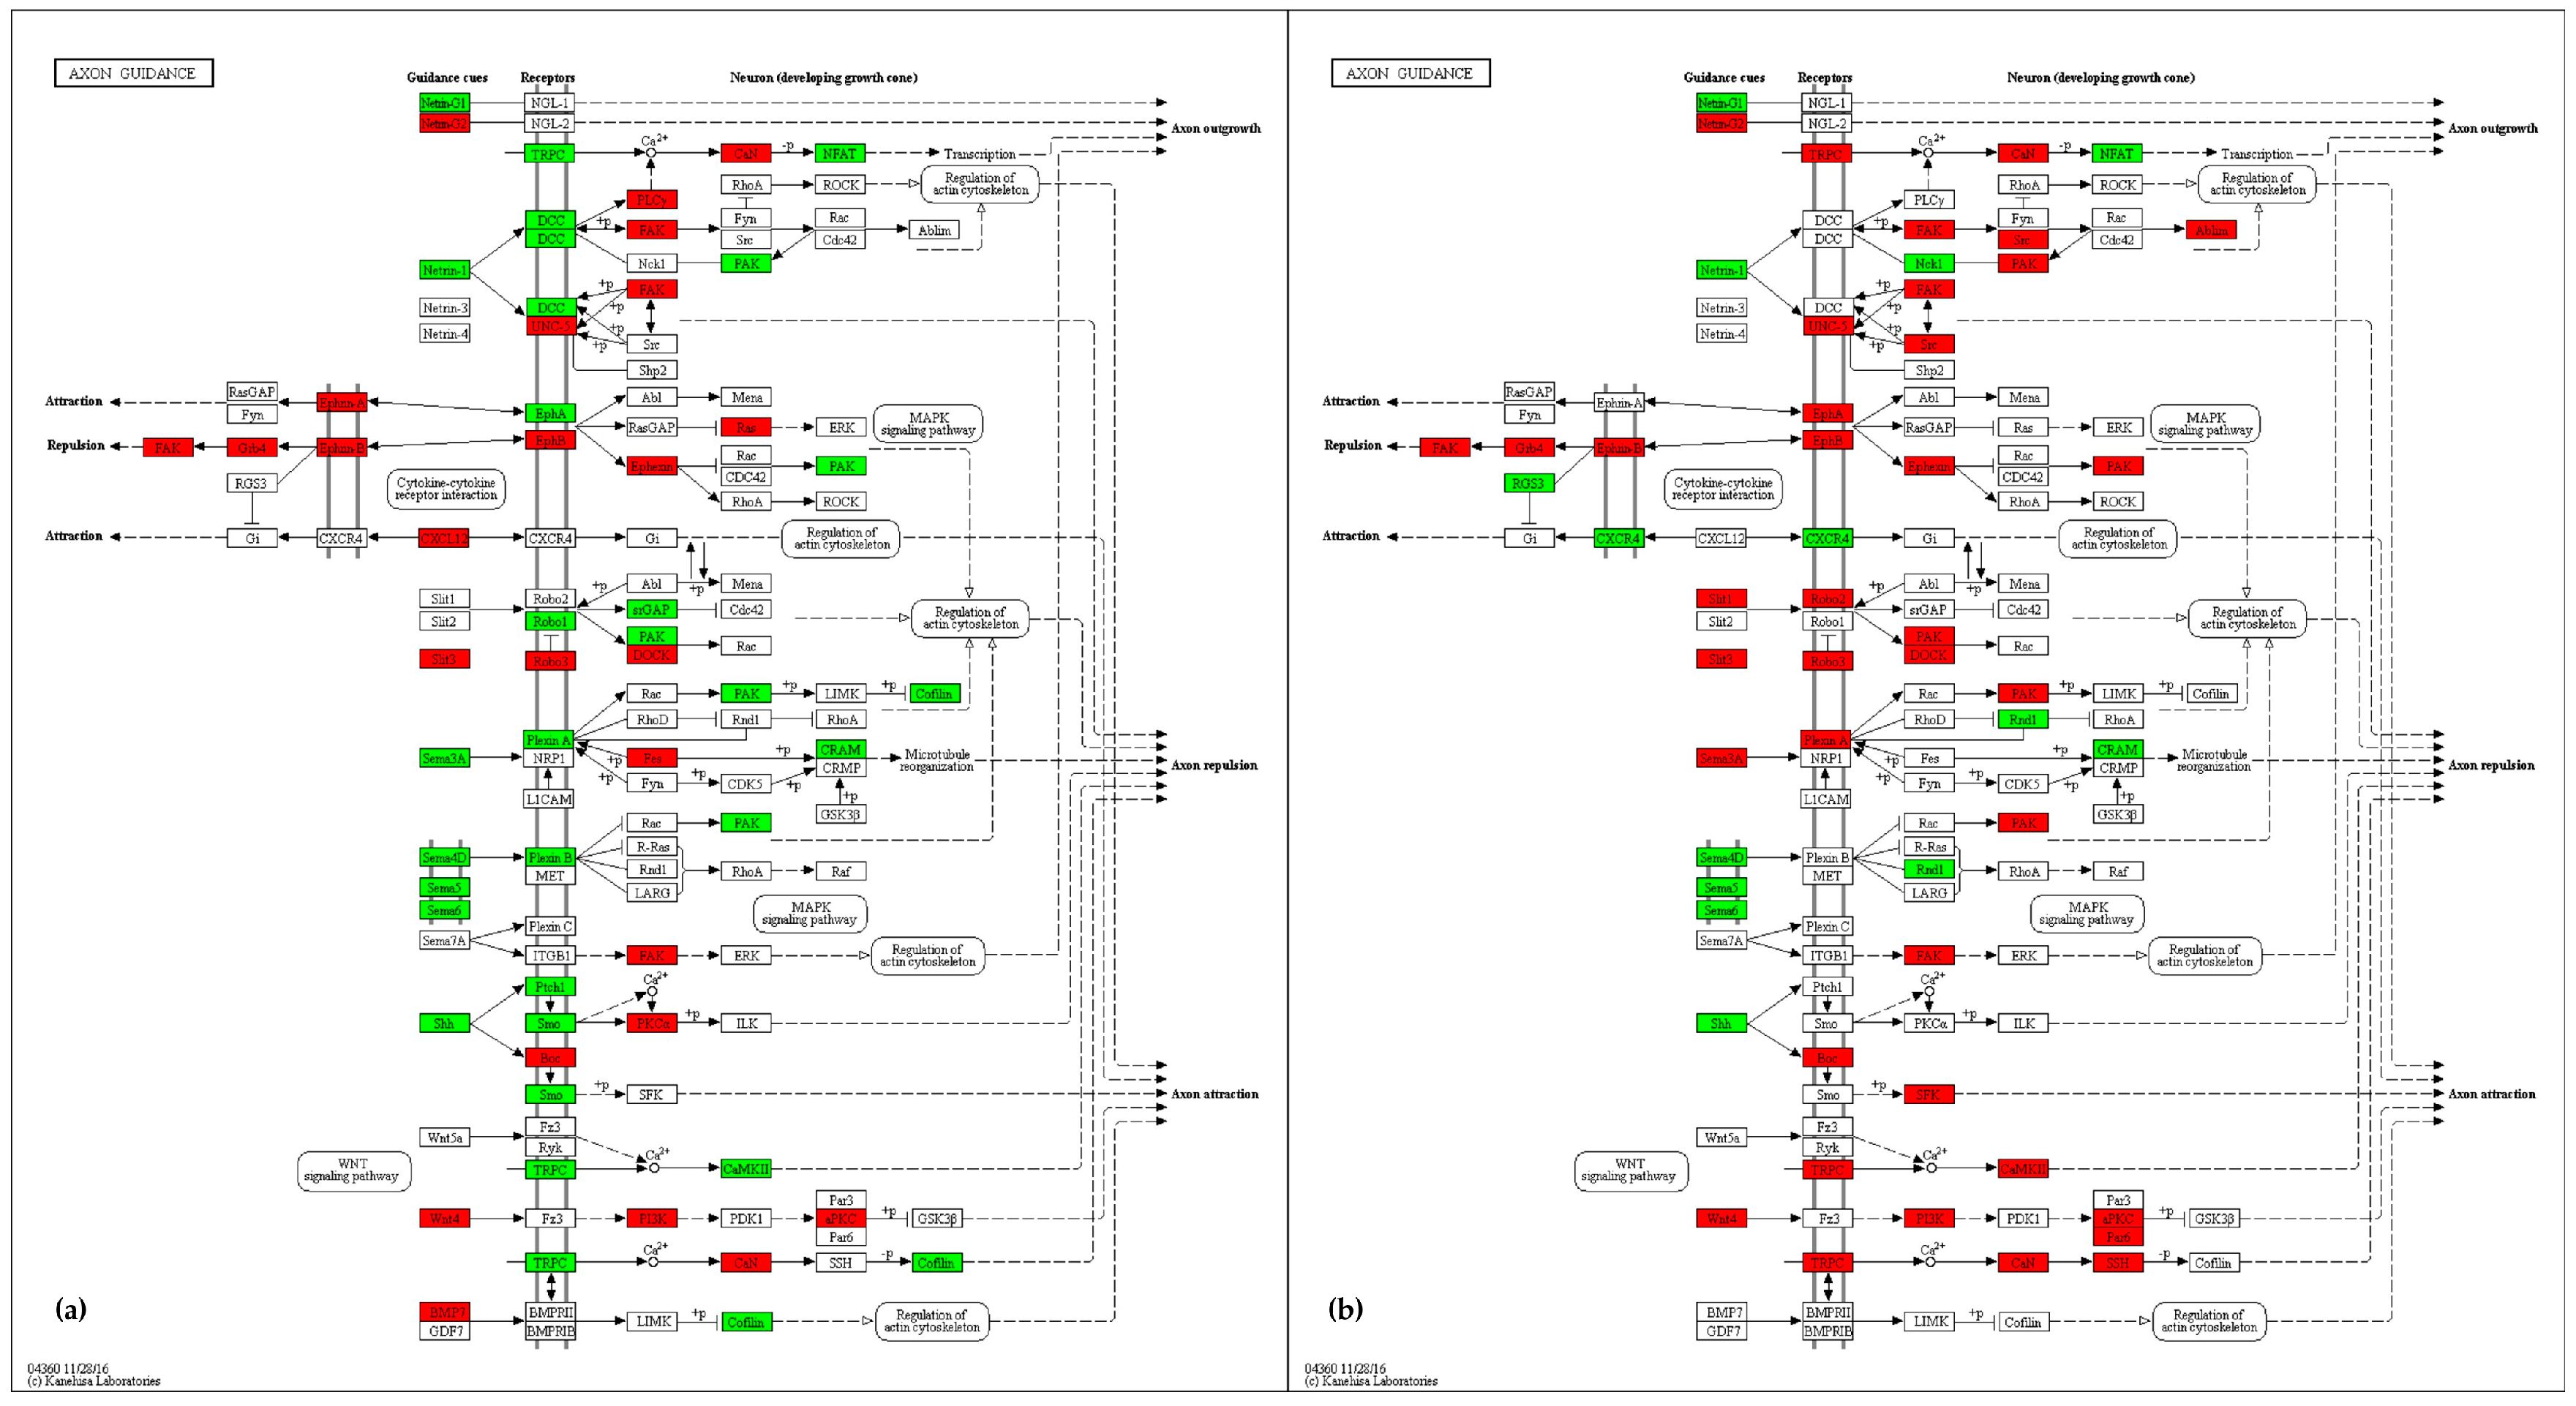
2.4.3. Axon Guidance
2.4.4. Circadian Rhythm and Entrainment
2.4.5. Regulation of Actin Cytoskeleton
2.4.6. Wnt Signaling
2.4.7. Autophagy and Coordinated Lysosomal Expression and Regulation (CLEAR) Network
2.4.8. Immune and Inflammatory Systems
2.4.9. Oxidative Stress
2.4.10. Mitochondria
2.4.11. Neurodegenerative Disorders
3. Discussion
3.1. Calcium Homeostasis
3.2. Synapse and Neuroactive Ligand—Receptor Interaction
3.3. Axon Guidance
3.4. Circadian Rhythm and Entrainment
3.5. Regulation of Actin Cytoskeleton
3.6. Wnt Signaling
3.7. Autophagy and CLEAR Network
3.8. Immune and Inflammatory Systems
3.9. Oxidative Stress
3.10. Mitochondria
3.11. Neurodegenerative Disorders
4. Materials and Methods
4.1. Mice
4.2. Preparation of Brain Tissue Samples
4.3. Total RNA Extraction and mRNA Purification
4.4. SOLiD Sequencing and Sequence Analysis
4.5. Alignment and Identification of Differentially Expressed Genes
4.6. Gene Ontology and Pathway Analysis
4.7. Data Deposition
5. Conclusions
Supplementary Materials
Acknowledgments
Author Contributions
Conflicts of Interest
References
- Muenzer, J.; Beck, M.; Eng, C.M.; Escolar, M.L.; Giugliani, R.; Guffon, N.H.; Harmatz, P.; Kamin, W.; Kampmann, C.; Koseoglu, S.T.; et al. Multidisciplinary management of Hunter syndrome. Pediatrics 2009, 124, e1228–e1239. [Google Scholar] [CrossRef] [PubMed]
- Perera, R.M.; Zoncu, R. The lysosome as a regulatory hub. Annu. Rev. Cell Dev. Biol. 2016, 32, 223–253. [Google Scholar] [CrossRef] [PubMed]
- Garcia, A.R.; Pan, J.; Lamsa, J.C.; Muenzer, J. The characterization of a murine model of mucopolysaccharidosis II (Hunter syndrome). J. Inherit. Metab. Dis. 2007, 30, 924–934. [Google Scholar] [CrossRef] [PubMed]
- Dufresne, M.; Guneysu, D.; Patterson, N.H.; Marcinkiewicz, M.M.; Regina, A.; Demeule, M.; Chaurand, P. Multimodal detection of GM2 and GM3 lipid species in the brain of mucopolysaccharidosis type II mouse by serial imaging mass spectrometry and immunohistochemistry. Anal. Bioanal. Chem. 2017, 409, 1425–1433. [Google Scholar] [CrossRef] [PubMed]
- Polito, V.A.; Cosma, M.P. IDS crossing of the blood-brain barrier corrects CNS defects in MPS II mice. Am. J. Hum. Genet. 2009, 85, 296–301. [Google Scholar] [CrossRef] [PubMed]
- Ohmi, K.; Greenberg, D.S.; Rajavel, K.S.; Ryazantsev, S.; Li, H.H.; Neufeld, E.F. Activated microglia in cortex of mouse models of mucopolysaccharidoses I and IIIB. Proc. Natl. Acad. Sci. USA 2003, 100, 1902–1907. [Google Scholar] [CrossRef] [PubMed]
- Baldo, G.; Lorenzini, D.M.; Santos, D.S.; Mayer, F.Q.; Vitry, S.; Bigou, S.; Heard, J.M.; Matte, U.; Giugliani, R. Shotgun proteomics reveals possible mechanisms for cognitive impairment in Mucopolysaccharidosis I mice. Mol. Genet. Metab. 2015, 114, 138–145. [Google Scholar] [CrossRef] [PubMed]
- Parente, M.K.; Rozen, R.; Cearley, C.N.; Wolfe, J.H. Dysregulation of gene expression in a lysosomal storage disease varies between brain regions implicating unexpected mechanisms of neuropathology. PLoS ONE 2012, 7, e32419. [Google Scholar] [CrossRef] [PubMed]
- Parente, M.K.; Rozen, R.; Seeholzer, S.H.; Wolfe, J.H. Integrated analysis of proteome and transcriptome changes in the mucopolysaccharidosis type VII mouse hippocampus. Mol. Genet. Metab. 2016, 118, 41–54. [Google Scholar] [CrossRef] [PubMed]
- DAVID Bioinformatics Resources 6.8. Available online: https://david.ncifcrf.gov (accessed on 6 February 2017).
- KOBAS 3.0. Available online: http://kobas.cbi.pku.edu.cn/ (accessed on 20 February 2017).
- Palmieri, M.; Impey, S.; Kang, H.; di Ronza, A.; Pelz, C.; Sardiello, M.; Ballabio, A. Characterization of the CLEAR network reveals an integrated control of cellular clearance pathways. Hum. Mol. Genet. 2011, 20, 3852–3866. [Google Scholar] [CrossRef] [PubMed]
- Cahoy, J.; Emery, B.; Kaushal, A.; Foo, L.; Zamanian, J.; Christopherson, K.; Xing, Y.; Lubischer, J.; Krieg, P.; Krupenko, S.; et al. A transcriptome database for astrocytes, neurons, and oligodendrocytes: A new resource for understanding brain development and function. J. Neurosci. 2008, 28, 264–278. [Google Scholar] [CrossRef] [PubMed]
- Sofroniew, M. Molecular dissection of reactive astrogliosis and glial scar formation. Trends Neurosci. 2009, 32, 638–647. [Google Scholar] [CrossRef] [PubMed]
- Kang, W.; Hébert, J. Signaling pathways in reactive astrocytes, a genetic perspective. Mol. Neurobiol. 2011, 43, 147–154. [Google Scholar] [CrossRef] [PubMed]
- Breedlove, S.M.; Watson, N.V.; Rosenzweig, M.R. Biological Psychology: An Introduction to Behavioral, Cognitive, and Clinical Neuroscience; Sinauer Associates, Incorporated Publishers: Sunderland, MA, USA, 2010. [Google Scholar]
- Jellinger, K.A. Recent advances in our understanding of neurodegeneration. J. Neural Transm. 2009, 116, 1111–1162. [Google Scholar] [CrossRef] [PubMed]
- Bashaw, G.J.; Klein, R. Signaling from axon guidance receptors. Cold Spring Harb Perspect. Biol. 2010, 2, a001941. [Google Scholar] [CrossRef] [PubMed]
- Lloyd-Evans, E.; Platt, F.M. Lysosomal Ca2+ homeostasis: Role in pathogenesis of lysosomal storage diseases. Cell Calcium 2011, 50, 200–205. [Google Scholar] [CrossRef] [PubMed]
- Pelled, D.; Lloyd-Evans, E.; Riebeling, C.; Jeyakumar, M.; Platt, F.M.; Futerman, A.H. Inhibition of calcium uptake via the sarco/endoplasmic reticulum Ca2+-ATPase in a mouse model of Sandhoff disease and prevention by treatment with N-butyldeoxynojirimycin. J. Biol. Chem. 2003, 278, 29496–29501. [Google Scholar] [CrossRef] [PubMed]
- Ginzburg, L.; Futerman, A.H. Defective calcium homeostasis in the cerebellum in a mouse model of Niemann-Pick A disease. J. Neurochem. 2005, 95, 1619–1628. [Google Scholar] [CrossRef] [PubMed]
- Pelled, D.; Trajkovic-Bodennec, S.; Lloyd-Evans, E.; Sidransky, E.; Schiffmann, R.; Futerman, A.H. Enhanced calcium release in the acute neuronopathic form of Gaucher disease. Neurobiol. Dis. 2005, 18, 83–88. [Google Scholar] [CrossRef] [PubMed]
- Bezprozvanny, I.; Hiesinger, P.R. The synaptic maintenance problem: Membrane recycling, Ca2+ homeostasis and late onset degeneration. Mol. Neurodegener. 2013, 8, 23. [Google Scholar] [CrossRef] [PubMed]
- Frank, M.G.; Cantera, R. Sleep, clocks, and synaptic plasticity. Trends Neurosci. 2014, 37, 491–501. [Google Scholar] [CrossRef] [PubMed]
- Amorim, I.S.; Mitchell, N.L.; Palmer, D.N.; Sawiak, S.J.; Mason, R.; Wishart, T.M.; Gillingwater, T.H. Molecular neuropathology of the synapse in sheep with CLN5 Batten disease. Brain Behav. 2015, 5, e00401. [Google Scholar] [CrossRef] [PubMed]
- Cantuti-Castelvetri, L.; Bongarzone, E.R. Synaptic failure: The achilles tendon of sphingolipidoses. J. Neurosci. Res. 2016, 94, 1031–1036. [Google Scholar] [CrossRef] [PubMed]
- Xu, S.; Zhou, S.; Xia, D.; Xia, J.; Chen, G.; Duan, S.; Luo, J. Defects of synaptic vesicle turnover at excitatory and inhibitory synapses in Niemann-Pick C1-deficient neurons. Neuroscience 2010, 167, 608–620. [Google Scholar] [CrossRef] [PubMed]
- Sambri, I.; D’Alessio, R.; Ezhova, Y.; Giuliano, T.; Sorrentino, N.C.; Cacace, V.; de Risi, M.; Cataldi, M.; Annunziato, L.; de Leonibus, E.; et al. Lysosomal dysfunction disrupts presynaptic maintenance and restoration of presynaptic function prevents neurodegeneration in lysosomal storage diseases. EMBO Mol. Med. 2017, 9, 112–132. [Google Scholar] [CrossRef] [PubMed]
- Agostinho, P.; Cunha, R.A.; Oliveira, C. Neuroinflammation, oxidative stress and the pathogenesis of Alzheimer’s disease. Curr. Pharm. Des. 2010, 16, 2766–2778. [Google Scholar] [CrossRef] [PubMed]
- Chu-LaGraff, Q.; Blanchette, C.; O’Hern, P.; Denefrio, C. The Batten disease Palmitoyl Protein Thioesterase 1 gene regulates neural specification and axon connectivity during Drosophila embryonic development. PLoS ONE 2010, 5, e14402. [Google Scholar] [CrossRef] [PubMed]
- Tikka, S.; Monogioudi, E.; Gotsopoulos, A.; Soliymani, R.; Pezzini, F.; Scifo, E.; Uusi-Rauva, K.; Tyynela, J.; Baumann, M.; Jalanko, A.; et al. Proteomic profiling in the brain of CLN1 disease model reveals affected functional modules. Neuromolecular Med. 2016, 18, 109–133. [Google Scholar] [CrossRef] [PubMed]
- Lai Wing Sun, K.; Correia, J.P.; Kennedy, T.E. Netrins: Versatile extracellular cues with diverse functions. Development 2011, 138, 2153–2169. [Google Scholar] [PubMed]
- Jordan, M.C.; Zheng, Y.; Ryazantsev, S.; Rozengurt, N.; Roos, K.P.; Neufeld, E.F. Cardiac manifestations in the mouse model of mucopolysaccharidosis I. Mol. Genet. Metab. 2005, 86, 233–243. [Google Scholar] [CrossRef] [PubMed]
- Guerrero, J.M.; Pozo, D.; Diaz-Rodriguez, J.L.; Martinez-Cruz, F.; Vela-Campos, F. Impairment of the melatonin rhythm in children with Sanfilippo syndrome. J. Pineal Res. 2006, 40, 192–193. [Google Scholar] [CrossRef] [PubMed]
- Heldermon, C.D.; Hennig, A.K.; Ohlemiller, K.K.; Ogilvie, J.M.; Herzog, E.D.; Breidenbach, A.; Vogler, C.; Wozniak, D.F.; Sands, M.S. Development of sensory, motor and behavioral deficits in the murine model of Sanfilippo syndrome type B. PLoS ONE 2007, 2, e772. [Google Scholar] [CrossRef] [PubMed]
- Canal, M.M.; Wilkinson, F.L.; Cooper, J.D.; Wraith, J.E.; Wynn, R.; Bigger, B.W. Circadian rhythm and suprachiasmatic nucleus alterations in the mouse model of mucopolysaccharidosis IIIB. Behav. Brain Res. 2010, 209, 212–220. [Google Scholar] [CrossRef] [PubMed]
- Richardson, K.; Livieratos, A.; Dumbill, R.; Hughes, S.; Ang, G.; Smith, D.A.; Morris, L.; Brown, L.A.; Peirson, S.N.; Platt, F.M.; et al. Circadian profiling in two mouse models of lysosomal storage disorders; Niemann Pick type-C and Sandhoff disease. Behav. Brain Res. 2016, 297, 213–223. [Google Scholar] [CrossRef] [PubMed]
- Mazzoccoli, G.; Tomanin, R.; Mazza, T.; D’Avanzo, F.; Salvalaio, M.; Rigon, L.; Zanetti, A.; Pazienza, V.; Francavilla, M.; Giuliani, F.; et al. Circadian transcriptome analysis in human fibroblasts from Hunter syndrome and impact of iduronate-2-sulfatase treatment. BMC Med. Genom. 2013, 6, 37. [Google Scholar] [CrossRef] [PubMed]
- Ba, W.; van der Raadt, J.; Nadif Kasri, N. Rho GTPase signaling at the synapse: Implications for intellectual disability. Exp. Cell Res. 2013, 319, 2368–2374. [Google Scholar] [CrossRef] [PubMed]
- Bu, B.; Li, J.; Davies, P.; Vincent, I. Deregulation of cdk5, hyperphosphorylation, and cytoskeletal pathology in the Niemann-Pick type C murine model. J. Neurosci. 2002, 22, 6515–6525. [Google Scholar] [PubMed]
- Cantuti-Castelvetri, L.; Zhu, H.; Givogri, M.I.; Chidavaenzi, R.L.; Lopez-Rosas, A.; Bongarzone, E.R. Psychosine induces the dephosphorylation of neurofilaments by deregulation of PP1 and PP2A phosphatases. Neurobiol. Dis. 2012, 46, 325–335. [Google Scholar] [CrossRef] [PubMed]
- Falk, D.J.; Todd, A.G.; Lee, S.; Soustek, M.S.; ElMallah, M.K.; Fuller, D.D.; Notterpek, L.; Byrne, B.J. Peripheral nerve and neuromuscular junction pathology in Pompe disease. Hum. Mol. Genet. 2015, 24, 625–636. [Google Scholar] [CrossRef] [PubMed]
- Lambert, C.; Cisternas, P.; Inestrosa, N.C. Role of Wnt Signaling in central nervous system injury. Mol. Neurobiol. 2016, 53, 2297–2311. [Google Scholar] [CrossRef] [PubMed]
- Zancan, I.; Bellesso, S.; Costa, R.; Salvalaio, M.; Stroppiano, M.; Hammond, C.; Argenton, F.; Filocamo, M.; Moro, E. Glucocerebrosidase deficiency in zebrafish affects primary bone ossification through increased oxidative stress and reduced Wnt/β-catenin signaling. Hum. Mol. Genet. 2015, 24, 1280–1294. [Google Scholar] [CrossRef] [PubMed]
- Vallee, A.; Lecarpentier, Y. Alzheimer disease: Crosstalk between the canonical Wnt/β-catenin pathway and PPARs α and γ. Front. Neurosci. 2016, 10, 459. [Google Scholar] [CrossRef] [PubMed]
- Ballabio, A.; Gieselmann, V. Lysosomal disorders: From storage to cellular damage. Biochim. Biophys. Acta 2009, 1793, 684–696. [Google Scholar] [CrossRef] [PubMed]
- Lieberman, A.P.; Puertollano, R.; Raben, N.; Slaugenhaupt, S.; Walkley, S.U.; Ballabio, A. Autophagy in lysosomal storage disorders. Autophagy 2012, 8, 719–730. [Google Scholar] [CrossRef] [PubMed]
- He, C.; Klionsky, D.J. Regulation mechanisms and signaling pathways of autophagy. Annu. Rev. Genet. 2009, 43, 67–93. [Google Scholar] [CrossRef] [PubMed]
- Wong, E.; Cuervo, A.M. Autophagy gone awry in neurodegenerative diseases. Nat. Neurosci. 2010, 13, 805–811. [Google Scholar] [CrossRef] [PubMed]
- Rubinsztein, D.C. The roles of intracellular protein-degradation pathways in neurodegeneration. Nature 2006, 443, 780–786. [Google Scholar] [CrossRef] [PubMed]
- Dev, K.K.; Hofele, K.; Barbieri, S.; Buchman, V.L.; van der Putten, H. Part II: α-synuclein and its molecular pathophysiological role in neurodegenerative disease. Neuropharmacology 2003, 45, 14–44. [Google Scholar] [CrossRef]
- Bahr, B.A.; Bendiske, J. The neuropathogenic contributions of lysosomal dysfunction. J. Neurochem. 2002, 83, 481–489. [Google Scholar] [CrossRef] [PubMed]
- Archer, L.; Langford-Smith, K.; Bigger, B.; Fildes, J. Mucopolysaccharide diseases: A complex interplay between neuroinflammation, microglial activation and adaptive immunity. J. Inherit. Metab. Dis. 2014, 37, 1–12. [Google Scholar] [CrossRef] [PubMed]
- Ausseil, J.; Desmaris, N.; Bigou, S.; Attali, R.; Corbineau, S.; Vitry, S.; Parent, M.; Cheillan, D.; Fuller, M.; Maire, I.; et al. Early neurodegeneration progresses independently of microglial activation by heparan sulfate in the brain of mucopolysaccharidosis IIIB mice. PLoS ONE 2008, 3, e2296. [Google Scholar] [CrossRef] [PubMed]
- Wilkinson, F.L.; Holley, R.J.; Langford-Smith, K.J.; Badrinath, S.; Liao, A.; Langford-Smith, A.; Cooper, J.D.; Jones, S.A.; Wraith, J.E.; Wynn, R.F.; et al. Neuropathology in mouse models of mucopolysaccharidosis type I, IIIA and IIIB. PLoS ONE 2012, 7, e35787. [Google Scholar] [CrossRef] [PubMed]
- Vitner, E.B.; Futerman, A.H.; Platt, N. Innate immune responses in the brain of sphingolipid lysosomal storage diseases. Biol. Chem. 2015, 396, 659–667. [Google Scholar] [CrossRef] [PubMed]
- DiRosario, J.; Divers, E.; Wang, C.; Etter, J.; Charrier, A.; Jukkola, P.; Auer, H.; Best, V.; Newsom, D.L.; McCarty, D.M.; et al. Innate and adaptive immune activation in the brain of MPS IIIB mouse model. J. Neurosci. Res. 2009, 87, 978–990. [Google Scholar] [CrossRef] [PubMed]
- Vitner, E.B.; Platt, F.M.; Futerman, A.H. Common and uncommon pathogenic cascades in lysosomal storage diseases. J. Biol. Chem. 2010, 285, 20423–20427. [Google Scholar] [CrossRef] [PubMed]
- Zalfa, C.; Verpelli, C.; D’Avanzo, F.; Tomanin, R.; Vicidomini, C.; Cajola, L.; Manara, R.; Sala, C.; Scarpa, M.; Vescovi, A.L.; et al. Glial degeneration with oxidative damage drives neuronal demise in MPSII disease. Cell Death Dis. 2016, 7, e2331. [Google Scholar] [CrossRef] [PubMed]
- Filippon, L.; Vanzin, C.S.; Biancini, G.B.; Pereira, I.N.; Manfredini, V.; Sitta, A.; Peralba Mdo, C.; Schwartz, I.V.; Giugliani, R.; Vargas, C.R. Oxidative stress in patients with mucopolysaccharidosis type II before and during enzyme replacement therapy. Mol. Genet. Metab. 2011, 103, 121–127. [Google Scholar] [CrossRef] [PubMed]
- Filippon, L.; Wayhs, C.A.; Atik, D.M.; Manfredini, V.; Herber, S.; Carvalho, C.G.; Schwartz, I.V.; Giugliani, R.; Vargas, C.R. DNA damage in leukocytes from pretreatment mucopolysaccharidosis type II patients; protective effect of enzyme replacement therapy. Mutat. Res. 2011, 721, 206–210. [Google Scholar] [CrossRef] [PubMed]
- Plotegher, N.; Duchen, M.R. Mitochondrial dysfunction and neurodegeneration in lysosomal storage disorders. Trends Mol. Med. 2017, 23, 116–134. [Google Scholar] [CrossRef] [PubMed]
- Lloyd-Evans, E.; Haslett, L.J. The lysosomal storage disease continuum with ageing-related neurodegenerative disease. Ageing Res. Rev. 2016, 32, 104–121. [Google Scholar] [CrossRef] [PubMed]
- Deng, H.; Xiu, X.; Jankovic, J. Genetic convergence of Parkinson’s disease and lysosomal storage disorders. Mol. Neurobiol. 2015, 51, 1554–1568. [Google Scholar] [CrossRef] [PubMed]
- Malnar, M.; Hecimovic, S.; Mattsson, N.; Zetterberg, H. Bidirectional links between Alzheimer’s disease and Niemann-Pick type C disease. Neurobiol. Dis. 2014, 72, 37–47. [Google Scholar] [CrossRef] [PubMed]
- Cardone, M.; Polito, V.A.; Pepe, S.; Mann, L.; D’Azzo, A.; Auricchio, A.; Ballabio, A.; Cosma, M.P. Correction of Hunter syndrome in the MPSII mouse model by AAV2/8-mediated gene delivery. Hum. Mol. Genet. 2006, 15, 1225–1236. [Google Scholar] [CrossRef] [PubMed]
- Friso, A.; Tomanin, R.; Salvalaio, M.; Scarpa, M. Genistein reduces glycosaminoglycan levels in a mouse model of mucopolysaccharidosis type II. Br. J. Pharmacol. 2010, 159, 1082–1091. [Google Scholar] [CrossRef] [PubMed]
- Polito, V.A.; Abbondante, S.; Polishchuk, R.S.; Nusco, E.; Salvia, R.; Cosma, M.P. Correction of CNS defects in the MPS II mouse model via systemic enzyme replacement therapy. Hum. Mol. Genet. 2010, 19, 4871–4885. [Google Scholar] [CrossRef] [PubMed]
- Fusar Poli, E.; Zalfa, C.; D’Avanzo, F.; Tomanin, R.; Carlessi, L.; Bossi, M.; Nodari, L.R.; Binda, E.; Marmiroli, P.; Scarpa, M.; et al. Murine neural stem cells model Hunter disease in vitro: Glial cell-mediated neurodegeneration as a possible mechanism involved. Cell Death Dis. 2013, 4, e906. [Google Scholar] [CrossRef] [PubMed]
- Akiyama, K.; Shimada, Y.; Higuchi, T.; Ohtsu, M.; Nakauchi, H.; Kobayashi, H.; Fukuda, T.; Ida, H.; Eto, Y.; Crawford, B.E.; et al. Enzyme augmentation therapy enhances the therapeutic efficacy of bone marrow transplantation in mucopolysaccharidosis type II mice. Mol. Genet. Metab. 2014, 111, 139–146. [Google Scholar] [CrossRef] [PubMed]
- Gleitz, H.F.; O’Leary, C.; Holley, R.J.; Bigger, B.W. Identification of age-dependent motor and neuropsychological behavioural abnormalities in a mouse model of Mucopolysaccharidosis Type II. PLoS ONE 2017, 12, e0172435. [Google Scholar] [CrossRef] [PubMed]
- Campagna, D.; Albiero, A.; Bilardi, A.; Caniato, E.; Forcato, C.; Manavski, S.; Vitulo, N.; Valle, G. PASS: A program to align short sequences. Bioinformatics 2009, 25, 967–968. [Google Scholar] [CrossRef] [PubMed]
- Campagna, D.; Albiero, A.; Bilardi, A.; Caniato, E.; Forcato, C.; Manavski, S.; Vitulo, N.; Valle, G. PASS: A Program to Align Short Sequences. Available online: http://pass.cribi.unipd.it (accessed on 6 February 2017).
- Wang, L.; Feng, Z.; Wang, X.; Wang, X.; Zhang, X. DEGseq: An R package for identifying differentially expressed genes from RNA-seq data. Bioinformatics 2010, 26, 136–138. [Google Scholar] [CrossRef] [PubMed]
- DEGseq: Identify Differentially Expressed Genes from RNA-seq Data. Available online: https://www.bioconductor.org/packages/DEGseq/ (accessed on 6 February 2017).
- Huang da, W.; Sherman, B.T.; Lempicki, R.A. Bioinformatics enrichment tools: Paths toward the comprehensive functional analysis of large gene lists. Nucleic Acids Res. 2009, 37, 1–13. [Google Scholar] [CrossRef] [PubMed]
- Wu, J.; Mao, X.; Cai, T.; Luo, J.; Wei, L. KOBAS server: A web-based platform for automated annotation and pathway identification. Nucleic Acids Res. 2006, 34, W720–W724. [Google Scholar] [CrossRef] [PubMed]
- Kanehisa, M.; Furumichi, M.; Tanabe, M.; Sato, Y.; Morishima, K. KEGG: New perspectives on genomes, pathways, diseases and drugs. Nucleic Acids Res. 2017, 45, D353–D361. [Google Scholar] [CrossRef] [PubMed]
- KEGG Mapper—Search & Color Pathway. Available online: http://www.kegg.jp/kegg/tool/map_pathway2.html (accessed on 9 February 2017).
- Roberts, J.; Stewart, C.; Kearney, S. Management of the behavioural manifestations of Hunter syndrome. Br. J. Nurs. 2016, 25, 22, 24, 26–30. [Google Scholar] [CrossRef] [PubMed]


| Sample ID | Number of Raw Reads | Number of Pcq Reads | Pcq Reads/Raw Reads (%) | Number of Aligned Pcq Reads | Aligned Reads/Pcq Reads (%) |
|---|---|---|---|---|---|
| CxH | 98,434,960 | 56,388,301 | 57.28 | 38,502,647 | 68.28 |
| MH | 98,716,308 | 56,155,432 | 56.89 | 37,363,194 | 66.54 |
| CxWT | 88,183,367 | 52,388,424 | 59.41 | 33,617,996 | 64.17 |
| MWT | 87,079,859 | 45,727,298 | 52.51 | 28,945,731 | 63.30 |
| Pathway | MPS I | MPS III | MPS VII | ML IV | MSD | GM1 | GM2 | GAUCHER | KRABBE | FABRY | POMPE | NCL/CLN | NPC | OTHER LSDs |
|---|---|---|---|---|---|---|---|---|---|---|---|---|---|---|
| Calcium signaling | [19] | [20] | [22] | [19,21] | CHS [19] | |||||||||
| Synapse and neuroactive ligand–receptor interaction | [28] | [27] | Sphingolipidosis [25,26] | |||||||||||
| Axon Guidance | [8] | [31] | Batten [30] | |||||||||||
| Circadian rhythm and entrainment | [33] | [34,35,36] | [8] | [37] | [37] | |||||||||
| Regulation of actin cytoskeleton | [41] | [42] | [31] | [40] | ||||||||||
| Wnt Signaling | [44] | |||||||||||||
| Autophagy and CLEAR network | [47] | [47] | [47] | [47] | [47] | [47] | [47] | [47] | Danon, ML II, ML III, MPS VI [47] | |||||
| Immune and inflammatory system | [6,53,55] | [6,53,54,55,57] | [53] | [56] | [56] | [56] | ||||||||
| Oxidative stress | [53] | [53] | ||||||||||||
| Mitochondria | [62] | [62] | [62] | [62] | [62] | [62] | [62] | [62] | [62] | [62] | MPS IV [62] | |||
| Neurodegenerative disorders | [64] | [64] | [64] | [64] | [64] | [64,65] |
© 2017 by the authors. Licensee MDPI, Basel, Switzerland. This article is an open access article distributed under the terms and conditions of the Creative Commons Attribution (CC BY) license (http://creativecommons.org/licenses/by/4.0/).
Share and Cite
Salvalaio, M.; D’Avanzo, F.; Rigon, L.; Zanetti, A.; D’Angelo, M.; Valle, G.; Scarpa, M.; Tomanin, R. Brain RNA-Seq Profiling of the Mucopolysaccharidosis Type II Mouse Model. Int. J. Mol. Sci. 2017, 18, 1072. https://doi.org/10.3390/ijms18051072
Salvalaio M, D’Avanzo F, Rigon L, Zanetti A, D’Angelo M, Valle G, Scarpa M, Tomanin R. Brain RNA-Seq Profiling of the Mucopolysaccharidosis Type II Mouse Model. International Journal of Molecular Sciences. 2017; 18(5):1072. https://doi.org/10.3390/ijms18051072
Chicago/Turabian StyleSalvalaio, Marika, Francesca D’Avanzo, Laura Rigon, Alessandra Zanetti, Michela D’Angelo, Giorgio Valle, Maurizio Scarpa, and Rosella Tomanin. 2017. "Brain RNA-Seq Profiling of the Mucopolysaccharidosis Type II Mouse Model" International Journal of Molecular Sciences 18, no. 5: 1072. https://doi.org/10.3390/ijms18051072