Article

De Novo Assembly and Characterization of the Transcriptome of Grasshopper Shirakiacris shirakii

1
College of Life Sciences, Shaanxi Normal University, Xi’an 710062, China
2
College of Life Sciences and Food Engineering, Shaanxi Xueqian Normal University, Xi’an 710061, China
3
Key Laboratory for Space Bioscience & Biotechnology, School of Life Sciences, Northwestern Polytechnical University, Xi’an 710072, China
*
Author to whom correspondence should be addressed.
Int. J. Mol. Sci. 2016, 17(7), 1110; https://doi.org/10.3390/ijms17071110
Submission received: 3 April 2016 / Revised: 28 June 2016 / Accepted: 7 July 2016 / Published: 22 July 2016
(This article belongs to the Section Biochemistry)

Abstract

:
Background: The grasshopper Shirakiacris shirakii is an important agricultural pest and feeds mainly on gramineous plants, thereby causing economic damage to a wide range of crops. However, genomic information on this species is extremely limited thus far, and transcriptome data relevant to insecticide resistance and pest control are also not available. Methods: The transcriptome of S. shirakii was sequenced using the Illumina HiSeq platform, and we de novo assembled the transcriptome. Results: Its sequencing produced a total of 105,408,878 clean reads, and the de novo assembly revealed 74,657 unigenes with an average length of 680 bp and N50 of 1057 bp. A total of 28,173 unigenes were annotated for the NCBI non-redundant protein sequences (Nr), NCBI non-redundant nucleotide sequences (Nt), a manually-annotated and reviewed protein sequence database (Swiss-Prot), Gene Ontology (GO) and Kyoto Encyclopedia of Genes and Genomes (KEGG) databases. Based on the Nr annotation results, we manually identified 79 unigenes encoding cytochrome P450 monooxygenases (P450s), 36 unigenes encoding carboxylesterases (CarEs) and 36 unigenes encoding glutathione S-transferases (GSTs) in S. shirakii. Core RNAi components relevant to miroRNA, siRNA and piRNA pathways, including Pasha, Loquacious, Argonaute-1, Argonaute-2, Argonaute-3, Zucchini, Aubergine, enhanced RNAi-1 and Piwi, were expressed in S. shirakii. We also identified five unigenes that were homologous to the Sid-1 gene. In addition, the analysis of differential gene expressions revealed that a total of 19,764 unigenes were up-regulated and 4185 unigenes were down-regulated in larvae. In total, we predicted 7504 simple sequence repeats (SSRs) from 74,657 unigenes. Conclusions: The comprehensive de novo transcriptomic data of S. shirakii will offer a series of valuable molecular resources for better studying insecticide resistance, RNAi and molecular marker discovery in the transcriptome.

1. Introduction

Shirakiacris shirakii, which belongs to Orthoptera, Caelifera, Acridoidea and Catantopidae, is widely distributed and is an important agricultural pest. S. shirakii primarily feeds on the sap of gramineous plants, bringing about considerable damage to crops, particularly Gramineae, Leguminosae, and Compositae. Control strategies for this pest traditionally rely on broad spectrum insecticides and are often the cause of insecticide resistance. Due to a lack of genetic information, previous studies on S. shirakii mostly focused on its morphology and the basic biological and genetic characteristics, such as chromosome localization research based on fluorescence in situ hybridization (FISH) [1] and allozyme analysis [2]. Moreover, only small numbers of putative gene sequences for S. shirakii are available in GenBank, including 14 nucleotide sequences and 35 protein sequences (June 2016).
A large number of commercial insecticides are used worldwide [3]. However, frequent insecticide applications often induce tolerance through mutation by reducing the binding of the insecticide to its targets, the sequestration of insecticides and a reduced penetration of the insecticide. Insecticide resistance-related proteins include cytochrome P450 monooxygenases (P450s), carboxylesterases (CarEs) [4] and glutathione S-transferases (GSTs) [5]. RNAi is a widely-used and powerful biological tool for knocking down and analyzing the function of genes in many eukaryotic systems and is especially important in non-model organisms [6]. RNAi has been proposed to be a potential tool for crop protection against insect pests in agriculture [7,8]. This technique has been described in various insect orders, including Orthoptera [9,10,11], and T. castaneum was reported as a model organism for RNAi [12].
Recently, transcriptome sequencing has been widely used, especially in non-model organisms when genome information is not available [13]. By de novo transcriptome sequencing of S. shirakii, we sought to gain a preliminary understanding of mRNAs that might be associated with RNAi pathways, to provide useful information for grasshopper pest control and to obtain large amounts of sequence data that could be used to analyze the molecular mechanisms of insecticide resistance.
The standard experimental methods for simple sequence repeat (SSR) markers’ identification are time consuming and expensive. Transcriptome sequencing provides a good method to obtain SSRs. SSRs from numerous species have been obtained by transcriptome sequencing, given its high throughput [14,15]. In the present study, we identified the SSRs of S. shirakii.
Here, we report a de novo transcriptome of the grasshopper, S. shirakii, confirmed the suitability of the de novo assembly and compared the gene expression profiles between larvae and adults. These data enriched the transcriptome resources of Orthopteran insects and offered a valuable molecular resource for a better understanding of both S. shirakii insecticide resistance and RNAi machinery, as well as for facilitating molecular marker discovery.

2. Results

2.1. Transcriptome Assembly

After filtering low quality reads, a total of 105,408,878 clean reads was retained (Table 1) with 97.42% and 97.45% of the Q20 value in the two transcriptomes. A total of 135,320 contigs from the adult female sample with a mean contig size of 290 bp and N50 of 428 bp was produced by the Trinity software, as well as 187,282 contigs of the larval female sample with a mean contig size of 292 bp and N50 of 445 bp (Table 1). Then, the contigs were assembled into 93,948 unigenes for the larvae sample and 69,189 unigenes for the adult sample, respectively. The final assembly, which combined two transcriptomes, resulted in 74,657 unigenes, with an average length of 680 bp and N50 of 1057 bp (Table 1). These unigenes consist of 16,298 clusters and 58,359 singletons.
To demonstrate the accuracy of the unigenes, the submitted 14 nucleotide sequences of S. shirakii from GenBank were searched against transcriptome unigenes with BLASTN with an E-value of 10−5. The results showed that all of the sequences of S. shirakii in the NCBI database were represented in the transcriptome (Table S1). Analysis of the assembled unigenes using the BUSCO program identified 1388 of the 2675 core proteins (63%) as complete and a fragmented score of 14% (Table S2).

2.2. Functional Annotation
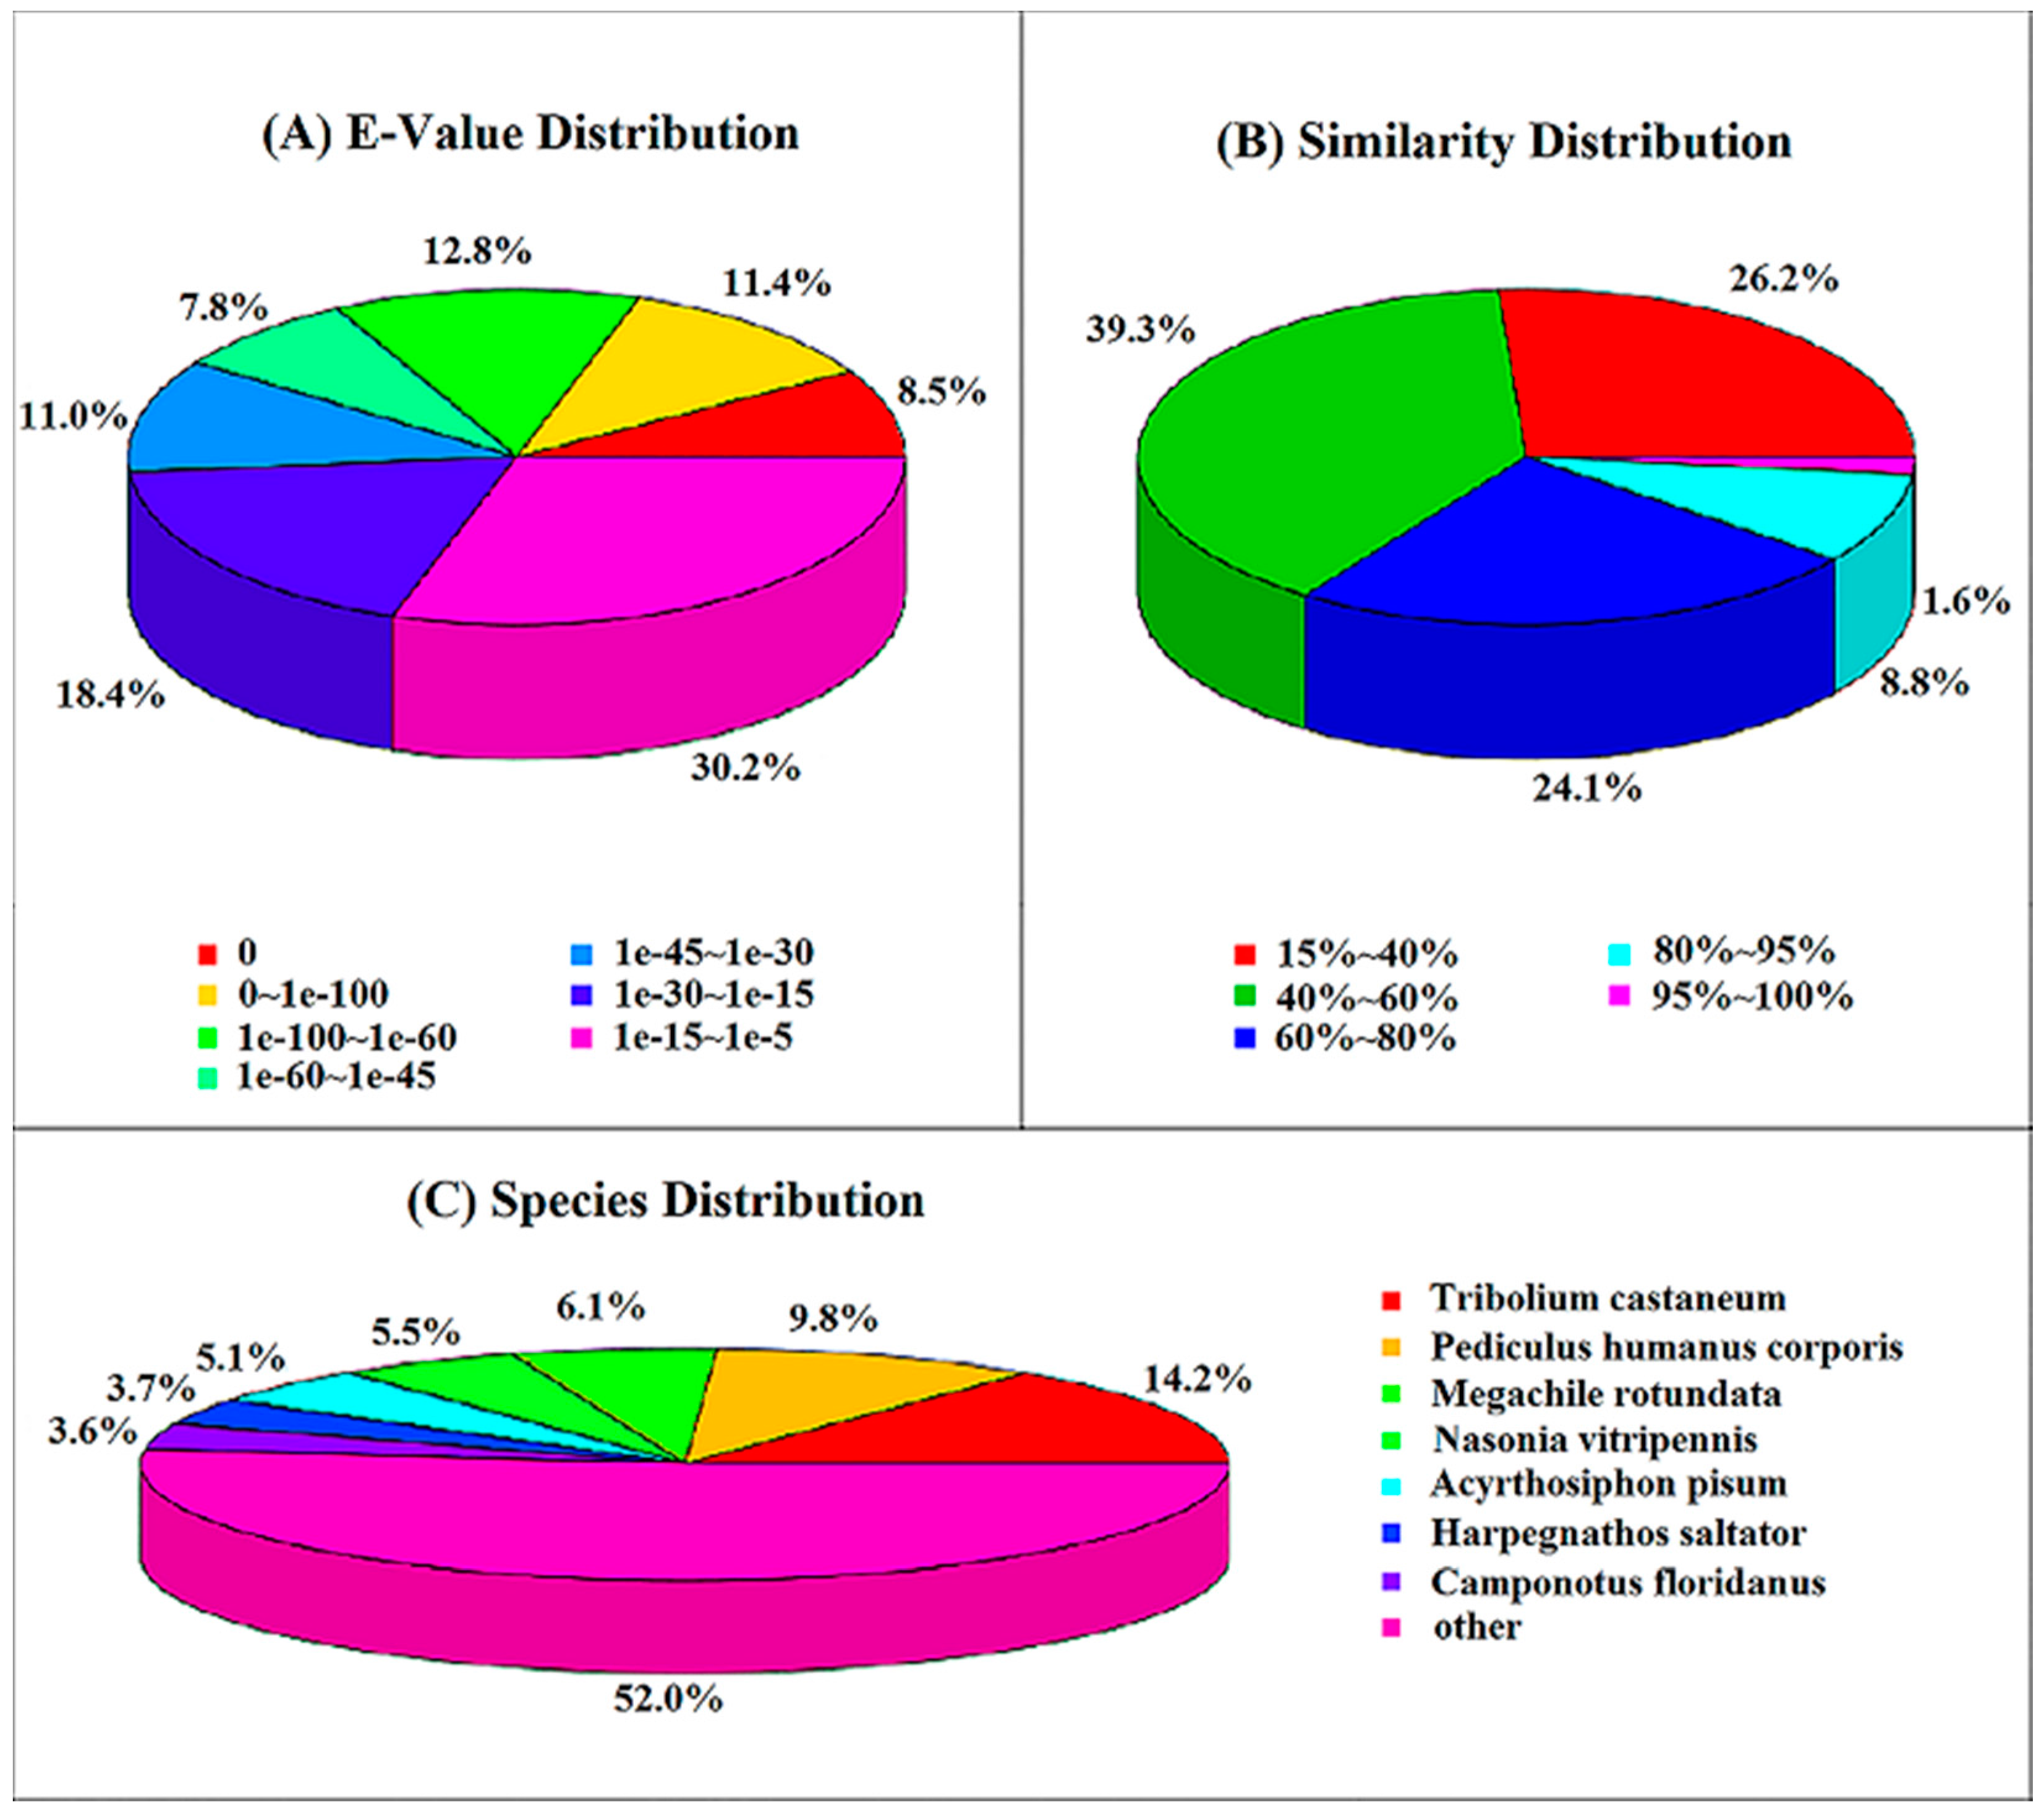
BLASTX and BLASTN similarity searches were conducted between the assembly of unigenes and the following public databases: the NCBI non-redundant protein sequences (Nr), NCBI non-redundant nucleotide sequences (Nt), a manually annotated and reviewed protein sequence database (Swiss-Prot), Gene Ontology (GO) and Kyoto Encyclopedia of Genes and Genomes (KEGG) databases, respectively. Table 2 presents the number of unigenes annotated to these six public databases.

2.3. Nr Annotation

In total, 25,652 (34.36% of all distinct sequences) unigenes had Nr hits with BLASTX similarity search with the cut-off E-value of 10−5. Nr annotation and the E-value distribution indicated that 40.4% of the mapped sequences showed strong homology (E-value ≤ 10−45), whereas 59.6% of the homolog sequences ranged from 1.0 × 10⁻⁵–1.0 × 10−45 (Figure 1A). For the similarity distribution, 34.5% hits had a similarity over 60%, only 10.4% of sequences having a similarity higher than 80% (Figure 1B). For the species distribution, sequences of T. castaneum (Coleoptera, Tenebrionidae) were most commonly the top hit for sequences of S. shirakii (3649 unigenes, 14.2%). The following were Pediculus humanus corporis (9.8%), Megachile rotundata (6.1%), Nasonia vitripennis (5.5%), Acyrthosiphon pisum (5.1%), Harpegnathos saltator (3.7%) and Camponotus floridanus (3.6%) (Figure 1C).

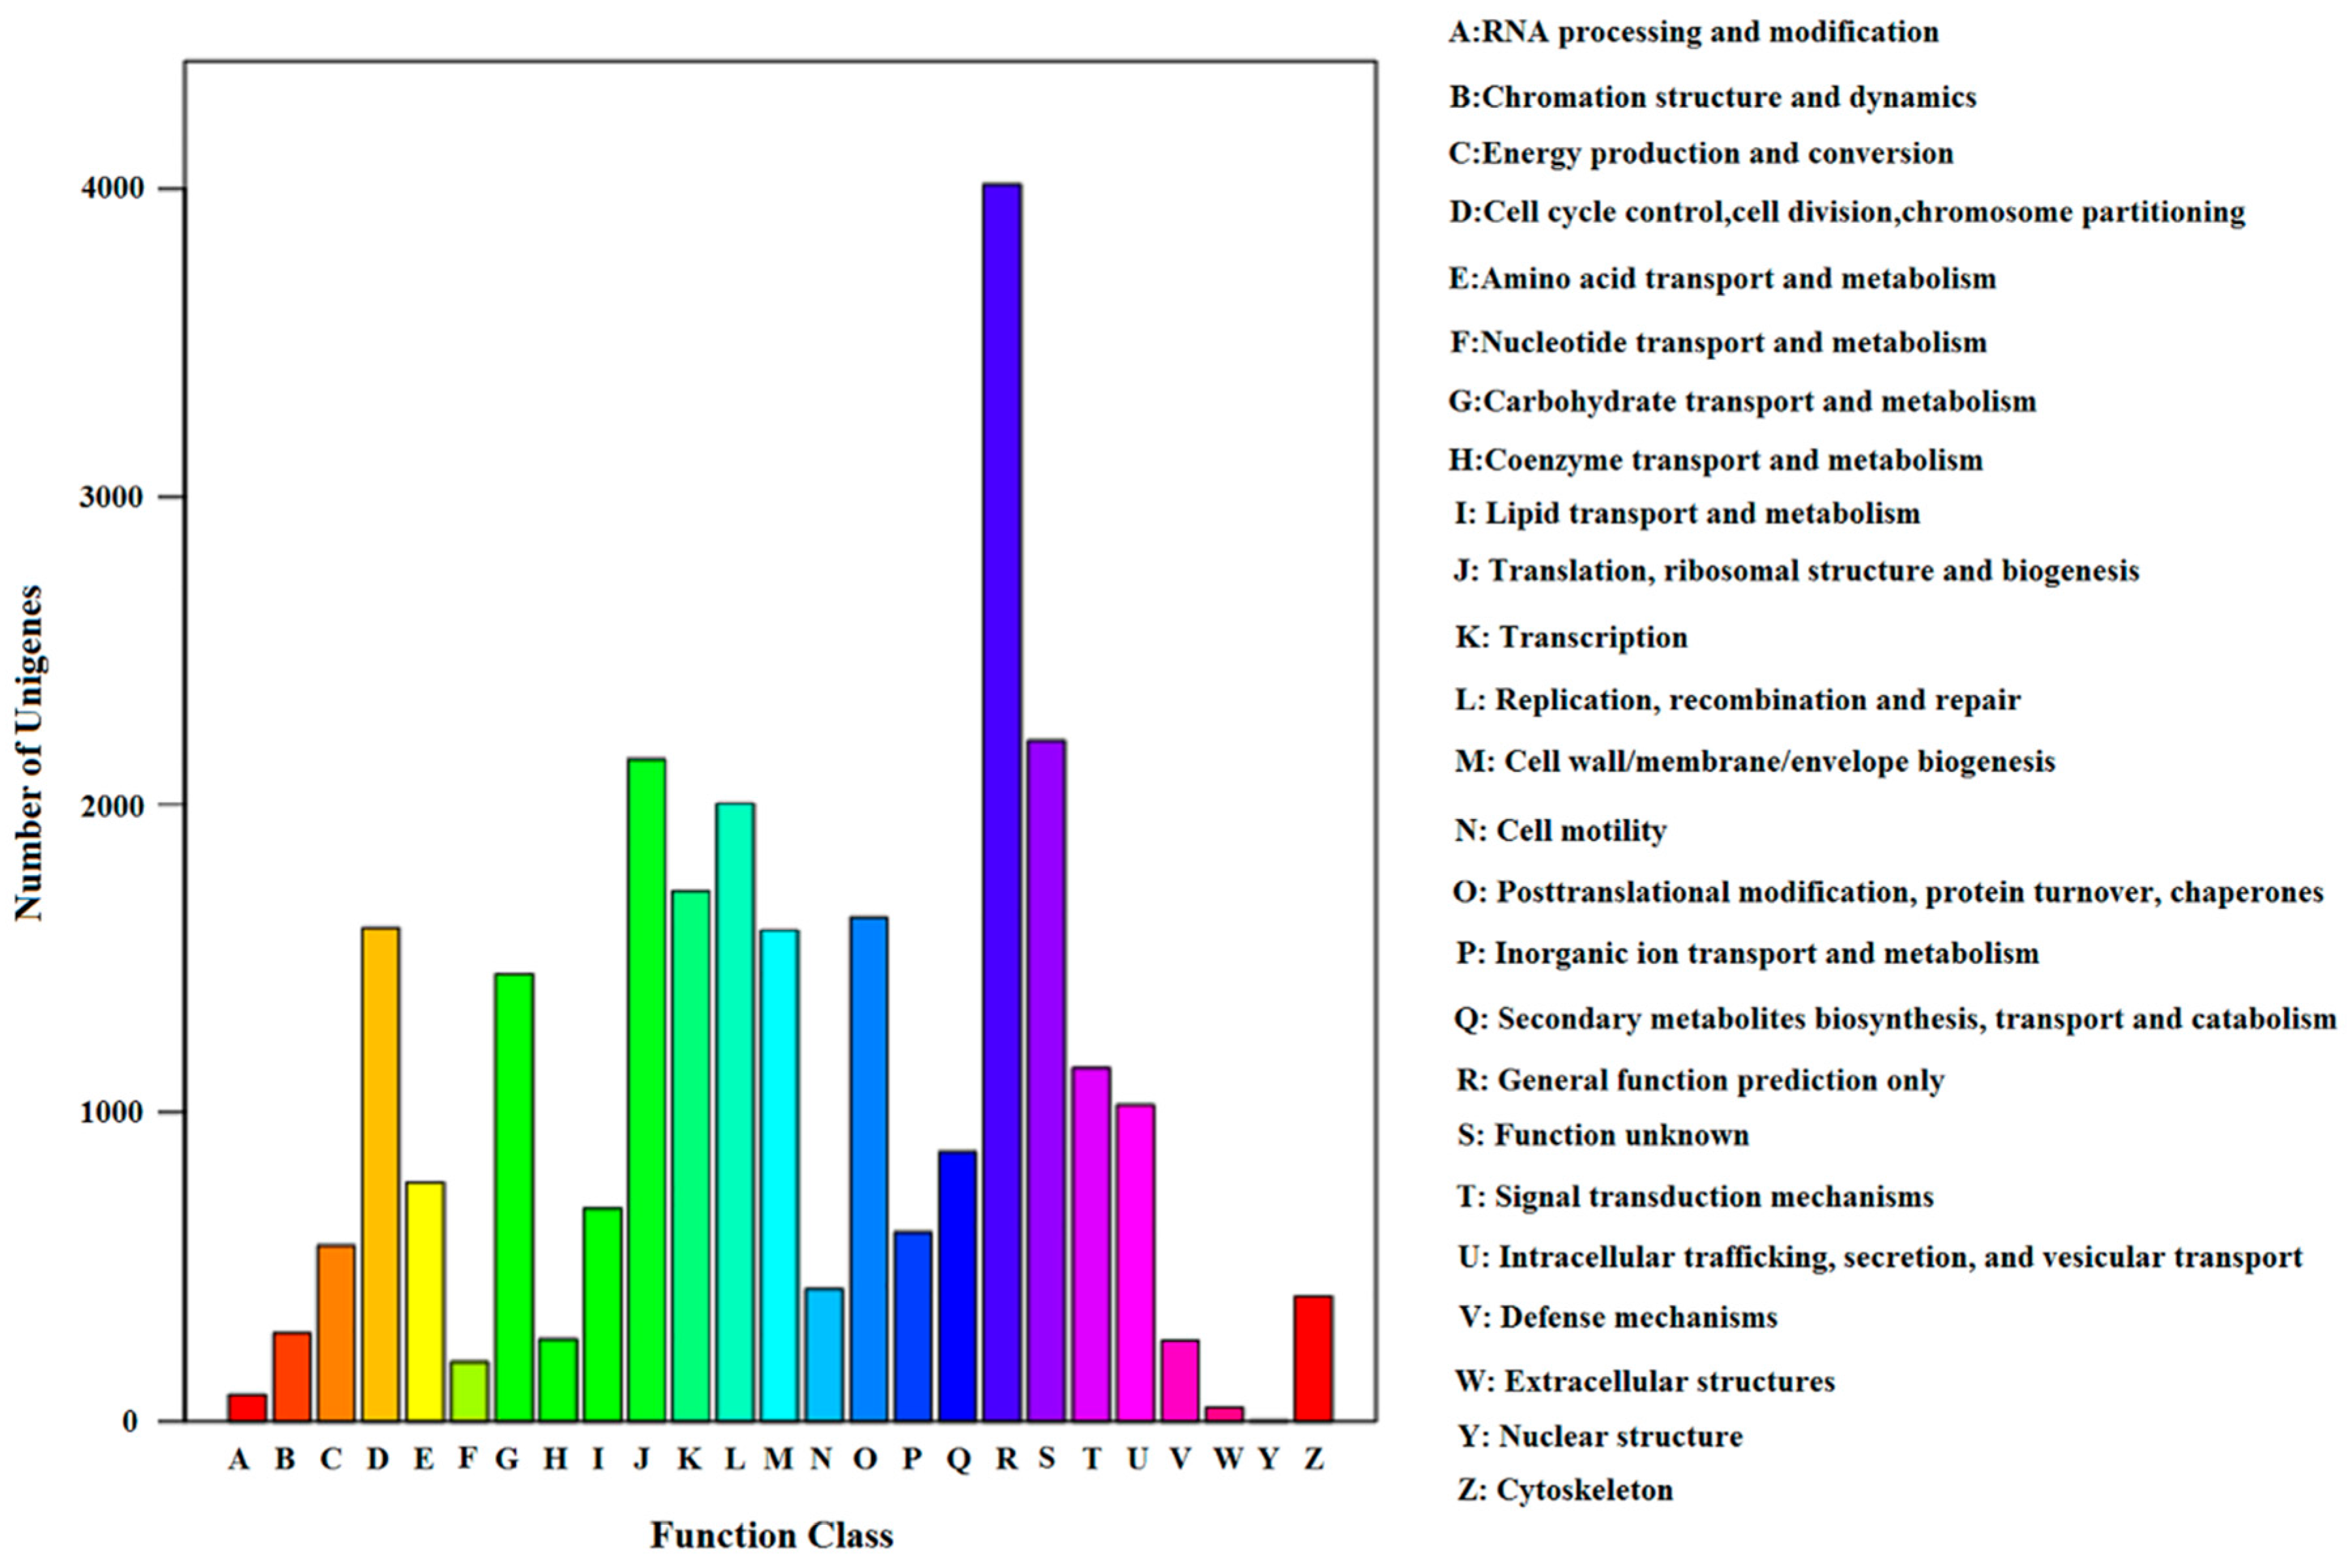
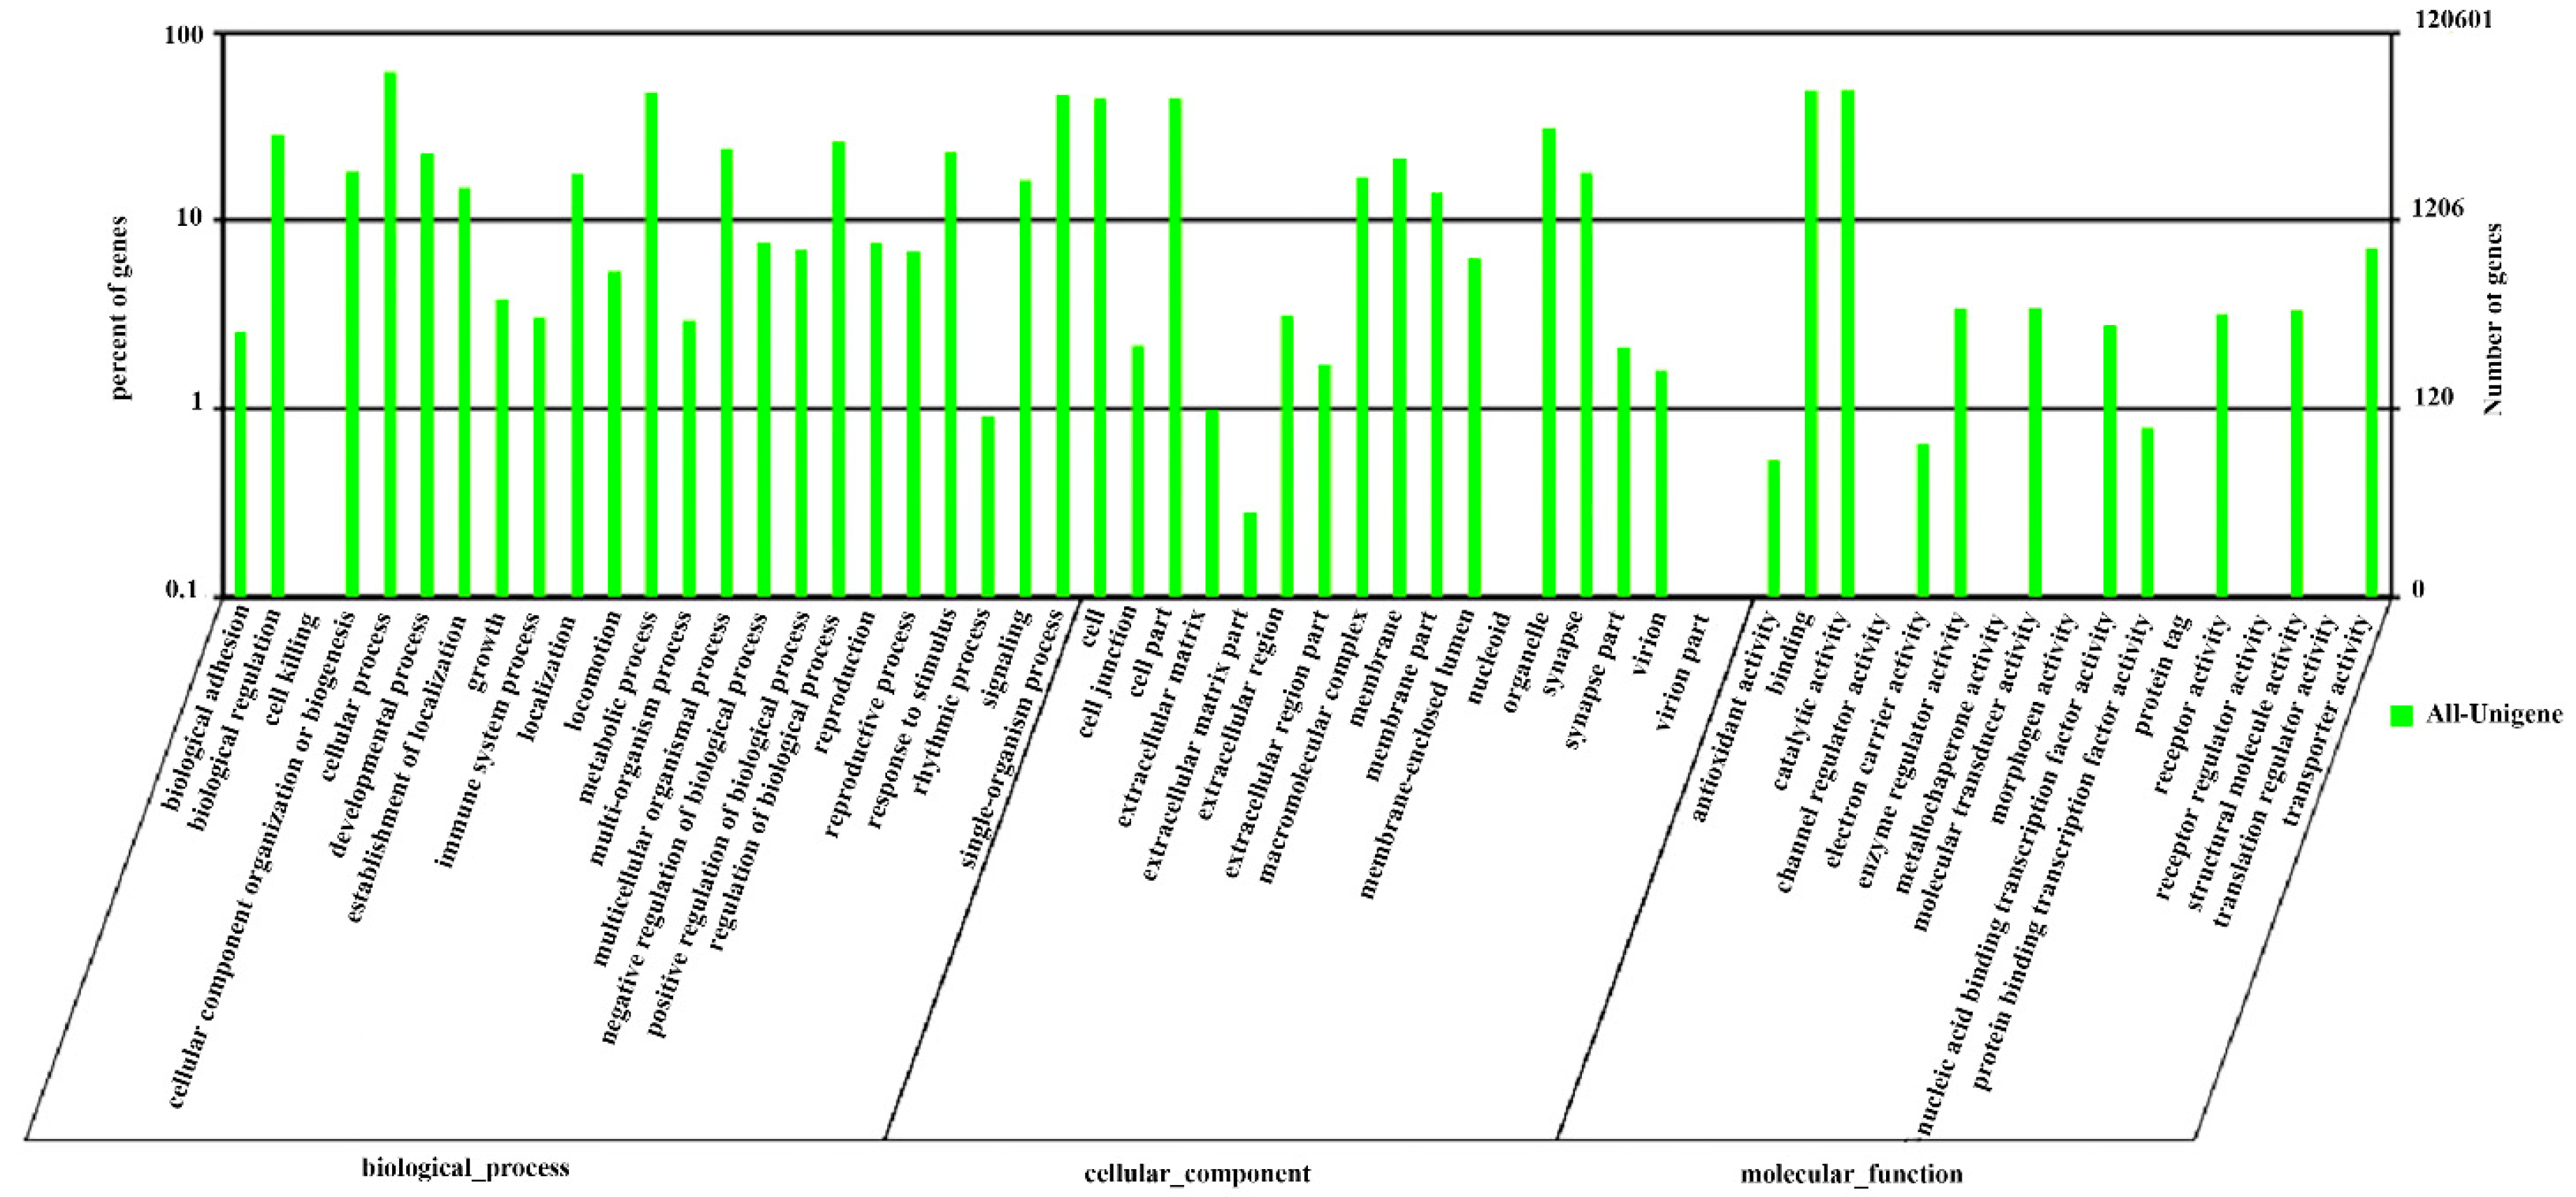
2.4. GO, COG Classification, Swiss-Prot and KEGG Pathway

In total, 28,173 of the 74,657 unigenes were annotated in the databases. Among these unigenes, a total of 6044 unigenes were annotated by the GO, COG classification, Swiss-Prot and KEGG pathway databases (Table 2, Figure S1).
Among the 25,652 hits in the Nr database, 12,061 unigenes (47%) were assigned to one or more GO terms and 57 subcategories using Blast2GO based on BLASTX similarity searches [16]. GO includes three main functional categories: biological process, molecular function and cellular component. In addition, the terms “cellular process”, “catalytic activity”, “metabolic process”, “single-organism process” and “binding” are dominant; However, only a few genes from the “cell killing”, “virion”, “virion part” and “protein tag” terms were annotated (Figure 2).
To gain a more detailed annotation of the transcriptome, we assigned COG classification terms. In total, 9558 S. shirakii unigenes had a COG classification (Figure 3). The top five groups were as follows: “a general function prediction only” (4014, 42.0%), “function unknown” (2208, 23.1%), “translation, ribosomal structure and biogenesis” (2149, 22.5%), “replication, recombination and repair” (2003, 20.9%) and “transcription” (1718, 17.9%). Among these, 23.1% of unigenes were classified as “function unknown” groups, which indicated that there could be many unique or novel genes in the S. shirakii transcriptome. “Extracellular structures”, “nuclear structure” and “RNA processing and modification” consisted of 44, 4 and 88 unigenes, respectively, representing the smallest COG groups (Figure 3).
A total of 18,053 unigenes was mapped to the metabolism, genetic information processing, environmental information processing, cellular processes and organismal systems pathways in the KEGG pathway database (Table 3). Among these pathways, metabolic pathways (2520 unigenes), signal transduction (1603 unigenes) and digestive system (1399 unigenes) contained the largest number of unigenes.

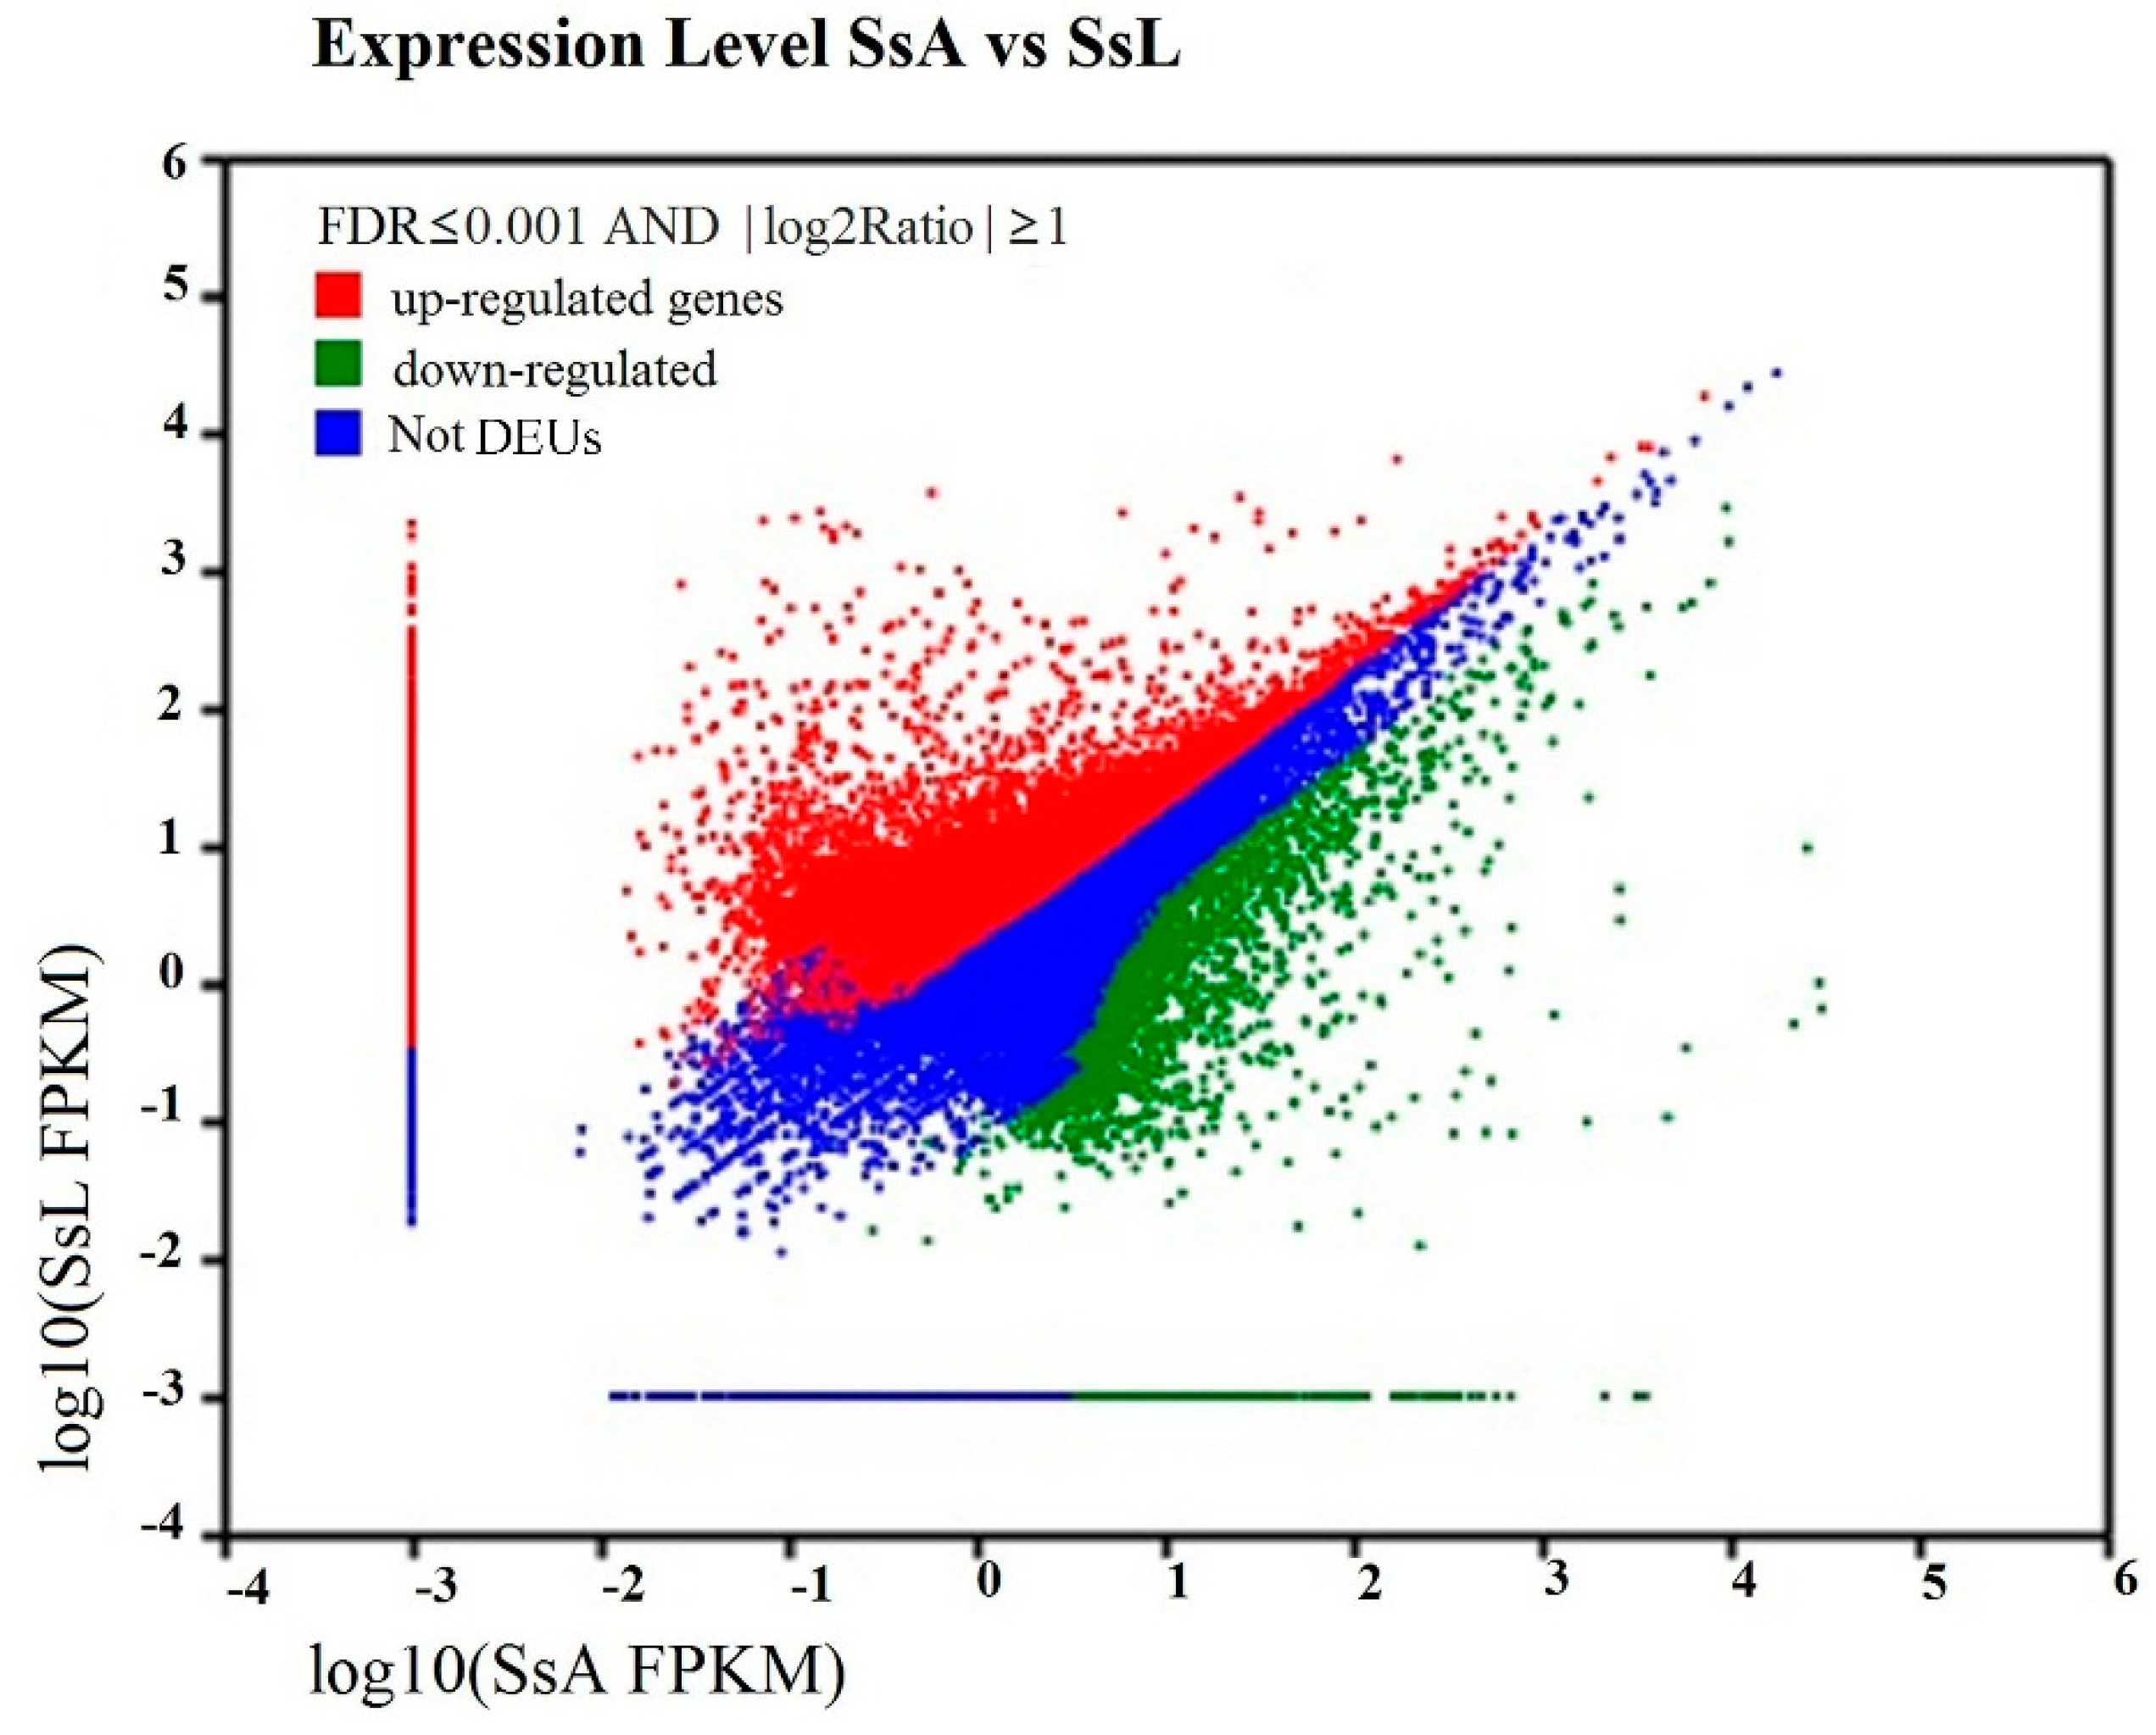
2.5. Differentially-Expressed Unigenes’ Analysis

The results of the differentially-expressed unigenes (DEUs)’ comparison between the adults and larvae showed that a total of 19,764 unigenes were annotated to be up-regulated, and 4185 unigenes were down-regulated in the larvae (Figure 4). The top fifty up- and down-regulated expressed genes are listed in Table S3. Among the fifty top up-regulated genes, 34 DEUs have predicted functions, i.e., the putative Apolipoprotein D precursor (Pediculus humanus corporis), CPG12 (Papilio xuthus), UDP-N-acetylglucosamine transferase subunit ALG13 homolog (Equus caballus) and vitellogenin (Vg) (Athalia rosae). A total of 47 unigenes of the top fifty up- and down-regulated unigenes was blasted against the Nr database without annotation with an E-value of 10−5.
All of the DEUs were aligned to the GO database. In total, 4447 DEUs were assigned to GO terms by Blast2GO annotation (Table S4). Among these, a total of 3256 DEUs was mapped to the “biological process” category. A total of 3258 DEUs was assigned to the “molecular function” category, and 2464 DEUs were assigned to the “cell component” category. Cellular process (2633), metabolic process (2181 unigenes) and single-organism process (1950 unigenes) represented a high percentage of the biological process categories. Regarding the cellular component category, cell (2057 unigenes), cell part (2057 unigenes) and organelle (1441 unigenes) were highly represented. Catalytic activity (2255 unigenes) and binding (2139 unigenes) differed mostly in the molecular function category.

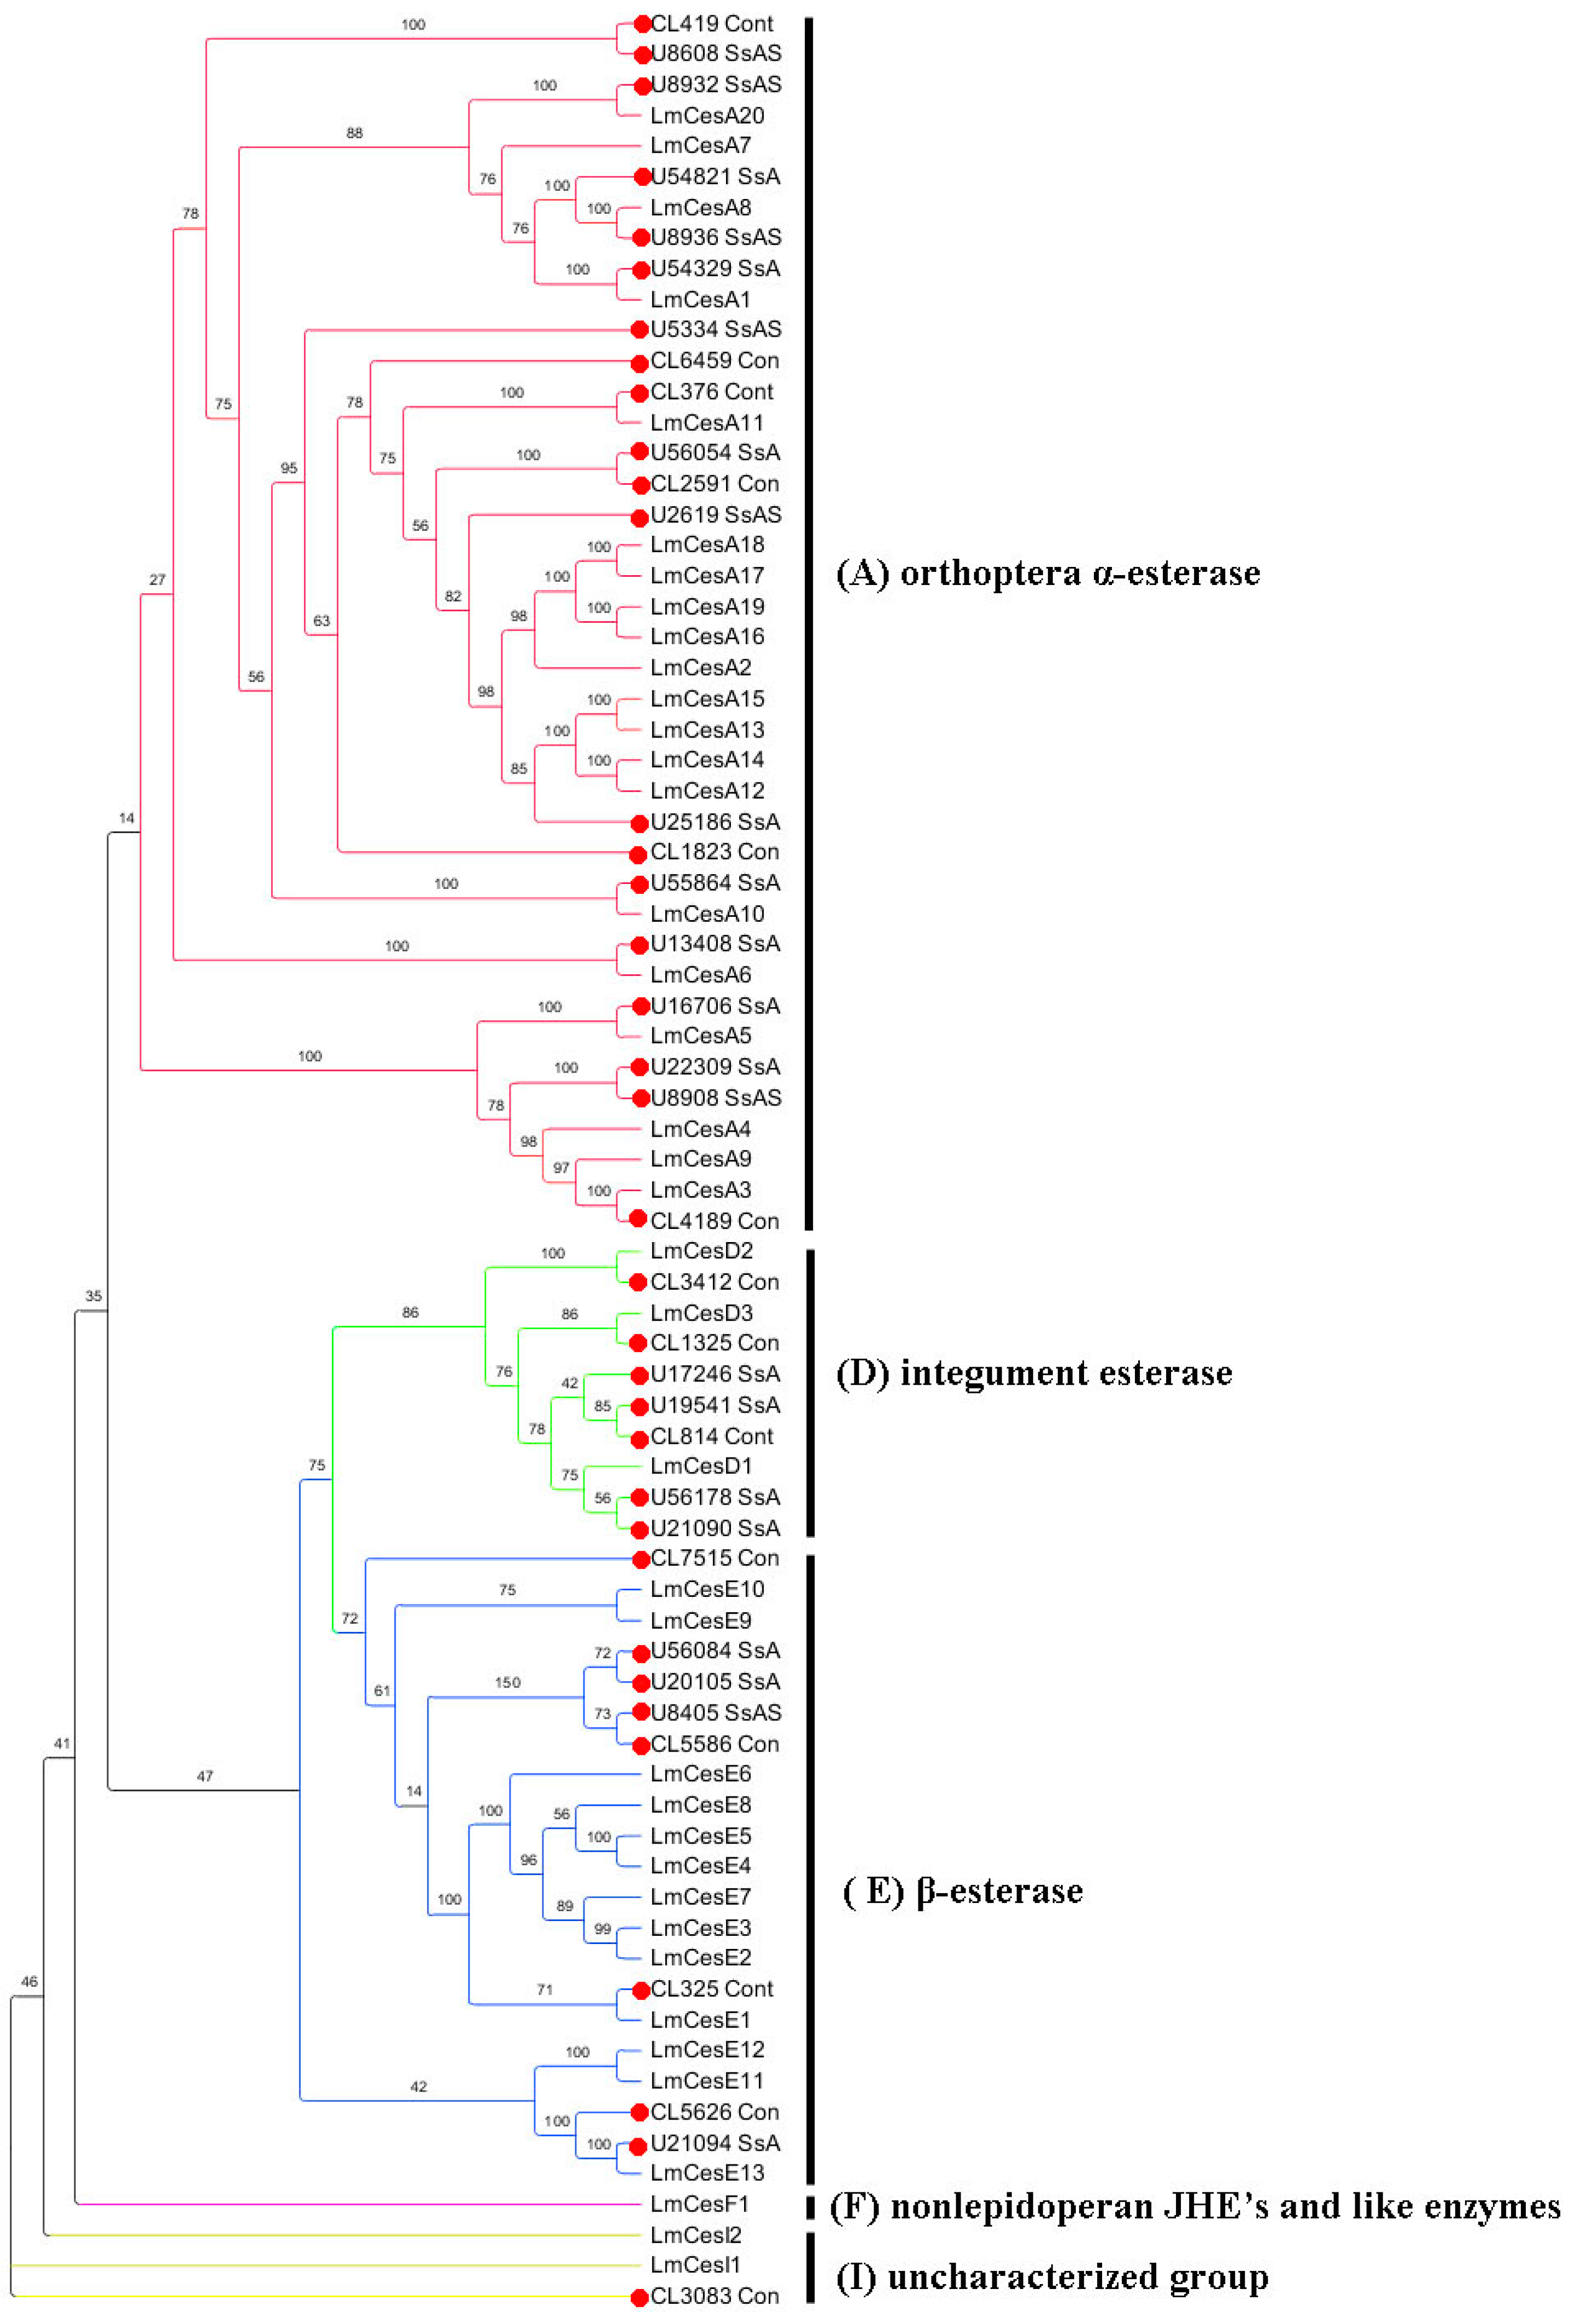
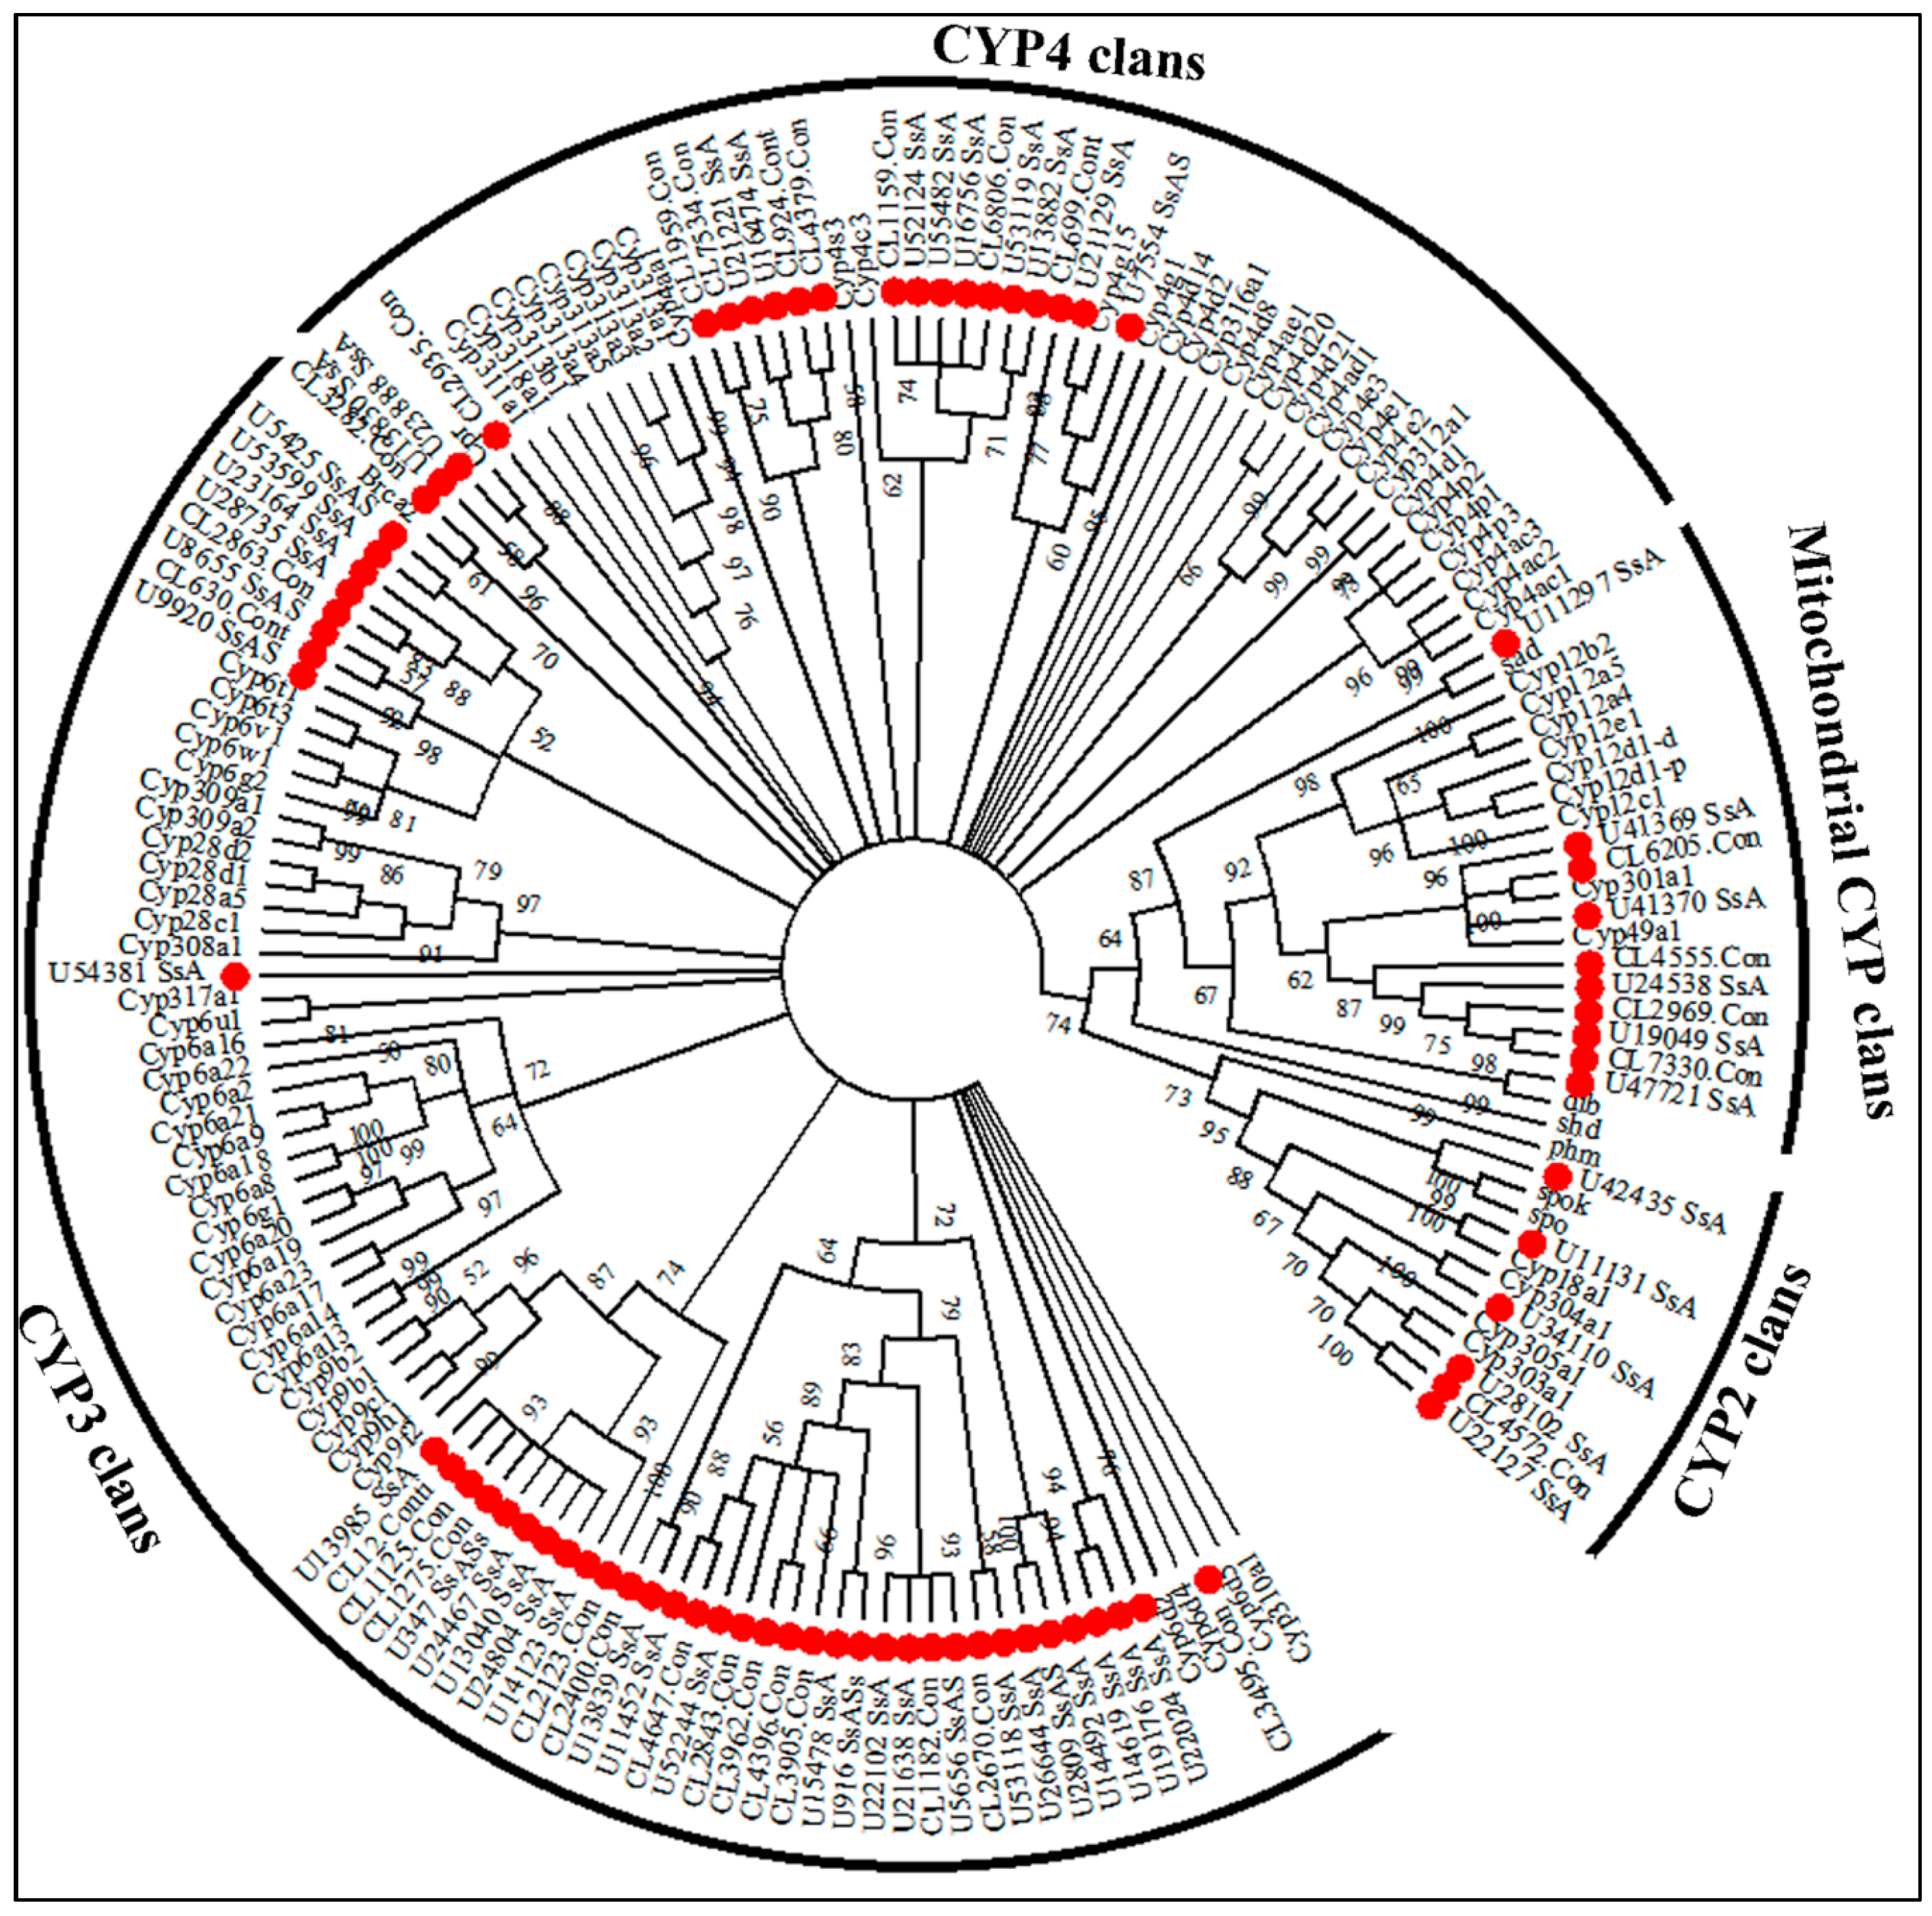
2.6. Insecticide Resistance

Based on the Nr annotation results, we manually selected a number of unigenes that were homologous to genes related to insecticide resistance. A total of 198, 46 and 64 unigenes corresponding to P450-, GST- and CarE-related unigenes were identified separately from the Nr annotation in the S. shirakii transcriptome. After removing redundant and short sequences (sequences in CarEs and P450s with lengths <500 bp and sequences in GSTs with lengths <200 bp were considered as short sequences), we obtained 79, 36 and 36 unigenes that putatively encode P450s, CarEs and GSTs (Tables S5–S7), respectively. Figure 5 shows the phylogenetic tree constructed based on amino acid sequences deduced from 79 unigenes encoding P450s from S. shirakii and 90 genes encoding P450s from Drosophila melanogaster. According to the D. melanogaster P450s superfamily, all CYP genes can be divided into four clans: CYP2, CYP3, CYP4 and the mitochondrial CYP clans (M) [17]. The phylogenetic tree analysis revealed that the majority of S. shirakii P450s-encoding genes belonged to clan 3 (44) and clan 4 (19) compared to clan 2 (six) and clan M (10) (Figure 5 and Table S5). Figure 6 shows the phylogenetic tree constructed based on amino acid sequences from 36 putative CarEs-encoding genes from S. shirakii and 39 CarEs-encoding genes from L. migratoria. Our 36 S. shirakii CarEs-encoding genes were distributed into five clades, including clade A with α-esterase (20 unigenes), clade D with integument esterase (seven unigenes), clade E with β-esterases (eight unigenes), clade F with nonlepidopteran JHE’s and like enzymes-related genes (zero unigene) and clade I with uncharacterized esterases (one unigene) (Figure 6 and Table S6). The 36 putative unigenes encoding GSTs were assigned to eight cytosolic classes (Epsilon (four unigenes), Delta (13 unigenes), Omega (three unigenes), Theta (two unigenes), Sigma (eight unigenes), Zeta (one unigene), GSTA (one unigene)) and microsomal GST encoding genes (four unigenes) (Figure S2 and Table S7).

2.7. Core RNAi Components

Two cofactors, Pasha and Loquacious (Loqs), were identified in S. shirakii (Table 4, Table S8, and S4). These two proteins are required to interact with the RNaseIII Drosha, Dicer-1 and Dicer-2. In Drosophila, R2D2 acts as a bridge between the initiation and effector steps of the RNAi pathway by facilitating siRNA passage from Dicer to RNA-induced silencing complex (RISC). However, the R2D2 gene was not detected in S. shirakii.
Two orthologs of Argonaute (Ago) genes, Argonaute-1 (Ago-1) and Argonaute-2 (Ago-2), were identified. These genes are involved in miRNA and siRNA pathways, respectively, and exhibited high homology to the counterparts of L. migratoria (AGO85968 and AGO85972). Argonaute-3 (Ago-3), Zucchini, Aubergine (Aub) and Piwi are proteins involved in piRNA [18]. The Piwi gene is present in L. migratoria and S. shirakii (Table 4 and Table S8). The Zucchini and Ago-3 genes were also identified in S. shirakii. In addition, we also identified the Sid-1 gene by a TBLASTN homology search using the L. migratoria SID-1 (AFQ00936) protein sequence as a query sequence. In total, we identified five unigenes that were homologous to the Sid-1 gene (Table 4 and S4). These five unigenes are blasted to different parts of the L. migratoria Sid-1 gene.

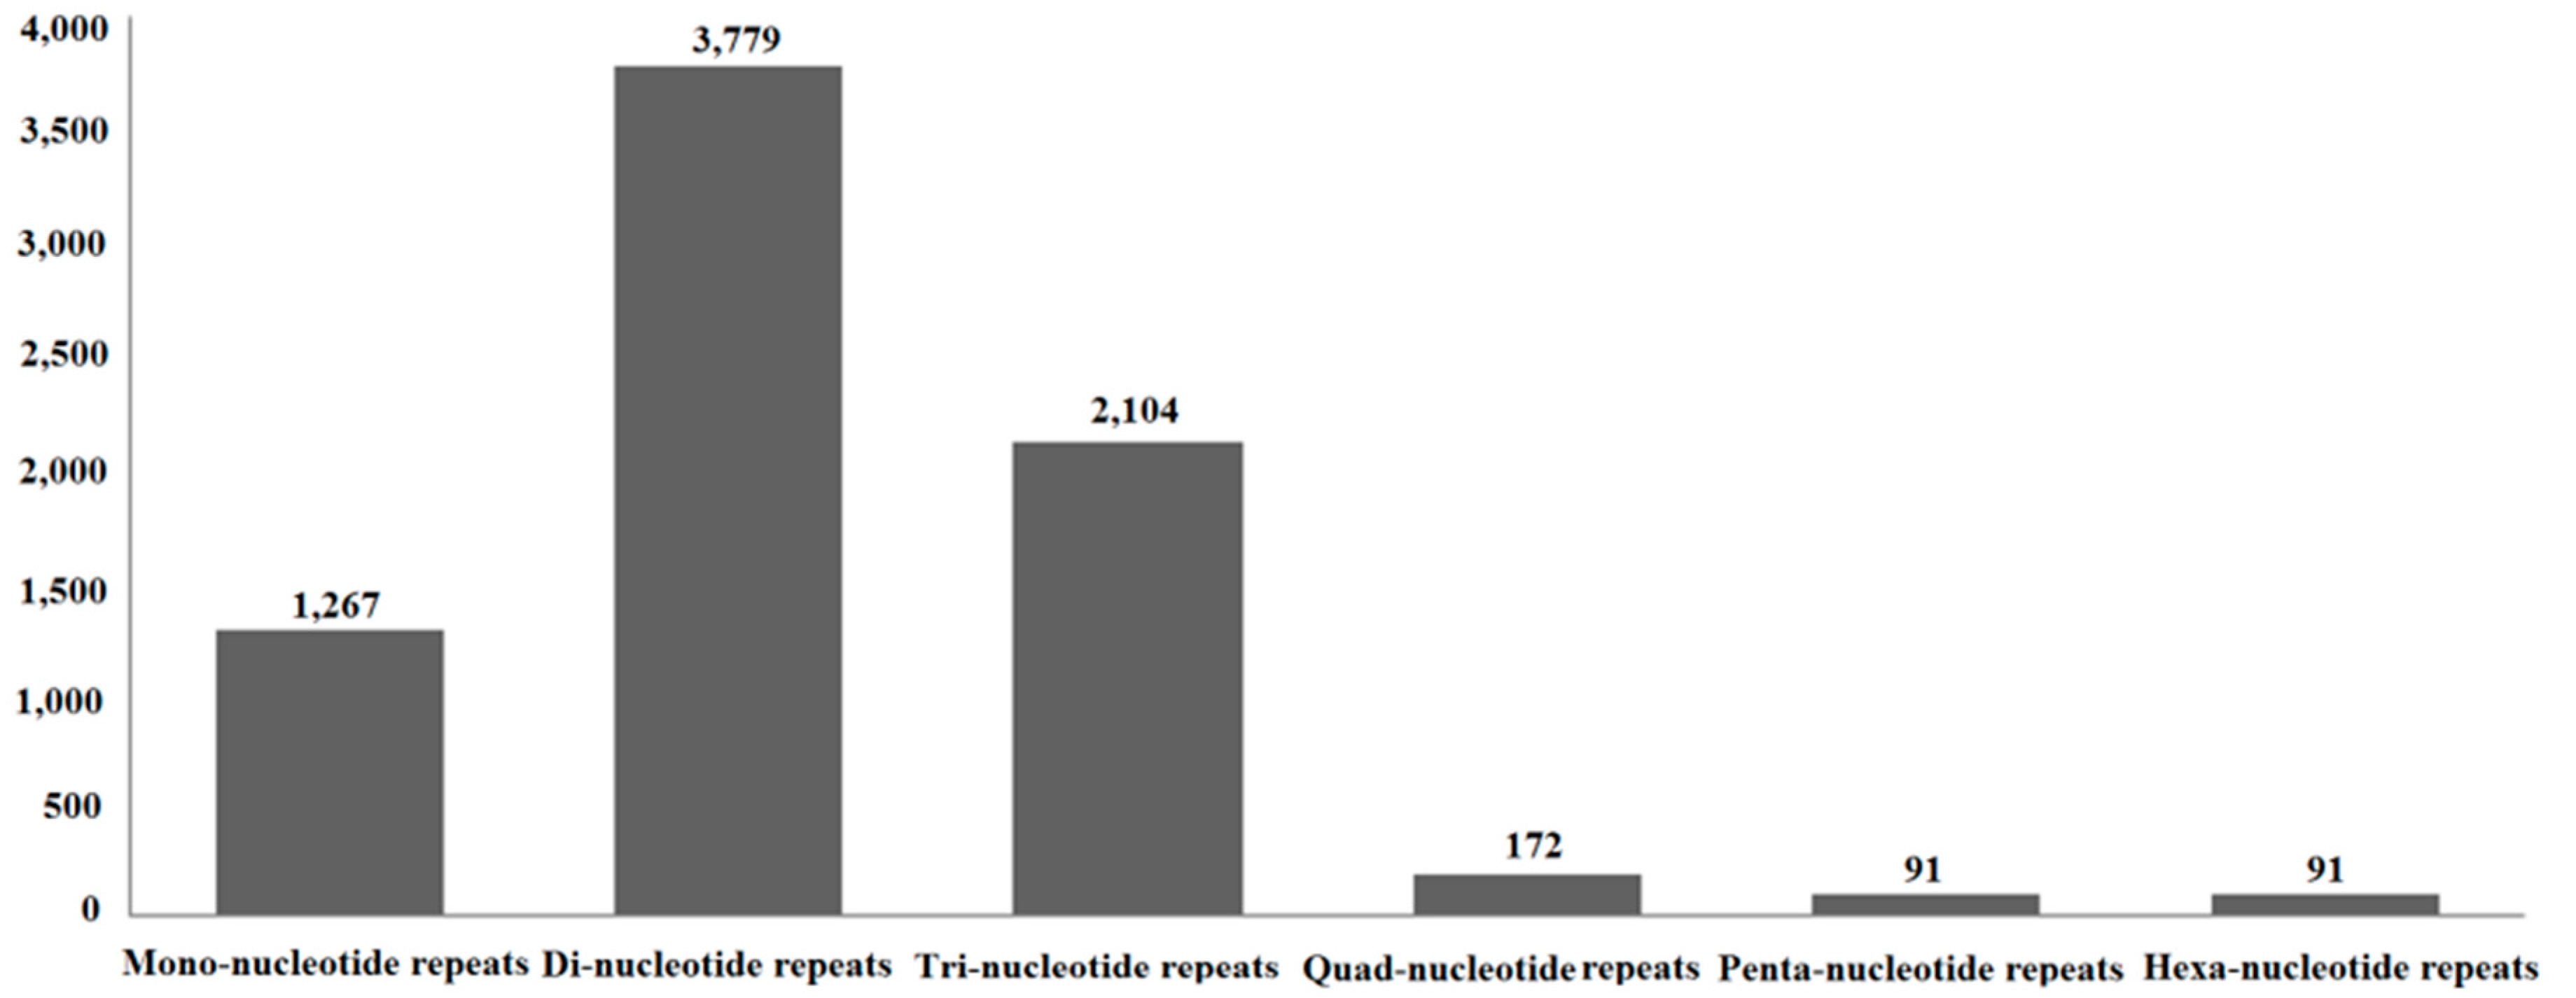
2.8. Simple Sequence Repeats (SSRs)

In total, 6655 sequences containing 7504 SSRs were predicted from 74,657 unigenes. The SSR frequency was 8.91% (6655/74,657), and the distribution rate was 10.05% (7504/74,567) in the S. shirakii transcriptome. Among them, 730 sequences contained more than one SSR, and dinucleotide repeats (50.36%) represented the most abundant microsatellite repeat units, followed by trinucleotide (28.04%), mononucleotide (16.88%), quadranucleotide (2.29%), pentanucleotide (1.21%) and hexanucleotide (1.21%) repeats (Figure 7 and Table S9).

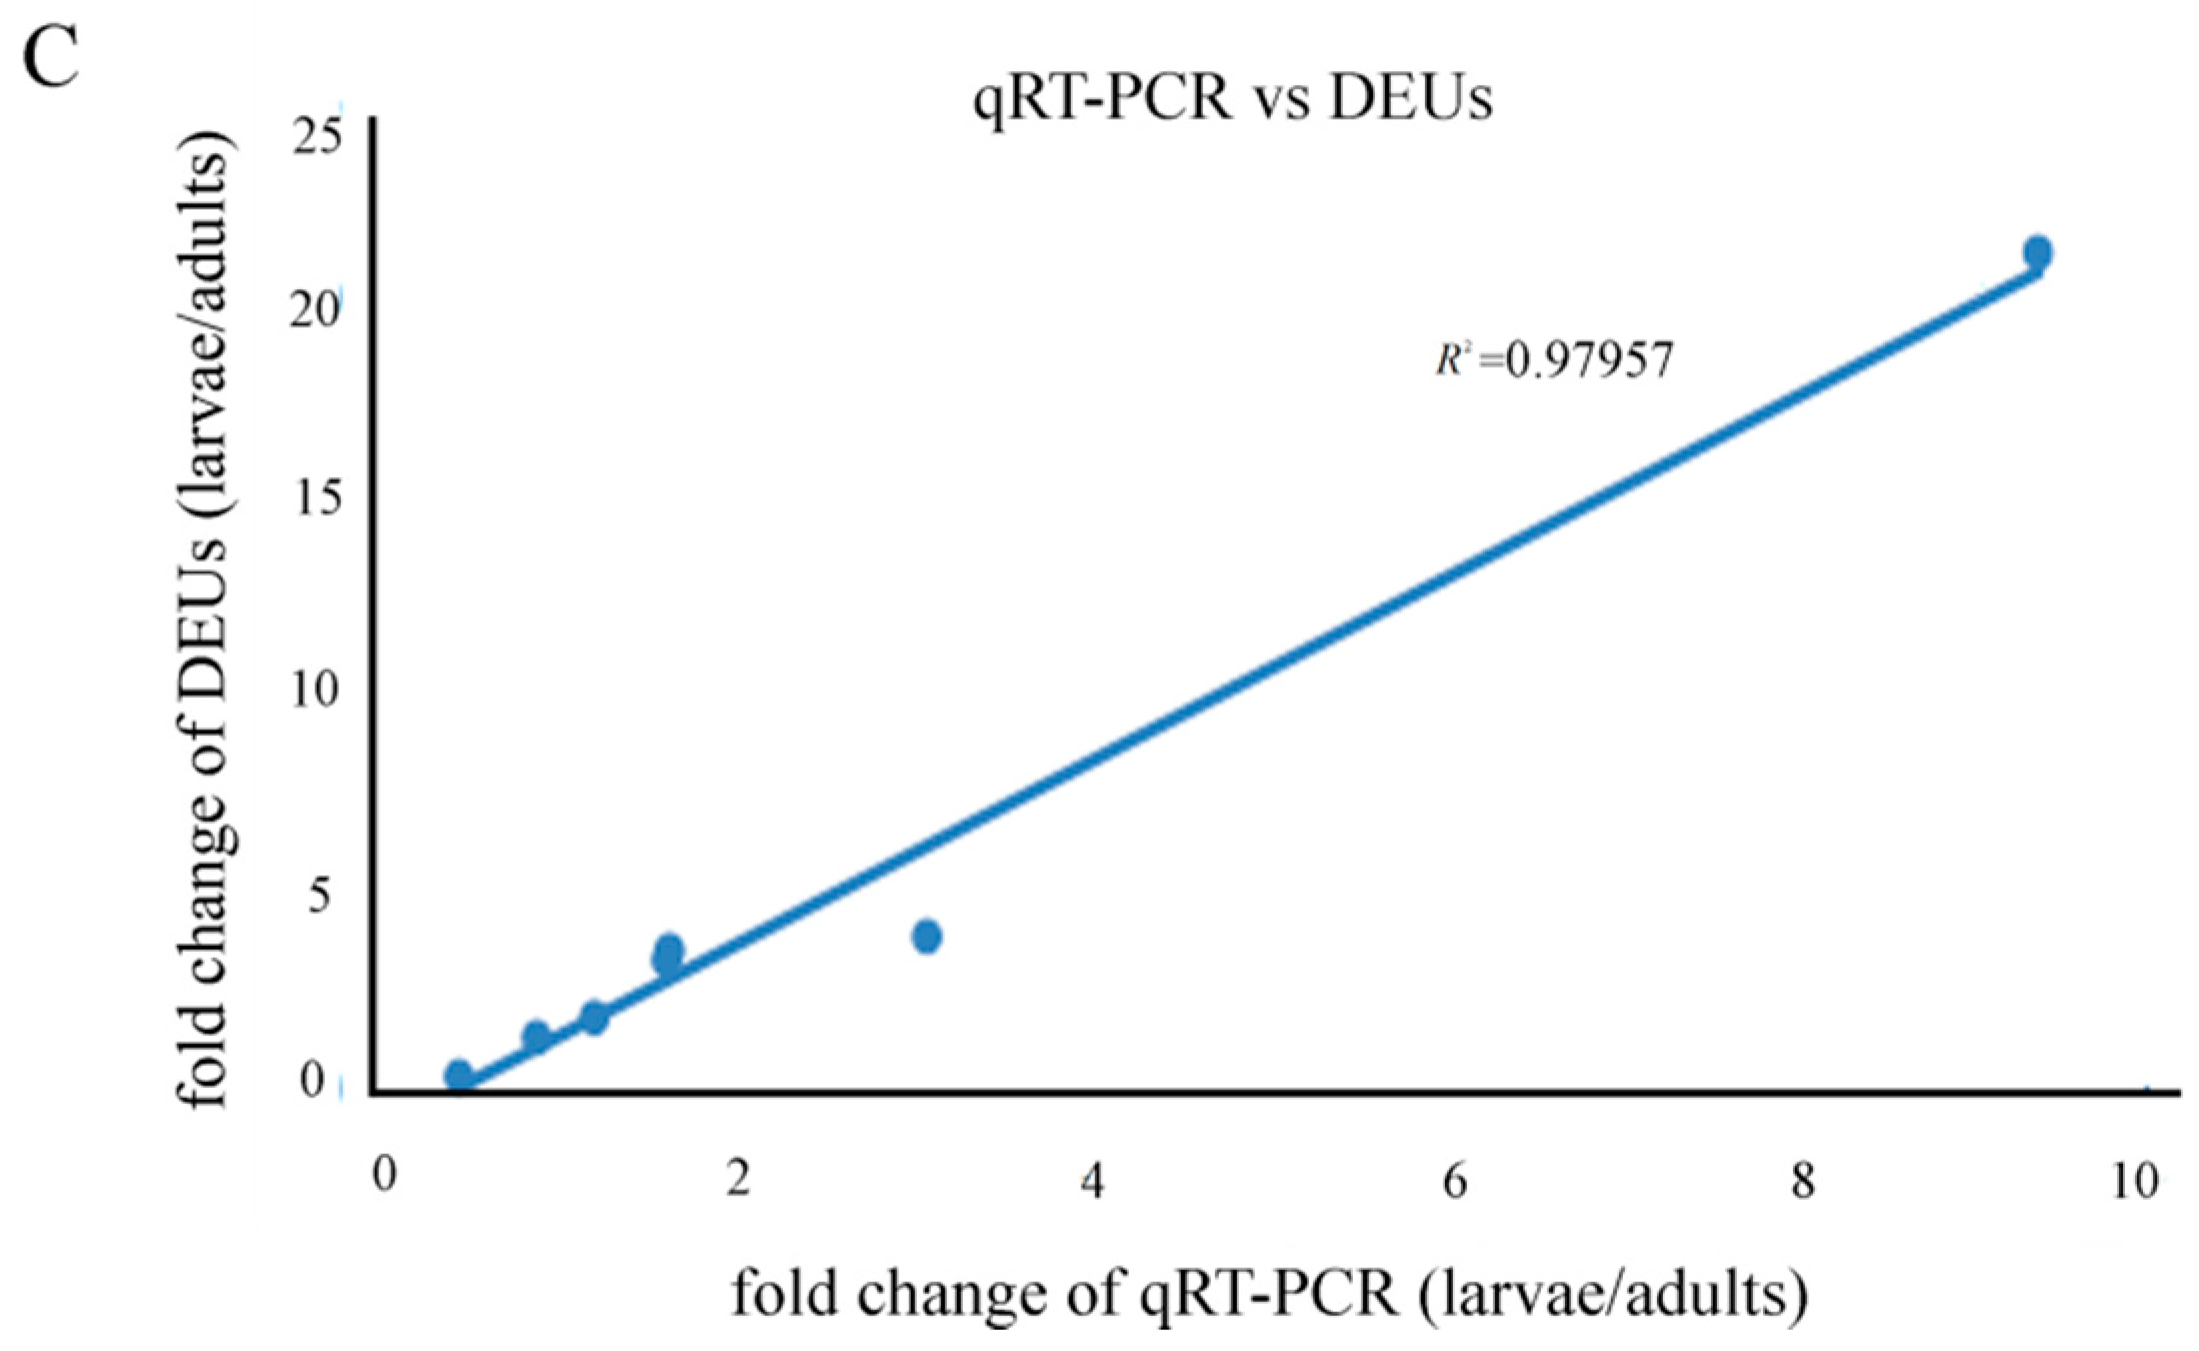
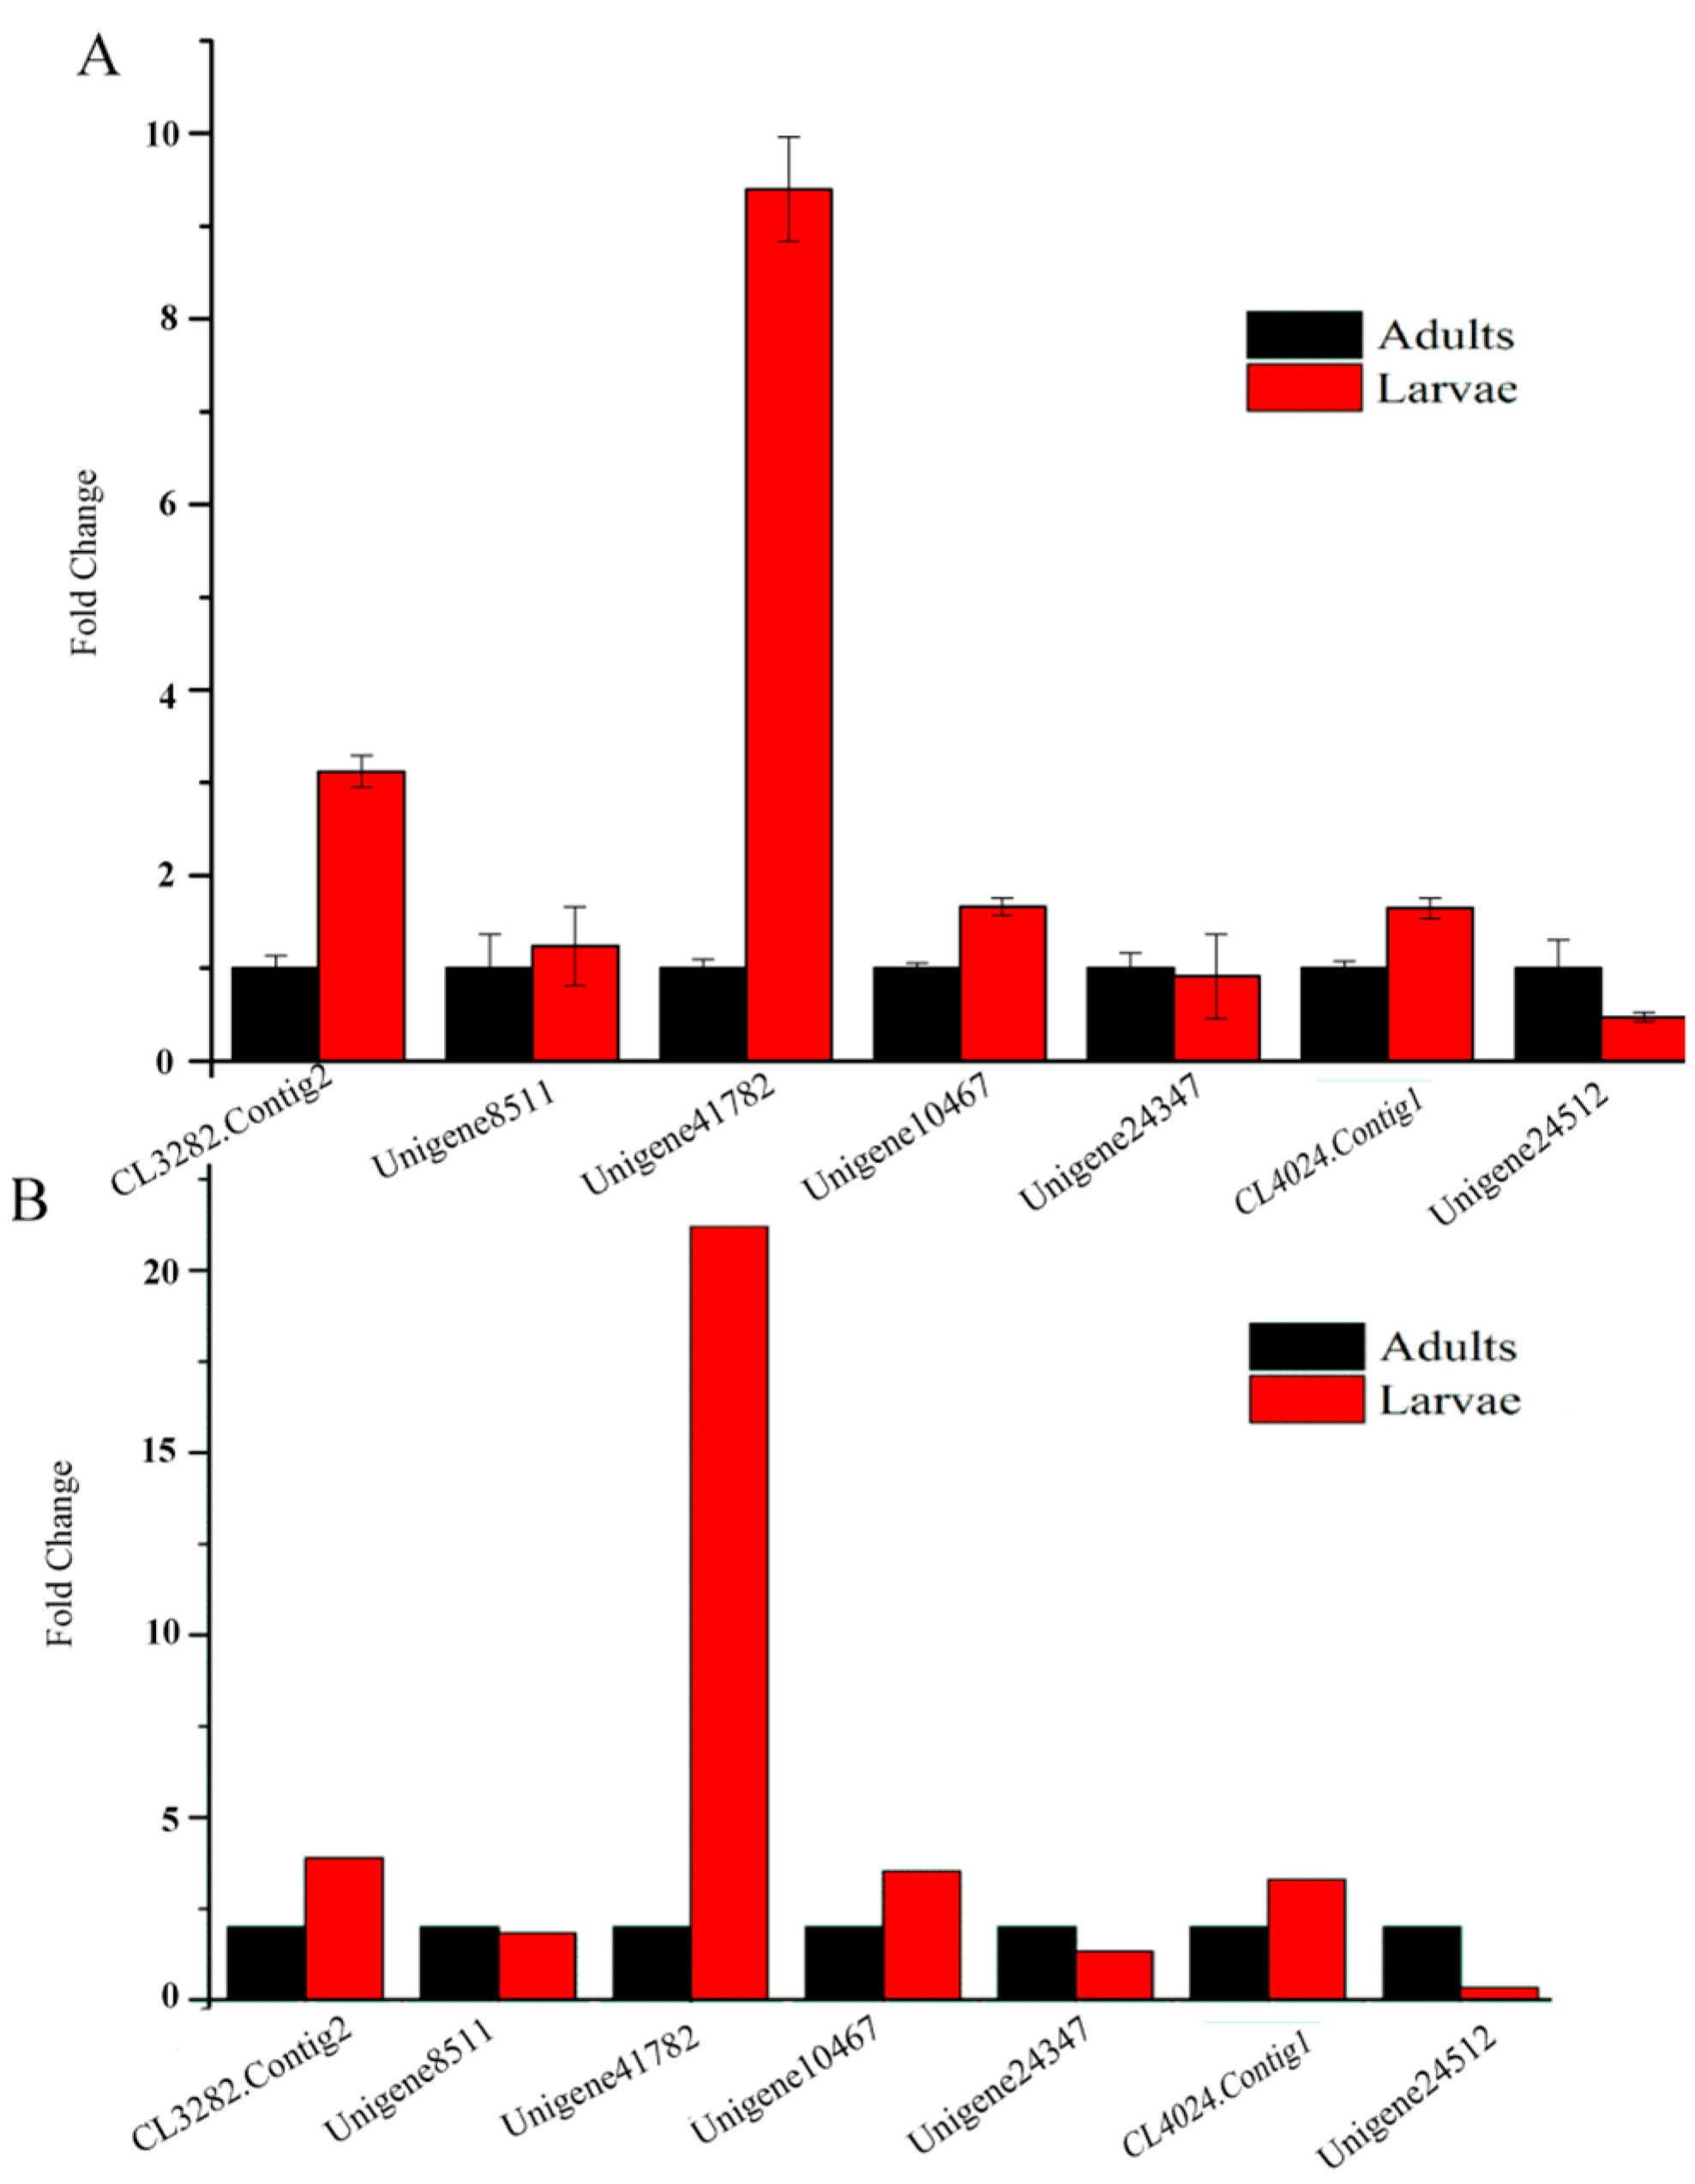
2.9. Quantitative Real-Time PCR Results

To validate our transcriptome data, we randomly chose seven unigenes, designed primers and used the gapdh gene as the control to measure their expression in the same RNA sample of adults and larvae by qRT-PCR. All seven unigenes’ results showed uniformly consistent results in RT-PCR with RNA-Seq (Figure 8), which indicates that transcriptome sequencing was reliable and that we could make reasonable deductions from the functional enrichment analysis of the DEUs.

3. Discussion

The S. shirakii transcriptome generated 74,657 unigenes, and their annotation information from the Nr, Nt, COG, GO, KEGG and Swiss-Prot databases provided valuable resources for molecular studies of S. shirakii. However, a large number of unigenes (62.26%) unmatched to Nr, Nt, GO, COG, KEGG and Swiss-Prot databases are short sequences or potentially novel genes [19,20,21]. Many differentially-expressed genes achieved by comparative transcriptomic analyses between the samples greatly enriched the current knowledge of S. shirakii gene expression profiles. Most of the differentially-expressed genes were up-regulated at the larvae stage when compared to the adult stage. In contrast, most of these genes were down-regulated in adults. We analyzed the top fifty up-and down-regulated expressed unigenes between samples (larvae vs. adults) (Table S3). Among the top fifty up- and down-regulated DEUs, 15 DEUs had exact annotations. Most of these DEUs were related to innate immune system, pathogen invasion and transcription. Vg is the precursor of vitellin (Vn), which plays a vital role in oocytes and embryo development in oviparous animals, such as insects [22]. In the present study, the Vg gene (log2 adult/larvae = 15.5346) was up-regulated in adults compared to larval samples. It was reasonable that adult samples were collected in August, and the females had their eggs. Ova require nutrition, and Vg could support the nutritional needs. However, of the top 50 up- and down-regulated DEUs, 47 DEUs were found to be non-homologues in the NCBI Nr database. Most defined genes are annotated to a hypothetical or uncharacterized protein, likely due to the lack of detailed molecular information for S. shirakii. This phenomenon is consistent with the whitefly (Bemisia tabaci) transcriptome, and it is expected that Orthopteran genes are expressed during development that have no homologs in other species [23].
P450s, CarEs and GSTs were reported to have a role in developing insecticide resistance with respect to metabolic and detoxification processes. In insects, more than 1000 P450s genes have been identified, and the numbers of genes among insect species vary considerably (48 genes in Apis mellifera, 94 genes in L. migratoria and 164 genes in Aedes aegypti). P450s play many functional roles in insect growth, development and the inactivation and metabolism of xenobiotic compounds, such as pesticides. The mitochondrial CYP clan in insects is involved in xenobiotic metabolism [24]. The CYP2 clan in insects includes P450s with essential physiological functions, e.g., ecdysone metabolism and juvenile hormone biosynthesis [25]. Considerable evidence links members of the CYP3 clan in insects to xenobiotic metabolism and insecticide resistance. In contrast, some CYP4s appear to be inducible metabolizers of xenobiotics, and others have been linked to odorant or pheromone metabolism [24]. CarEs belong to superfamily enzymes that can hydrolyze the carboxyl ester bond and the phosphodiester bond, thus metabolizing various ester bond-containing hormones, pheromones, drugs and insecticides. Based on the phylogenetic analysis in S. shirakii, S. shirakii unigenes encoding CarEs were divided into five clades, and most of unigenes encoding CarEs were identified to be clade A of the dietary detoxification group (20 α-esterase genes) and clade E (eight β-esterase genes) of the hormone/semiochemical-processing group. This phenomenon was consistent with the CarEs superfamily in L. migratoria. This finding might be why, as described in L. migratoria, abundant detoxification genes can be used for the digestion of many different plant secondary metabolites and for developing insecticide resistance [26]. LmCesA20 silencing increased the nymphal mortalities in L. migratoria, which plays an important role in the detoxification of malathion in the locust [26]. In our research, Unigene8932_SsASsL and LmCesA20 are sister groups in Figure 6. The identity of these two sequences is 72% with an E-value of 3 × 10−173. We inferred that Unigene 8932_SsASsL might play an important role in the detoxification of malathion and might be a potential target for pest control. In total, 32 unigenes encoding cytosolic GSTs) and four unigenes encoding microsomal GSTs were identified from the transcriptome of S. shirakii according to L. migratoria’s GSTs-encoding genes [5]. The estimated numbers of unigenes encoding P450s, CarEs and GSTs genes may be lower than the actual numbers in the locust genome, given the limitations of transcriptome technology. These results are expected to help researchers reveal the characteristics of diverse P450s, GSTs and CarEs.
RNAi is a widely-used gene-silencing tool in insects for embryogenesis, pattern formation, reproduction, biosynthesis, pest control and behavior [27]. However, there are many limitations to its application [7]. An RNAi-based strategy in pest control has been used in insects, including species of Orthoptera [28]. The identified genes, namely P450s-, CarEs- and GSTs-encoding genes, may facilitate the development of novel control strategies for S. shirakii and other Orthoptera insects. CYP4, 6, 9 and 12 family members have frequently been linked to insecticide metabolism and resistance [29,30,31]. The CYP6 family is unique to the class Insecta, and its biochemical function is associated with the metabolism of xenobiotics. CYP6FF1, CYP6FD2 and CYP6FE1 silencing resulted in significant mortality of L. migratoria nymphs to deltamethrin and carbaryl [31]. CYP6B P450s may contribute to deltamethrin metabolism in the cotton bollworm [32]. Silencing CYP6B6 expression reduced the resistance to pyrethroids of cotton bollworm and significantly increased the bollworm larval mortality rate significantly [33]. Tang et al. reported that silencing of CYP6B7 alone or CYP6B7 together with CPR and/or Cyt-b5 increased the susceptibility of H. armigera to fenvalerate [34]. RNAi of LmCesA1 and LmCesA2 increased insect mortalities by 20.9% and 14.5%, respectively, when chlorpyrifos was applied. These results suggested that these genes might not play a significant role in the detoxification of carbaryl and deltamethrin, but are most likely to be involved in the detoxification of chlorpyrifos in L. migratoria [4]. The nymph mortalities increased from 34.3% to 65.2% and 54.2%, respectively, after LmCarE9 and LmCarE25 silencing increased the nymph mortalities in the locust [35]. Silencing of an aphid carboxylesterase gene using plant-mediated RNAi impairs Sitobion avenae tolerance of Phoxim [36]. Thus, RNAi is a reliable molecular tool that offers great promises in meeting the challenges imposed by crop insects with the careful selection of key enzymes/proteins [37]. Moreover, the locust is a good model to study the regulatory mechanisms of RNAi in insects, particularly in S. gregaria and L. migratoria, displaying a highly robust and sensitive systemic RNAi (sysRNAi) response with tissue-dependent reduction of RNAi potency in reproductive organs [9,10]. The core RNAi components related to siRNA, miRNA and piRNA of the RNAi pathway, as identified in S. shirakii, provide a molecular basis for other Orthopteran species (Table 4).
SID-1 has been reported to be the best characterized protein involved in sysRNAi in C. elegans [38], but not in D. melanogaster, which lacks an endogenous SID-1 ortholog and does not exhibit a robust sysRNAi response. The presence of a Sid-1-like gene is hypothesized to be the determinant of whether sysRNAi occurs in an organism. The number of Sid-1 gene copies varies among insects. Hemipterans, Hymenopterans, Orthopterans and Phthirapterans only have one Sid-1 gene [12,39], Three homologs of C. elegans Sid-1 were identified in T. castaneum, and B. mori (Lepidoptera) has three Sid-1-like genes [12]. In the L. migratoria, SID-1 is not necessary for sysRNAi [9]; however, this species exhibits a robust sysRNAi response. The Sid-1-like gene in T. castaneum shared more identity with the C. elegans gene, tag-130. The tag-130 gene in C. elegans was not required for sysRNAi [12]. This suggested that the Sid-1 gene was not functional for sysRNAi and had a function similar to the tag-130 in other pathways in S. shirakii. Insect sysRNAi had alternative mechanisms.
In addition, there were no orthologous genes for RNA-dependent RNA polymerase (RdRP) in S. shirakii, which is consistent with a previous report that found that RdRP is not essential for simplifying dsRNA in insects [12,40]. The enhanced RNAi-1 (Eri-1) gene is present in S. shirakii. The Eri-1 gene is an evolutionarily-conserved gene involved in intracellular siRNA degradation.
SSRs or microsatellites are the most widely-used molecular markers, and the transcriptome sequencing is an effective method for SSR discovery [15]. These potential SSR markers identified in this paper will be valuable for genetic, evolutionary and molecular ecological applications for S. shirakii.

4. Materials and Methods

4.1. Species Collection, RNA Extraction and RNA-Seq

The female larval and female adult specimens of S. shirakii used for this study were collected in Xi’an, China. The guts of female larvae and adults were removed and then immediately frozen in liquid nitrogen, and total RNA was extracted using TRIzol reagent (Invitrogen, Carlsbad, CA, USA). After, RNA integrity was checked by the Agilent 2100 Bioanalyzer (Agilent Technologies, Mississauga, ON, Canada). Oligo (dT) magnetic beads were used to purify poly(A)+ RNA. Then poly(A)+ RNA was fragmented into small pieces at 94 °C for 5 min. First-strand cDNA synthesis used random hexamer-primer and reverse transcriptase (Invitrogen), followed by the second-strand cDNA synthesis. These cDNA fragments were treated for an end-repairing process and the ligation of adapters. Then, the products were amplified by PCR and purified by agarose gel electrophoresis and to construct a cDNA library. The mean sequence lengths of the cDNA library were 350 bp. Finally, the cDNA libraries were sequenced with pair-end 90 on the Illumina HiSeq™ 2000 platform (Illumina, San Diego, CA, USA). Raw sequence reads have been submitted to the NCBI Sequence Read Archive (Bioproject Raw sequence reads have been submitted to the NCBI Sequence Read Archive (Bioproject PRJNA295932)).

4.2. De Novo Assembly and Functional Annotation

Prior to assembly, low quality reads and adaptor reads were removed from raw data by using filter_fq (BGI internal software). The clean reads were then de novo assembled into unigenes by Trinity (K = 25) [41,42]. Next, TGICL clustering software [43] was used to process sequence clusters and resulted in unigenes.
The assembly of unigenes from S. shirakii was annotated by BLASTX (E-value < 10−5) against databases like Nr, Nt, Swiss-Prot, GO and KEGG with an E-value ≤ 10−5. A priority order of Nr, Swiss-Prot, KEGG and COG should be followed when results of different databases conflict with each other. The unigenes not aligned to any of the above databases were used to predict the coding regions and orientation of the sequence by the ESTScan software [16,44]. Blast2GO [16] was used to obtain GO terms of the S. shirakii transcriptome based on BLASTX search against the NCBI Nr database (E-value < 10−5). For the GO classifications, the default parameters were used (E-value < 10−5 and a GO weight >5).
BUSCO v.1b1 [45] was used to validate the accuracy and completeness of de novo assembly. All of the unigenes of S. shirakii were used to generate HMMER3 [46] hidden Markov model (HMM) profiles from amino acid alignments. Protein profiles of the S. shirakii unigenes for Augustus were generated with msa2prf l.pl in Augustus 3.1 [47] based on the multiple alignments. The consensus sequence of each unigene was inferred by hmmemit in the HMMER 3. The cutoff values of sequence lengths and HMMER bit scores were set according to the instruction of BUSCO v.1b1.

4.3. Differentially-Expressed Unigenes (DEUs)

The expressions of unigenes were normalized by using the fragments per kilobase per million (FPKM) method [48]. The differential expression levels were analyzed by the method of Audic and Claverie [49]. FDR (false discovery rate) ≤ 0.001 and |log2 Ratio| ≥ 1 were the thresholds employed to identify the significance of differential gene expression. GO functional enrichment analysis of DEUs in S. shirakii can acquire the results of GO functional classification annotation and enrichment analysis of DEUs. Corrected p-value ≤0.05 is the threshold to identify the enrichment GO term of DEUs.

4.4. Core RNAi Components Identification

Core RNAi homologous sequences from L. migratoria, S. gregaria and T. castaneum corresponding to these genes were used as a query to search the unigenes from S. shirakii for RNAi-related genes using the TBLASTN (ncbi-blast-2.2.24+-win32.exe) with E-value of 10−5. The RNAi components L. migratoria, S. gregaria and T. castaneum were as follows: AGO85968, AGO85968, AGO85968, XP_966668, XP_967454, XP_967454, XP_967454, XP_971282, XP_974696, AFY13245, AFY13245, AFY13246, AGO85972, AGO85972, AFY13246, AFQ00936, AFQ00936, AFQ00936, AFQ00936, AFQ00936, EFA02921, AGO85971, XP_001811159, EEZ99465 and JX516790. The core RNAi-related genes in L. migratoria or S. gregaria were first used as a query to search unigenes from S. shirakii. If the RNAi-related genes were not found with these two species, then T. castaneum RNAi sequences were used as the search query.

4.5. Identification of Genes Related to Insecticide Resistance and Phylogenetic Analysis

We identified the insecticide resistance-related sequences (P450s, CarEs and GSTs) using the BLASTX program in the Nr database with a cut-off E-value of 10−5. Contigs from the same cluster represent the same gene. If a cluster has several contigs, we just chose the longest one. Moreover, we removed the short sequences. The length of the sequences identified as putative CarEs and p450 genes <500 bp was considered to be short sequences, and the length of the sequences in GSTs <200 bp is considered to be short sequences. Some of these unigenes responded to the same gene. We identified different isoforms and transcripts based on mapping in the Nr database. The unigenes that were annotated in the same blast results were eliminated as allelic variants or as different parts of the same gene. In this case, we selected the longer unigenes.
We chose unigenes identified as P450s and D. melanogaster P450s superfamily protein sequences for phylogenetic analysis. Datasets for CarEs and GSTs were compiled using publicly available sequences from L. moratoria. Amino acid sequences were aligned using the ClustalX 2.0.10 version. The maximum likelihood trees were constructed using MEGA (Version 6.0.5, Koichiro Tamura, Tokyo, Japan) [50], employing the LG + G, WAG + I + G and LG + G amino-acid-substitution models for data of P450s, CarEs and GSTs, respectively, and node support was assessed using 1000 bootstrap replicates. The resulting trees were displayed using FigTree (Version 1.4.0, Andrew Rambaut, Edinburgh, UK) or MEGA (Version 6.0.5, Tamura K, Tokyo, Japan).

4.6. qRT-PCR

To validate transcriptome sequencing reliability, the same RNA samples for sequencing from adult and larval samples were used for qRT-PCR. We randomly selected seven unigenes to confirm their expressions. RNA levels were measured with the SYBR Premix ExTag quantitative PCR kit (Takara, Dalian, China), and the PCR conditions were as follows: 95 °C for 30 s, 40 cycles at 94 °C for 10 s, 60 °C for 34 s. DEUs’ expression was analyzed using CFX96 (Bio-Rad, Hercules, CA, USA). gapdh was used as the reference gene. The expression of the target genes relative to gapdh was assessed using the 2−ΔΔCt method. The experiments were repeated three times for each group, and the mean values were calculated. All of the primer sequences used for qRT-PCR are listed in Table S10.

4.7. SSRs Analysis

The MIcroSAtellite (MISA, http://pgrc.ipk-gatersleben.de/misa/) tool was used to identify SSRs with the parameters as follows: a minimum of six repeats for dinucleotide motifs, of five for trinucleotides, of four for tetranucleotides and of three for penta- and hexa-nucleotides. The SSRs with both ends on the unigene at a length of more than 150 bp were kept. The software Primer 3-2.3.4 was used to design primers.

Supplementary Materials

Supplementary materials can be found at https://www.mdpi.com/1422-0067/17/7/1110/s1.

Acknowledgments

The authors thank Sha Miao, Wang Xiaoyang, Zhou Fei and Hao Jing for sample collections. This work was supported by the National Nature Science Foundation of China (31172076, 31372192 and 31402019).

Author Contributions

Conceived of and designed the experiments: Yuan Huang. Performed the experiments: Zhongying Qiu, Fei Liu. Analyzed the data: Zhongying Qiu, Huimeng Lu, Hao Yuan, Qin Zhang. Wrote the paper: Zhongying Qiu.

Conflicts of Interest

The authors declare no conflict of interest.

References

  1. Cabrero, J.; Bugrov, A.; Warchalowska-Sliwa, E.; Lopez-Leon, M.D.; Perfectti, F.; Camacho, J.P. Comparative FISH analysis in five species of Eyprepocnemidine grasshoppers. Heredity 2003, 90, 377–381. [Google Scholar] [CrossRef] [PubMed]
  2. Li, C.X.; Ma, E.B.; Zheng, X.Y. Genetic differentiation of different populations of four locust species in China. Yi Chuan Xue Bao 2003, 30, 234–244. [Google Scholar] [PubMed]
  3. Raymond-Delpech, V.; Matsuda, K.; Sattelle, B.M.; Rauh, J.J.; Sattelle, D.B. Ion channels: Molecular targets of neuroactive insecticides. Invertebr. Neurosci. 2005, 5, 119–133. [Google Scholar] [CrossRef] [PubMed]
  4. Zhang, J.; Yang, M.; Jia, Q.; Guo, Y.; Ma, E.; Zhu, K.Y. Genomics-based approaches to screening carboxylesterase-like genes potentially involved in malathion resistance in oriental migratory locust (Locusta migratoria manilensis). Pest Manag. Sci. 2011, 67, 183–190. [Google Scholar] [CrossRef] [PubMed]
  5. Zhang, X.; Wang, J.; Zhang, M.; Qin, G.; Li, D.; Zhu, K.Y.; Ma, E.; Zhang, J. Molecular cloning, characterization and positively selected sites of the glutathione S-transferase family from Locusta migratoria. PLoS ONE 2014, 9, e114776. [Google Scholar] [CrossRef] [PubMed]
  6. Ketting, R.F. The many faces of RNAi. Dev. Cell 2011, 20, 148–161. [Google Scholar] [CrossRef] [PubMed]
  7. Zhang, H.; Li, H.C.; Miao, X.X. Feasibility, limitation and possible solutions of RNAi-based technology for insect pest control. Insect Sci. 2013, 20, 15–30. [Google Scholar] [CrossRef] [PubMed]
  8. Huvenne, H.; Smagghe, G. Mechanisms of dsRNA uptake in insects and potential of RNAi for pest control: A review. J. Insect Physiol. 2010, 56, 227–235. [Google Scholar] [CrossRef] [PubMed]
  9. Luo, Y.; Wang, X.; Yu, D.; Kang, L. The SID-1 double-stranded RNA transporter is not required for systemic RNAi in the migratory locust. RNA Biol. 2012, 9, 663–671. [Google Scholar] [CrossRef] [PubMed]
  10. Wynant, N.; Verlinden, H.; Breugelmans, B.; Simonet, G.; Vanden Broeck, J. Tissue-dependence and sensitivity of the systemic RNA interference response in the desert locust, Schistocerca gregaria. Insect Biochem. Mol. Biol. 2012, 42, 911–917. [Google Scholar] [CrossRef] [PubMed]
  11. Wynant, N.; Santos, D.; Verdonck, R.; Spit, J.; van Wielendaele, P.; Vanden Broeck, J. Identification, functional characterization and phylogenetic analysis of double stranded RNA degrading enzymes present in the gut of the desert locust, Schistocerca gregaria. Insect Biochem. Mol. Biol. 2014, 46, 1–8. [Google Scholar] [CrossRef] [PubMed]
  12. Tomoyasu, Y.; Miller, S.C.; Tomita, S.; Schoppmeier, M.; Grossmann, D.; Bucher, G. Exploring systemic RNA interference in insects: A genome-wide survey for RNAi genes in Tribolium. Genome Biol. 2008, 9, R10. [Google Scholar] [CrossRef] [PubMed]
  13. Zhang, X.; Allan, A.C.; Li, C.; Wang, Y.; Yao, Q. De Novo Assembly and Characterization of the Transcriptome of the Chinese Medicinal Herb, Gentiana rigescens. Int. J. Mol. Sci. 2015, 16, 11550–11573. [Google Scholar] [CrossRef] [PubMed]
  14. Zhang, Y.; Hao, Y.; Si, F.; Ren, S.; Hu, G.; Shen, L.; Chen, B. The De Novo Transcriptome and Its Analysis of the Worldwide Vegetable Pest, Delia antiqua (Diptera: Anthomyiidae). G3 (Bethesda) 2014, 4, 851–859. [Google Scholar] [CrossRef] [PubMed]
  15. Fernandez-Silva, I.; Whitney, J.; Wainwright, B.; Andrews, K.R.; Ylitalo-Ward, H.; Bowen, B.W.; Toonen, R.J.; Goetze, E.; Karl, S.A. Microsatellites for next-generation ecologists: A post-sequencing bioinformatics pipeline. PLoS ONE 2013, 8, e55990. [Google Scholar]
  16. Conesa, A.; Gotz, S.; Garcia-Gomez, J.M.; Terol, J.; Talon, M.; Robles, M. Blast2GO: A universal tool for annotation, visualization and analysis in functional genomics research. Bioinformatics 2005, 21, 3674–3676. [Google Scholar] [CrossRef] [PubMed]
  17. Tijet, N.; Helvig, C.; Feyereisen, R. The cytochrome P450 gene superfamily in Drosophila melanogaster: Annotation, intron-exon organization and phylogeny. Gene 2001, 262, 189–198. [Google Scholar] [CrossRef]
  18. Wynant, N.; Santos, D.; Vanden Broeck, J. Biological mechanisms determining the success of RNA interference in insects. Int. Rev. Cell Mol. Biol. 2014, 312, 139–167. [Google Scholar] [PubMed]
  19. Lv, J.; Liu, P.; Gao, B.; Wang, Y.; Wang, Z.; Chen, P.; Li, J. Transcriptome analysis of the Portunus trituberculatus: De novo assembly, growth-related gene identification and marker discovery. PLoS ONE 2014, 9, e94055. [Google Scholar] [CrossRef] [PubMed]
  20. Mittapalli, O.; Bai, X.; Mamidala, P.; Rajarapu, S.P.; Bonello, P.; Herms, D.A. Tissue-specific transcriptomics of the exotic invasive insect pest emerald ash borer (Agrilus planipennis). PLoS ONE 2010, 5, e13708. [Google Scholar] [CrossRef] [PubMed]
  21. Wei, D.D.; Chen, E.H.; Ding, T.B.; Chen, S.C.; Dou, W.; Wang, J.J. De novo assembly, gene annotation, and marker discovery in stored-product pest Liposcelis entomophila (Enderlein) using transcriptome sequences. PLoS ONE 2013, 8, e80046. [Google Scholar] [CrossRef] [PubMed]
  22. Upadhyay, S.K.; Singh, H.; Dixit, S.; Mendu, V.; Verma, P.C. Molecular Characterization of Vitellogenin and Vitellogenin Receptor of Bemisia tabaci. PLoS ONE 2016, 11, e0155306. [Google Scholar] [CrossRef] [PubMed]
  23. Wang, X.W.; Luan, J.B.; Li, J.M.; Bao, Y.Y.; Zhang, C.X.; Liu, S.S. De novo characterization of a whitefly transcriptome and analysis of its gene expression during development. BMC Genom. 2010, 11, 400. [Google Scholar] [CrossRef] [PubMed]
  24. Feyereisen, R. Evolution of insect P450. Biochem. Soc. Trans. 2006, 34, 1252–1255. [Google Scholar] [CrossRef] [PubMed]
  25. Claudianos, C.; Ranson, H.; Johnson, R.M.; Biswas, S.; Schuler, M.A.; Berenbaum, M.R.; Feyereisen, R.; Oakeshott, J.G. A deficit of detoxification enzymes: Pesticide sensitivity and environmental response in the honeybee. Insect Mol. Biol. 2006, 15, 615–636. [Google Scholar] [CrossRef] [PubMed]
  26. Zhang, J.; Li, D.; Ge, P.; Guo, Y.; Zhu, K.Y.; Ma, E.; Zhang, J. Molecular and functional characterization of cDNAs putatively encoding carboxylesterases from the migratory locust, Locusta migratoria. PLoS ONE 2014, 9, e94809. [Google Scholar] [CrossRef] [PubMed]
  27. Dabour, N.; Bando, T.; Nakamura, T.; Miyawaki, K.; Mito, T.; Ohuchi, H.; Noji, S. Cricket body size is altered by systemic RNAi against insulin signaling components and epidermal growth factor receptor. Dev. Growth Differ. 2011, 53, 857–869. [Google Scholar] [CrossRef] [PubMed]
  28. Belles, X. Beyond Drosophila: RNAi in vivo and functional genomics in insects. Annu. Rev. Entomol. 2010, 55, 111–128. [Google Scholar] [CrossRef] [PubMed]
  29. Karatolos, N.; Williamson, M.S.; Denholm, I.; Gorman, K.; Ffrench-Constant, R.H.; Bass, C. Over-expression of a cytochrome P450 is associated with resistance to pyriproxyfen in the greenhouse whitefly Trialeurodes vaporariorum. PLoS ONE 2012, 7, e31077. [Google Scholar] [CrossRef] [PubMed] [Green Version]
  30. Edi, C.V.; Djogbenou, L.; Jenkins, A.M.; Regna, K.; Muskavitch, M.A.; Poupardin, R.; Jones, C.M.; Essandoh, J.; Ketoh, G.K.; Paine, M.J.; et al. CYP6 P450 enzymes and ACE-1 duplication produce extreme and multiple insecticide resistance in the malaria mosquito Anopheles gambiae. PLoS Genet. 2014, 10, e1004236. [Google Scholar] [CrossRef] [PubMed]
  31. Guo, Y.; Wu, H.; Zhang, X.; Ma, E.; Guo, Y.; Zhu, K.Y.; Zhang, J. RNA interference of cytochrome P450 CYP6F subfamily genes affects susceptibility to different insecticides in Locusta migratoria. Pest Manag. Sci. 2016. [Google Scholar] [CrossRef] [PubMed]
  32. Grubor, V.D.; Heckel, D.G. Evaluation of the role of CYP6B cytochrome P450s in pyrethroid resistant Australian Helicoverpa armigera. Insect Mol. Biol. 2007, 16, 15–23. [Google Scholar] [CrossRef] [PubMed]
  33. Zhang, X.; Liu, X.; Ma, J.; Zhao, J. Silencing of cytochrome P450 CYP6B6 gene of cotton bollworm (Helicoverpa armigera) by RNAi. Bull. Entomol. Res. 2013, 103, 584–591. [Google Scholar] [CrossRef] [PubMed]
  34. Tang, T.; Zhao, C.; Feng, X.; Liu, X.; Qiu, L. Knockdown of several components of cytochrome P450 enzyme systems by RNA interference enhances the susceptibility of Helicoverpa armigera to fenvalerate. Pest Manag. Sci. 2012, 68, 1501–1511. [Google Scholar] [CrossRef] [PubMed]
  35. Zhang, J.; Li, D.; Ge, P.; Yang, M.; Guo, Y.; Zhu, K.Y.; Ma, E. RNA interference revealed the roles of two carboxylesterase genes in insecticide detoxification in Locusta migratoria. Chemosphere 2013, 93, 1207–1215. [Google Scholar] [CrossRef] [PubMed]
  36. Xu, L.; Duan, X.; Lv, Y.; Zhang, X.; Nie, Z.; Xie, C.; Ni, Z.; Liang, R. Silencing of an aphid carboxylesterase gene by use of plant-mediated RNAi impairs Sitobion avenae tolerance of Phoxim insecticides. Transgenic Res. 2014, 23, 389–396. [Google Scholar] [CrossRef] [PubMed]
  37. Kola, V.S.; Renuka, P.; Madhav, M.S.; Mangrauthia, S.K. Key enzymes and proteins of crop insects as candidate for RNAi based gene silencing. Front. Physiol. 2015, 6, 119. [Google Scholar] [CrossRef] [PubMed]
  38. Winston, W.M.; Molodowitch, C.; Hunter, C.P. Systemic RNAi in C. elegans requires the putative transmembrane protein SID-1. Science 2002, 295, 2456–2459. [Google Scholar] [CrossRef] [PubMed]
  39. Xu, H.J.; Chen, T.; Ma, X.F.; Xue, J.; Pan, P.L.; Zhang, X.C.; Cheng, J.A.; Zhang, C.X. Genome-wide screening for components of small interfering RNA (siRNA) and micro-RNA (miRNA) pathways in the brown planthopper, Nilaparvata lugens (Hemiptera: Delphacidae). Insect Mol. Biol. 2013, 22, 635–647. [Google Scholar] [CrossRef] [PubMed]
  40. Tribolium Genome Sequencing, C.; Richards, S.; Gibbs, R.A.; Weinstock, G.M.; Brown, S.J.; Denell, R.; Beeman, R.W.; Gibbs, R.; Beeman, R.W.; Brown, S.J.; et al. The genome of the model beetle and pest Tribolium castaneum. Nature 2008, 452, 949–955. [Google Scholar]
  41. Grabherr, M.G.; Haas, B.J.; Yassour, M.; Levin, J.Z.; Thompson, D.A.; Amit, I.; Adiconis, X.; Fan, L.; Raychowdhury, R.; Zeng, Q.; et al. Full-length transcriptome assembly from RNA-Seq data without a reference genome. Nat. Biotechnol. 2011, 29, 644–652. [Google Scholar] [CrossRef] [PubMed]
  42. Haas, B. J.; Papanicolaou, A.; Yassour, M.; Grabherr, M.; Blood, P.D.; Bowden, J.; Couger, M.B.; Eccles, D.; Li, B.; Lieber, M.; et al. De novo transcript sequence reconstruction from RNA-seq using the Trinity platform for reference generation and analysis. Nat. Protoc. 2013, 8, 1494–1512. [Google Scholar] [CrossRef] [PubMed]
  43. Pertea, G.; Huang, X.; Liang, F.; Antonescu, V.; Sultana, R.; Karamycheva, S.; Lee, Y.; White, J.; Cheung, F.; Parvizi, B.; et al. TIGR Gene Indices clustering tools (TGICL): A software system for fast clustering of large EST datasets. Bioinformatics 2003, 19, 651–652. [Google Scholar] [CrossRef] [PubMed]
  44. Iseli, C.; Jongeneel, C.V.; Bucher, P. ESTScan: A program for detecting, evaluating, and reconstructing potential coding regions in EST sequences. ISMB 1999, 99, 138–148. [Google Scholar]
  45. Simao, F.A.; Waterhouse, R.M.; Ioannidis, P.; Kriventseva, E.V.; Zdobnov, E.M. BUSCO: Assessing genome assembly and annotation completeness with single-copy orthologs. Bioinformatics 2015, 31, 3210–3212. [Google Scholar] [CrossRef] [PubMed]
  46. Eddy, S.R. Accelerated Profile HMM Searches. PLoS Comput. Biol. 2011, 7, e1002195. [Google Scholar] [CrossRef] [PubMed]
  47. Keller, O.; Kollmar, M.; Stanke, M.; Waack, S. A novel hybrid gene prediction method employing protein multiple sequence alignments. Bioinformatics 2011, 27, 757–763. [Google Scholar] [CrossRef] [PubMed]
  48. Mortazavi, A.; Williams, B.A.; McCue, K.; Schaeffer, L.; Wold, B. Mapping and quantifying mammalian transcriptomes by RNA-Seq. Nat. Methods 2008, 5, 621–628. [Google Scholar] [CrossRef] [PubMed]
  49. Audic, S.; Claverie, J.M. The significance of digital gene expression profiles. Genome Res. 1997, 7, 986–995. [Google Scholar] [PubMed]
  50. Tamura, K.; Stecher, G.; Peterson, D.; Filipski, A.; Kumar, S. MEGA6: Molecular Evolutionary Genetics Analysis version 6.0. Mol. Biol. Evol. 2013, 30, 2725–2729. [Google Scholar] [CrossRef] [PubMed]
Figure 1. Homology analysis of unigenes for S. shirakii. (A) E-value distribution of the top BLASTX hits against the Nr database for S. shirakii unigenes with an E-value cutoff of 10−5; (B) Similarity distribution of the top BLAST hits for each sequence; (C) Species distribution of the top S. shirakii sequence BLASTX hits. BLAST analysis against the non-redundant database was performed with an E-value cutoff of 10−5.
Ijms 17 01110 g001
Figure 2. Gene Ontology. Classification of S. shirakii unigenes based on Gene Ontology (GO).
Ijms 17 01110 g002
Figure 3. Clusters of orthologous group (COG) function classification of the S. shirakii unigenes.
Ijms 17 01110 g003
Figure 4. Comparison of unigene expression between adults and larvae of Shirakiacris shirakii. The differentially-expressed unigenes (DEUs) are shown in red and green, while blue indicates unigenes that were not differentially-expressed between the adults and larvae of S. shirakii. SsA represents the adults of S. shirakii; SsL represents the larvae of S. shirakii.
Ijms 17 01110 g004
Figure 5. The phylogenetic analysis of sequences encoding P450s from S. shirakii and D. melanogaster. Branch numbers represent bootstrap values (1000 replicates). The 79 S. shirakii unigenes encoding P450s are marked with filled red circles. The sequences used to reconstruct the maximum likelihood (ML) tree are available as S1 Data.
Ijms 17 01110 g005
Figure 6. The phylogenetic analysis of sequences encoding CarEs from S. shirakii and L. migratoria. Branch numbers represent bootstrap values (1000 replicates). The 36 S. shirakii unigenes encoding CarEs are marked with filled red circles. The sequences used to reconstruct the maximum likelihood (ML) tree are available as S2 Data.
Ijms 17 01110 g006
Figure 7. Statistics of simple sequence repeat (SSR) nucleotide classes found in the transcriptome of S. shirakii.
Ijms 17 01110 g007
Figure 8. Differential expression of DEUs in S. shirakii. (A) Gene expression data obtained by qRT-PCR analysis. Expression ratios of seven genes in SsL compared to SsA; (B) The fold changes of the genes were calculated as the SsL/SsA comparison and are shown on the y-axis. SsA represents the adults of S. shirakii; SsL represents the larvae of S. shirakii; (C) Correlation between the expression fold change level of DEUs between adults and larvae.
Ijms 17 01110 g008aIjms 17 01110 g008b
Table 1. Summary for the S. shirakii transcriptome after the Illumina sequencing.
ParametersAdultLarvaeAll
Raw reads58,063,25862,093,046120,156,304
Total clean reads51,299,51654,109,362105,408,878
Total Nucleotides (bp)4,616,956,4404,869,842,580-
Q20 1 percentage (%)97.45%97.42%-
N percentage (%)00-
Total length of contigs (nt)39,306,38754,595,446-
Total length of unigenes (nt)35,186,30549,464,707-
Number of unigenes69,18993,94874,657
Mean size of contigs (nt)290292-
Mean size of unigenes (nt)509527680
N50 2 of contigs (nt)428445
N50 2 of unigenes (nt)7228001057
GC content (%)47.93%45.31%-
1 The percentage of sequences at a sequencing error rate of less than 1%; 2 N50 is used to measure the continuity of the assembly; the greater the value, the better the assembly is. The calculation method is as follows: first, we ranked the transcripts according to their length in descending order, then accumulated one by one to 50% of the total length of all transcripts; the length of the last accumulated transcript is N50.
Table 2. The number of unigenes that were annotated with the databases of the NCBI non-redundant protein sequences (Nr), NCBI non-redundant nucleotide sequences (Nt), a manually annotated and reviewed protein sequence database (Swiss-Prot), Kyoto Encyclopedia of Genes and Genomes (KEGG), Clusters of orthologous group (COG) and Gene Ontology (GO).
Database NameNrNtSwiss-ProtKEGGCOGGOAll
Numbers25,65212,67120,43818,053955812,06128,173
Table 3. Kyoto Encyclopedia of Genes and Genomes (KEGG) pathway mapping for S. shirakii.
KEGG PathwaysSub-PathwaysNumbers of Unigenes
MetabolismMetabolic pathways2520
Carbohydrate metabolism978
Energy metabolism204
Lipid metabolism745
Nucleotide metabolism575
Amino acid metabolism895
Metabolism of other amino acids288
Glycan biosynthesis and metabolism493
Metabolism of cofactors and vitamins422
Metabolism of terpenoids and polyketides184
Biosynthesis of other secondary metabolites22
Xenobiotics biodegradation and metabolism345
Genetic Information ProcessingTranscription945
Translation1398
Folding, sorting and degradation1115
Replication and repair337
Environmental Information ProcessingMembrane transport313
Signal transduction1603
Signaling molecules and interaction884
Cellular ProcessesTransport and catabolism1262
Cell motility804
Cell growth and death597
Cellular community1218
Organismal SystemsImmune system1307
Endocrine system907
Circulatory system475
Digestive system1399
Excretory system454
Nervous system806
Sensory system165
Development538
Environmental adaptation89
Table 4. Overview of identified unigenes related to the RNAi pathways in S. shirakii, and the RNAi-related unigene sequences are listed in the S4 Data.
GeneUnigeneLength (bp)E-ValueIdentitySpecies HomologueACCESSION
mirRNA
Ago-1Unigene6375_SsASsL11220100%L. migratoriaAGO85968
Unigene24483_SsASsL6127.00 × 10−122100%L .migratoriaAGO85968
Unigene10467_SsASsL4443.00 × 1082100%L. migratoriaAGO85968
LoqsUnigene5566_SsASsL3453.00 × 10−12165%T. castaneumXP_966668
DroshaUnigene22829_SsASsL3392.00 × 104778%T. castaneumXP_967454
Unigene718_SsASsL3003.00 × 106774%T. castaneumXP_967454
Unigene18278_SsASsL3123.00 × 105178%T. castaneumXP_967454
PashaUnigene1479_SsASsL6725.00 × 102759%T. castaneumXP_971282
Exportin-5Unigene24927_SsASsL10982.00 × 10−10560%T. castaneumXP_974696
siRNA
Dicer-2Unigene11038_SsASsL5314.00 × 108887%S. gregariaAFY13245
Unigene24754_SsASsL2377.00 × 106578%S. gregariaAFY13245
Ago-2Unigene19329_SsASsL1737088%S. gregariaAFY13246
072%L. migratoriaAGO85972
Unigene24512_SsASsL2742078%L. migratoriaAGO85972
068%S. gregariaAFY13246
Sid-1Unigene8511_SsASsL2344.00 × 10−14296%L. migratoriaAFQ00936
Unigene18465_SsASsL6244.00 × 109992%L. migratoriaAFQ00936
Unigene24347_SsASsL4742.00 × 107599%L. migratoriaAFQ00936
Unigene10814_SsASsL3518.00 × 104794%L. migratoriaAFQ00936
Unigene39691_SsASsL2017.00 × 10−2992%L. migratoriaAFQ00936
piRNA
Ago-3Unigene11235_SsASsL10624.00 × 109245%T. castaneumEFA02921
Piwi3Unigene24609_SsASsL2439049%L. migratoriaAGO85971
AubUnigene11344_SsASsL12128.00 × 10−13554%T. castaneumXP_001811159
ZucchiniUnigene5197_SsASsL6841.00 × 10−2032%T. castaneumEEZ99465
Eri-1Unigene17265_SsASsL6094.00 × 10−12193%S. gregariaJX516790

