Article

Functional and Activity Analysis of Cattle UCP3 Promoter with MRFs-Related Factors

1
Key Laboratory of Animal Genetics, Breeding and Reproduction in the Plateau Mountainous Region, Guizhou University, Guiyang 550025, China
2
College of Animal Science, Guizhou University, Guiyang 550025, China
3
College of Life Science, Guizhou University, Guiyang 550025, China
*
Author to whom correspondence should be addressed.
Int. J. Mol. Sci. 2016, 17(5), 682; https://doi.org/10.3390/ijms17050682
Submission received: 27 March 2016 / Revised: 9 April 2016 / Accepted: 13 April 2016 / Published: 5 May 2016
(This article belongs to the Section Biochemistry)

Abstract

:
Uncoupling protein 3 (UCP3) is mainly expressed in muscle. It plays an important role in muscle, but less research on the regulation of cattle UCP3 has been performed. In order to elucidate whether cattle UCP3 can be regulated by muscle-related factors, deletion of cattle UCP3 promoter was amplified and cloned into pGL3-basic, pGL3-promoter and PEGFP-N3 vector, respectively, then transfected into C2C12 myoblasts cells and UCP3 promoter activity was measured using the dual-Luciferase reporter assay system. The results showed that there is some negative-regulatory element from −620 to −433 bp, and there is some positive-regulatory element between −433 and −385 bp. The fragment (1.08 kb) of UCP3 promoter was cotransfected with muscle-related transcription factor myogenic regulatory factors (MRFs) and myocyte-specific enhancer factor 2A (MEF2A). We found that UCP3 promoter could be upregulated by Myf5, Myf6 and MyoD and downregulated by MyoG and MEF2A.

1. Introduction

Uncoupling protein 3 (UCP3) is a member of the family of uncoupling proteins (UCPs), which are members of the mitochondrial anion carrier family. UCPs consist of seven members: UCP1, UCP2, UCP3, UCP4, BMCP1 (brainmitochondrial carrier protein 1), StUCP (plant UCP homologs have been identified in Solanum tuberosum) and AtUCP (Arabidopsis thaliana) [1,2]. UCP3 was first discovered and described in 1997 [3,4]. Because of its close homology with UCP1, UCP3 was initially implicated in thermoregulation [3,4], as it has been demonstrated to uncouple in a number of experimental models. Uncoupling protein-3 (UCP3) gene is primarily expressed in skeletal muscle and up-regulated by fatty acids [5]. UCP3 is primarily expressed in skeletal muscle, but is also found in brown fat and heart tissue [6]. UCP3 protein is one of the most important target proteins involved in skeletal muscle energy metabolism substance, and plays key regulatory roles in mitochondrial fatty acid oxidation [7,8,9,10,11]. Until recently, the eukaryotic core promoter recognition complex played a critical regulatory role in driving cell specific programs of transcription during development [12]. Several studies have shown that a transcription factor not only plays a control function in gene expression, but also inhibits the action of the complex combination [13]. MyoD controls UCP3 promoter activity through a noncanonical E box site located close to the transcription initiation site [5]; in this context, it is important to note that the MyoD response element is located at different positions in rats compared to mice/humans, which may cause species-specific differences in UCP3 expression [14]. The study of the molecular mechanisms of this transcription element have shown that it can synthesize muscle specific activity of the promoter, some promoters have been synthesized that have high expressing activity specificity in the muscle. With continuous development and improvement of the research, the regulation of muscle-specific promoter element values to control muscle-specific promoter elements will become a powerful tool for animal muscle development research [15].
Guanling cattle are a yellow-coated breed that was developed in China [16]. In this study, 5′ upstream regions of UCP3 of Guanling cattle were analyzed, and PCR amplified segments of different length UCP3 gene promoter sequences, different length fragments of UCP3 promoter activity and the core of UCP3 promoter were tested. Transcription factor binding sites of cattle UCP3 promoter were screened using Promoter-Binding transcription factors (TF) Profiling assay combined with bioinformatics analysis, and we identified several transcription factor binding sites for UCP3. We investigated whether the UCP3 promoter activity could be increased by myogenic regulatory factors (MRFs) family and myocyte-specific enhancer factor 2A (MEF2A) transcriptional factors. These results of cattle UCP3 promoter provide a platform for further researche on promoter activity and expression regulation. The results are meaningful in the research of muscle-specific promoters and the mechanism of cattle’s muscle development and growth.
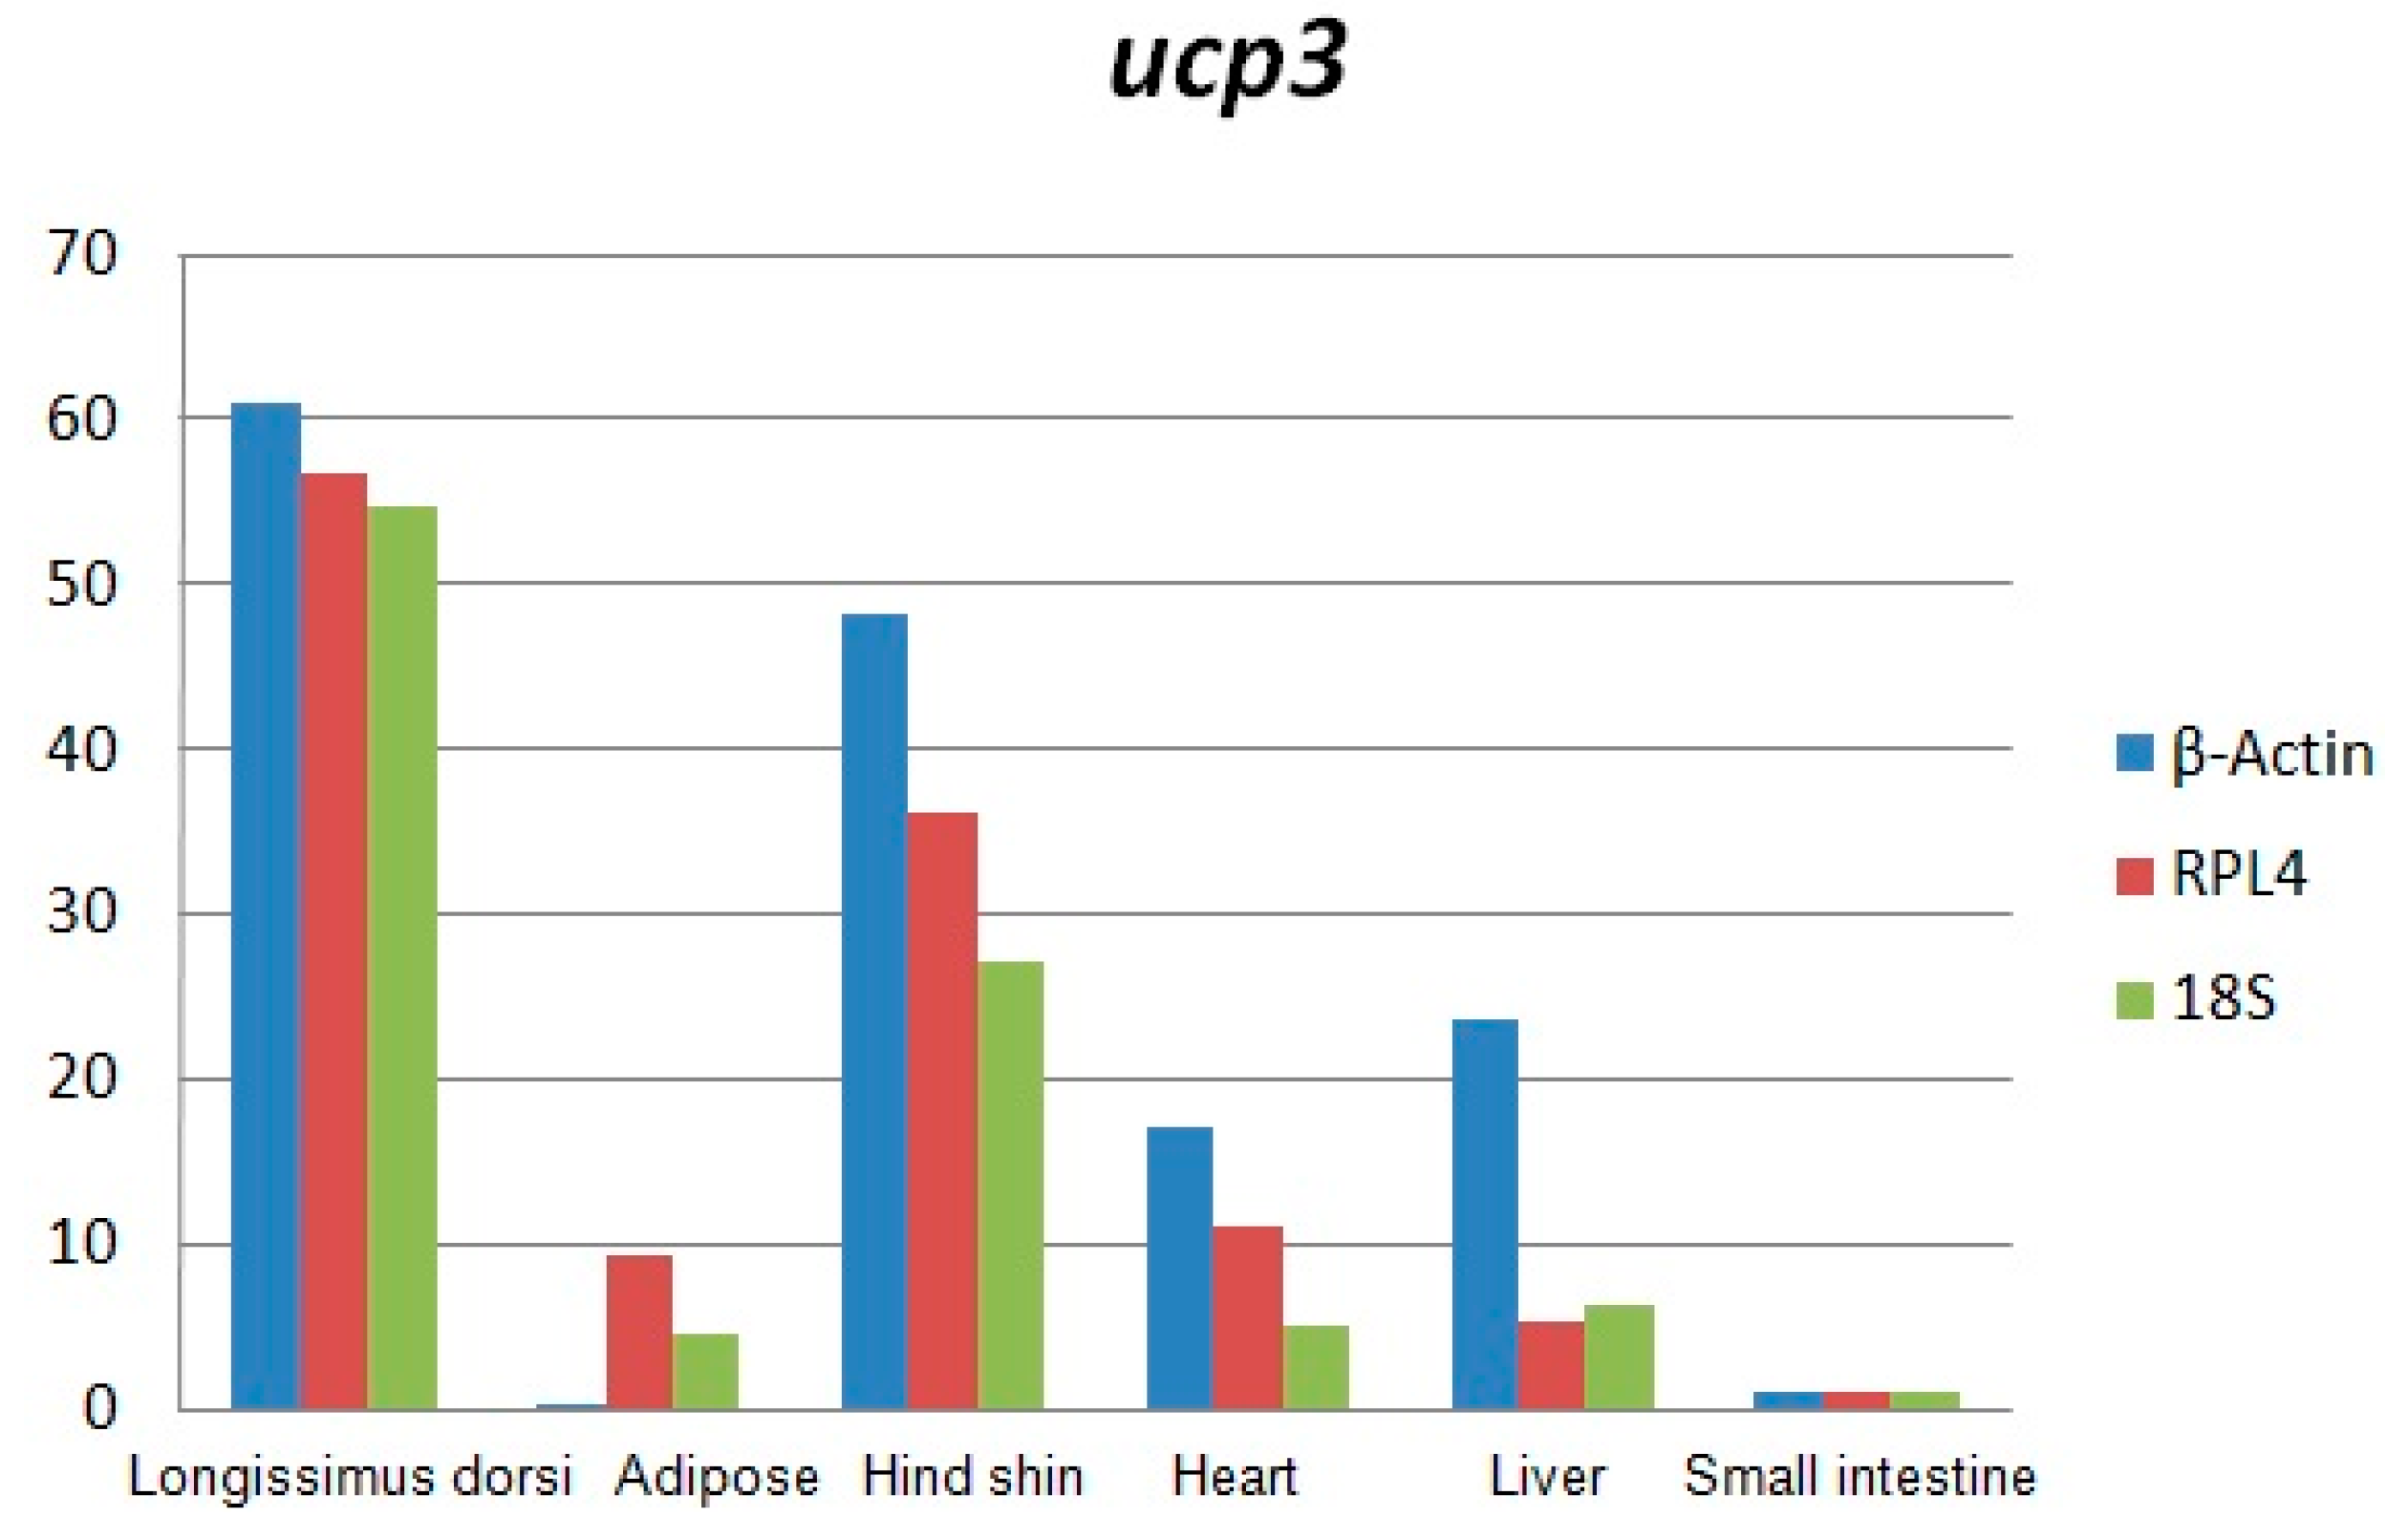
2. Results

2.1. Analysis of Uncoupling Protein 3 (UCP3) Gene Using qRT-PCR

Total RNA was analyzed by 2100 expert_Eukaryote Total RNA Nano and Agarose gel electrophoresis (Figure 1 and Figure 2). The results showed that purity, number and integrity of RNA samples conformed to the requirements of the experiments. The levels of UCP3 gene expression in the longissimus dorsi, adipose tissue, hind shin, heart, liver, and small intestine tissues were recorded using qRT-PCR. The result showed that expression of the UCP3 was at a high level in longissimus dorsi and hind shin tissues. The lowest level was in small intestine (Figure 3), and the results showed consistent expression of β-actin, RPL4 and 18S RNA in six tissues. The qRT-PCR data confirmed that the ucp3 was tissue-specifically expressed in the longissimus dorsi and hind shin.

2.2. Cloning and Activity Analysis of the Cattle ucp3 Promoter

The result shows that the eukaryotic expression vectors pGL3-basic-ucp3-pro and pGL3-promoter-ucp3-pro were constructed successfully (Figure 4 and Figure 5). The promoter activities of the different deleted regions were measured in C2C12 myoblasts cells. A series of pGL3-basic-ucp3-pro and pGL3-promoter-ucp3-pro recombinant vectors with different fragmens of UCP3 promoter were constructed (Figure 4 and Figure 5) to determine the minimal promoter region of UCP3 promoter. The results indicate that the deletion plasmid pGL3-basic-ucp3-P5 containing the promoter region from −433 to +3 bp and the plasmid pGL3-ucp3-P6 containing the promoter region from −385 to +3 bp had significant activity compared to pGL3-basic. These results suggest that the sequence from −385 to +3 bp has the minimal regulatory region that contains the transcription start site necessary for ucp3 promoter activity (Figure 4A,B). The 5′-upstream region from −433 to +3 bp of the UCP3 promoter only induced 4-fold increases, which is lower than the increases associated with the pGL3-basic in the luciferase activities. Our data show that the 5′-flanking region of UCP3 from −385 to +3 bp contains the basal promoter element of the cattle UCP3.
pGL3-basic-ucp3-P5 had low promoter activity, but pGL3-promoter-ucp3-p5 and pGL3-promoter-ucp3-p6 exhibited significantly higher promoter activity (96.54 ± 3.96 and 95.25 ± 3.91 relative luciferase units (RLU), relative to pGL3-basic) (Figure 5A,B). This difference in the promoter activities between different segments of UCP3 promoter suggests that additional factors can increase the promoter activity of UCP3. The result showed that the trend of relative luciferase activity units of different pGL3-basic-ucp3-pro/pGL3-basic were similar to those of pGL3-basic/pGL3-basic (Figure 5). In contrast, the relative luciferase activity units of pGL3-promter-ucp3-pro/pGL3-basic increased, with a 20-fold to 100-fold increase observed compared to that for pGL3-promoter-ucp3-pro/pGL3-basic (Figure 5). These results indicate that the additional promoter had a positive affect on the expression of the target gene before UCP3 promoter.

2.3. Expression of PEGFP-N3-ucp3-pro in C2C12 Cell Line

In this study, plasmid PEGFP-N3-ucp3-pro and PEGFP-N3 transfection C2C12 cells after 48 h were observed with an inverted fluorescence microscope to determine the fluorescence peak of the recombinant plasmid expression in C2C12 cells. The results show that Eukaryotic expression vector PEGFP-N3-ucp3-pro was successfully constructed (Figure 6). Green fluorescent protein were partly expressed in the cytoplasm and nuclei of C2C12 cells, but non-existent in PEGFP-N3-ucp3-P4. Green fluorescence was expressed in various strengths in different segments of the promoter. The result showed that PEGFP-N3 > PEGFP-N3-ucp3-P6 > PEGFP-N3-ucp3-P5 > PEGFP-N3-ucp3-P2 > PEGFP-N3-ucp3-P3 > PEGFP-N3-ucp3-P1 > PEGFP-N3-ucp3-P4. The six promoters that were constructed have differential promoter activity: the promoter activity of P6 and P5 promoter are the highest. The region from −385 to +3 bp contains the functional promoter of the cattle UCP3 promoter, it is regarded as the core promoter of UCP3 and is consistent with the result of pGL3-basic-ucp3-pro.

2.4. The Screening of Transcription Factor by Promoter-Binding Transcription Factors (TF) Profiling Assay II

The screening of transcription factor of UCP3 promoter using promoter-binding TF profiling Assay II detects the experimental results by multifunctional microplate chemiluminescence detection function. The data obtained by the experimental methods deals with the data analysis processing value. The processing value represents the intensity of luminosity. In essence, it represents the probe number after the nuclear extracts corresponding transcription factor binding probe has been eluted. Indirectly, it indicates whether the promoter region contains the transcription factor binding sites. The results from the data processing point of view could determine that the UCP3 promoter region had MEF2, MyoD, MZF, pax-5, PPAR, SATB1, TFIID, HOX4C, Nkx2-5, Nkx3-2, Pax3, MEF1, Snail, NRF2 (ARE) transcription factor binding sites (Figure 7). The predictions of transcription factor binding sites of Guanling cattle ucp3 promoter region by online software show that it contains MyoD, MZF1 and Nkx-2 transcription factor binding sites (Table 1 and Table 2). In summary, Guanling cattle UCP3 promoter regions had MyoD, TFIID, Pax3, MEF1, MEF2 transcription factor binding sites.

2.5. Effect of Transcription Factors on UCP3 Promoter Activity

By design, restriction enzyme sites contain primers and high-fidelity enzymes to enable the cloning of coding area sequence of MRFs family and MEF2A, and insert the fragment orientation to the eukaryotic expression vector pcDNA3.1(+) polyclonal loci of the plasmid. Coding area sequence of the MRFs family and MEF2A were cloned through double enzyme digestion and sequenced. The result shows that the eukaryotic expression vector pcDNA3.1(+)-MRFs family and pcDNA3.1(+)-MEF2A were constructed successfully (Figure 8), as a base for expression of MRFs family and MEF2A transcription factors in the eukaryocyte.
MRFs family and MEF2A potential activate an UCP3 promoter fragment of 1080 bp were detected through dual luciferase reporter gene assay after cotransfection. To evaluate the influence of the MRFs family and MEF2A we compared cotransfections with or without expression vectors for MyoD, Myf5, Myf6, MyoG and MEF2A factors known to regulate UCP3 promoter expression (Figure 8). In the pGL3-basic-ucp3-p1 transfected group, the pGL3-basic vector showed responsiveness to the co-expression of Myf5, Myf6 or MyoD alone respectively. For pGL3-basic-ucp3-p1, the activity increased 1.4-fold more by Myf5, 3.3-fold more by Myf6, and 2-fold more by MyoD, compared to the activities in C2C12 cells transfected with pGL3-Basic.This indicates that the increases in the activity of the UCP3 promoter are brought about by the transcription factors Myf5, Myf6 and MyoD. In contrast, the co-expression of MyoG and MEF2A resulted in only 0.37- and 0.32-fold changes of luciferase activity, respectively.These results indicate that MyoG and MEF2A have a negative regulation role of UCP3 promoter.

3. Discussion

The results of this study showed that the expression of the UCP3 was almost undetectable in small intestine and adipose. However, the expression of the UCP3 in longissimus dorsi and hind shin tissue were about 60-fold and 40-fold greater than the expression of UCP3 in adipose and the small intestine, and about 6-fold and 4-fold greater than the in liver and heart, suggesting it has characteristics of high efficiency, and specificity expression in skeletal muscle, which was consistent with the observation that the preferential expression of UCP3 in skeletal muscle and brown fat [3,17,18,19,20] and the UCP3 promoter being activated in the muscle cell differentiation process [21].
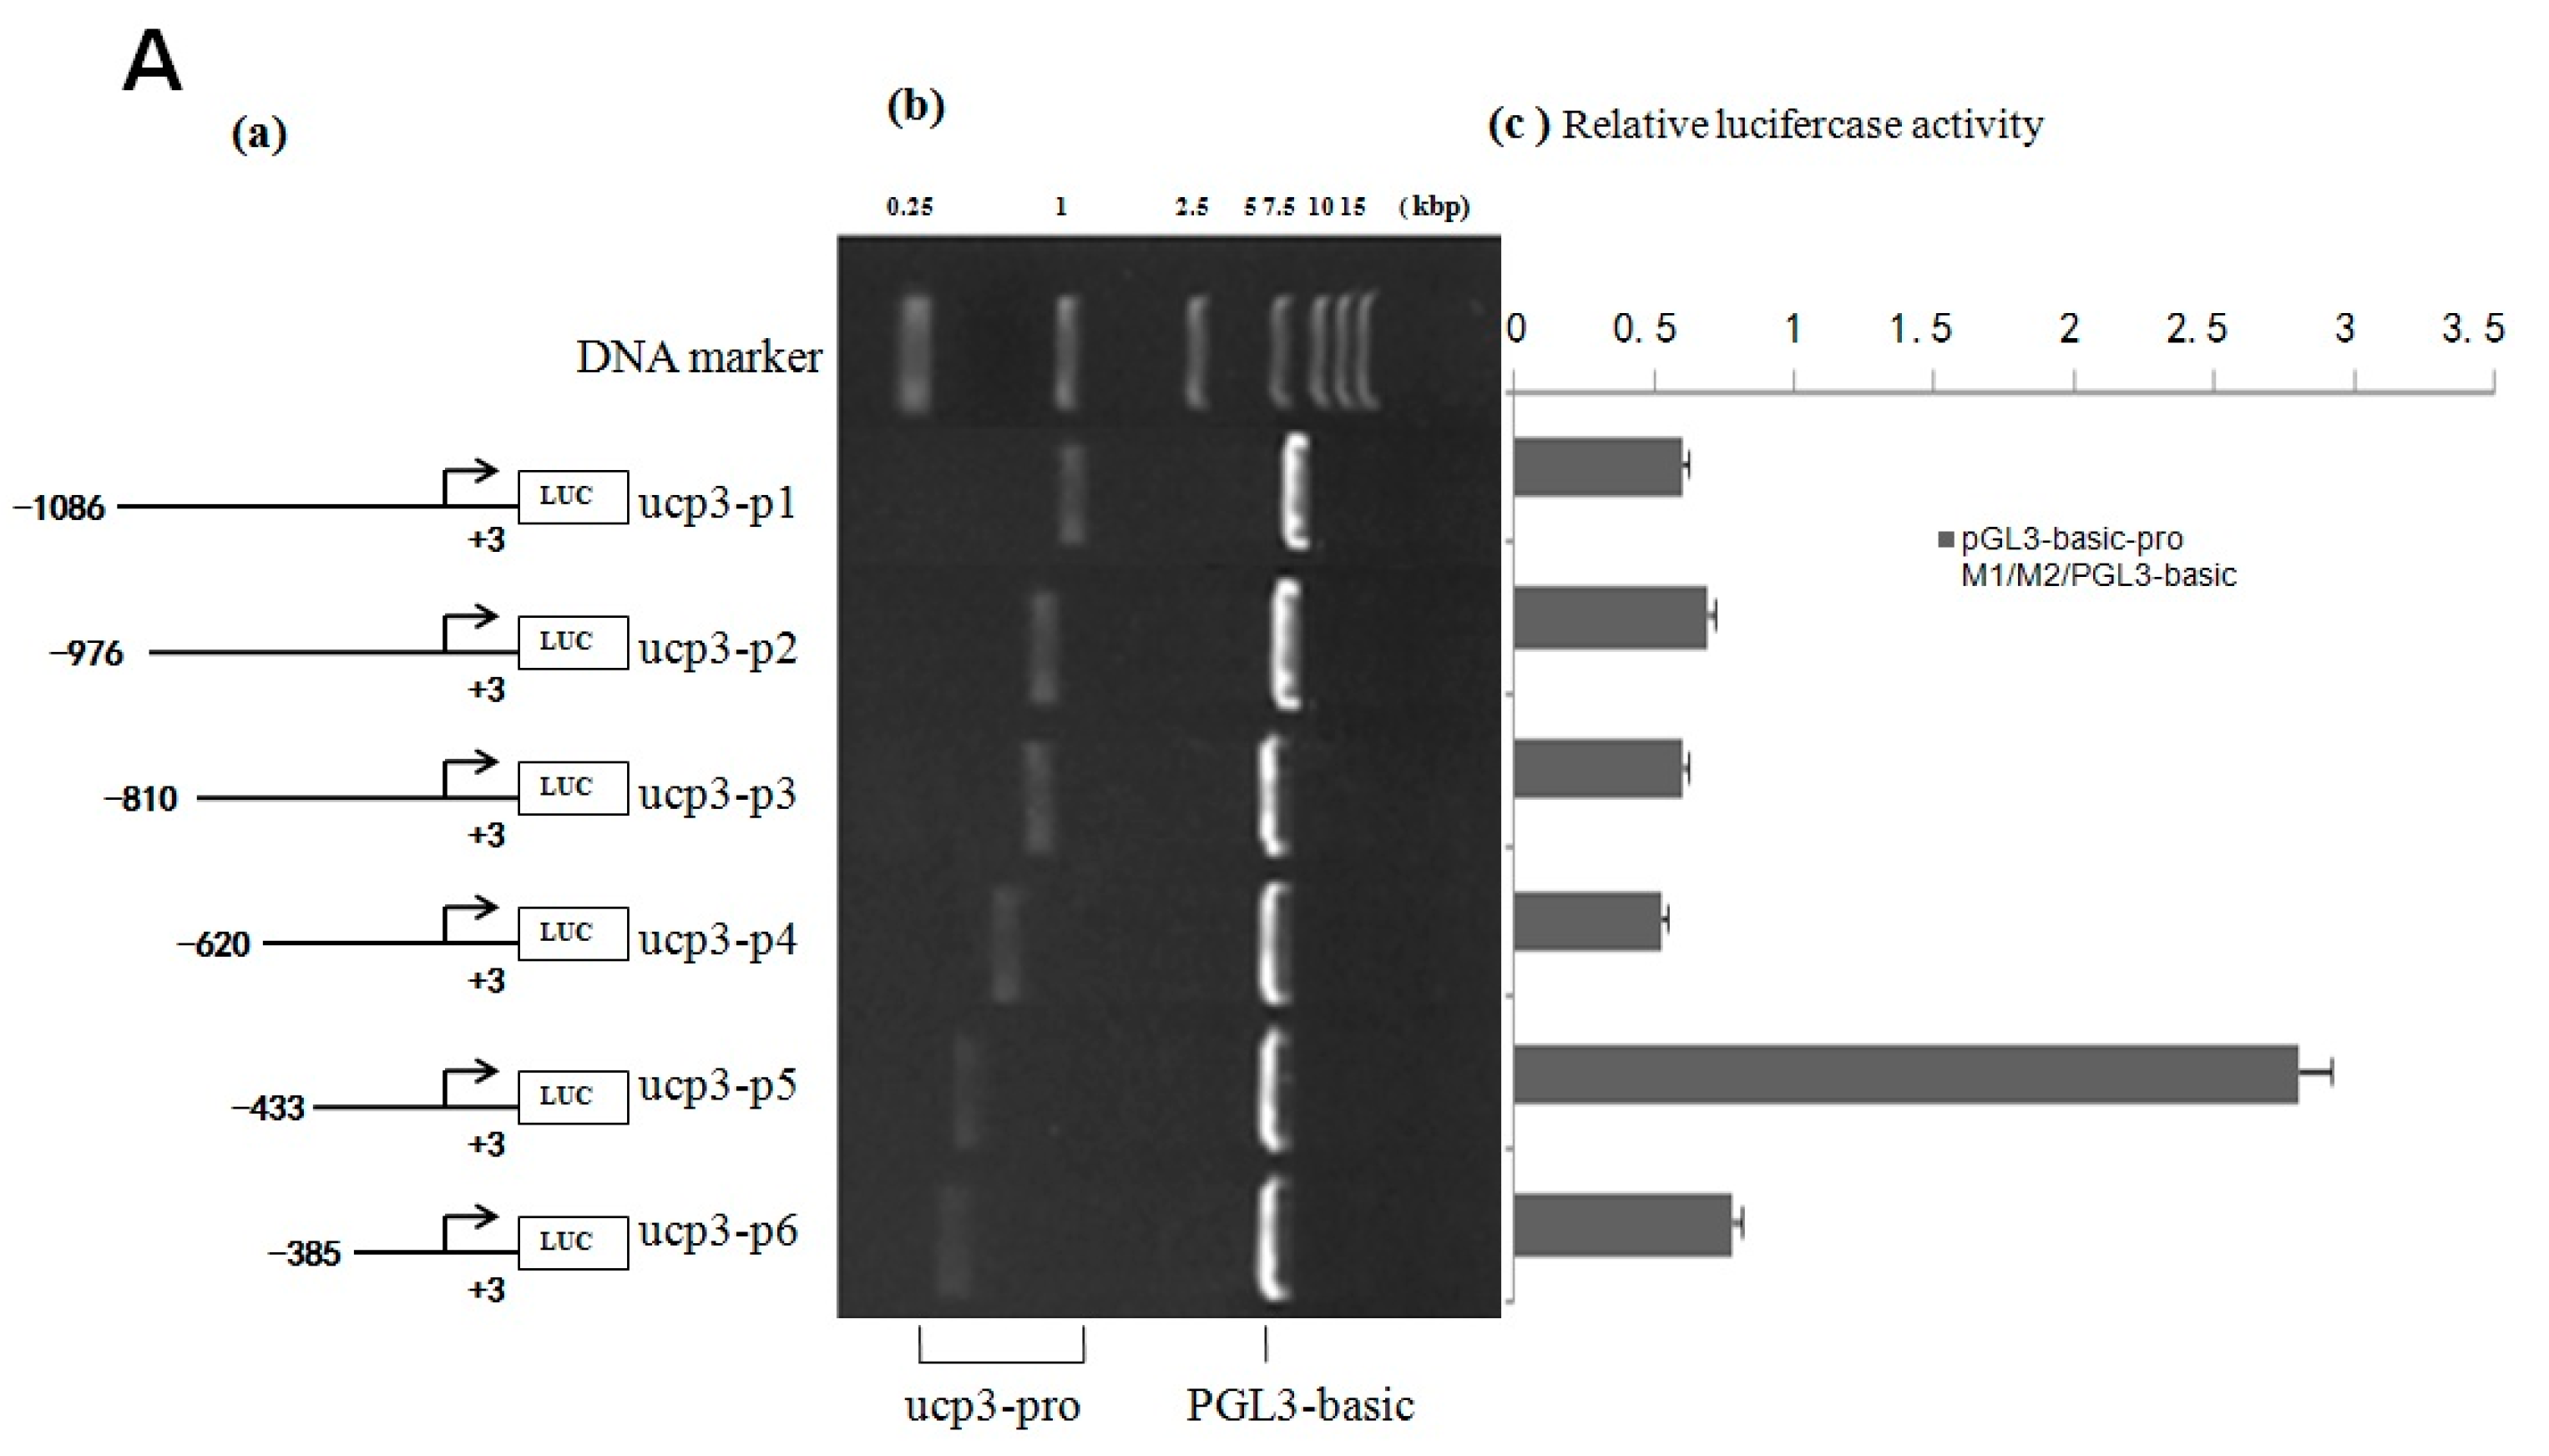
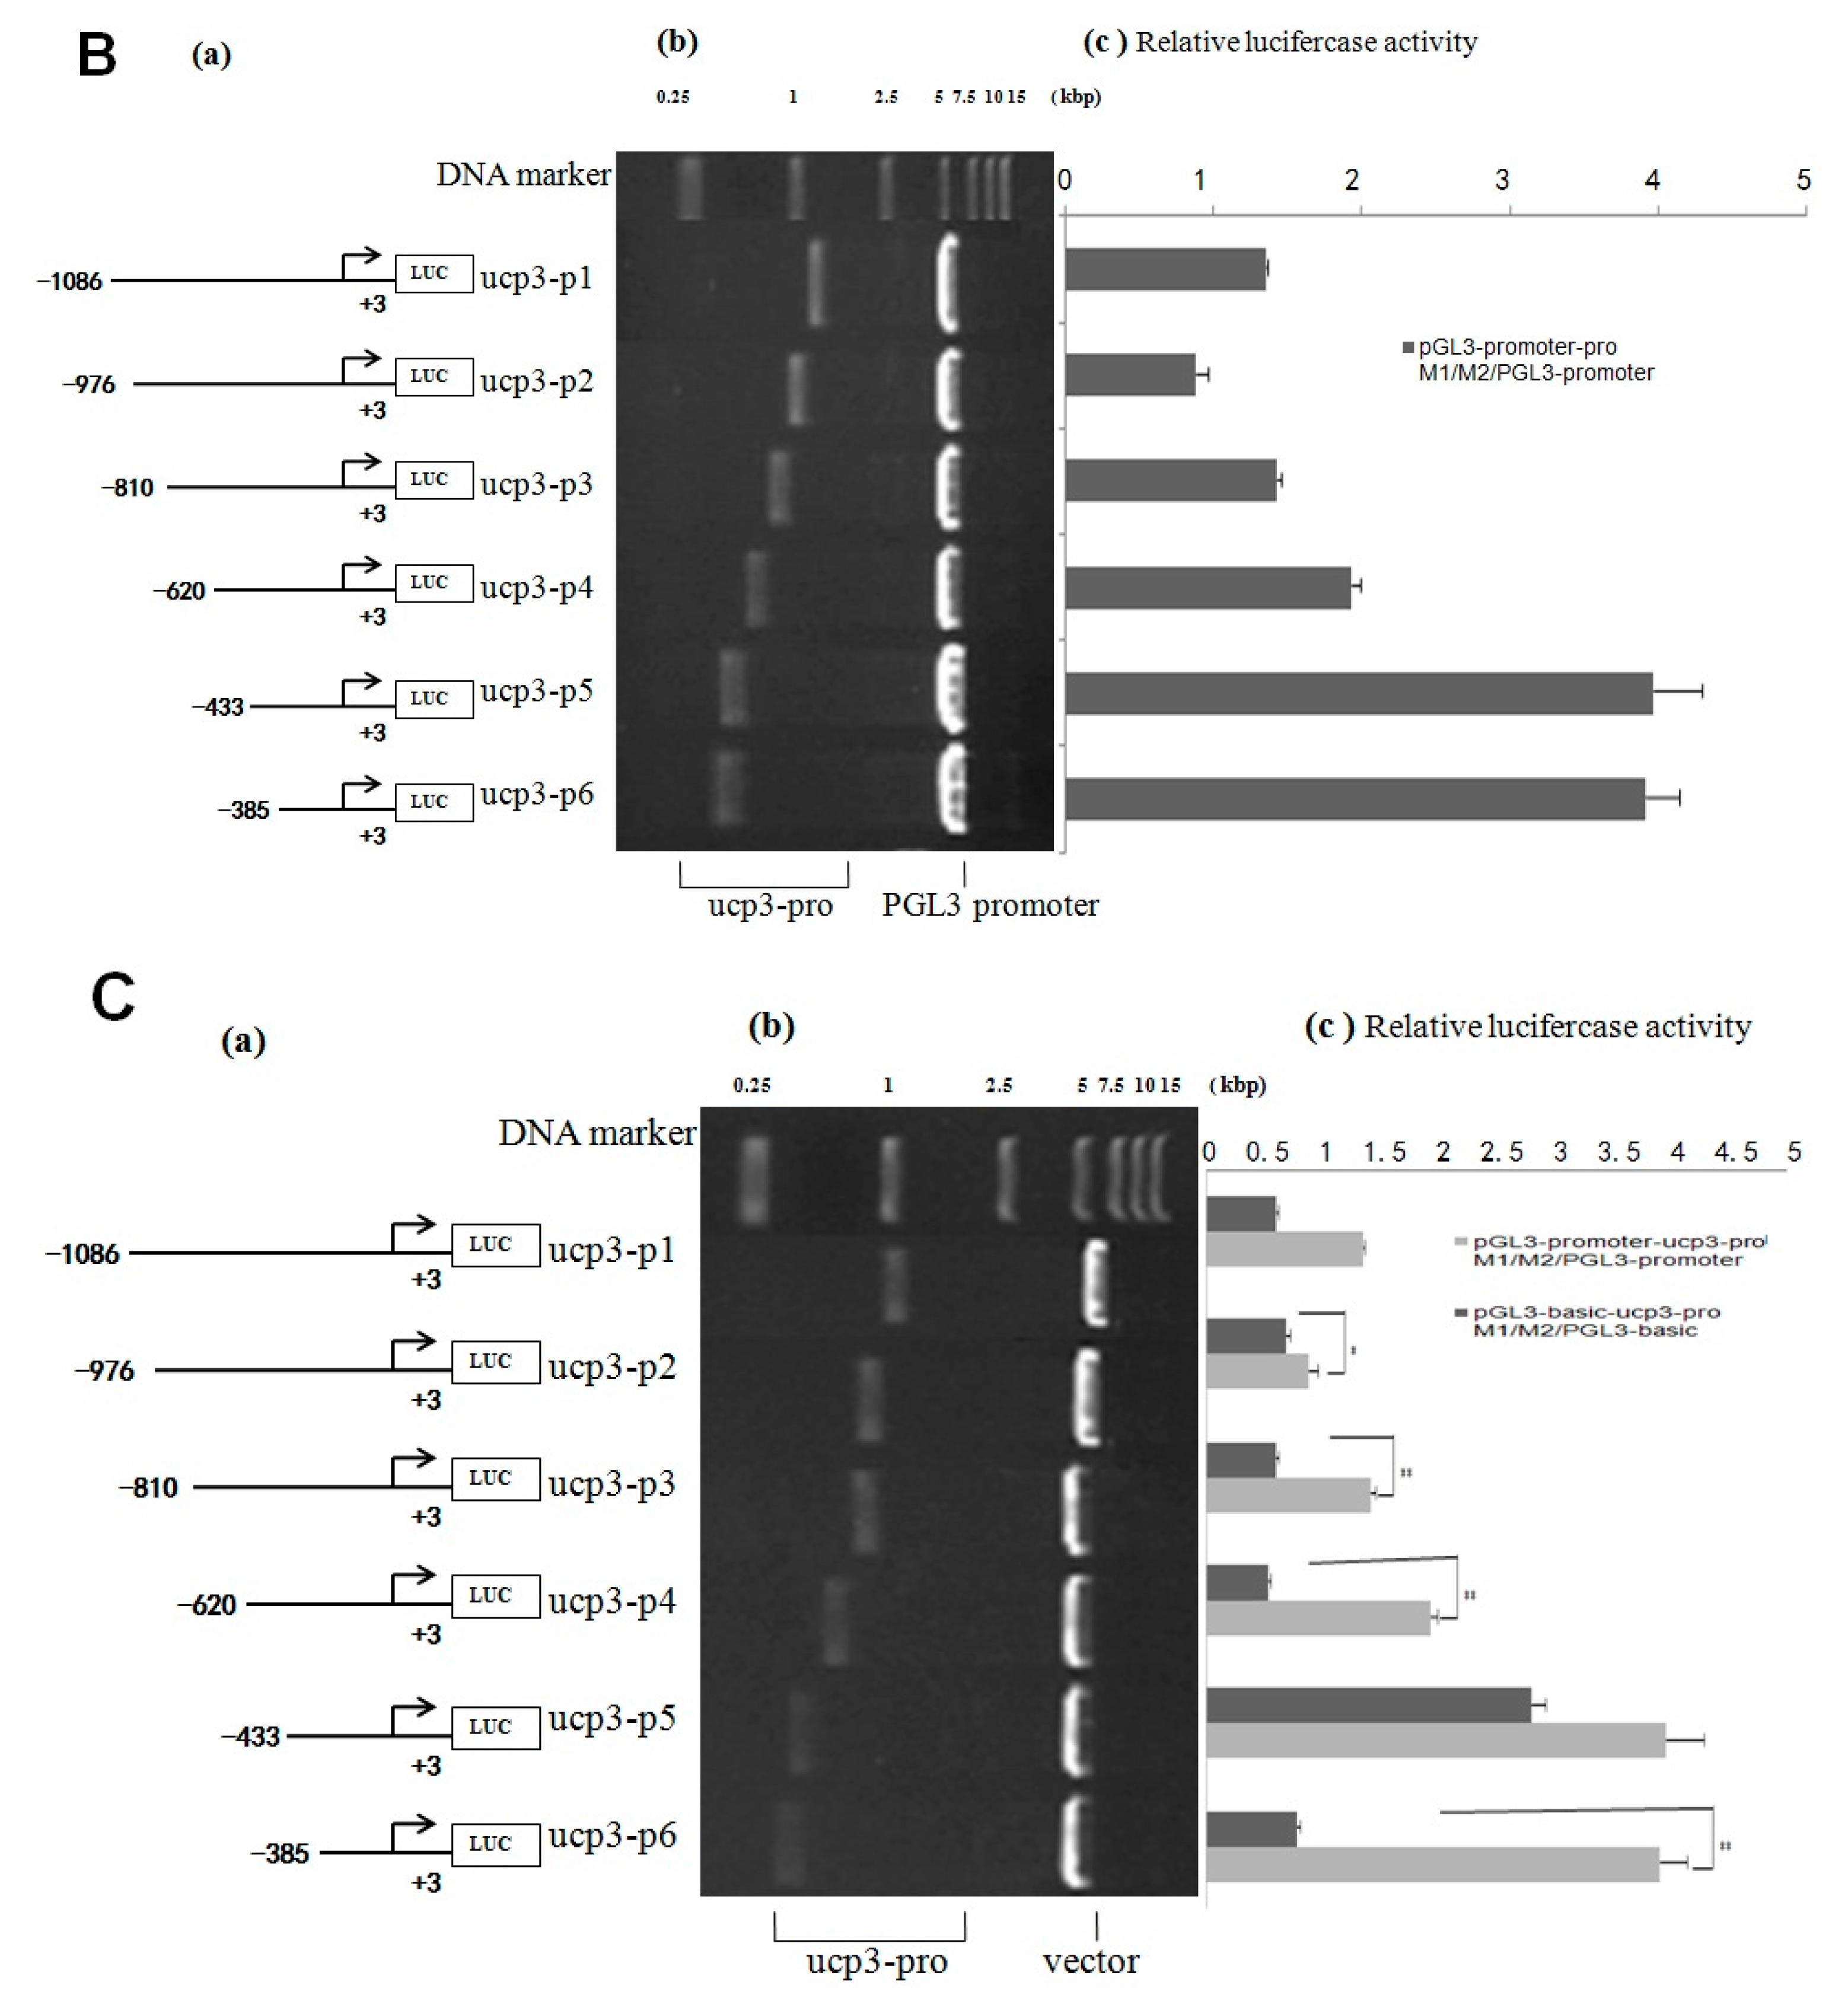
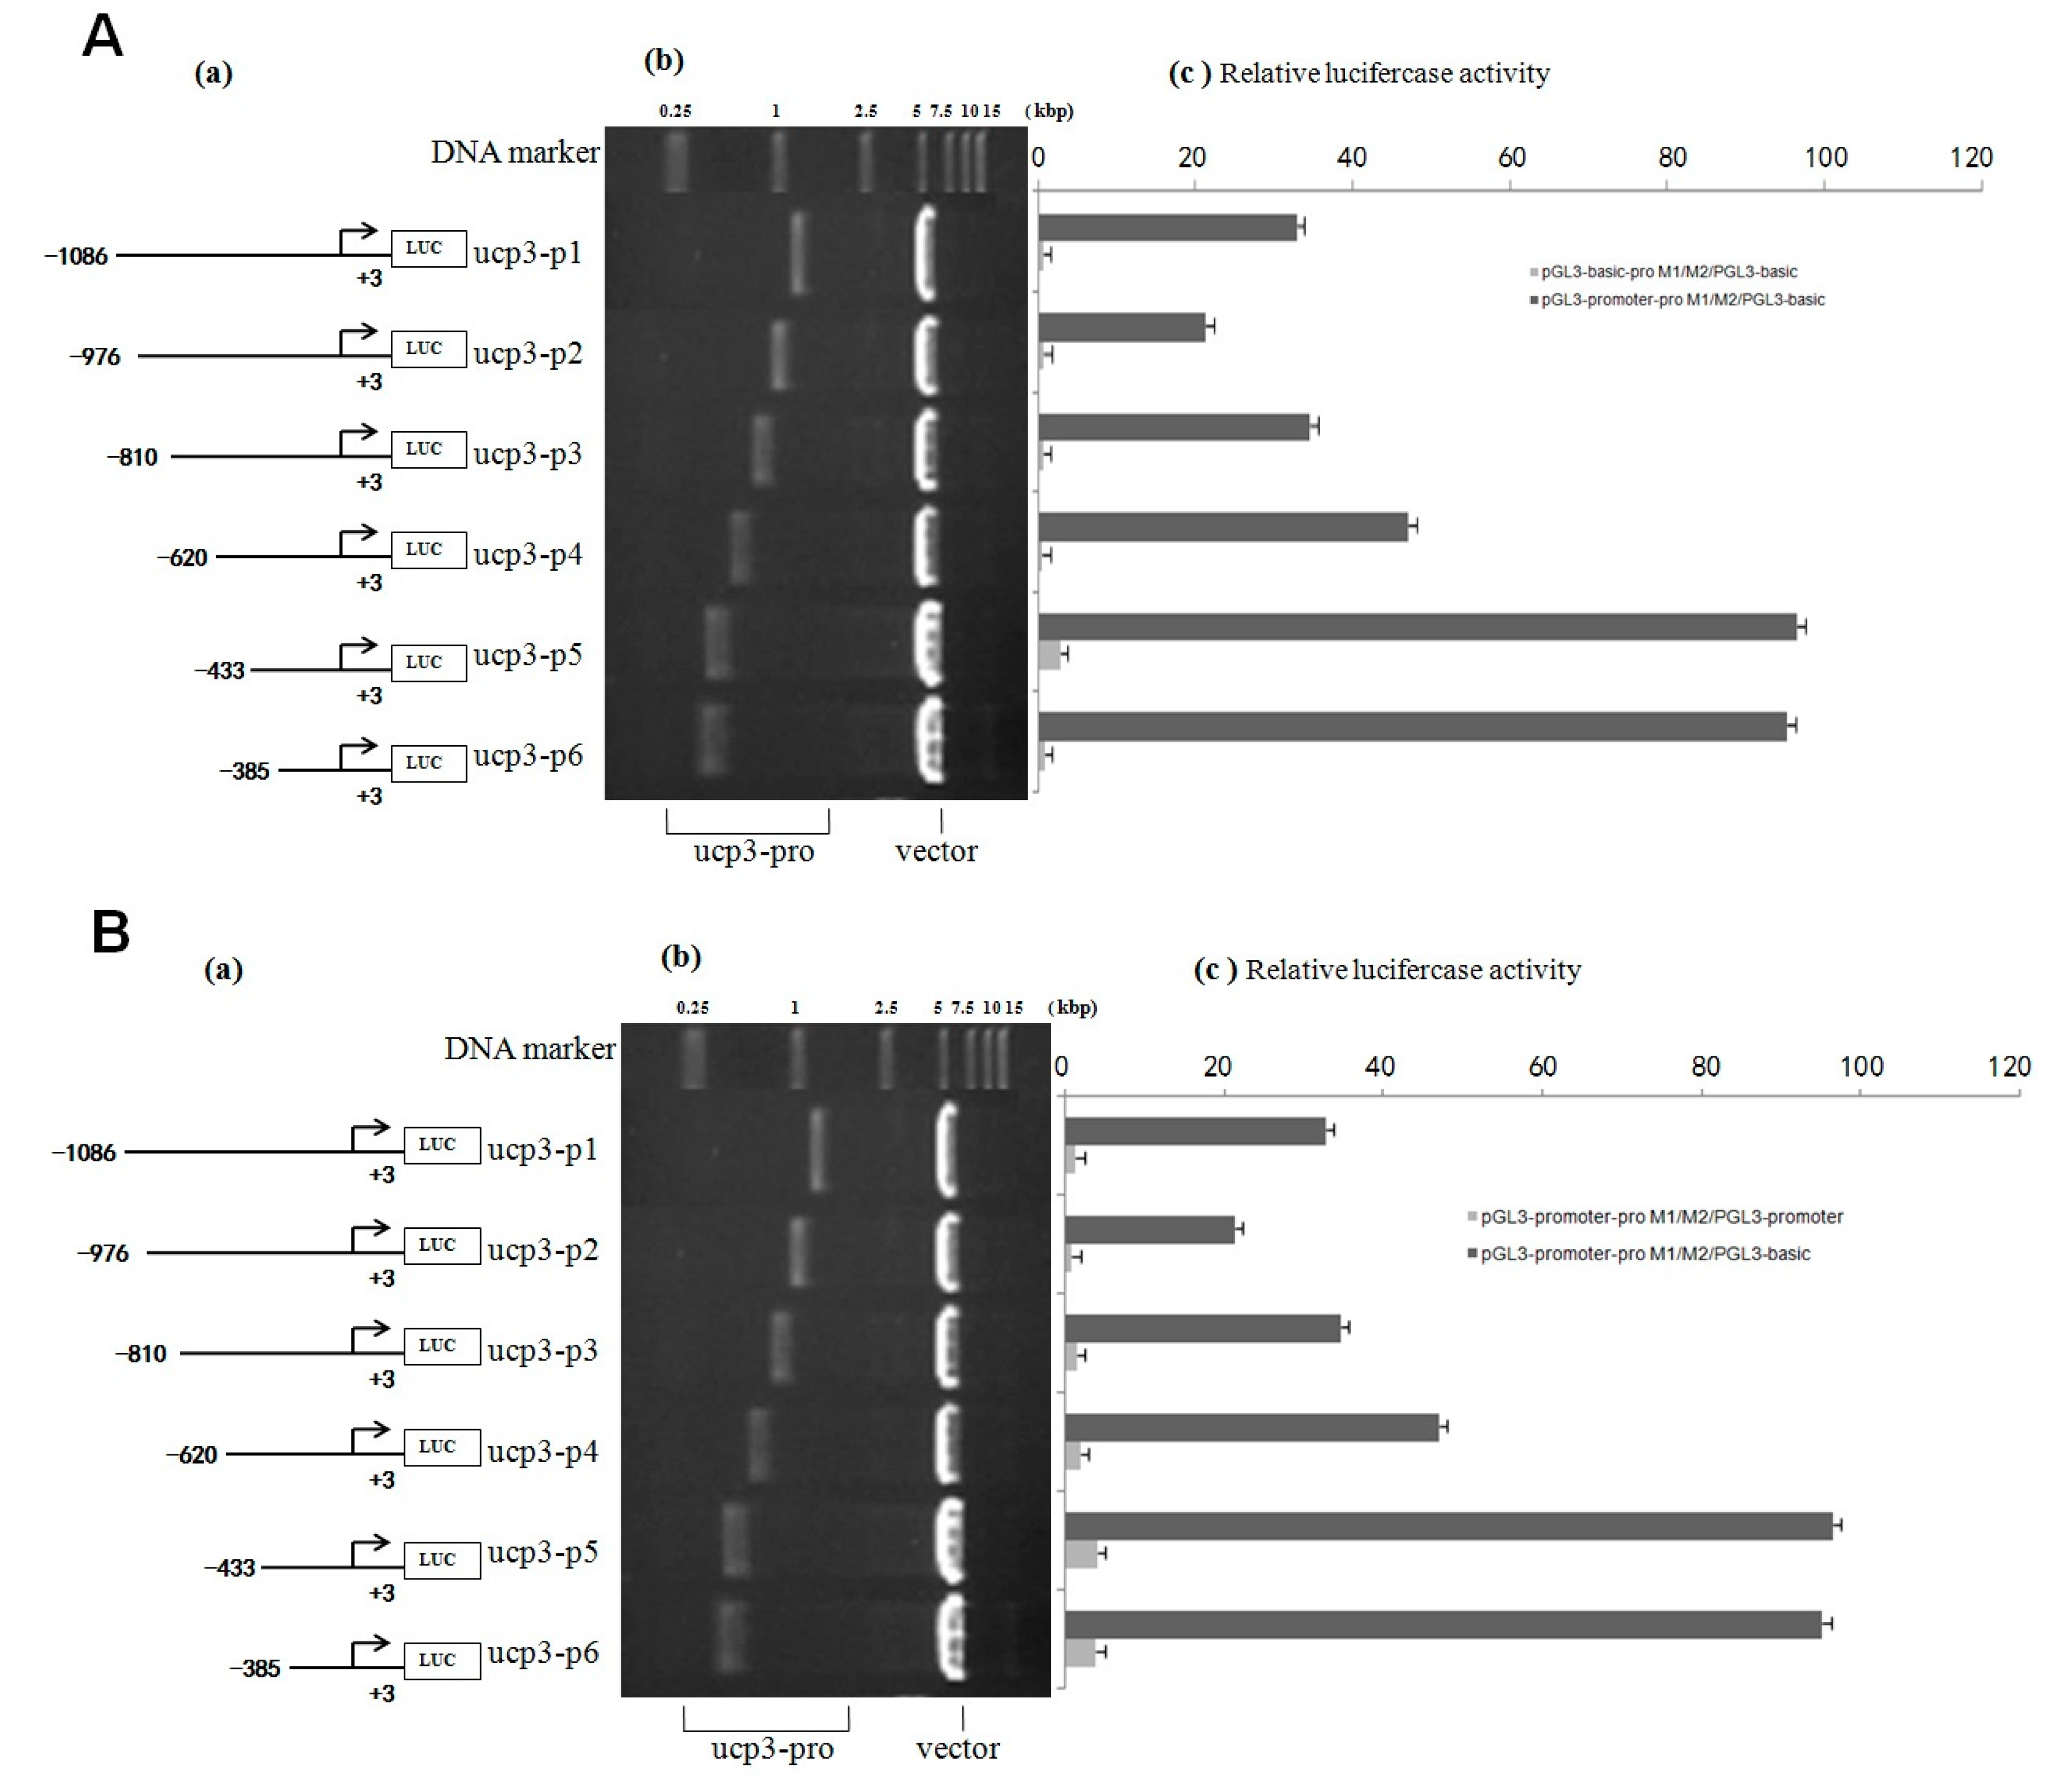
The cloned 5′-upstream regions of the Guanling cattle UCP3 genes showed varying degrees of promoter activity transfection into C2C12 cells. The result showed that the sequence of UCP3 promoter from −385 to +3 bp has the minimal promoter region containing the transcription start site necessary for UCP3 promoter activity, and several studies have reported activity of the UCP3 promoter in C2C12 [22,23]. Deletion of UCP3 promoter expression showed that it has some negative-regulatory elements from −620 to −433 bp, and there exist some positive-regulatory elements between −433 and −385 bp. Therefore, this difference in the promoter activities between different segments of UCP3 promoter suggests that additional factors were needed to activate the UCP3 promoter. Note that pGL3-basic-ucp3-P5 had much lower promoter activity, but pGL3-promoter-ucp3-p5 and pGL3-promoter-ucp3-p6 exhibited significantly higher promoter activity (96.54 ± 3.96 and 95.25 ± 3.91 RLU, relative to pGL3-basic). In a word, the results showed that additional SV40 promoter can strengthen the activity of UCP3 promoter, thereby optimizing the question about low activity of 
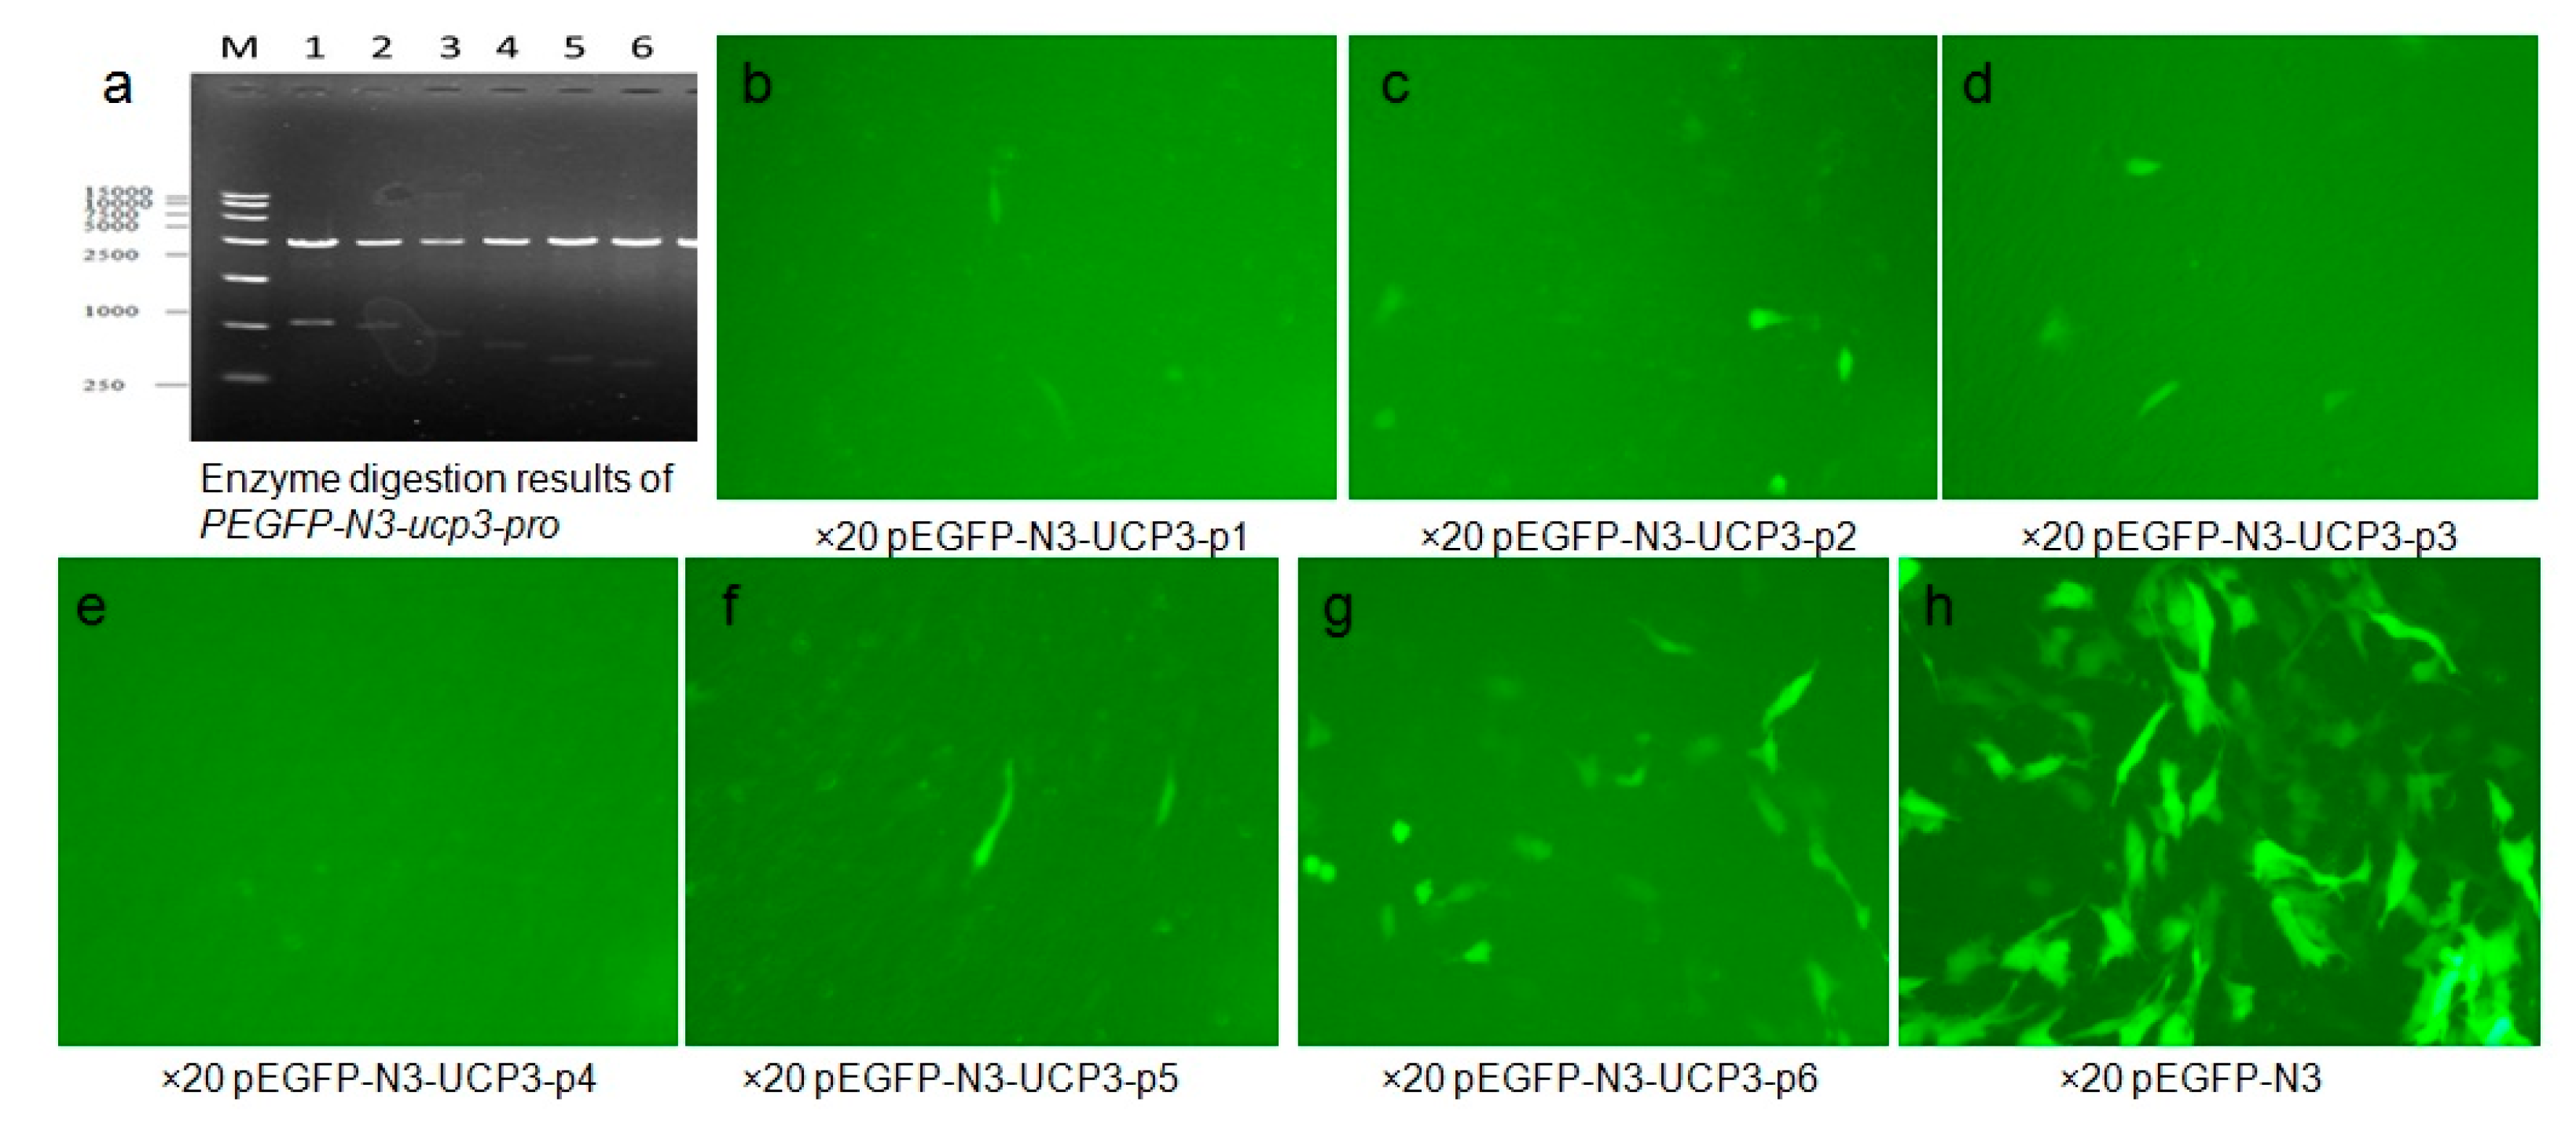
UCP3 promoter in skeletal muscles. The result of PEGFP-N3-ucp3 recombinant vector transfection into C2C12 cells was in agreement with the result of pGL3-promoter-ucp3 transfection into C2C12 cells.
Previous studies had shown that transcription factors combined with these special sequences can open or close a set of specific gene expressions. The interaction of regulatory sequence and transcription factors plays a key role in gene expression [13]. Bioinformatic analysis revealed the presence of some potential transcription factor binding sites of UCP3 promoters such as MyoD, MZF, sox-5, TATA, Nkx2. The result of the software also includes MyoD, MZF1 and 
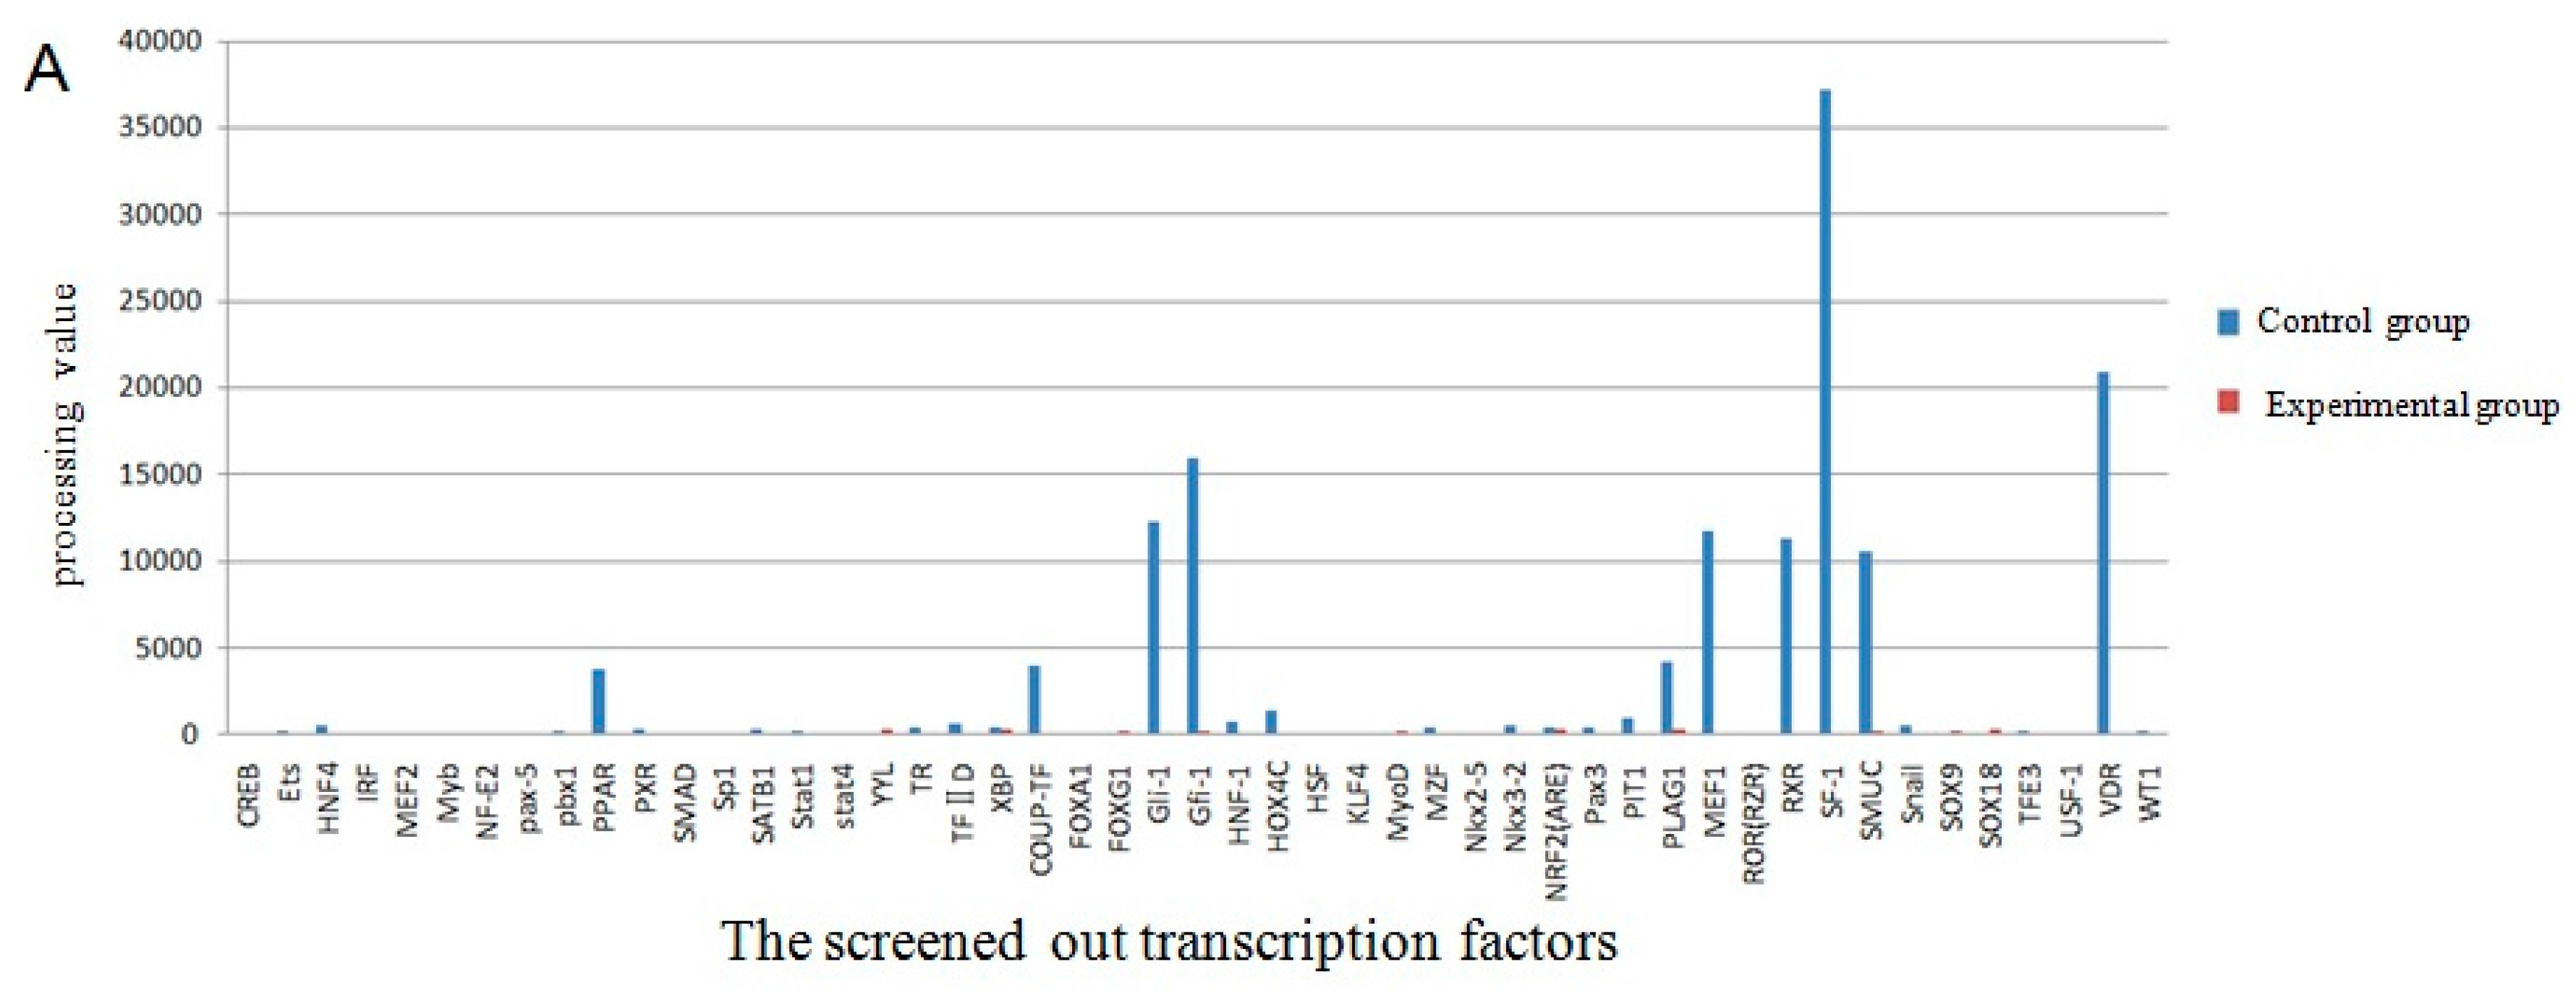
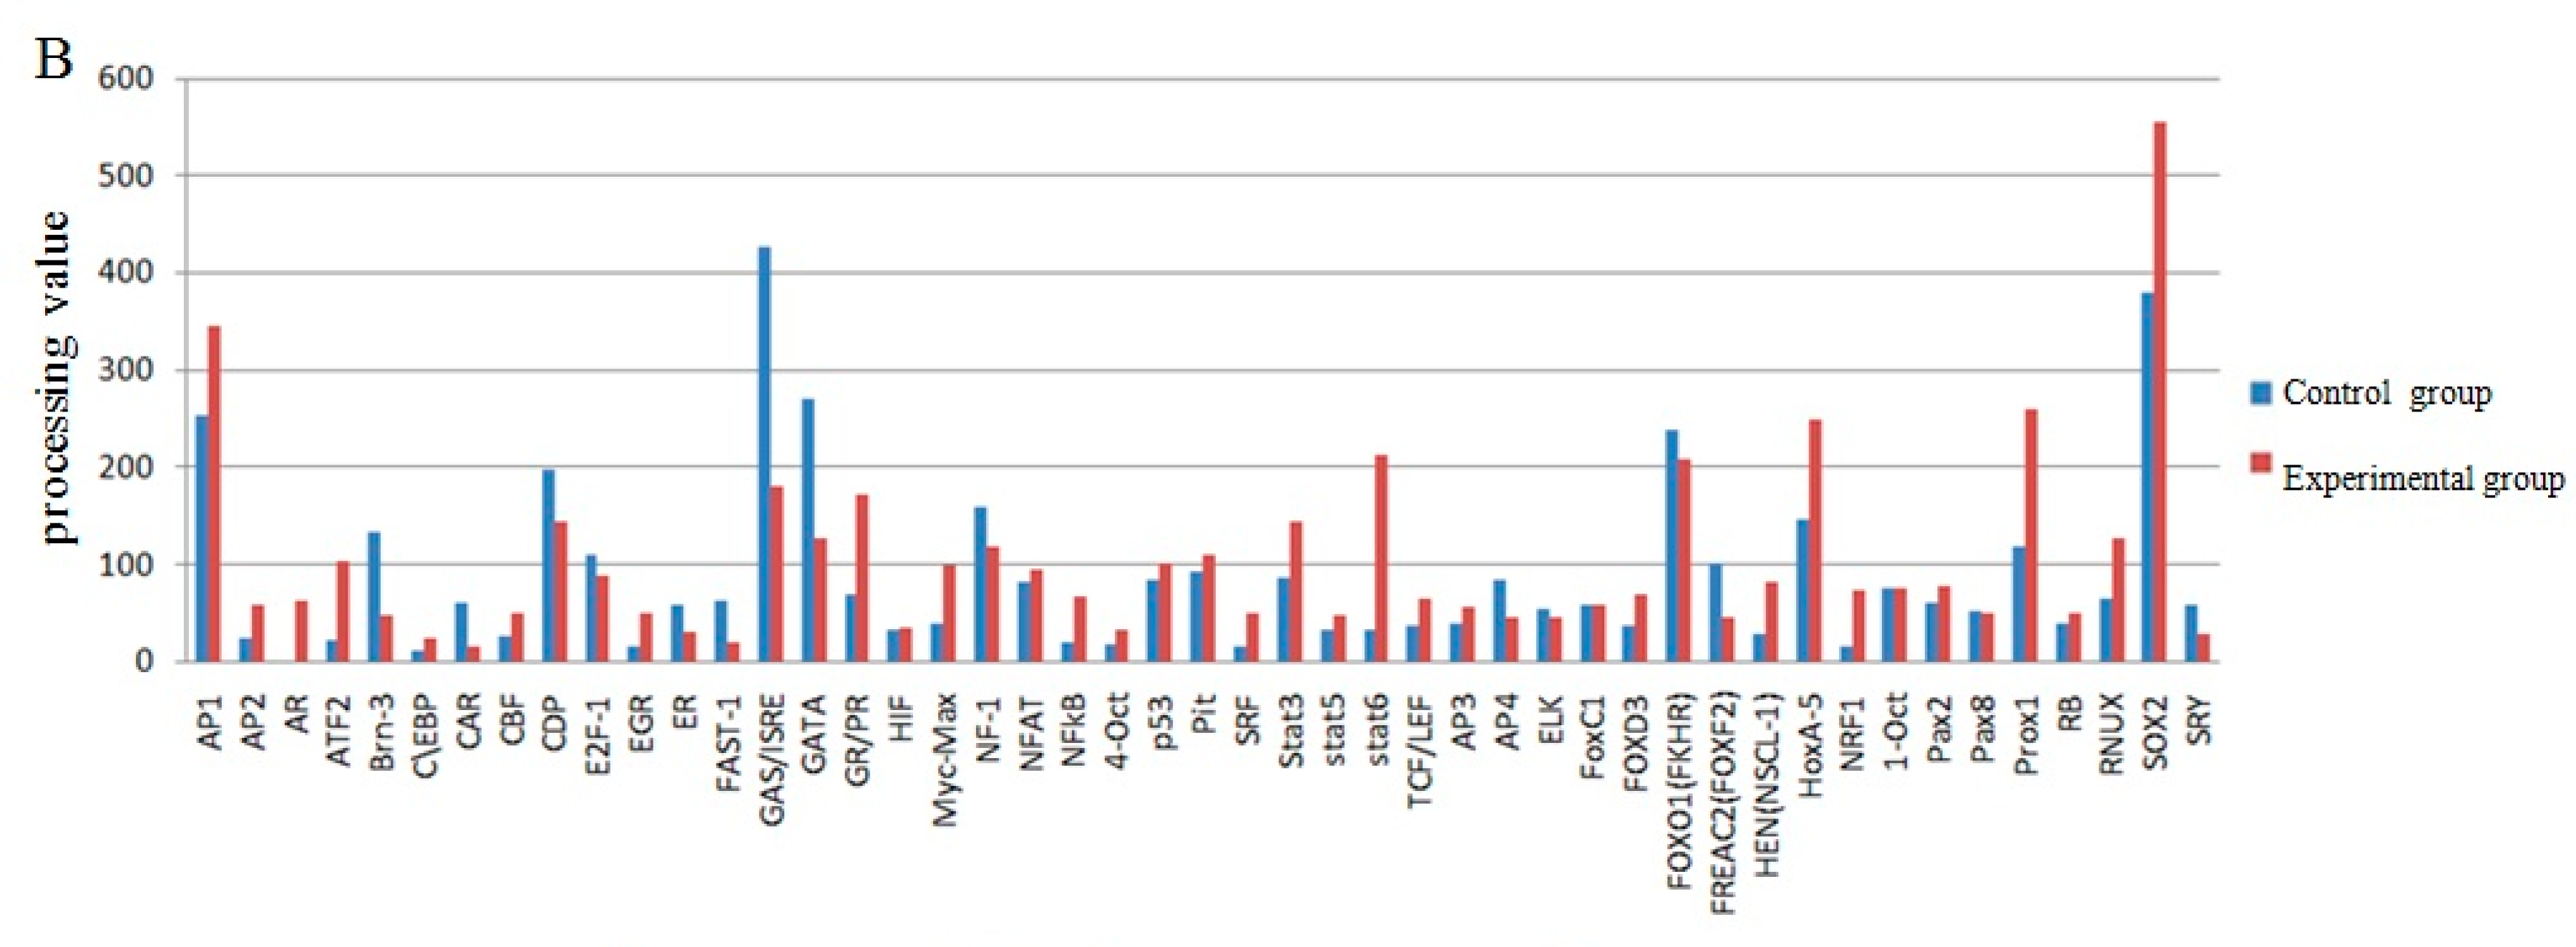
Nkx-2. We have shown that the UCP3 promoter of Guanling cattle have MyoD, TFIID, Pax3, MEF1 and MEF2 transcription factor binding sites by promoter-binding TF brofiling Assay II study. Our experimental and bioinformatics analysis revealed that the Guanling cattle UCP3 promoter region had MyoD, TFIID, Pax3, MEF1, MEF2 transcription factor binding sites. Several studies have reported that the muscle-specific promoter contained Trex/MEF-3 components, MEF-1, Pax3/7, SRE, MEF-2, CACCC boxes and other transcriptional regulatory components [14]. Multiple lines of evidence have shown that PPARα and PPARδ are mediators of the fatty acid-dependent control of UCP3 transcription in skeletal muscle [24]. Pax3 is a key regulator of MyoG during development [25,26]. The embryonic progenitors that express Pax3, and its close homolog Pax7, give rise to a population of adult muscle stem cells [27,28]. MEF2 was considered to be a conservative member of the vast majority of muscle-specific genes [29,30,31,32,33]. MEF2 and the transcription factor containing the basic helix-loop-helix (bHLH) could coordinate muscle genes expression and regulation of the initial myogenic differentiation [34]. In addition, promoter activity was induced by overexpression of MyoD1, which bound to this canonical E-box during C2C12 differentiation [35].
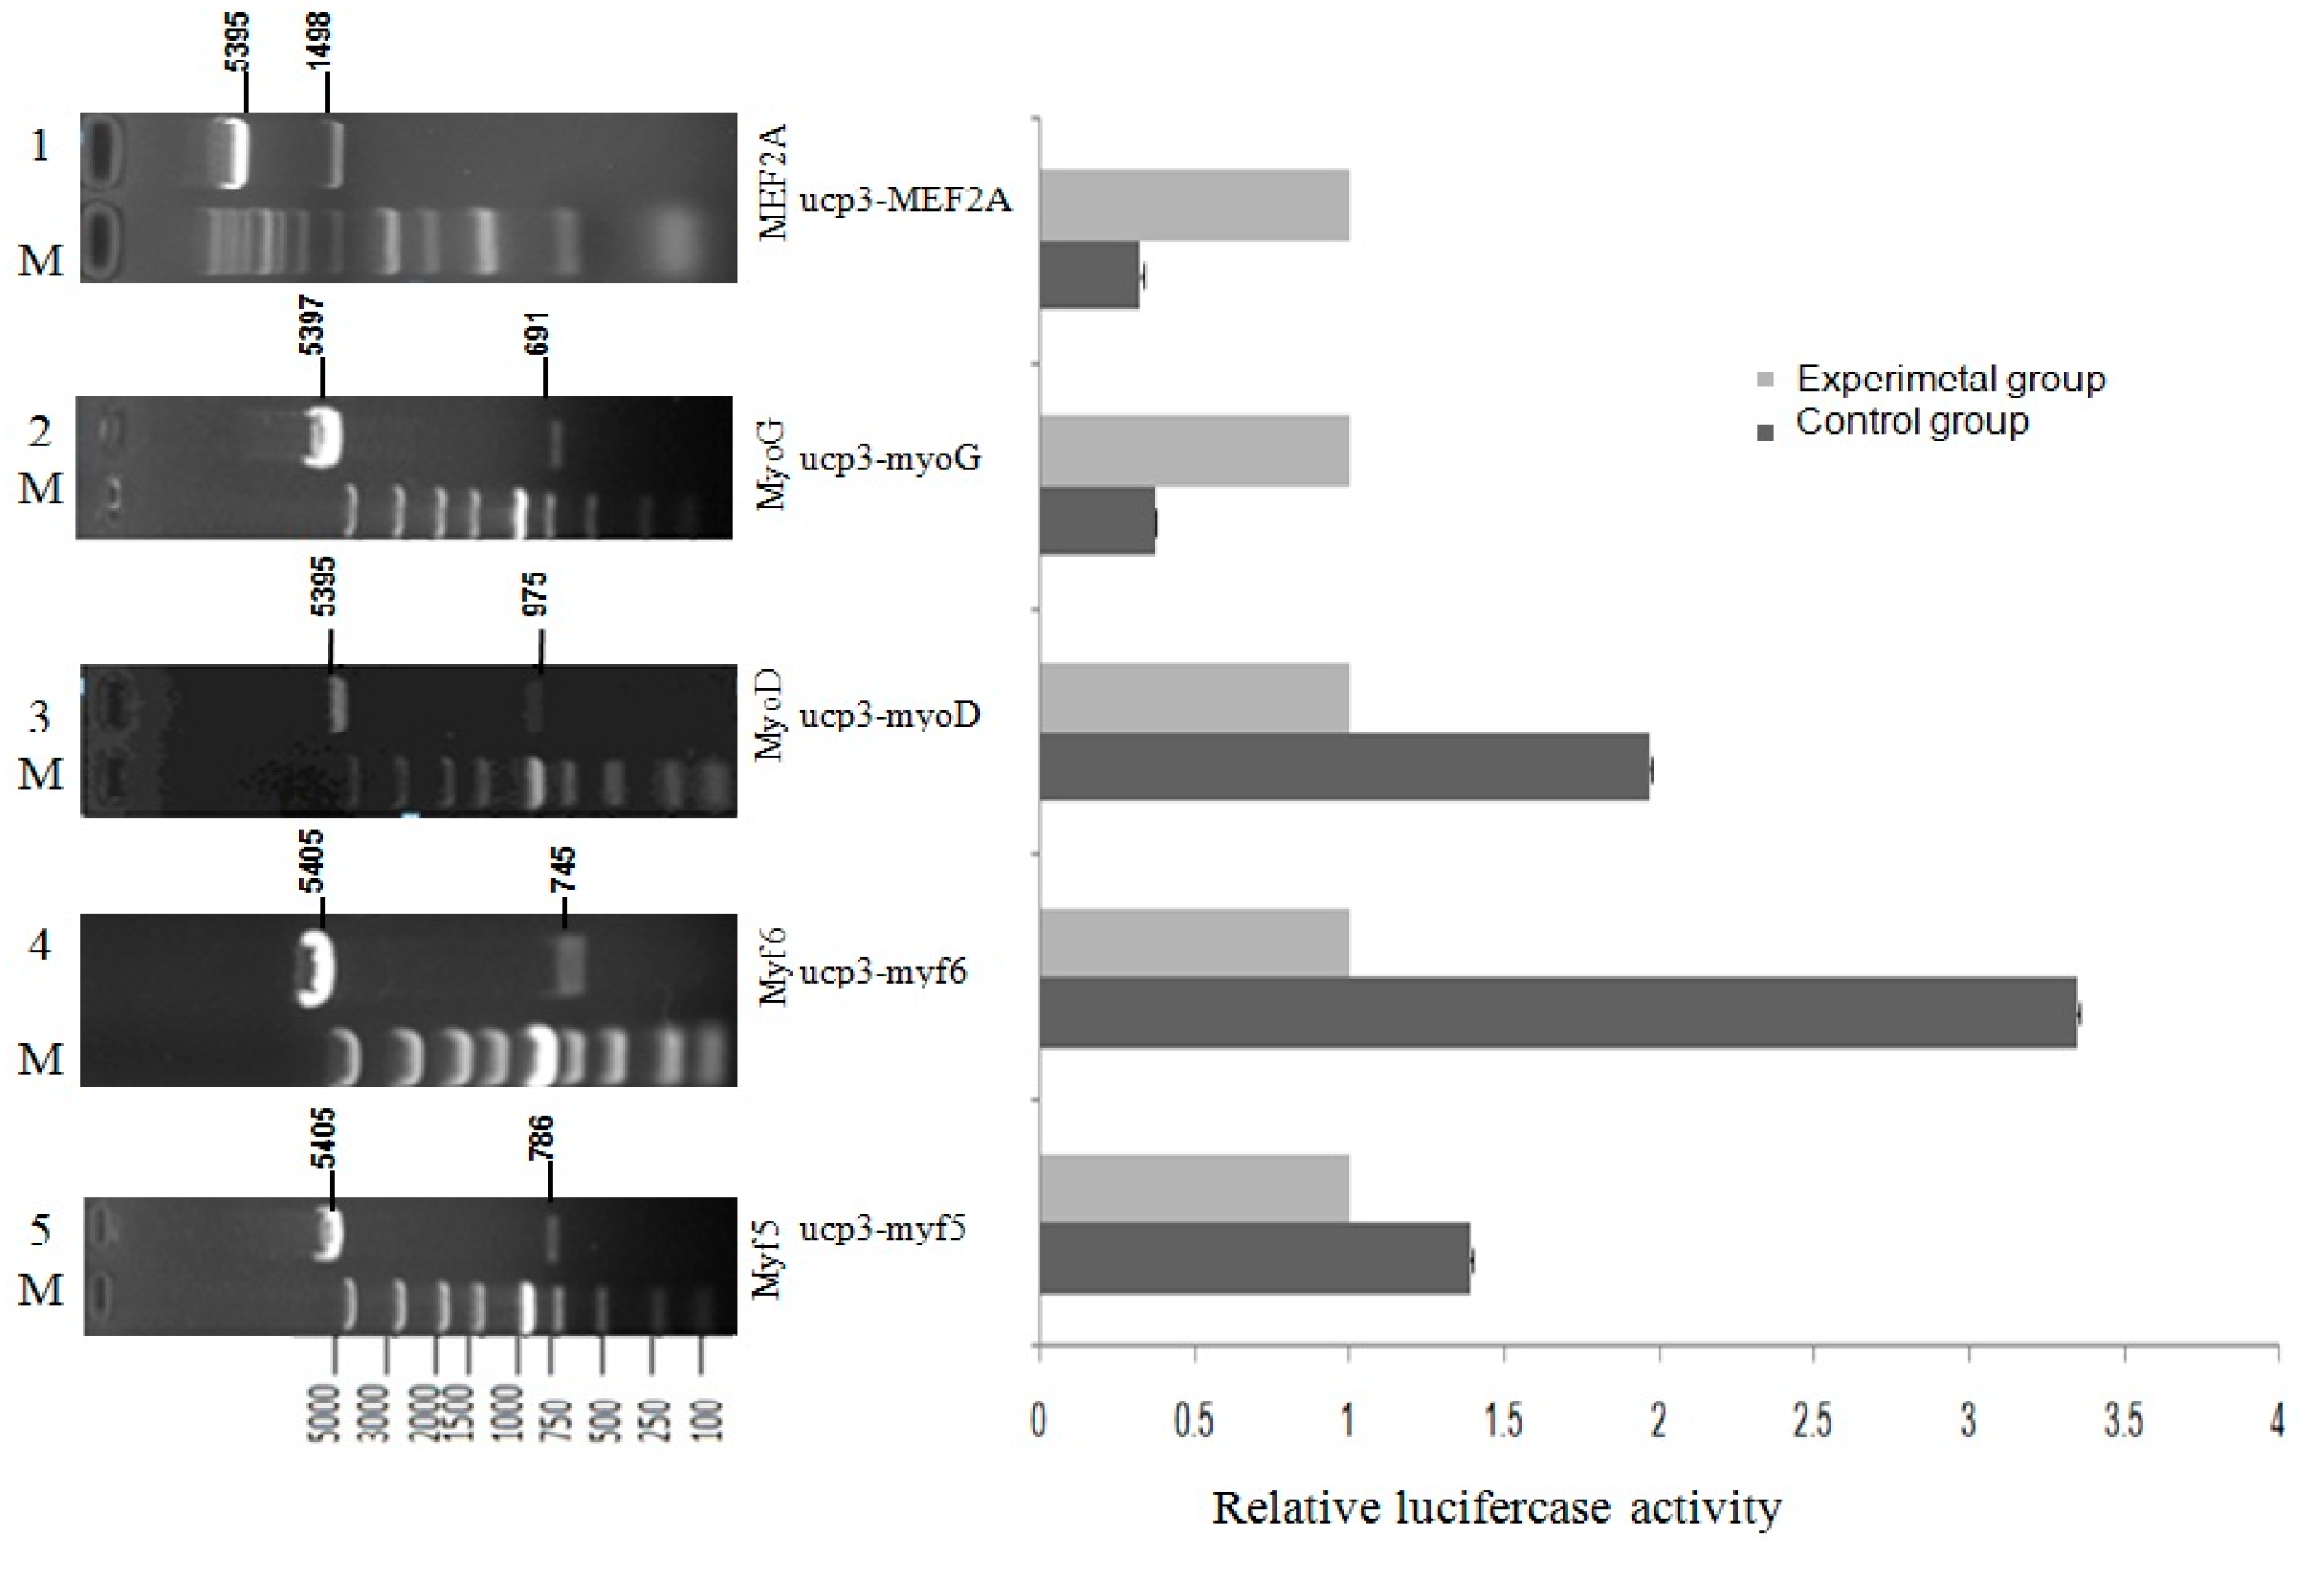
To explore the role of UCP3 promoter for a possible regulation of MRFs family and MEF2A transcription factor, Myf5, Myf6, MyoD, MyoG and MEF2A were selected as the most likely transcription factors to be involved in this study. C2C12 myoblasts were co-transfected with the MRFs family transcription factor or MEF2A transcription factors expression vectors and pGL3-basic-ucp3-pro reporter vectors. The results showed that Myf5, Myf6 and MyoD contributed to the up-regulation of the UCP3 expression in C2C12 myoblasts, which was consistent with the present results that MyoD was required to activate the promoter of human UCP3 [5]. Several transcription factor binding sites in the UCP3 promoter from cattle have been identified including MyoD, which is also present in mouse [5] and rat [14]. Conversely, the MyoG and MEF2A had down-regulation effects on the UCP3 promoter region. Interestingly, the effects of MRFs family and MEF2A were different in C2C12 cell line, Myf5, My6 and MyoD increased the dual luciferase activity, but myogenin and MEF2A had no effect. These results indicated that both the MRFs family and MEF2A are necessary, but, together, they were not sufficient enough transcription factors to induce UCP3 promoter activity. The result is consistent with previous findings [21].
In summary, the results indicated that this difference was most likely conferred by different ways in which UCP3 promoter regions respond to the Myf5, Myf6 and MyoD transcription factors, and the promoter-binding TF profiling assay shows that these transcription factors bind directly to the UCP3 promoter. We only focus the UCP3 promoter in this study, so we can not exclude the possibility that the intoronic region (e.g., intron 1) is associated with the regulation of UCP3 gene [36,37].

4. Experimental Section

4.1. Experimental Animals and Tissue Sampling

Guanling cattle (castrated steers, n = 3) with similar genetic backgrounds in Guanling county of Guizhou province were reared under the same experimental conditions. At a mean age of 18 months, the animals were slaughtered using standard commercial procedures. We collected longissimus dorsi, adipose tissue, hind shin, heart, liver, and small intestine tissue samples. The tissue samples were placed in the RNAlater RNA stabilization solution (Qiagen, Hilden, Germany) immediately after collection. The samples were frozen in liquid nitrogen, and stored at −80 °C.

4.2. RNA Isolation and Synthesis of cDNA

Total RNA was isolated from each tissue sample using the TRIzol reagent (Invitrogen, Waltham, MA, USA), according to the manufacturer’s instructions. An aliquot containing 1 μg of total RNA was used for the synthesis of complementary DNA (cDNA) by reverse transcription using TransStart® One-Step gDNA Removal and cDNA Removal and cDNA Synthesis Super Mix (TransGen Biotech, Beijing, China).

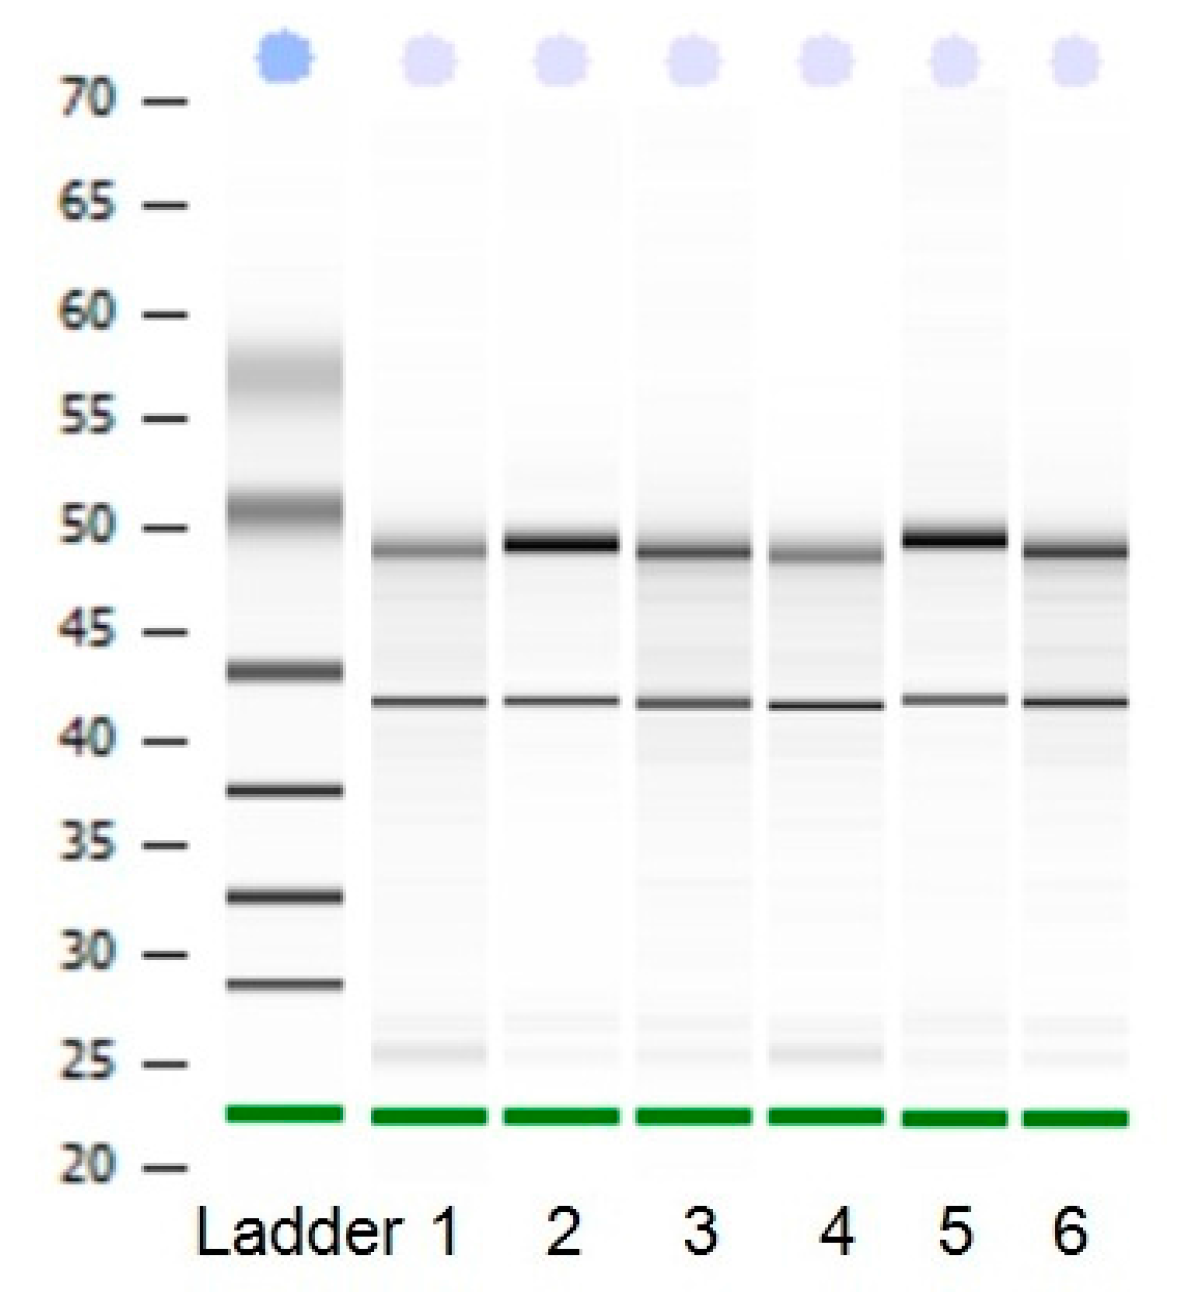
4.3. Confirmation of Gene Expression Using qRT-PCR

The primer pairs of UCP3 were designed to have matching melting temperatures. The primer sequences are listed in Table 3. The same RNA used for UCP3 analysis of the longissimus dorsi, adipose, hind shin, heart, liver, and small intestine tissue samples were used in the quantitative reverse transcription and polymerase chain reaction (qRT-PCR) experiments. The first strand of the cDNA was synthesized from 1 µg of total RNA using the TransScript II One-Step gDNA Removal and cDNA Synthesis SuperMixkits (TransGen Biotech, Beijing, China) with the oligo (dT) 20 primer (TransGen Biotech). The real-time PCR reactions were performed in a final volume of 20 µL using the Trans Start Green qPCR SuperMix UDG kit (TransGen Biotech), according to the manufacturer’s instructions. The mRNA expression were normalized to that of the β-actin, RPL4 and 18SRNA gene. The real-time PCR assays were performed using a CFX96 real-time PCR system (Bio-Rad, Hercules, CA, USA). Thermal cycling was performed using an initial denaturation step of 95 °C for 1 min, followed by 40 cycles of 95 °C for 30 s, 58 °C for 30 s, and 72 °C for 1 min. A melting curve was constructed using annealing temperatures from 58 to 95 °C to verify the specificity of the amplified product. The data were analyzed using the 2−ΔΔCt method.

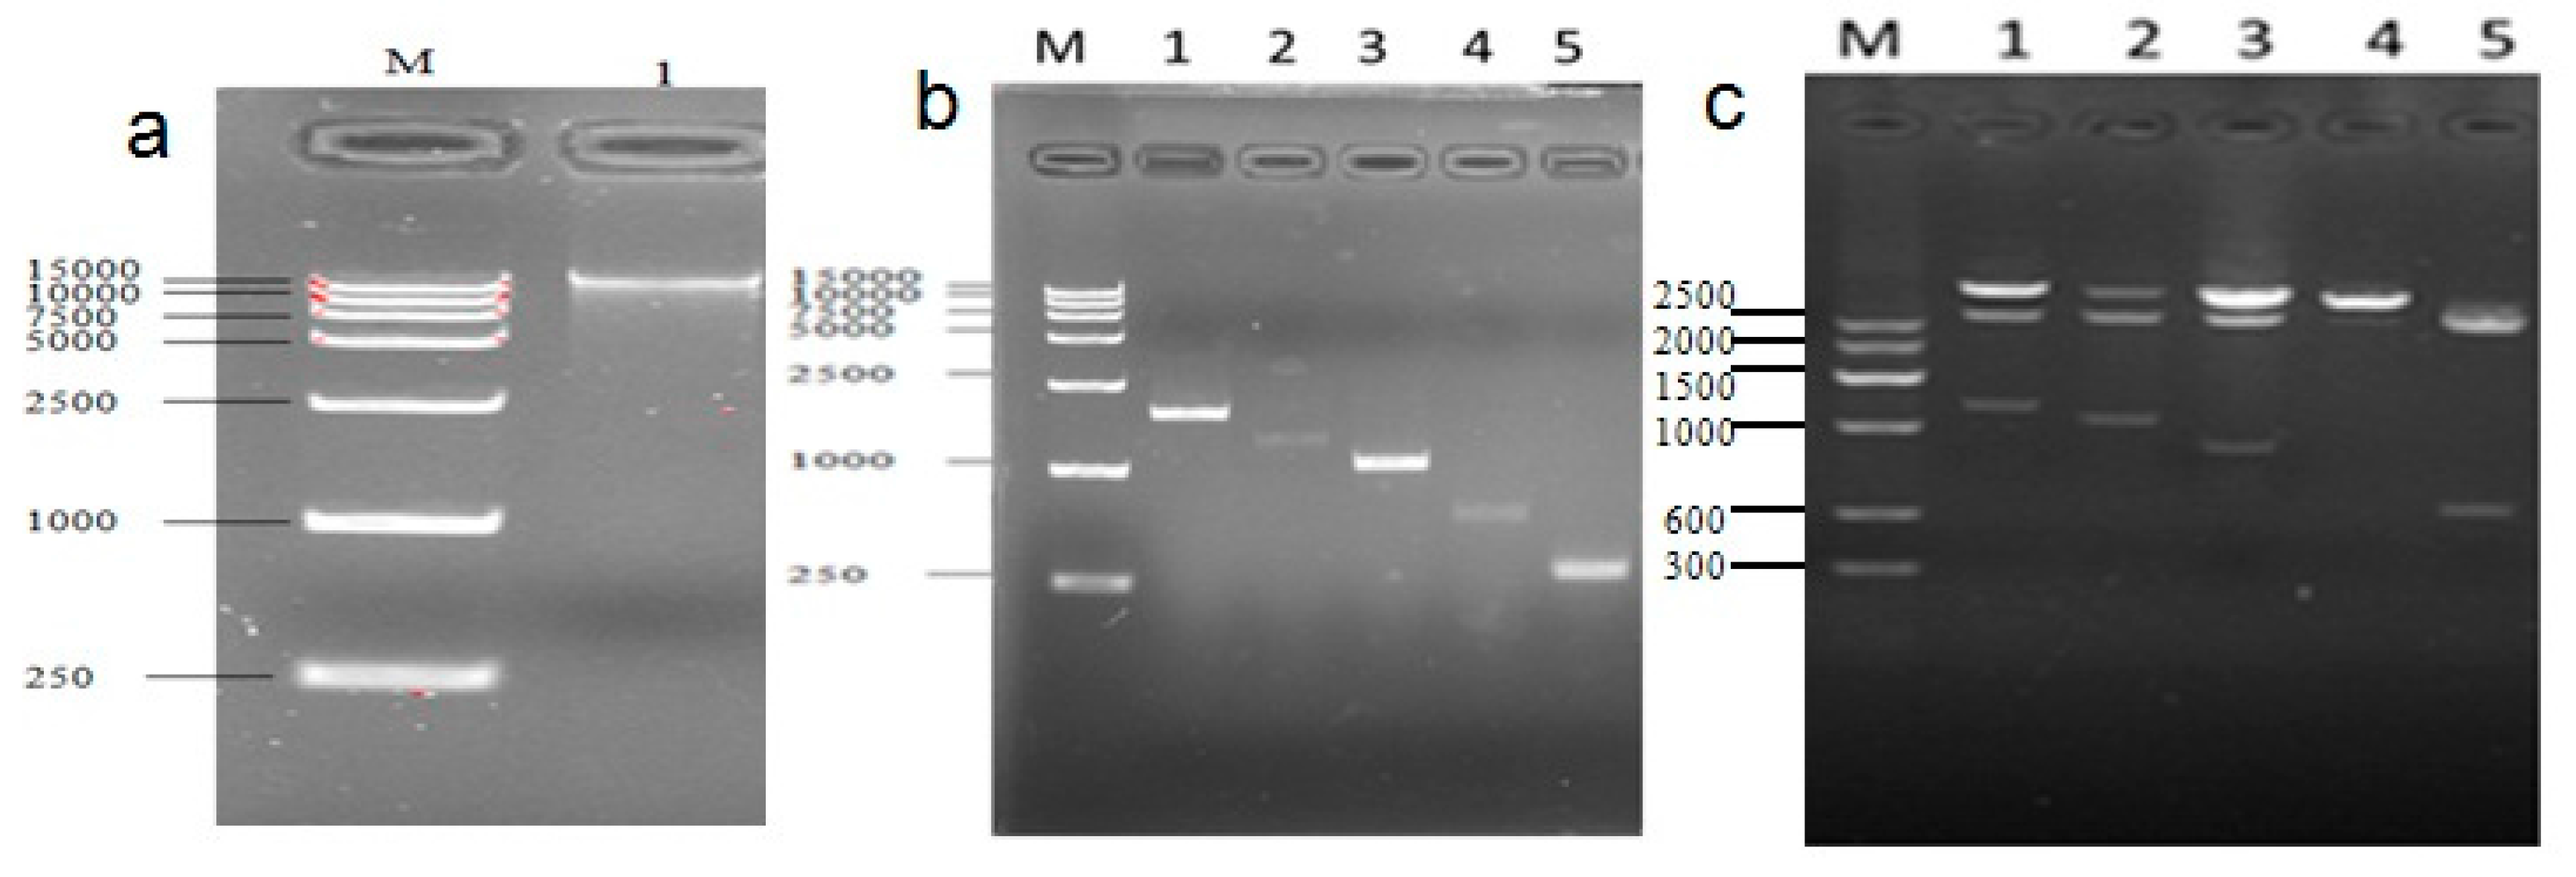
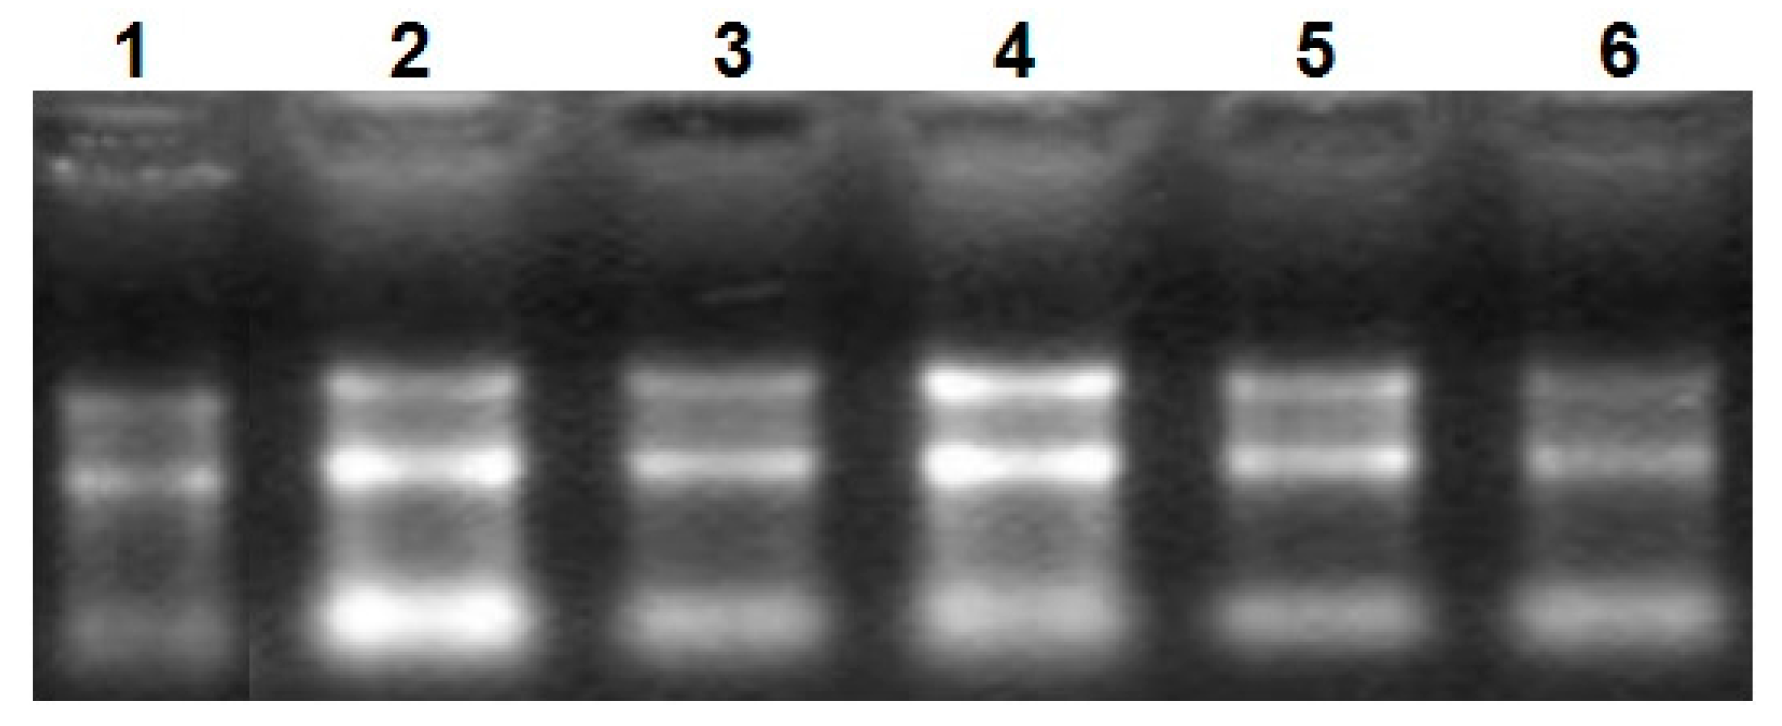
4.4. Amplify UCP3 Promoter of Guanling Cattle

Genomic DNA of Guanling cattle was extracted from blood samples using DNA extraction kit (TransGen Biotech, Beijing, China) according to the manufacturer’s instructions. Based on the sequence of UCP3 gene of cattle (UCSC NM_174210), a pair of PCR primers were designed using Primer Premier 5.0 (version 5.00, PREMIER Biosoft international, Palo Alto, CA, USA, 2000) to amplify 1080, 980, 814, 624, 437 and 389 bp sequence of UCP3 promoter (Table 4). Six fragments of UCP3 promoter were amplified by PCR form DNA genome of Guanling cattle (Figure 9). The PCR system consisted of 1 µL templates, 1 µL of each antiprimer, 1 µL primer, 10 µL 2× PCR Master Mix (Takara, Dalian, China) and 7 µL ddH2O. Thermal cycling was performed using an initial denaturation step of 94 °C for 3 min, followed by 30 cycles of 94 °C for 30 s, 56–60 °C for 30 s, and 72 °C for 1 min. After the cycles, a final extension was performed at 72 °C to 7 min. The amplified fragments were digested with Nhe I and xho I, and ligated together into pGL3-basic, pGL3-promoter and PEGFP-N3 at NheI and xhoI site. Double enzyme fragment lengths were 1080, 980, 814, 624, 437 and 389 bp, respectively (Figure 5, Figure 6 and Figure 7). The PCR product was ligated into pUCm-T easy vector, pGL3-basic, PGL3-promoter, PEGFP-N3 and sequenced.

4.5. Transcription Factor Profiling of UCP3 Promoter by Filter Assay

For monitoring the activation of multiple TFs of the UCP3 promoter simultaneously, Promoter-Binding TF Profiling Assay II was used according to the protocol provided by Signosis Inc. (Signosis Inc., Santa Clara, CA, USA). Nuclear proteins were isolated from longissimus dorsi using the reagents and protocol provided by a Nuclear Extraction Kit (Signosis Inc., Santa Clara, CA, USA). Androgen receptor (AR) was used to normalize the readings for as a blank control (Table 5). Luminescence was reported as relative light units (RLUs) using a multidetection microplate reader (Bio Tek, Vermont, VT, USA). TFSEARCH (http://diyhpl.us/~bryan/irc/protocol-online/protocol-cache/TFSEARCH.html) and ALGGEN ROMO (http://alggen.lsi.upc.es/) were used to predict the transcription factor binding sites of UCP3 promoter region.

4.6. Construction of Myogenic Regulatory Factors (MRFs) Family and MEF2A Transcription Factors Expression Vectors

RNA was isolated from longissimus muscle tissue of Guanling cattle using Trizol (Invitrogen). First strand cDNA was synthesized by the Reverse transcription kit (TransGen Biotech, Beijing, China). The primers of MyoD, Myf5, Myf6, MyoG and MEF2A were designed according to the sequence of NCBI were amplified from the cDNA of longissimus dorsi (Table 6). The MRFs family and MEF2A fragments were excised with restriction enzyme, which were ligated into the pcDNA3.1 (Promega, Madison, WI, USA). Then they were confirmed by dual-enzyme digestion and sequencing. Recombinant expression vectors were pcDNA3.1(+)-MyoD, pcDNA3.1(+)-Myf5, pcDNA3.1(+)-Myf6, pcDNA3.1(+)-Myogenin and pcDNA3.1(+)-MEF2A respectively.

4.7. Analyse Activity of UCP3 Promoter

Purification of UCP3 promoter fragments was excised with NheI and XhoI restriction enzyme, and ligated into the pGL3-Basic, pGL3-promoter and PEGFP-N3 (Promega, Madison, WI, USA), respectively. Then they were confirmed by dual-enzyme digestion and sequencing.
The C2C12 myoblasts were obtained from the Cell Bank of the Chinese Academy of Sciences (Shanghai, China). C2C12 myoblasts cells were cultured in DMEM (Hyclone, logan, UT, USA) medium with 10% fetal bovine serum (FBS) (Gibco, Aucland, New Zealand) under normal culture conditions (5% CO2 at 37 °C). C2C12 myoblasts were seeded into 24-well plates at a density of 1 × 10⁵/well. C2C12 myoblasts reached 80% confluence after 18–24 h. Subsequently, C2C12 myoblasts were cultured in OPTI-MEM (500 µL/well) containing of 2 µL of lipofectamine 2000, 0.8 µg of the pGL3-Basic-ucp3-pro and pGL3-promoter-ucp3-pro recombinant vcectors and 0.06 µg of the internal control vector pRL-TK/luciferase reporter plasmid, C2C12 myoblasts was cultured in OPTI-MEM (500 µL/well), after 5 h, the OPTI-MEM medium was removed and replaced by DMEM medium containing 10% FBS. After 24 h transfection, cells were harvested, luciferase activity was measured using the Dual-Luciferase® Reporter Assay System (Promega, Madison, WI, USA), and then the activities of firefly luciferase in pGL3 and Renilla luciferase in pRL-TK were analyzed.
Cotransfection of eukaryotic expression vectors of MyoD, Myf5, Myf6, MyoG and MEF2A with UCP3 promoter, C2C12 cells was seeded at the density of 1 × 10⁵/well into 24-well plates using DMEM containing 10% FBS medium. After 18–24 h, the plated cells were transfected with 0.6 µg of pGL3-basic-ucp3-P1 vector, 0.06 µg of the internal control vector pRL-TK, 0.2 µg of the expression vectors of pcDNA3.1(+)-MyoD, pcDNA3.1(+)-Myf5, pcDNA3.1(+)-Myf6, pcDNA3.1(+)-Myogenin and pcDNA3.1(+)-MEF2A, 2 µL of Lipofectamine 2000 using Lipofectamine 2000 (Invitrogen Corporation, Carlsbad, NM, USA) according to the manufacturer’s protocol, and the pcDNA3.1 vectors were cotransfected with pGL3-basic-ucp3-P1, which was the control. After 5 h, the OPTI-MEM medium was replaced by DMEM medium containing 10% FBS. After 24 h transfection, luciferase activity was measured using the same techniques as those described for C2C12 myoblasts cells.

4.8. The Data Analysis

Statistical analyses were performed using SPSS17.0. Data (SPSS statistics 17.0, WinWrap Basic, New York, NY, USA, 2008) were presented as the mean ± standard error of the mean. Statistical differences between conditions were assessed using one-way ANOVA, p < 0.05 was considered statistically significant.

5. Conclusions

The results showed that UCP3 promoter led to tissue-specific expression in the muscle. The activity of six different lengths of UCP3 promoter were determined using the dual luciferase reporter gene. The results suggest that there may be positive regulatory elements in the region of the UCP3 promoter from −433 to −385 bp, and there may be negative regulatory element in the region from −620 to −433 bp. Double luciferase assay and PEGFP-N3 recombinant vector results suggested that the region of UCP3 promoter from −385~+3 bp may be the core promoter region. We successfully screened out that the UCP3 promoter region of Guanling cattle have transcription factor binding sites which include MyoD, TFIID, Pax3, MEF1 and MEF2 binding sites. Co-transfection experiments of the transcription factors found that Myf5, Myf6 and MyoD have a certain positive regulatory role with regard to activity of the UCP3 promoter. The result indicated that the UCP3 promoter may play an important role in the muscle tissue.

Acknowledgments

We would like to thank the research assistants and laboratory technicians who contributed to this study. This study was supported by grants from the national natural science fund of China (31401054), the major projects of Science and Technology in Guizhou Province, China (QK-major projects 2013-6008) and The Plan of Science and Technology in Guizhou Province, China (QKH-NY-2012-3008).

Author Contributions

Wei Chen and Houqiang Xu conceived and coordinated the study. Wei Chen and Xiang Chen performed the tissue samples preparation and RNA isolation. Wei Chen and Zhongwei Liu participated in the statistical analysis of data. Wei Chen, Wen Zhang and Dan Xia confirmed the qRT-PCR and analyzed activity of UCP3 promoter. Wei Chen drafted the manuscript. Houqiang Xu, Xiang Chen and Zhongwei Liu reviewed the manuscript. All authors read and approved the final manuscript.

Conflicts of Interest

The authors declare no conflict of interest.

References

  1. Daniel, R.; Frederic, B. The uncoupling protein homologues: UCP1, UCP2, UCP3, StUCP and AtUCP. Biochem. J. 2000, 345, 161–179. [Google Scholar]
  2. Joseph, H.; Francois, C. Evolutionary history of the UCP gene family: Gene duplication and selection. BMC Evol. Biol. 2008, 8. [Google Scholar] [CrossRef]
  3. Boss, O.; Samec, S.; Dulloo, A.; Seydoux, J.; Muzzin, P.; Giacobino, J.P. Tissue-dependent upregulation of rat uncoupling protein-2 expression in response to fasting or cold. FEBS Lett. 1997, 412, 111–114. [Google Scholar] [CrossRef]
  4. Boss, O.; Samec, S.; Paoloni-Giacobino, A.; Rossier, C.; Dulloo, A.; Seydoux, J.; Muzzin, P.; Giacobino, J.P. Uncoupling protein-3, a new member of the mitochondrial carrier family with tissue specific expression. FEBS Lett. 1997, 408, 39–42. [Google Scholar] [CrossRef]
  5. Solanes, G.; Pedraza, N.; Iglesias, R.; Giralt, M.; Villarroya, F. Functional Relationship between MyoD and Peroxisome Proliferator-Activated Receptor Dependent Regulatory Pathways in the Control of the Human Uncoupling Protein-3 Gene Transcription. Mol. Endocrinol. 2003, 17, 1944–1958. [Google Scholar] [CrossRef] [PubMed]
  6. Nowacka-Woszuk, J.; Szczerbal, I.; Fijak-Nowak, H.; Switonski, M. Chromosomal localization of 13 candidate genes for human obesity in the pig genome. J. Appl. Gene 2008, 49, 373–377. [Google Scholar] [CrossRef] [PubMed]
  7. Cioffi, F.; Senese, R.; de Lange, P.; Goglia, F.; Lanni, A.; Lombardi, A. Uncoupling proteins: A complex journey to function discovery. Biofactors 2009, 35, 417–428. [Google Scholar] [CrossRef] [PubMed]
  8. Nabben, M.; Hoeks, J.; Moonen-Kornips, E.; van Beurden, D.; Briedé, J.J.; Hesselink, M.K. Significance of uncoupling protein 3 in mitochondrial function upon mid- and long-term dietary high-fat exposure. FEBS Lett. 2011, 585, 4010–4017. [Google Scholar] [CrossRef] [PubMed]
  9. Senese, R.; Valli, V.; Moreno, M.; Lombardi, A.; Busiello, R.A.; Cioffi, F. Uncoupling protein 3 expression levels influence insulin sensitivity, fatty acid oxidation, and related signaling pathways. Pflugers Arch. 2011, 461, 153–164. [Google Scholar] [CrossRef] [PubMed]
  10. Nabben, M.; van Bree, B.W.; Lenaers, E.; Hoeks, J.; Hesselink, M.K.; Schaart, G.; Gijbels, M.J.; Glatz, J.F.; da Silva, G.J.; de Windt, L.J.; et al. Lack of UCP3 does not affect skeletal muscle mitochondrial function under lipid-challenged conditions, but leads to sudden cardiac death. Basic Res. Cardiol. 2014, 109, 447. [Google Scholar] [CrossRef] [PubMed]
  11. Busiello, R.A.; Savarese, S.; Lombardi, A. Mitochondrial uncoupling proteins and energy metabolism. Front. Physiol. 2015, 6. [Google Scholar] [CrossRef] [PubMed]
  12. Goodrich, J.A.; Tjian, R. Unexpected roles for core promoter recog-nition factors in cell-type-specific transcription and gene regulation. Nat. Rev. Genet. 2010, 11, 549–558. [Google Scholar] [PubMed]
  13. Colin, R.L.; Florian, M.; Sean, E.H.; James, G.M.; Jason, D.L. Genome-wide protein-DNA binding dynamics suggest a molecular clutch for transcription factor function. Nature 2012, 484, 251–255. [Google Scholar]
  14. De Lange, P.; Feola, A.; Ragni, M.; Senese, R.; Moreno, M.; Lombardi, A.; Silvestri, E.; Amat, R.; Villarroya, F.; Goglia, F.; et al. Differential 3,5,3-triiodothyronine-mediated regulation of uncoupling protein 3 transcription: Role of fatty acids. Endocrinology 2007, 148, 4064–4072. [Google Scholar] [CrossRef] [PubMed]
  15. Zhao, D.; Liu, C.; Jia, M.; Yang, Y.; Ye, F.; Yan, Y. Progress of upstream transcriptional control elements in promoters of skeletal specific genes (in Chinese). Chin. J. Cell Biol. 2012, 34, 500–505. [Google Scholar]
  16. China National Commission of Animal Genetic Resources. Animal Genetic Resources in China Bovines; China Agriculture Press: Beijing, China, 2011; Volume 5, p. 151. [Google Scholar]
  17. Larkin, S.; Mull, E.; Miao, W.; Pittner, R.; Albrandt, K.; Moore, C.; Young, A.; Denaro, M.; Beaumont, K. Regulation of the third member of the uncoupling protein family, UCP3, by cold and thyroid hormone. Biochem. Biophys. Res. Commun. 1997, 240, 222–227. [Google Scholar] [CrossRef] [PubMed]
  18. Samec, S.; Seydoux, J.; Dulloo, A.G. Role of UCP homologues in skeletal muscles and brown adipose tissue: Mediators of thermogenesis or regulators of lipids as fuel substrate? FASEB J. 1998, 12, 715–724. [Google Scholar] [PubMed]
  19. Weigle, D.S.; Selfridge, L.E.; Schwartz, M.W.; Seeley, R.J.; Cummings, D.E.; Havel, P.J.; Kuijper, J.L.; BeltrandelRio, H. Elevated free fatty acids induceuncoupling protein 3 expression in muscle: A potential explanation for the effect of fasting. Diabetes 1998, 47, 298–302. [Google Scholar] [CrossRef] [PubMed]
  20. Kratky, D.; Strauss, J.G.; Zechner, R. Tissue-specific activity of lipoprotein lipase in skeletal muscle regulates the expression of uncoupling protein 3 in transgenic mouse models. Biochem. J. 2001, 355, 647–652. [Google Scholar] [CrossRef] [PubMed]
  21. Kim, D.; Jitrapakdee, S.; Thompson, M. Differential regulation of the promoter activity of the mouse UCP2 and UCP3 genes by MyoD and myogenin. J. Biochem. Mol. Biol. 2007, 40, 921–927. [Google Scholar] [CrossRef] [PubMed]
  22. Girousse, A.; Tavernier, G.; Tiraby, C.; Lichtenstein, L.; Iacovoni, J.S.; Mairal, A.; Villarroya, F.; Langin, D. Transcription of the human uncoupling protein 3 gene is governed by a complex interplay between the promoter and intronic sequences. Diabetologia 2009, 52, 1638–1646. [Google Scholar] [CrossRef] [PubMed]
  23. Ho, P.W.; Ho, J.W.; Liu, H.F.; So, D.H.; Tse, Z.H.; Chan, K.H.; Ramsden, D.B.; Ho, S.L. Mitochondrial neuronal uncoupling proteins: A target for potential disease-modification in Parkinson’s disease. Transl. Neurodegener. 2012, 1, 3–12. [Google Scholar] [CrossRef] [PubMed] [Green Version]
  24. Villarroya, F.; Iglesias, R.; Giralt, M. PPARs in the control of uncoupling proteins gene expression. PPAR Res. 2007, 12. [Google Scholar] [CrossRef] [PubMed]
  25. Buckingham, M.; Bajard, L.; Chang, T.; Daubas, P.; Hadchouel, J.; Meilhac, S.; Montarras, D.; Rocancourt, D.; Relaix, F. The formation of skeletal muscle: From somite to limb. J. Anat. 2003, 202, 59–68. [Google Scholar] [CrossRef] [PubMed]
  26. Boutet, S.C.; Biressi, S.; Iori, K.; Natu, V.; Rando, T.A. Taf1 regulates Pax3 protein by monoubiquitination in skeletal muscle progenitors. Mol. Cell 2010, 40, 749–761. [Google Scholar] [CrossRef] [PubMed]
  27. Gros, J.; Manceau, M.; Thomé, V.; Marcelle, C. A common somitic origin for embryonic muscle progenitors and satellite cells. Nature 2005, 435, 954–958. [Google Scholar] [CrossRef] [PubMed]
  28. Relaix, F.; Rocancourt, D.; Mansouri, A.; Buckingham, M. A Pax3/Pax7-dependent population of skeletal muscle progenitor cells. Nature 2005, 435, 948–953. [Google Scholar] [CrossRef] [PubMed]
  29. Dodou, E.; Xu, S.M.; Black, B.L. MEF2c is activated directly by MyoGenic basic helix-loop-helixproteins during skeletal muscle development in vivo. Mech. Dev. 2003, 120, 1021–1032. [Google Scholar] [CrossRef]
  30. Hennebry, A.; Berry, C.; Siriett, V. Myostatin regμlates fiber-type composition of skeletal muscle by regμlating MEF2 and MyoD gene expression. Am. J. Physiol. Cell Physiol. 2009, 296, C525–C534. [Google Scholar] [CrossRef] [PubMed]
  31. Jung, S.Y.; Ko, Y.G. TRIM72, a novel negative feedback regμlator of MyoGenesis, is transcriptionally activated by the synergism of MyoD (or MyoGenin) and MEF2. Biochem. Biophys. Res. Commun. 2010, 396, 238–245. [Google Scholar] [CrossRef] [PubMed]
  32. Bryantsev, A.L.; Baker, P.W.; Lovato, T.L. Differential requirements for Myocyte Enhancer Factor-2 during adult MyoGenesis in Drosophila. Dev. Biol. 2012, 361, 191–207. [Google Scholar] [CrossRef] [PubMed]
  33. Wang, Q.; Cao, Y.; Li, S.; Tong, H.; Xing, X.; Li, G.; Yan, Y. Cloning and preliminary functional analysis of bovine MyoG promoter (in Chinese). Acta Vet. Zootech. Sin. 2012, 43, 37–43. [Google Scholar]
  34. Potthoff, M.J.; Olson, E.N. MEF2: A central regulator of diverse developmental programs. Development 2007, 134, 4131–4140. [Google Scholar] [CrossRef] [PubMed]
  35. Yan, C.; Xia, X.; He, J.; Ren, Z.; Xu, D.; Xiong, Y.; Zuo, B. MyoD is a novel activator of porcine FIT1 gene by interacting with the canonical E-box element during myogenesis. Int. J. Mol. Sci. 2015, 16, 25014–25030. [Google Scholar] [CrossRef] [PubMed]
  36. Hoffmann, C.; Zimmermann, A.; Hinney, A.; Volckmar, A.L.; Jarrett, H.W.; Fromme, T.; Klingenspor, M. A novel SP1/SP3 dependent intronic enhancer governing transcription of the UCP3 gene in brown adipocytes. PLoS ONE 2013, 8, e83426. [Google Scholar] [CrossRef] [PubMed]
  37. Udagawa, C.; Tada, N.; Asano, J.; Ishioka, K.; Ochiai, K.; Bonkobara, M.; Tsuchida, S.; Omi, T. The genetic association study between polymorphisms in uncoupling protein 2 and uncoupling protein 3 and metabolic data in dogs. BMC Res. Notes 2014, 7, 904. [Google Scholar] [CrossRef] [PubMed]
Figure 1. The electrophoretogram of RNA. From1 to 6, the results represent heart tissue, liver tissue, small intestine tissue, longissimus dorsi tissue, hind shin tissue, adipose tissue, respectively.
Ijms 17 00682 g001
Figure 2. The 2100 biological analyzer results of RNA. From1 to 6, the results represent heart tissue, liver tissue, small intestine, longissimus dorsi, hind shin, adipose tissue, respectively.
Ijms 17 00682 g002
Figure 3. The expressing level of uncoupling protein 3 (ucp3) gene in Guanling cattle different tissues.
Ijms 17 00682 g003
Figure 4. Deletion analysis of the cattle UCP3 promoter. (A) Promoter activity of the pGL3-basic-ucp3-Pro in C2C12 Cells; (B) Promoter activity of the pGL3-promoter-ucp3-Pro in C2C12 Cells; (C) Activity of the ucp3 promoter in C2C12 Cells. (a) Schematic diagram of the UCP3 promoter constructs consisting of the 5′-flanking region with serial deletions cloned into the pGL3-basic and pGL3-promoter vector. The arrows show the direction of transcription. The numbers represent the end points of each construct; (b) The deletion plasmids were digested by restriction enzyme and run on a 1.5% agarose gel. The size of the vector is 4.8 kb. The inserted fragments of the UCP3 promoter range from 389 to 1086 bp which are confirmed by sequencing; (c) The deletion plasmids were cotransfected with pGL3-basic and pGL3-promoter into C2C12 cells; the cells were harvested 24 h later after transfection and luciferase activity was measured and expressed in relative luciferase units (RLU). The values represent means ± SE. vector represents pGL3-basic, n = 3, ** p < 0.01, by analysis of variance with one-way ANOVA.
Ijms 17 00682 g004aIjms 17 00682 g004b
Figure 5. Analysis of the cattle UCP3 promoter. (A) Analysis of activity of pGL3-basic-ucp3-pro/pGL3-basic and pGL3-promoter-ucp3-pro/pGL3-basic; (B) Analysis of activity of of pGL3-promoter-ucp3-pro/pGL3-basic and pGL3-promoter-ucp3-pro/pGL3-promoter. (a) Schematic diagram of the ucp3 promoter constructs consisting of the 5′-flanking region with serial deletions cloned into the pGL3-basic and pGL3-promoter vector. The arrows show the direction of transcription. The numbers represent the end points of each construct; (b) The deletion plasmids were digested by the restriction enzyme and run on a 1.5% agarose gel. The size of vector is 4.8 kb. The inserted fragments of the ucp3 promoter range from 389 to 1086 bp which are confirmed by sequencing; (c) The deletion plasmids were cotransfected with pGL3-basic and pGL3-promoter into C2C12 cells; the cells were harvested 24 h later after transfection and luciferase activity was measured and expressed in relative luciferase units (RLU).
Ijms 17 00682 g005
Figure 6. Identification and analysis of PEGFP-N3-ucp3-pro. (a) Enzyme digestion results of PEGFP-N3-ucp3-pro recombinant plasmid. M represent 15,000 bp marker, from1 to 6, the results represent PEGFP-N3-ucp3-p1–PEGFP-N3-ucp3-p6, respectively; (bh) The green fluorescence of recombinant expression vector PEGFP-N3-ucp3-pro transitional C2C12 cell (Fluorescent inverted microscope ×20).
Ijms 17 00682 g006
Figure 7. Transcription factor screening results. (A) The comparison chart of the control group and experimental group processing value of the screened out transcription factors; (B) The comparison chart of the control group and experimental group processing value of some transcription factors.
Ijms 17 00682 g007aIjms 17 00682 g007b
Figure 8. The effect of transcriptional activity of Guangling Cattle UCP3 promoter by MRFs family and myocyte-specific enhancer factor 2A (MEF2A) in C2C12 myoblasts.C2C12 myoblasts were transfected with the reporter gene constructs, pGL3-basic-ucp3-p1, pGL3-Basic, and the internal control, pcDNA3.1(+)-MRFs family and pcDNA3.1(+)-MEF2A expression vector. After 48 h, the cells were harvested for reporter gene assays. The normalized firefly luciferase activity of the experimental group was compared to that of the control group, which was transfected with an empty expression vector containing no cDNA. The control group (open bar) value was set at 1.0, with the fold induction of each group being determined. The bars represent the means ± SE of triplicate determinations.
Ijms 17 00682 g008
Figure 9. Cloned and identified sequence of the cattle UCP3 promoter (a) The electrophoretogram of DNA, the product was run on a 1.5% agarose gel; (b) Different PCR products of UCP3 promoters; (c) Restriction analysis Identification of pUCm-T-ucp3-pro.
Ijms 17 00682 g009
Table 1. Sequence prediction results of uncoupling protein 3 (UCP3) promoter.
StartEndScorePromoter Sequence (5′ to 3′)
−907−8570.95ATTAAAATGCATGAATCCGCAGTCATAAAAAGGCACGAAGTGCTGACATA
−842−7920.87AACTTGGAAAACACTTTGGTAAGTAAAAGAAGCCAGTCACAAAAGGTCA
−449−3990.80GAATTAGCATCACCATTGTTACTATTAAGAGGAGGCCCAGGGGAACCCTG
−301−2510.99TCATCACCTGCAATGGGGTGTTTTAAAGAAGCCCAAGTCAAGGGAACTGA
−154−1041.00AAGGTTTCAGGTCAGCCAGAGTGTATAAAGACAGGTGCCAAGCCAGAGGC
−52−21.00CCTGGGATGGAGCCCTGAGGACCCTTAAAGAGGCCCCATGCTTCCGCCAC
Table 2. The prediction results of transcription factor binding sites of UCP3 gene promoter in Guanling cattle by online software TFSEARCH.
SiteTranscription Factor Binding Sites
−1300~−1200 bpGATA-1, p300, MZF1
−1200~−1100 bpGATA-1, GATA-2, GATA-3, GATA-X, C/EBPb, C/EBP, MZF1
−1100~−1000 bpCdxA, Nkx-2, AML-1a, GATA-1, GATA-2, GATA-3, GATA-X, Cdx, COUP-T
−1000~−900 bpNF-kap, Lyf-1, CdxA, NF-kap, Sox-5, GATA-1, Pbx-1
−900~−800 bpCdxA, C/EBP
−800~−700 bpGATA-X, GATA-2, CdxA, SRY, Egr-1, Egr-2, Egr-3, NGFI-C
−700~−600 bpMZF1, Oct-1, GATA-1, CdxA, AML-1a, Nkx-2
−600~−500 bpCdxA, C/EBP, USF, Nkx-2, SRY, C/EBPb, HNF-3b, S8, HFH-2
−500~−400 bpSox-5, GATA-1, S8, Oct-1, Nkx-2, CdxA
−400~−300 bpCdxA, GATA-X, AML-1a, HNF-4, GATA-1, deltaE, C/EBPb, USF, Lyf-1
−300~−200 bpTATA, SRY , AML-1a, Nkx-2, USF, Sp1
−200~−100 bpNkx-2, USF, deltaE, CdxA, TATA, MyoD
−100~+1 bpNkx-2, USF, deltaE, CdxA, TATA, MyoD
+1~+100 bpGATA-1, GATA-2, CdxA
Table 3. Sequences of primers used for real-time PCR.
Gene SymbolForward Primer (5′ to 3′)Reverse Primer (5′ to 3′)Length (bp)
β-actinGCAGGTCATCACCATCGGGCTGTCACCTTCACCGTTC564 bp
RPL4AGGAGGCTGTGTTGCTTCTGCGACGGTTTCTCATCTTGC106 bp
18SRNAGACTCAACACGGGAAACCTCAGACAAATCGCTCCACCAAC120 bp
UCP3TCTACGACTCCGTCAAGCCTGGCGATGGTCCTGT469 bp
Table 4. Sequences of primers of UCP3 promoter used for PCR.
Gene SymbolForward Primer (5′ to 3′)Reverse Primer (5′ to 3′)Length (bp)Tm (°C)
UCP3-P1CTAGCTAGCTACCCTCAGTGCCTATCACCGCTCGAGGCCATTTGCTGGTGTCT108056
UCP3-P2CTAGCTAGCGCCTCCAAGTGTCATGTCCGCTCGAGGCCATTTGCTGGTGTCT98060
UCP3-P3CTAGCTAGCTGAATCCGCAGTCATAAACCGCTCGAGGCCATTTGCTGGTGTCT81460
UCP3-P4CTAGCTAGCTGAAGGGAAGAGGAAACACCGCTCGAGGCCATTTGCTGGTGTCT62459.4
UCP3-P5CTAGCTAGCCCTACCTCGTAAGAGTTGTGCCGCTCGAGGCCATTTGCTGGTGTCT43760
UCP3-P6CTAGCTAGCCACATAGTAGGCACCAAGACCGCTCGAGGCCATTTGCTGGTGTCT38959.3
Table 5. The system of experimental group and control group.
ReagentExperimental Group (μL)Compare Group (μL)
TF Binding buffer mix1515
TF Probe mix33
UCP3 promoter PCR fragment50
Nuclear extract66
ddH2O16
Total Volume3030
Table 6. Sequences of primers of coding sequence of MRFs family and myocyte-specific enhancer factor 2A (MEF2A) used for PCR.
Gene SymbolForward Primer (5′ to 3′)Reverse Primer (5′ to 3′)Length (bp)
MyoDEcoRI: CCGGAATTCATGGAGCTGCTGTCGCXhoI: CCGCTCGAGTCAGAGCACCTGGTAAAT975
Myf5EcoRI: CCGGAATTCATGGACATGATGGACGGCTGXhoI: CCGCTCGAGTCATAGCACATGATAGATG786
Myf6KpnI: CGGGATCCATGATGATGGACCTTTTTGAAACTGGCEcoRI: CGGAATTCTTACTTCTCCACCACCTCCTCCACGCAG745
MyoGBamHI: GGGGTACCATGGAGCTGTATGAGACCTCTEcoRI: CGGAATTCTCAGTTTGGTATGGTTTCATCTGG691
MEF2AEcoRI: CCGGAATTCATGGGGCGGAAGAAAATACAAXhoI: CCGCTCGAGGTTAGGTCACCCACGCATC1498

