
Individual Assessment of Brain Tissue Changes in MS and the Effect of Focal Lesions on Short-Term Focal Atrophy Development in MS: A Voxel-Guided Morphometry Study

Abstract
:
1. Introduction
2. Results
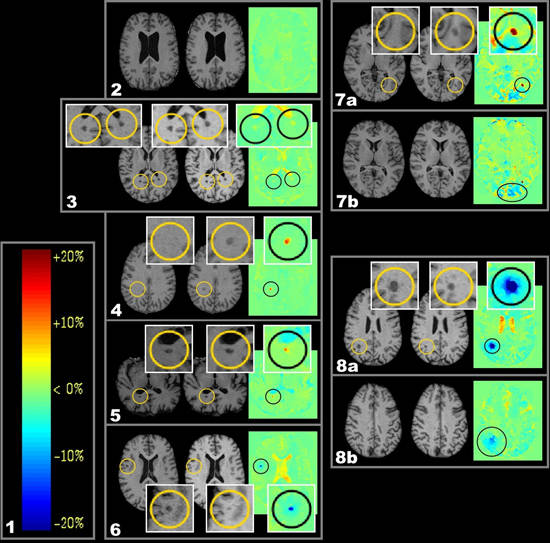
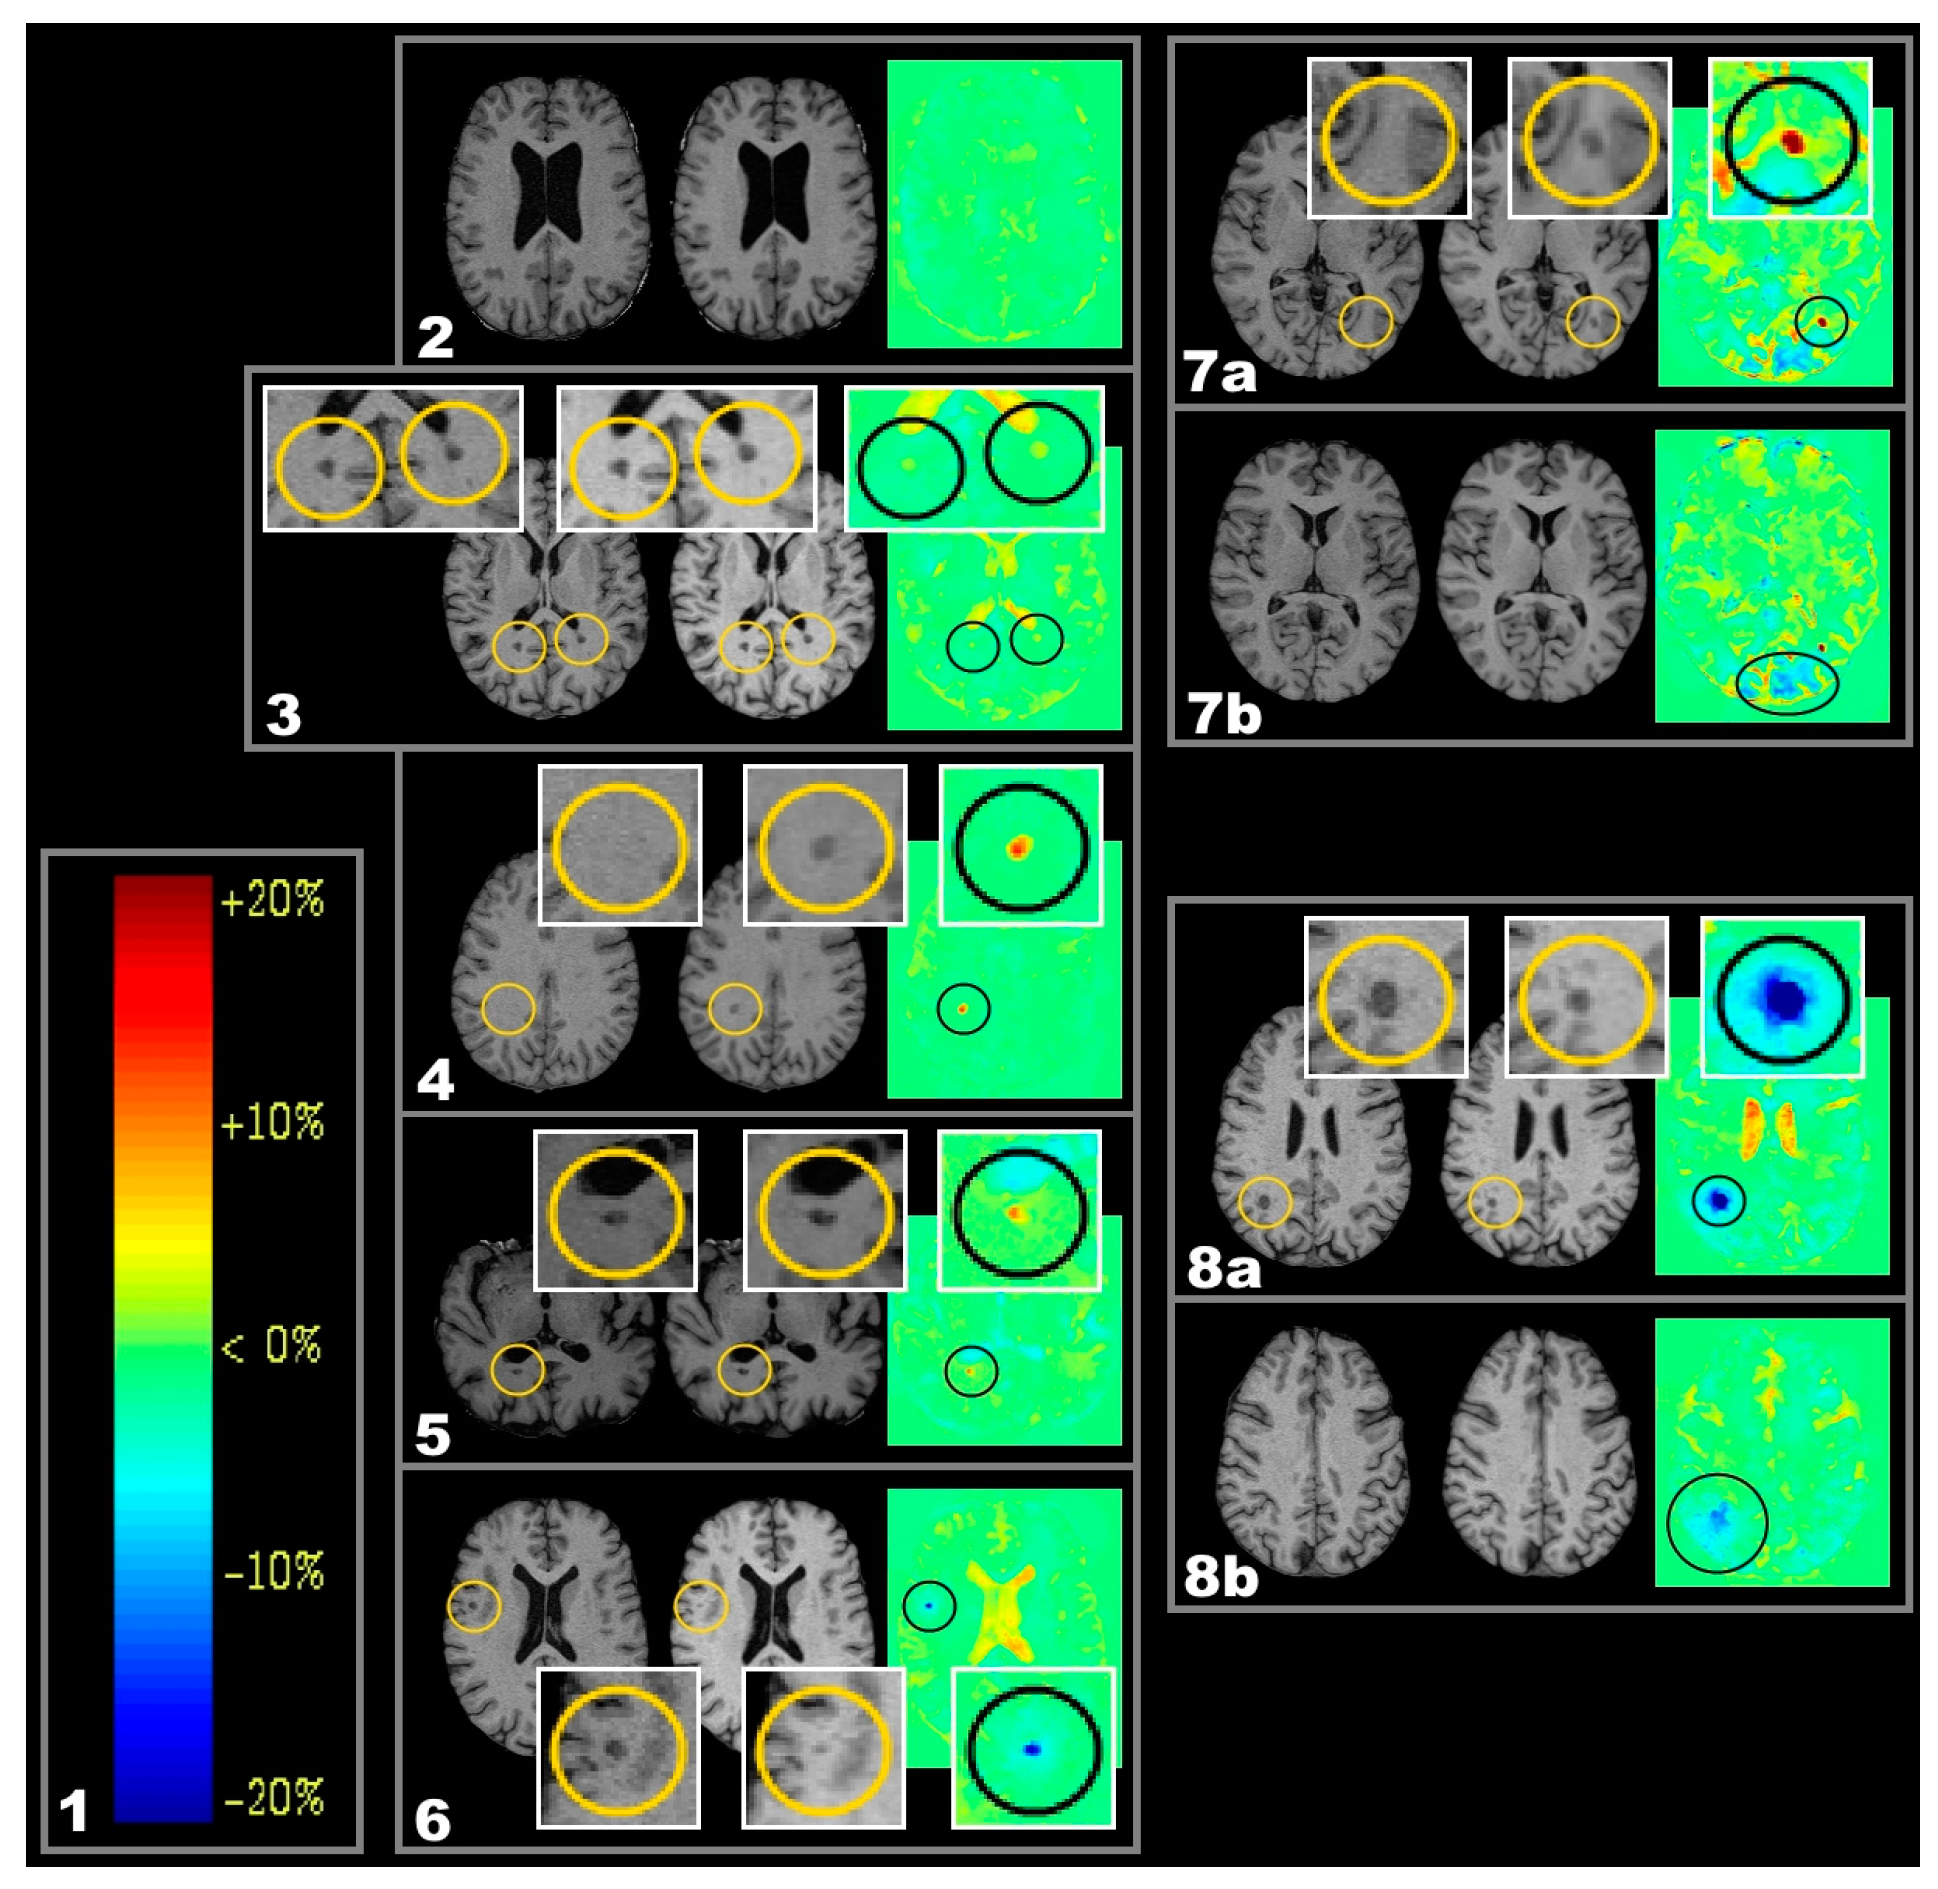
2.1. Lesion Types
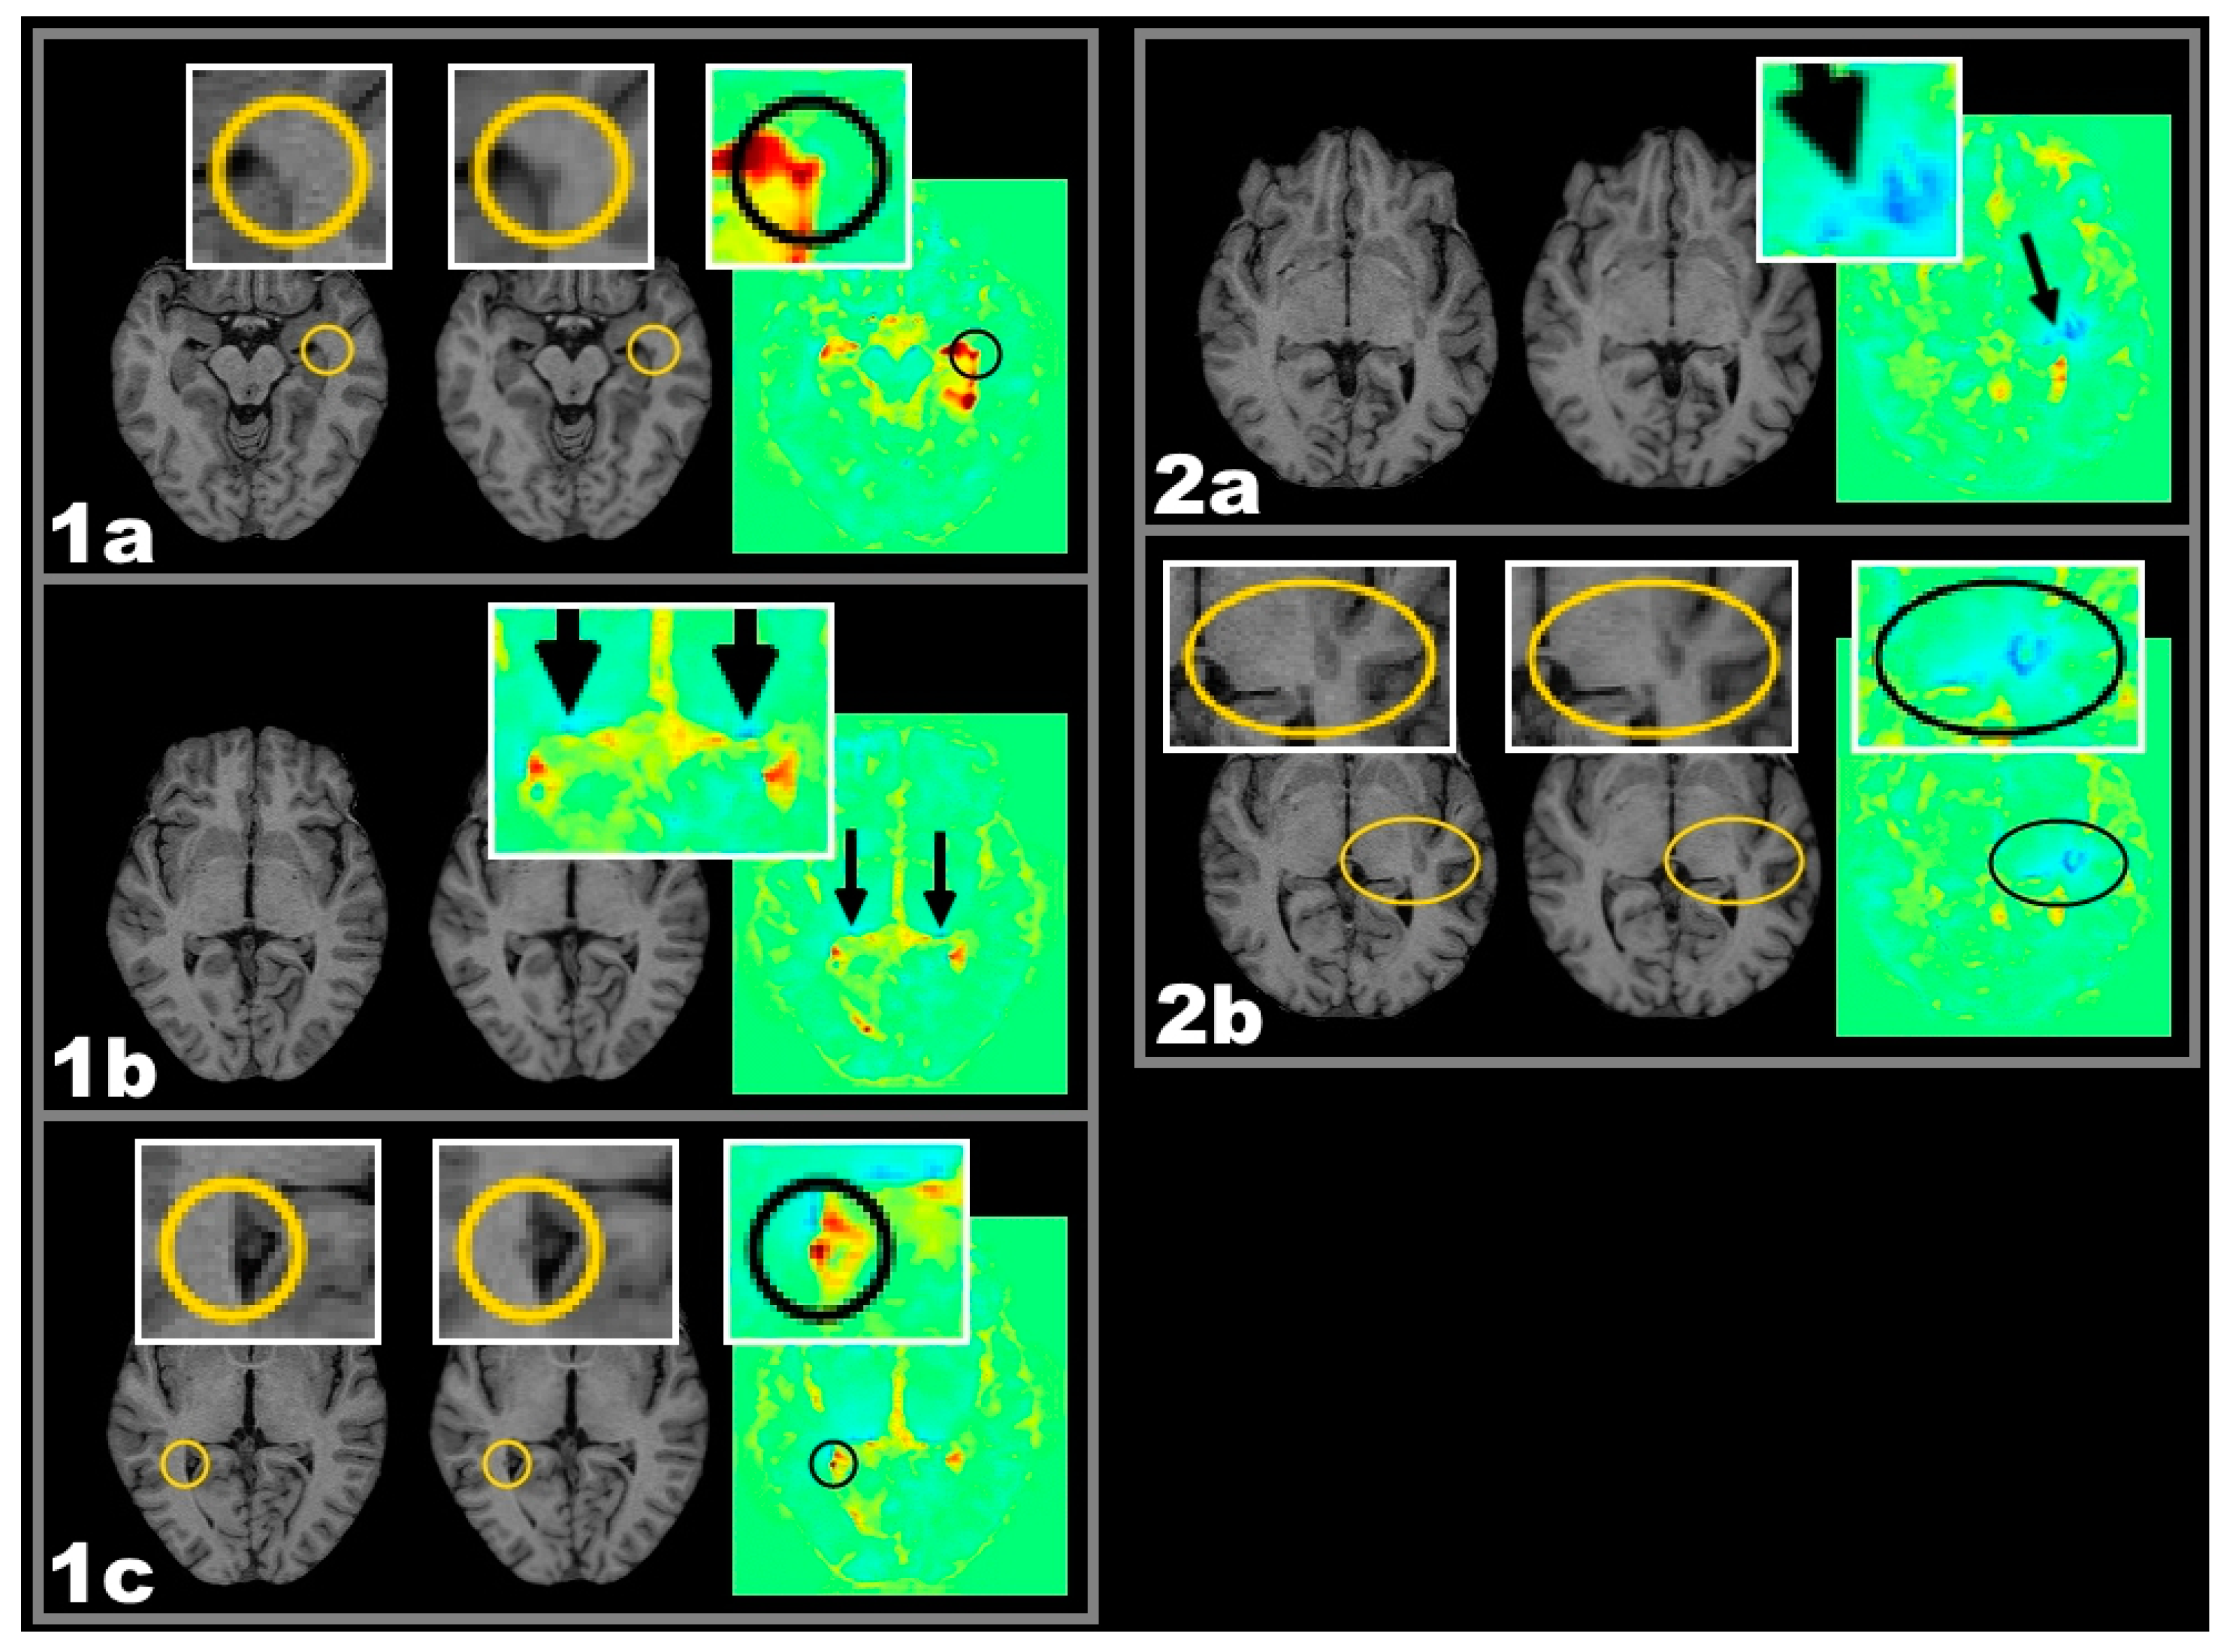
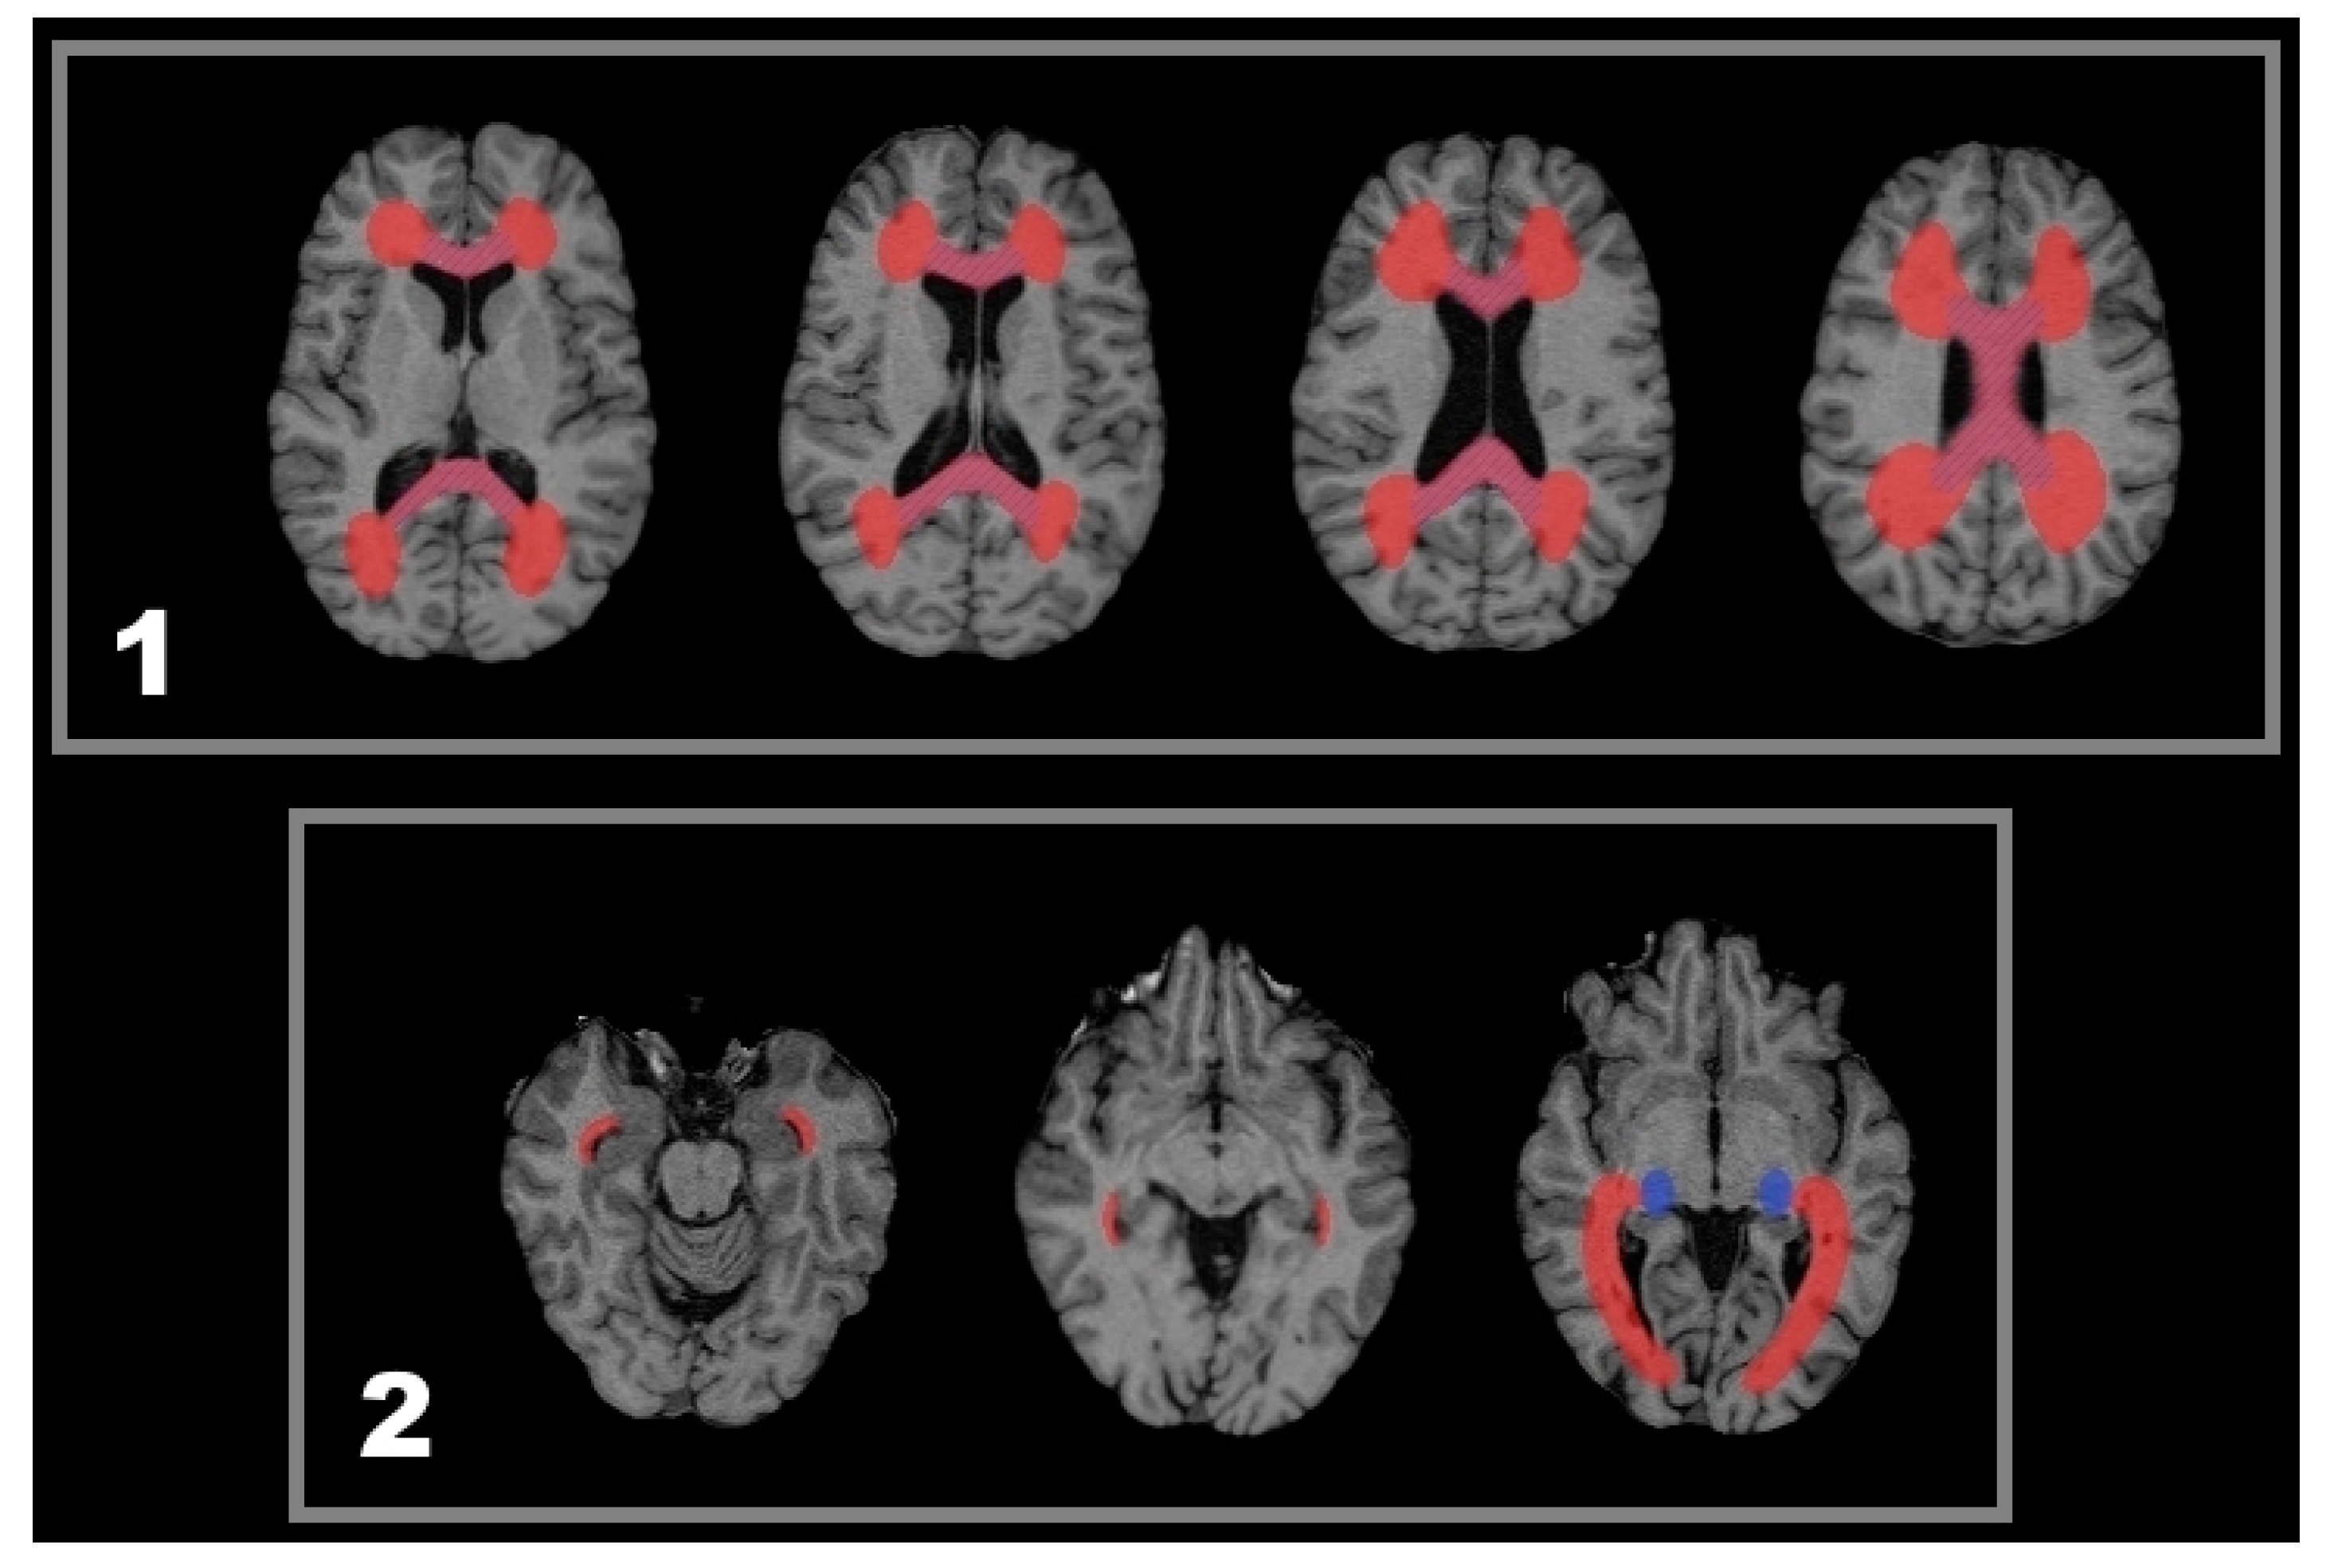
2.2. Lesion-Related Atrophy of the Corpus Callosum and the Lateral Geniculate Nucleus (LGN)
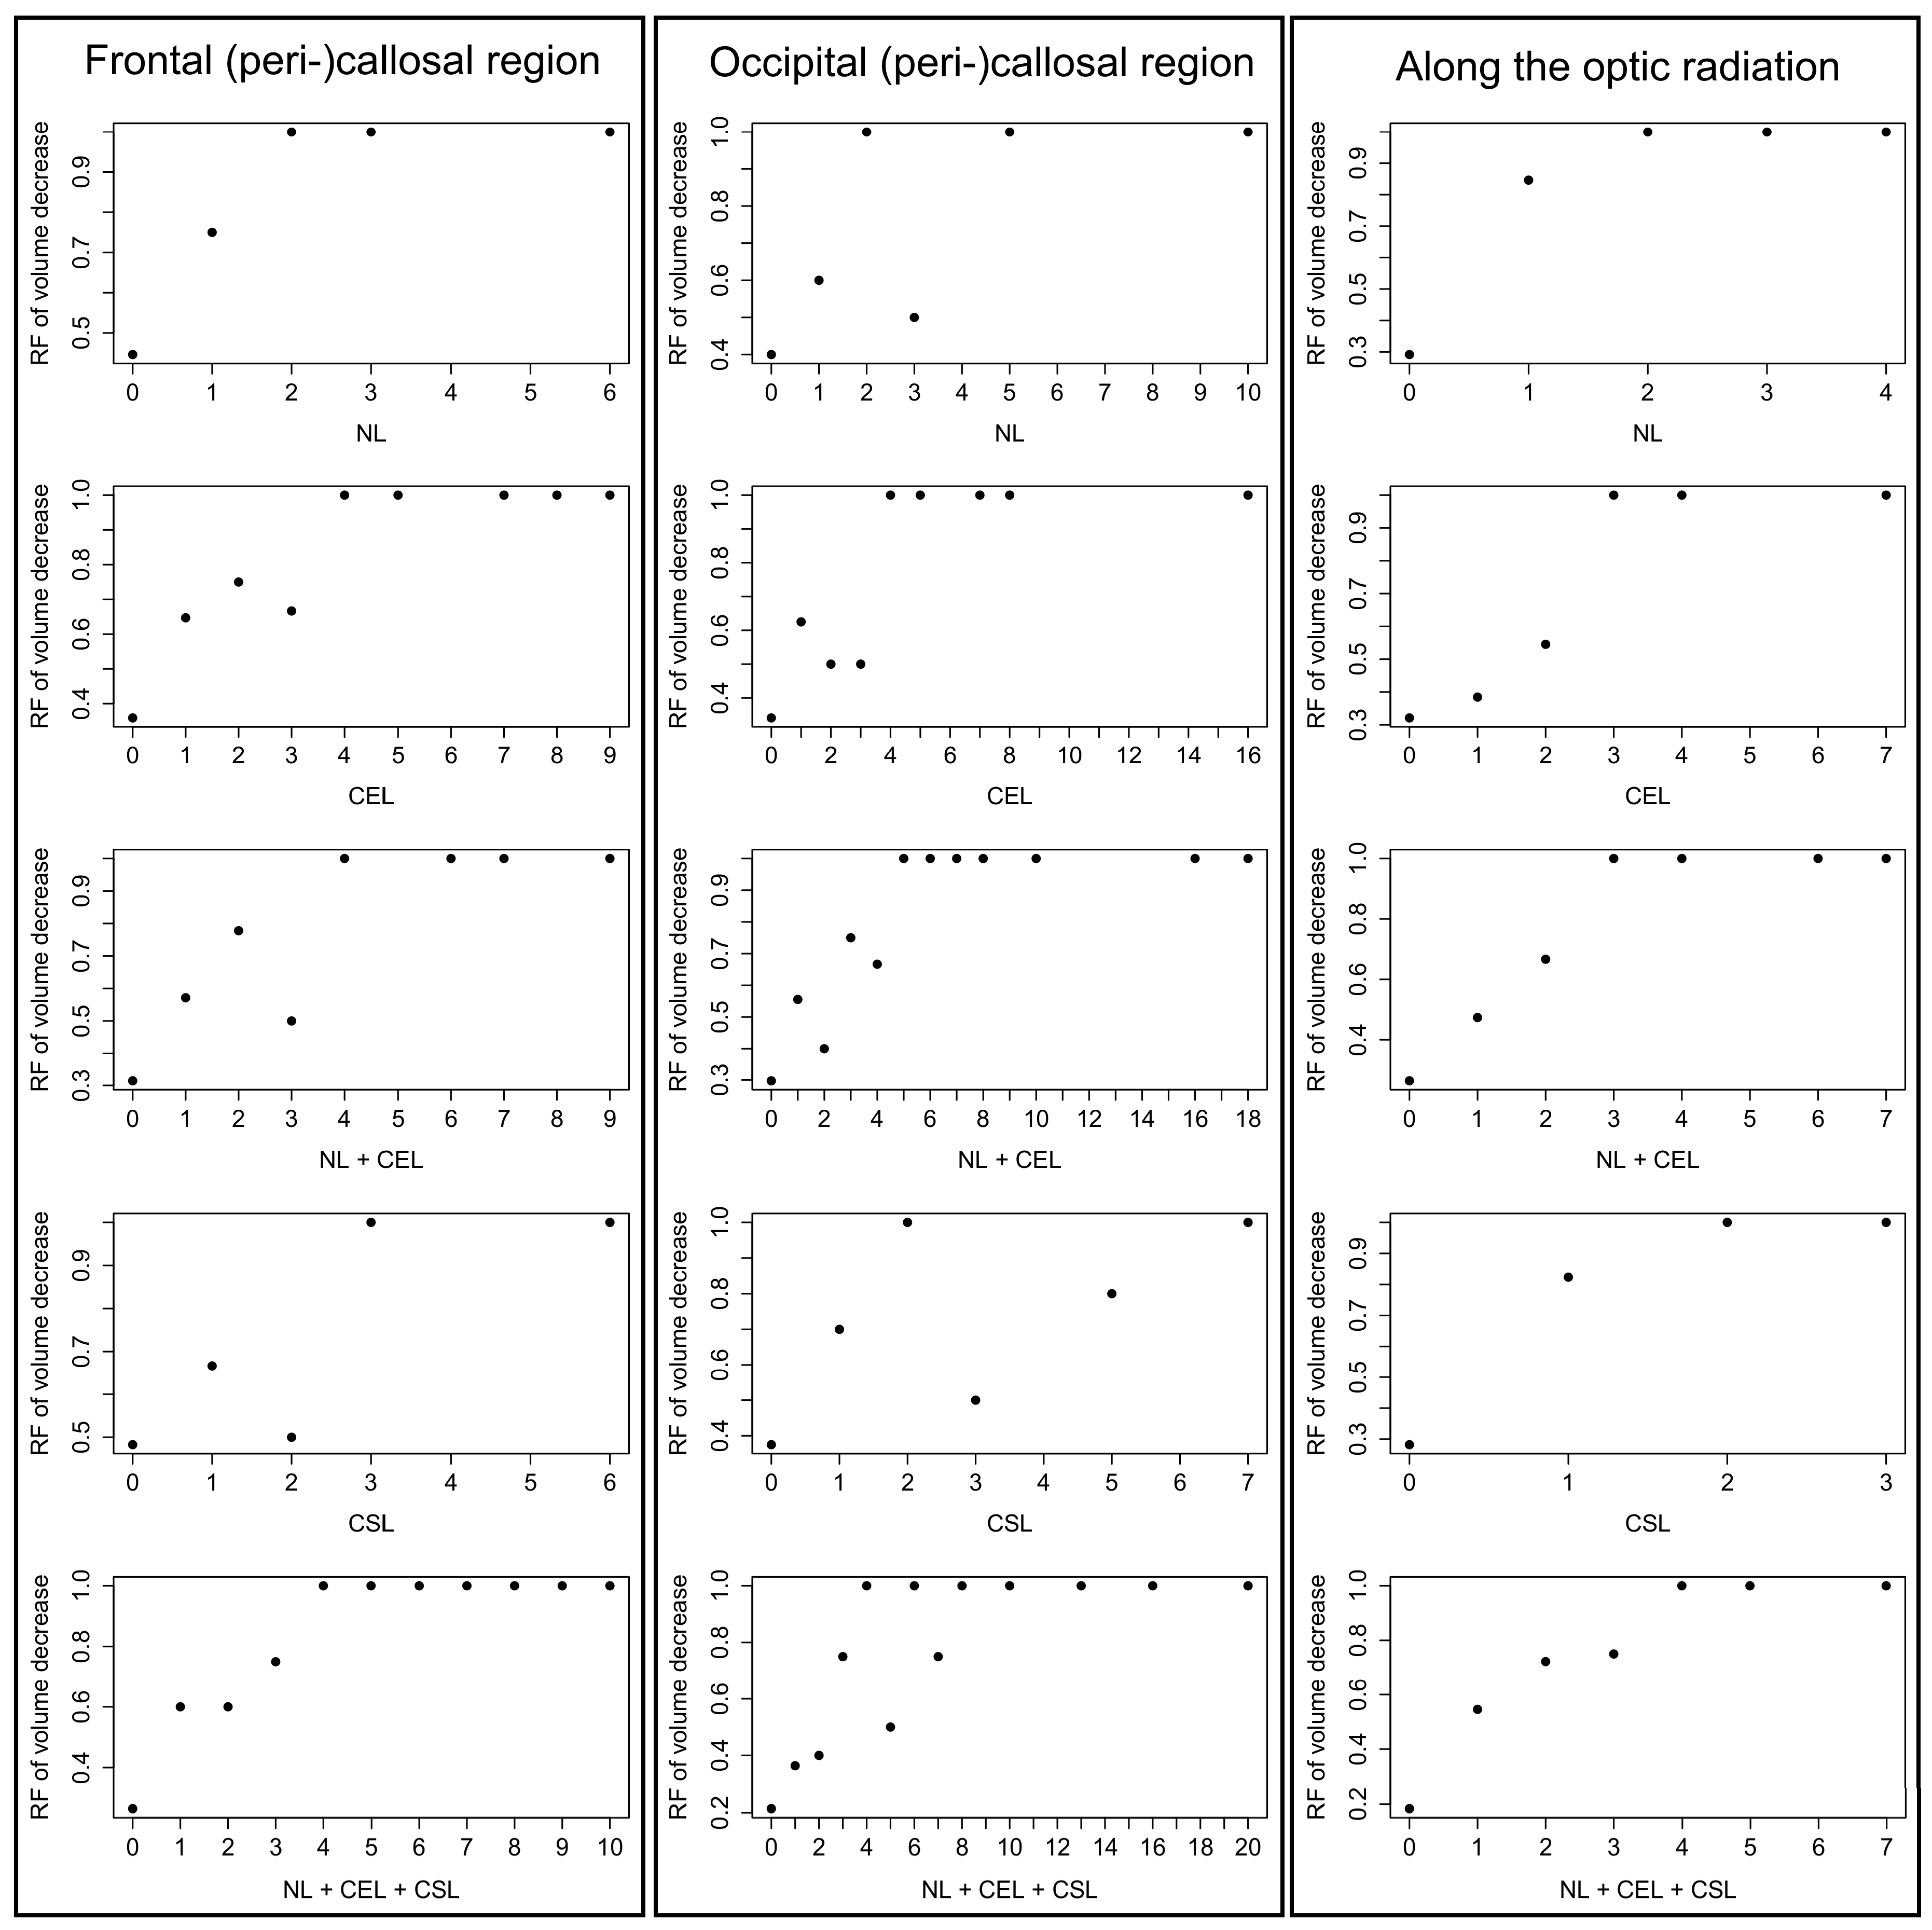
2.2.1. Frequencies of Lesions in Patients with Callosal or LGN Volume Reduction
2.2.2. Logistic Regression Analysis
2.2.3. Testing for Confounder-Effects of Lesion Types
3. Discussion
3.1. Lesion-Related Atrophy
- Since the brain was modelled as an elastic medium, expansion at one location in VGM may be expected to be accompanied by volume reduction in its surroundings and vice versa [18].
- Independent of the image processing by VGM, there may as well be actual tissue shrinkage due to mechanical compression consecutive to lesion enlargement.
- 3.
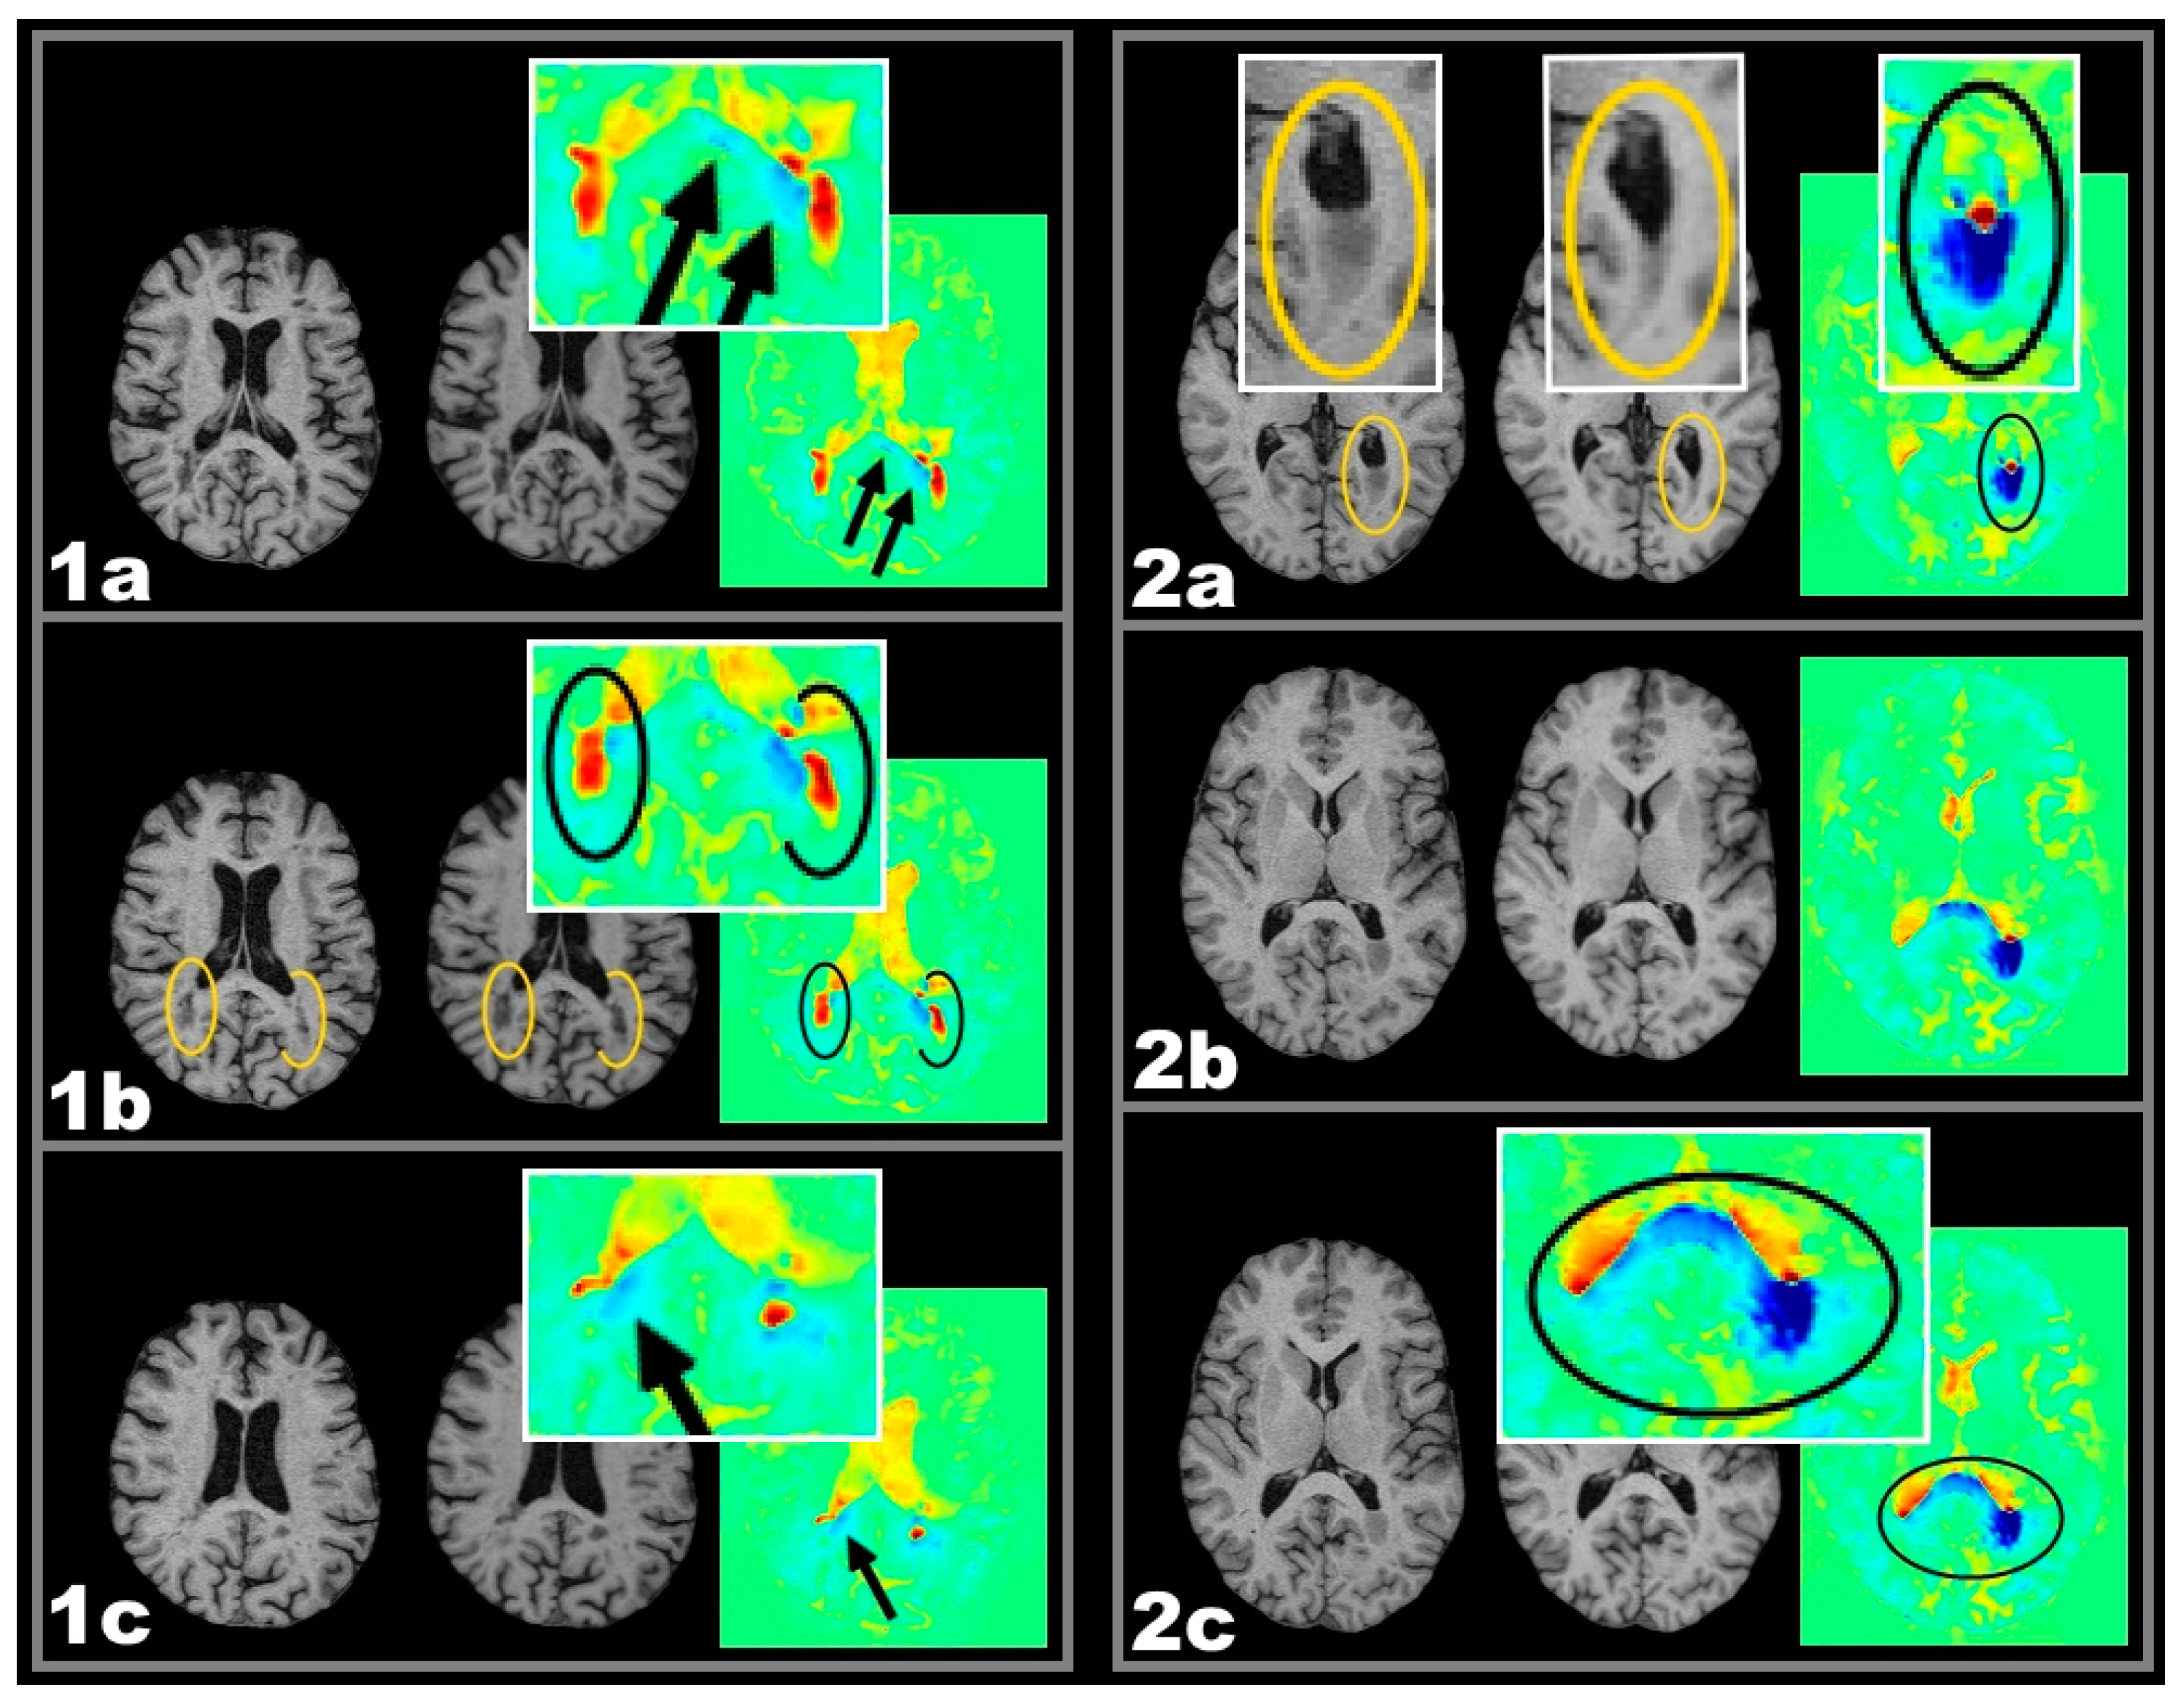
- Therefore, volume reduction associated with lesions located in anatomical and functional relationship might be explained better by assuming a causal relationship. The spatial lesion-atrophy relation appears to be well in line with the possibility of an underlying causal mechanism. e.g., in both cases of Figure 2, lesion location strongly suggests the lesions to have considerable effect on callosal fibres and callosal shrinkage follows the course of those fibres, which are suspected to be damaged.
3.1.1. Chronic Shrinking Lesions
3.1.2. Limitations
4. Experimental Section
4.1. Patients and Magnetic Resonace Imaging (MRI) Protocol
4.2. Segmentation and Voxel-Guided Morphometry (VGM) Processing
4.3. Lesion Types and Cut-off Points for Volume Increase/Reduction
4.4. Lesion Sizes
4.5. Statistical Analysis—Lesion Related Local Volume Decrease
4.6. Statistical Analysis—Logistic Regression
5. Conclusions
Acknowledgments
Author Contributions
Conflicts of Interest
References
- Bö, L.; Geurts, J.J.G.; Mörk, S.J.; Valk, P. Grey matter pathology in multiple sclerosis. Acta Neurol. Scand. 2006, 113, 48–50. [Google Scholar] [CrossRef] [PubMed]
- Bø, L.; Vedeler, C.A.; Nyland, H.I.; Trapp, B.D.; Mørk, S.J. Subpial demyelination in the cerebral cortex of multiple sclerosis patients. J. Neuropathol. Exp. Neurol. 2003, 62, 723–732. [Google Scholar] [CrossRef] [PubMed]
- Brex, P.A.; Jenkins, R.; Fox, N.C.; Crum, W.R.; O’Riordan, J.I.; Plant, G.T.; Miller, D.H. Detection of ventricular enlargement in patients at the earliest clinical stage of MS. Neurology 2000, 54, 1689–1691. [Google Scholar] [CrossRef] [PubMed]
- Kutzelnigg, A.; Lassmann, H. Cortical lesions and brain atrophy in MS. J. Neurol. Sci. 2005, 233, 55–59. [Google Scholar] [CrossRef] [PubMed]
- Miller, D.H.; Barkhof, F.; Frank, J.A.; Parker, G.J.M.; Thompson, A.J. Measurement of atrophy in multiple sclerosis: Pathological basis, methodological aspects and clinical relevance. Brain 2002, 125, 1676–1695. [Google Scholar] [CrossRef] [PubMed]
- Barkhof, F.; Calabresi, P.A.; Miller, D.H.; Reingold, S.C. Imaging outcomes for neuroprotection and repair in multiple sclerosis trials. Nat. Rev. Neurol. 2009, 5, 256–266. [Google Scholar] [CrossRef] [PubMed]
- Leist, T.P.; Marks, S. Magnetic resonance imaging and treatment effects of multiple sclerosis therapeutics. Neurology 2009, 74, 54–61. [Google Scholar] [CrossRef] [PubMed]
- Sepulcre, J.; Goñi, J.; Masdeu, J.C.; Bejarano, B.; Vélez de Mendizábal, N.; Toledo, J.B.; Villoslada, P. Contribution of white matter lesions to gray matter atrophy in multiple sclerosis: evidence from voxel-based analysis of T1 lesions in the visual pathway. Arch. Neurol. 2009, 66, 173–179. [Google Scholar] [CrossRef] [PubMed]
- Mühlau, M.; Buck, D.; Förschler, A.; Boucard, C.C.; Arsic, M.; Schmidt, P.; Gaser, C.; Berthele, A.; Hoshi, M.; Jochim, A.; et al. White-matter lesions drive deep gray-matter atrophy in early multiple sclerosis: Support from structural MRI. Mult. Scler. J. 2013, 19, 1485–1492. [Google Scholar]
- Simon, J.H.; Zhang, S.; Laidlaw, D.H.; Miller, D.E.; Brown, M.; Corboy, J.; Bennett, J. Identification of fibers at risk for degeneration by diffusion tractography in patients at high risk for MS after a clinically isolated syndrome. J. Magn. Reson. Imaging 2006, 24, 983–988. [Google Scholar] [CrossRef] [PubMed]
- Simon, J.H.; Kinkel, R.P.; Jacobs, L.; Bub, L.; Simonian, N. A Wallerian degeneration pattern in patients at risk for MS. Neurology 2000, 54, 1155–1160. [Google Scholar] [CrossRef] [PubMed]
- Droby, A.; Fleischer, V.; Carnini, M.; Zimmermann, H.; Siffrin, V.; Gawehn, J.; Erb, M.; Hildebrandt, A.; Baier, B.; Zipp, F. The impact of isolated lesions on white-matter fiber tracts in multiple sclerosis patients. NeuroImage Clin. 2015, 8, 110–116. [Google Scholar] [CrossRef] [PubMed]
- Klistorner, A.; Vootakuru, N.; Wang, C.; Yiannikas, C.; Graham, S.L.; Parratt, J.; Garrick, R.; Levin, N.; Masters, L.; Lagopoulos, J.; et al. Decoding diffusivity in multiple sclerosis: Analysis of optic radiation lesional and non-lesional white matter. PLoS ONE 2015, 10, e0122114. [Google Scholar] [CrossRef] [PubMed]
- Giannetti, P.; Politis, M.; Su, P.; Turkheimer, F.; Malik, O.; Keihaninejad, S.; Wu, K.; Reynolds, R.; Nicholas, R.; Piccini, P. Microglia activation in multiple sclerosis black holes predicts outcome in progressive patients: An in vivo [(11)C](R)-PK11195-PET pilot study. Neurobiol. Dis. 2014, 65, 203–210. [Google Scholar] [CrossRef] [PubMed]
- Sahraian, M.A.; Radue, E.W. MS Lesions in T2-Weighted Images. In MRI Atlas of MS Lesions; Springer Berlin Heidelberg: Berlin, Germany; Heidelberg, Germany, 2008; pp. 3–34. [Google Scholar]
- Calabrese, M.; Rocca, M.A.; Atzori, M.; Mattisi, I.; Favaretto, A.; Perini, P.; Gallo, P.; Filippi, M. A 3-year magnetic resonance imaging study of cortical lesions in relapse-onset multiple sclerosis. Ann. Neurol. 2010, 67, 376–383. [Google Scholar] [PubMed]
- Sahraian, M.A.; Eshaghi, A. Role of MRI in diagnosis and treatment of multiple sclerosis. Clin. Neurol. Neurosurg. 2010, 112, 609–615. [Google Scholar] [CrossRef] [PubMed]
- Schormann, T.; Kraemer, M. Voxel-guided morphometry (VGM) and application to stroke. IEEE Trans. Med. Imaging 2003, 22, 62–74. [Google Scholar] [CrossRef] [PubMed]
- Simon, J.H. Brain atrophy in multiple sclerosis: what we know and would like to know. Mult. Scler. 2006, 12, 679–687. [Google Scholar] [CrossRef] [PubMed]
- Trapp, B.D.; Nave, K.A. Multiple sclerosis: An immune or neurodegenerative disorder? Annu. Rev. Neurosci. 2008, 31, 247–269. [Google Scholar] [CrossRef] [PubMed]
- Bendfeldt, K.; Kuster, P.; Traud, S.; Egger, H.; Winklhofer, S.; Mueller-Lenke, N.; Naegelin, Y.; Gass, A.; Kappos, L.; Matthews, P.M.; et al. Association of regional gray matter volume loss and progression of white matter lesions in multiple sclerosis–A longitudinal voxel-based morphometry study. NeuroImage 2009, 45, 60–67. [Google Scholar] [CrossRef] [PubMed]
- Brück, W. Inflammatory demyelination is not central to the pathogenesis of multiple sclerosis. J. Neurol. 2005, 252, 10–15. [Google Scholar] [CrossRef] [PubMed]
- Chard, D.T.; Griffin, C.M.; Parker, G.J.M.; Kapoor, R.; Thompson, A.J.; Miller, D.H. Brain atrophy in clinically early relapsing–remitting multiple sclerosis. Brain 2002, 125, 327–337. [Google Scholar] [CrossRef] [PubMed]
- Waller, A. Experiments on the section of the glossopharyngeal and hypoglossal nerves of the frog, and observations of the alterations produced thereby in the structure of their primitive fibres. Philos. Trans. R. Soc. Lond. 1850, 140, 423–429. [Google Scholar] [CrossRef]
- Valsasina, P.; Horsfield, M.A.; Rocca, M.A.; Absinta, M.; Comi, G.; Filippi, M. Spatial normalization and regional assessment of cord atrophy: Voxel-based analysis of cervical cord 3D T1-weighted images. Am. J. Neuroradiol. 2012, 33, 2195–2200. [Google Scholar] [CrossRef] [PubMed]
- Valsasina, P.; Rocca, M.A.; Horsfield, M.A.; Absinta, M.; Messina, R.; Caputo, D.; Comi, G.; Filippi, M. Regional cervical cord atrophy and disability in multiple sclerosis: A voxel-based analysis. Radiology 2013, 266, 853–861. [Google Scholar] [CrossRef] [PubMed]
- Uggetti, C.; Egitto, M.G.; Fazzi, E.; Bianchi, P.E.; Zappoli, F.; Martelli, A.; Lanzi, G. Transsynaptic degeneration of lateral geniculate bodies in blind children: In vivo MR demonstration. Am. J. Neuroradiol. 1997, 18, 233–238. [Google Scholar] [PubMed]
- Beatty, R.M.; Sadun, A.A.; Smith, L.E.H.; Vonsattel, J.P.; Richardson, E.P. Direct demonstration of transsynaptic degeneration in the human visual system: A comparison of retrograde and anterograde changes. J. Neurol. Neurosurg. Psychiatry 1982, 45, 143–146. [Google Scholar] [CrossRef] [PubMed]
- Mesaros, S.; Rocca, M.A.; Absinta, M.; Ghezzi, A.; Milani, N.; Moiola, L.; Veggiotti, P.; Comi, G.; Filippi, M. Evidence of thalamic gray matter loss in pediatric multiple sclerosis. Neurology 2007, 70, 1107–1112. [Google Scholar] [CrossRef] [PubMed]
- Benninghoff, A.; Drenckhahn, D.; Rager, G. Visuelles System. In Anatomie; Drenckhahn, D., Ed.; Elsevier: München, Germany, 2004; Volume 2, pp. 650–706. [Google Scholar]
- Evangelou, N.; Konz, D.; Esiri, M.M.; Smith, S.; Palace, J.; Matthews, P.M. Regional axonal loss in the corpus callosum correlates with cerebral white matter lesion volume and distribution in multiple sclerosis. Brain J. Neurol. 2000, 123, 1845–1849. [Google Scholar] [CrossRef]
- Rejdak, K.; Jackson, S.; Giovannoni, G. Multiple sclerosis: A practical overview for clinicians. Br. Med. Bull. 2010, 95, 79–104. [Google Scholar] [CrossRef] [PubMed]
- Boy, S.; Sauerbruch, S.; Kraemer, M.; Schormann, T.; Schlachetzki, F.; Schuierer, G.; Luerding, R.; Hennemann, B.; Orso, E.; Berenguer, J.; et al. RAIS (Regeneration in Acute Ischemic Stroke) Study Group Mobilisation of hematopoietic CD34+ precursor cells in patients with acute stroke is safe—Results of an open-labeled non randomized phase I/II trial. PLoS ONE 2011, 6, e23099. [Google Scholar] [CrossRef] [PubMed] [Green Version]
- Kraemer, M.; Schormann, T.; Hagemann, G.; Qi, B.; Witte, O.W.; Seitz, R.J. Delayed shrinkage of the brain after ischemic stroke: preliminary observations with voxel-guided morphometry. J. Neuroimaging Off. J. Am. Soc. Neuroimaging 2004, 14, 265–272. [Google Scholar] [CrossRef]
- Bitsch, A.; Brück, W. MRI-pathological correlates in MS. Int. MS J. 2001, 8, 89–95. [Google Scholar]
- Benjamin, C.F.A.; Singh, J.M.; Prabhu, S.P.; Warfield, S.K. Optimization of tractography of the optic radiations. Hum. Brain Mapp. 2012, 35, 683–697. [Google Scholar] [CrossRef] [PubMed]
- Bürgel, U.; Schormann, T.; Schleicher, A.; Zilles, K. Mapping of histologically identified long fiber tracts in human cerebral hemispheres to the MRI volume of a reference brain: position and spatial variability of the optic radiation. NeuroImage 1999, 10, 489–499. [Google Scholar] [CrossRef] [PubMed]
- Ebeling, U.; Reulen, H.J. Neurosurgical topography of the optic radiation in the temporal lobe. Acta Neurochir. 1988, 92, 29–36. [Google Scholar] [CrossRef] [PubMed]
- Peltier, J.; Travers, N.; Destrieux, C.; Velut, S. Optic radiations: A microsurgical anatomical study. J. Neurosurg. 2006, 105, 294–300. [Google Scholar] [CrossRef] [PubMed]
- Sincoff, E.H.; Tan, Y.; Abdulrauf, S.I. White matter fiber dissection of the optic radiations of the temporal lobe and implications for surgical approaches to the temporal horn. J. Neurosurg. 2004, 101, 739–746. [Google Scholar] [CrossRef] [PubMed]
- Kretschmann, H.J.; Weinrich, W.; Fiekert, W. Neurofunctional Systems: 3D Reconstructions with Correlated Neuroimaging; Thieme: Stuttgart, NY, USA, 1998. [Google Scholar]
- Robin, X.; Turck, N.; Hainard, A.; Tiberti, N.; Lisacek, F.; Sanchez, J.C.; Müller, M. pROC: An open-source package for R and S+ to analyze and compare ROC curves. BMC Bioinform. 2011, 12. [Google Scholar] [CrossRef] [PubMed]


| Lesion Categories | Effect = Odds Ratio | AUC | p-Value |
|---|---|---|---|
| new lesions (NL) frontal | 4.81 | 0.63 | 0.0338 |
| chronic enlarging lesions (CEL) frontal | 2.21 | 0.71 | 0.0157 |
| NL + CEL frontal | 2.38 | 0.75 | 0.0046 |
| chronic shrinking lesions (CSL) frontal | 1.91 | 0.57 | 0.1420 |
| NL + CEL + CSL frontal | 2.28 | 0.77 | 0.0027 |
| NL occipital | 2.25 | 0.64 | 0.0345 |
| CEL occipital | 1.99 | 0.72 | 0.0065 |
| NL + CEL occipital | 1.84 | 0.76 | 0.0020 |
| CSL occipital | 1.66 | 0.67 | 0.0307 |
| NL + CEL + CSL occipital | 1.76 | 0.82 | 0.0002 |
| Lesion Categories | Effect = Odds Ratio | AUC | p-Value |
|---|---|---|---|
| NL | 14.01 | 0.65 | 0.0006 |
| CEL | 1.90 | 0.59 | 0.0056 |
| NL + CEL | 2.68 | 0.68 | 0.0001 |
| CSL | 12.41 | 0.66 | 0.0001 |
| NL + CEL + CSL | 3.37 | 0.77 | 1.36 × 10⁻⁶ |
| Inclusion Criteria: | Exclusion Criteria: |
|---|---|
| Out-patient clinic recruitment (Of 202 recruited patients who participated in a genotype-phenotype multiple sclerosis (MS) study 92 patients were included into this study by random.) | – |
| Informed consent (in accordance with the approval requirements of the local ethics committee.) | – |
| Clinical stability (magnetic resonace imaging (MRI) scan of patients with an acute relapse was postponed for at least 30 days after the last dose of steroid treatment.) | – |
| – | Motion artefacts (This concerned 3/92 patients.) |
| Lesional volume alterations (This concerned 69/92 patients.) | Volumetric stability over the 12 month observation period (This concerned 20/92 patients.) |
© 2016 by the authors; licensee MDPI, Basel, Switzerland. This article is an open access article distributed under the terms and conditions of the Creative Commons by Attribution (CC-BY) license (http://creativecommons.org/licenses/by/4.0/).
Share and Cite
Fox, J.; Kraemer, M.; Schormann, T.; Dabringhaus, A.; Hirsch, J.; Eisele, P.; Szabo, K.; Weiss, C.; Amann, M.; Weier, K.; et al. Individual Assessment of Brain Tissue Changes in MS and the Effect of Focal Lesions on Short-Term Focal Atrophy Development in MS: A Voxel-Guided Morphometry Study. Int. J. Mol. Sci. 2016, 17, 489. https://doi.org/10.3390/ijms17040489
Fox J, Kraemer M, Schormann T, Dabringhaus A, Hirsch J, Eisele P, Szabo K, Weiss C, Amann M, Weier K, et al. Individual Assessment of Brain Tissue Changes in MS and the Effect of Focal Lesions on Short-Term Focal Atrophy Development in MS: A Voxel-Guided Morphometry Study. International Journal of Molecular Sciences. 2016; 17(4):489. https://doi.org/10.3390/ijms17040489
Chicago/Turabian StyleFox, Jan, Matthias Kraemer, Thorsten Schormann, Andreas Dabringhaus, Jochen Hirsch, Philipp Eisele, Kristina Szabo, Christel Weiss, Michael Amann, Katrin Weier, and et al. 2016. "Individual Assessment of Brain Tissue Changes in MS and the Effect of Focal Lesions on Short-Term Focal Atrophy Development in MS: A Voxel-Guided Morphometry Study" International Journal of Molecular Sciences 17, no. 4: 489. https://doi.org/10.3390/ijms17040489