
Iron in Multiple Sclerosis and Its Noninvasive Imaging with Quantitative Susceptibility Mapping

Abstract
:1. Introduction
2. Iron Detection Methods
2.1. Ex-Vivo Iron Detection and Measurement
2.1.1. Qualitative Detection of Iron—Histology
2.1.2. Quantitative Detection of Iron—Spectrometric Techniques
- Inductively Coupled Plasma Mass Spectrometry (ICP-MS) [4,62,63]: ICP-MS has become the most prominent method to quantitatively correlate iron concentration and MR-signal, in particular iron and R2* [17,64,65,66,67], although a quantitative mapping of the elemental distribution is not possible. However, ICP-MS in combination with laser ablation (LA-ICP-MS) allows for microlocal element analysis [68,69]. LA-ICP-MS has been use to quantitatively map the iron distribution of brain tissue [41,70].
- X-ray Fluorescence Spectrometry (XRF) or Rapid Scan X-ray fluorescence spectrometry (RS-XRF) [71,72]: This technique allows for iron mapping and experiments have been conducted at two different locations; at the Stanford Synchrotron radiation laboratories (SSRL) [73] or more recently at the new Diamond light source in Oxfordshire, UK [74].
2.2. In Vivo Iron Detection and Measurement
2.2.1. Qualitative MRI Methods
- T2-weighted imaging (T2w). Iron appears hypointense on T2-weighted images because paramagnetic iron produces a field in its surroundings, contributing to the incoherent thermal dephasing, i.e., enhancing the transverse relaxation rate 1/T2 = R2. Iron R2 enhancement increases with magnetic field strength [12]. Iron concentration has been shown to linearly correlate with R2 in DGM nuclei where iron distribution may be regarded as uniform [12,82,86,87,88]. However, the relationship remains difficult in both cortical grey matter (GM) and WM, due to the complex geometry of iron distribution [87].
- T2* weighted imaging (T2*w). This magnitude gradient echo imaging (GRE) based T2* contrast is sensitive to the intravoxel variation of the iron induced magnetic field [89], in additional to the T2 contrast. T2*w is more sensitive to iron than T2w and has become the method of choice for in vivo iron detection [90,91,92]. An enhanced version of T2*w is susceptibility weighted imaging (SWI), which applies a phase attenuation to further increase the hypointensity contrast in T2*w [17,93]. SWI contains more blooming artifacts than T2*w. However, T2*w and SWI do not directly reflect the iron concentration due to their blooming artifacts and dependence on imaging parameters.
2.2.2. Semi-Quantitative MRI Methods
- Magnetic Field Correlation Imaging (MFC) is directly related to iron-induced field variations and has been used to estimate iron concentration [22]. MFC bears similarity to R2’ that is determined by the field variance in a voxel. MFC is estimated from a number of asymmetric spin echoes that are similar to gradient echoes [94,95].
- Phase Imaging. The gradient echo MRI data contains both magnitude and phase images. Traditionally, the phase images have been discarded and only the magnitude images are saved on the MRI scanner. The phase shift divided by the gyromagnetic ratio is the echo time times the iron induced magnetic field, which is proportional to the iron concentration convolved with the dipole kernel [96,97].
- R2* mapping. A number of correlation studies show that iron content is linearly related to the 1/T2* = R2* in DGM nuclei where iron distribution is approximately constant [87,98]. However, R2*, consisting of iron-enhanced R2 and iron-caused intravoxel dephasing (R2’), does not reflect local tissue iron concentration when its distribution is nonuniform. As a consequence, solid and shell MS lesions might be indistinguishable on R2* maps. Furthermore, R2* depends on imaging parameters [66,99], and suffers from blooming artifacts, nonlinearity, background field variations and other errors [99,100,101,102,103,104].
2.3. Quantitative Susceptibility Mapping (QSM)
3. Iron in Healthy Brains
4. Iron in Multiple Sclerosis
4.1. Iron in White Matter MS Lesions
4.2. Iron in Cortical MS Lesions
4.3. Iron in Normal Appearing White Matter (NAWM)
4.4. Iron in Deep Gray Matter of MS Patients
5. Investigating Iron in MS
5.1. Ex-Vivo Methods to Detect Iron in MS
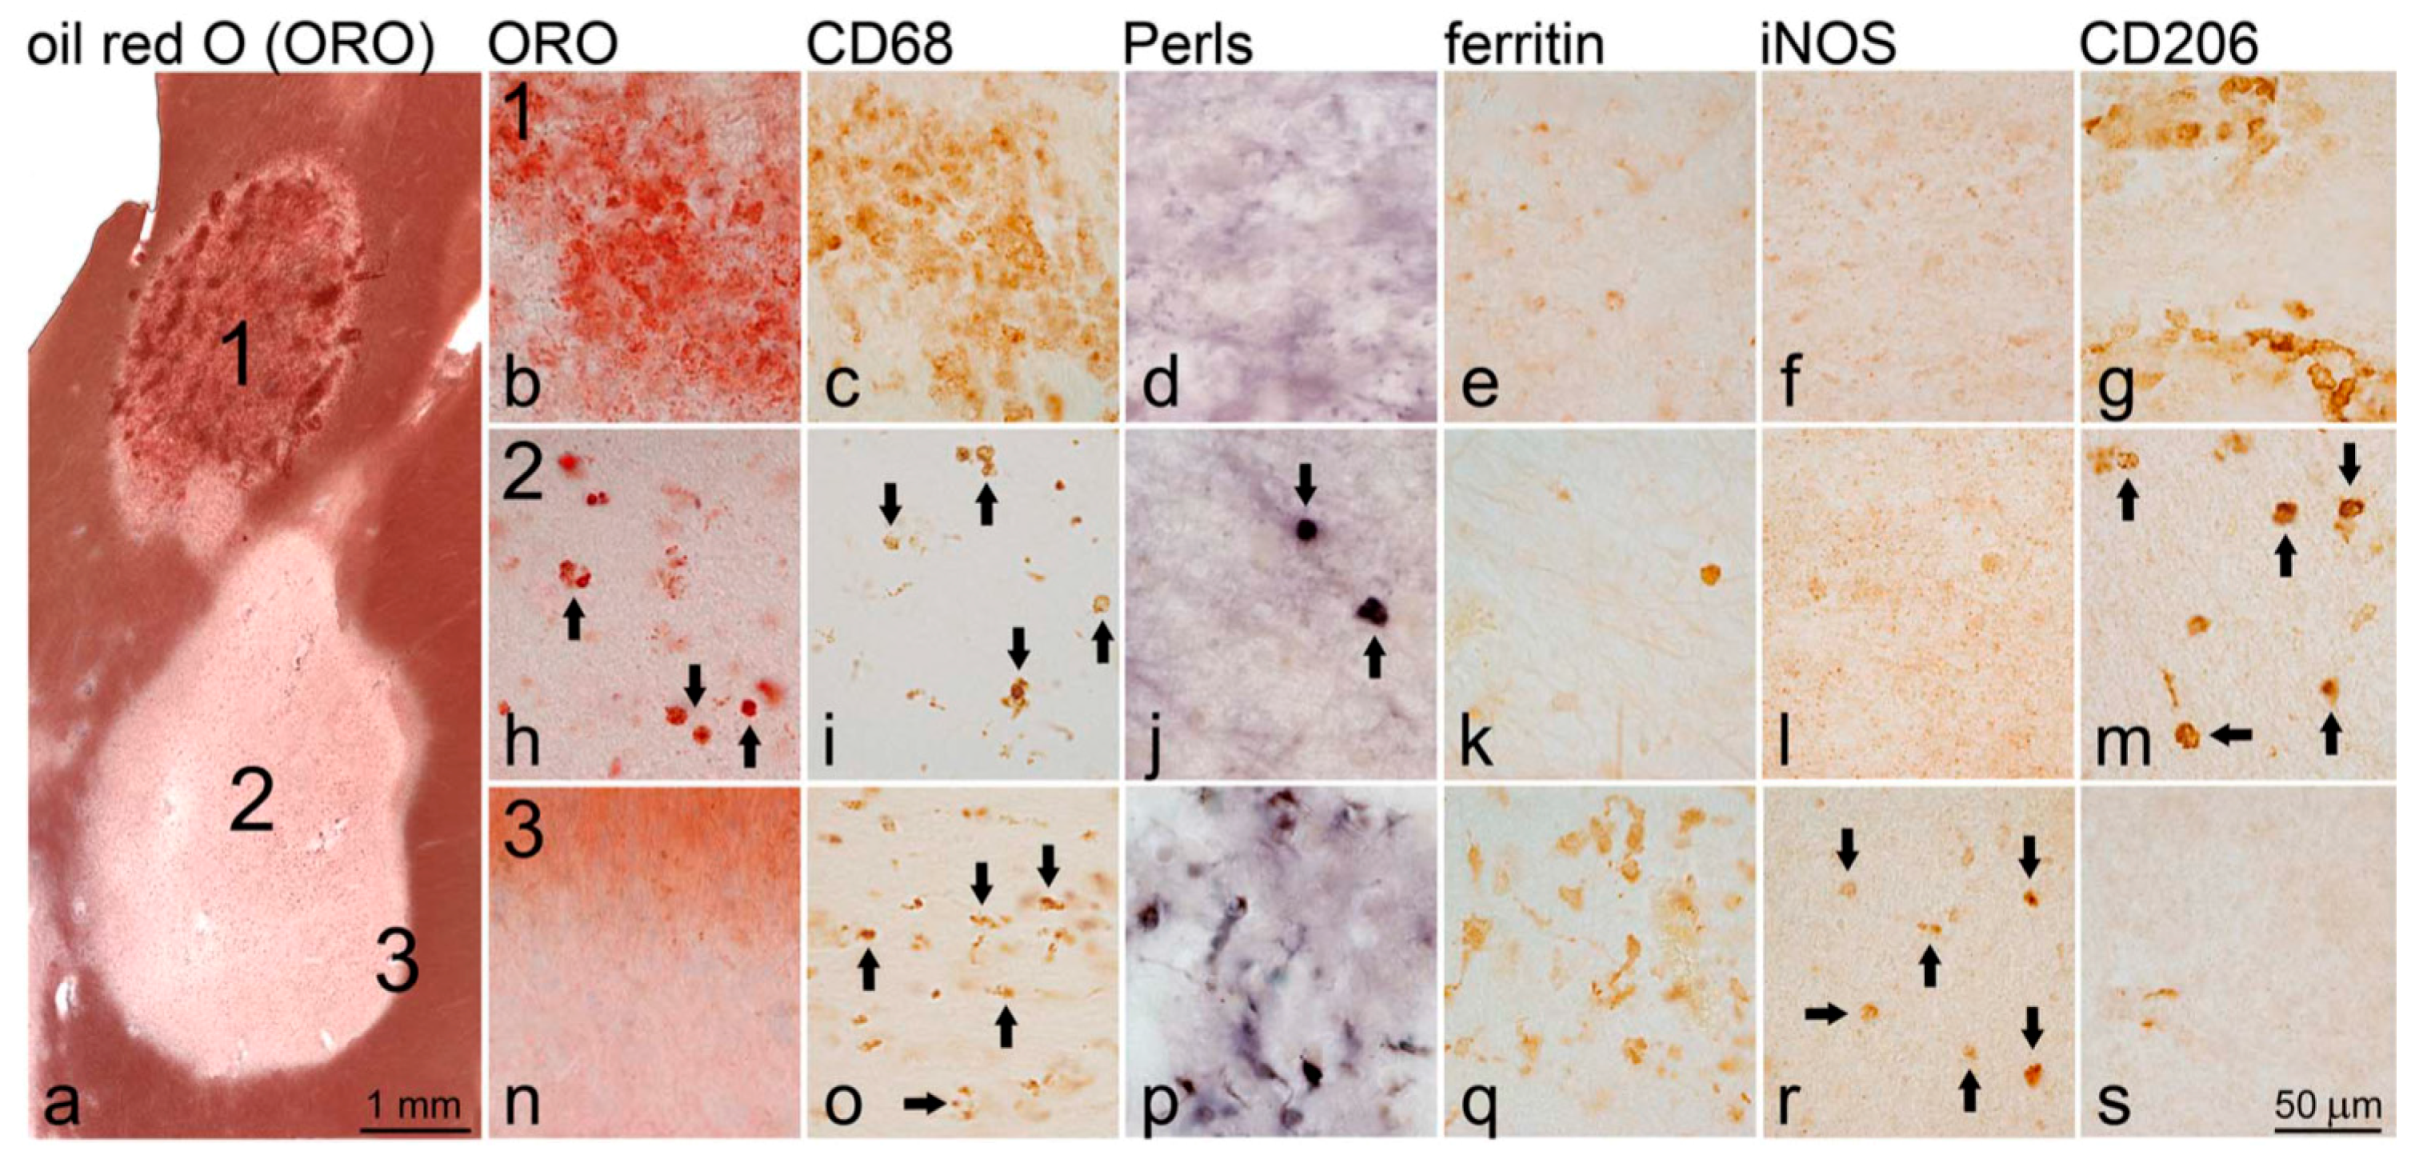
5.1.1. Immunohistochemical (IHC) Analysis of Iron in MS Lesions [10]
5.2. In-Vivo Methods to Detect Iron in MS
5.2.1. Qualitative Iron Detection Using Conventional MRI Contrasts
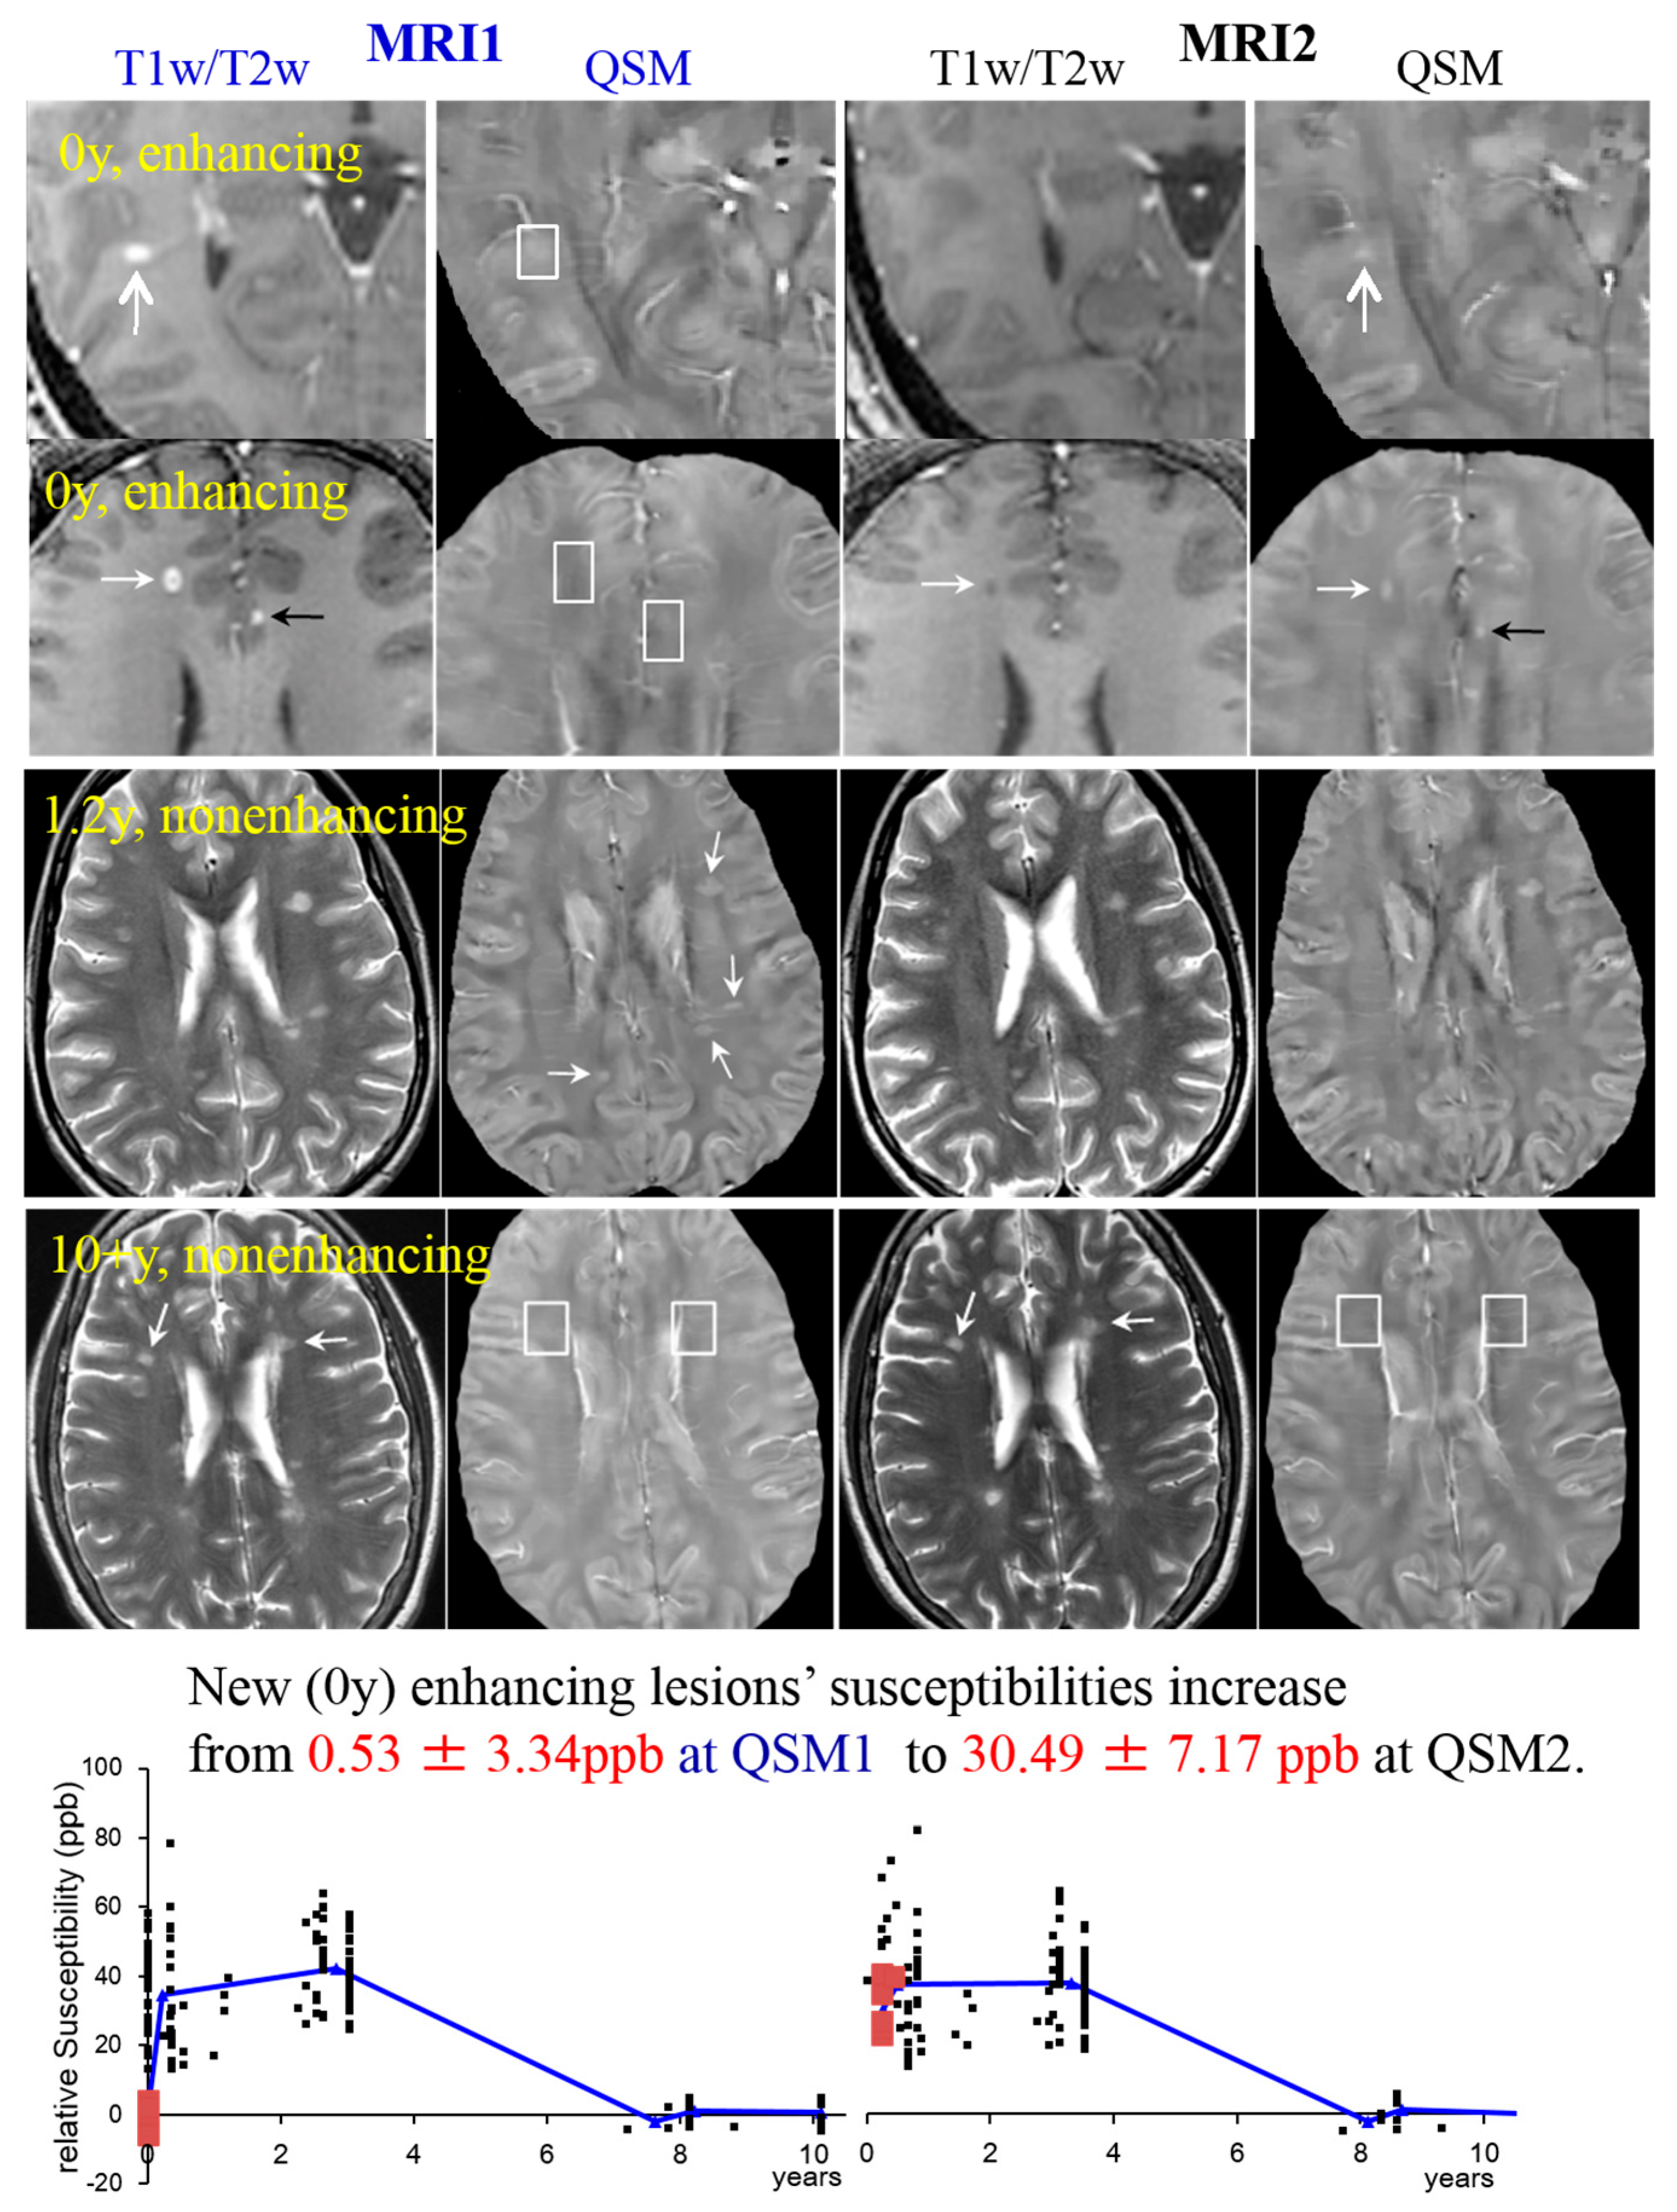
- T2-weighted imaging (T2w). T2 relaxometry has been applied to detect iron accumulation in DGM of MS patients showing a shortening of the T2 relaxation time for MS patients [19]. However, it is currently not possible to attribute changes in relaxation times to specific pathologic changes, which is crucial for lesion characterization [160]. Furthermore, in contrast to WM lesions and leukocortical lesions, intracortical lesions remain largely undetected in T2 [161]. WM lesions appear hyperintense on T2 due to demyelination (shown in Figure 3 and Figure 6).Figure 3. MS lesions on T1w (1st and 2nd row)/T2w (3rd and 4th row) and QSM at MRI1 (left, in blue) and a follow-up study at MRI2 (right, in black). The white boxes indicate the position of lesions identified on T1w, which are invisible on QSM. White arrows point at lesions in general; black arrows point at transient lesions, which disappear (appear T1 isointense) in the follow-up study (MRI2). Lower graphs: 32 cases are shown to exemplify lesions at various ages. The susceptibility of acute lesions (0 y) relative to NAWM jumped from MRI1 to MRI2 (red squares at bottom graph, interval between MR examinations = 0.43 ± 0.16 years). (Source: [42]).Figure 3. MS lesions on T1w (1st and 2nd row)/T2w (3rd and 4th row) and QSM at MRI1 (left, in blue) and a follow-up study at MRI2 (right, in black). The white boxes indicate the position of lesions identified on T1w, which are invisible on QSM. White arrows point at lesions in general; black arrows point at transient lesions, which disappear (appear T1 isointense) in the follow-up study (MRI2). Lower graphs: 32 cases are shown to exemplify lesions at various ages. The susceptibility of acute lesions (0 y) relative to NAWM jumped from MRI1 to MRI2 (red squares at bottom graph, interval between MR examinations = 0.43 ± 0.16 years). (Source: [42]).
![Ijms 17 00100 g003]()
- T2* weighted imaging (T2*w). Lesion magnetic susceptibility increases, as microglia degrade and remove diamagnetic myelin fragments [10,162,163], and as m/M take in highly paramagnetic iron [9,10,13,20,31]. Thus, in recent years, GRE sequences have been actively used to gain new insights into MS lesion inflammation activity [8,15,17,18,19,21,22,23,24,25,28,29,38,42,164,165,166]. Hypointense rings on T2*w images correlated with histologically demonstrated iron-laden microglia present at the edge of chronic active lesions [147], but both solid and shell lesions will generate rings on T2*w images [8,167] (shown in Figure 4).
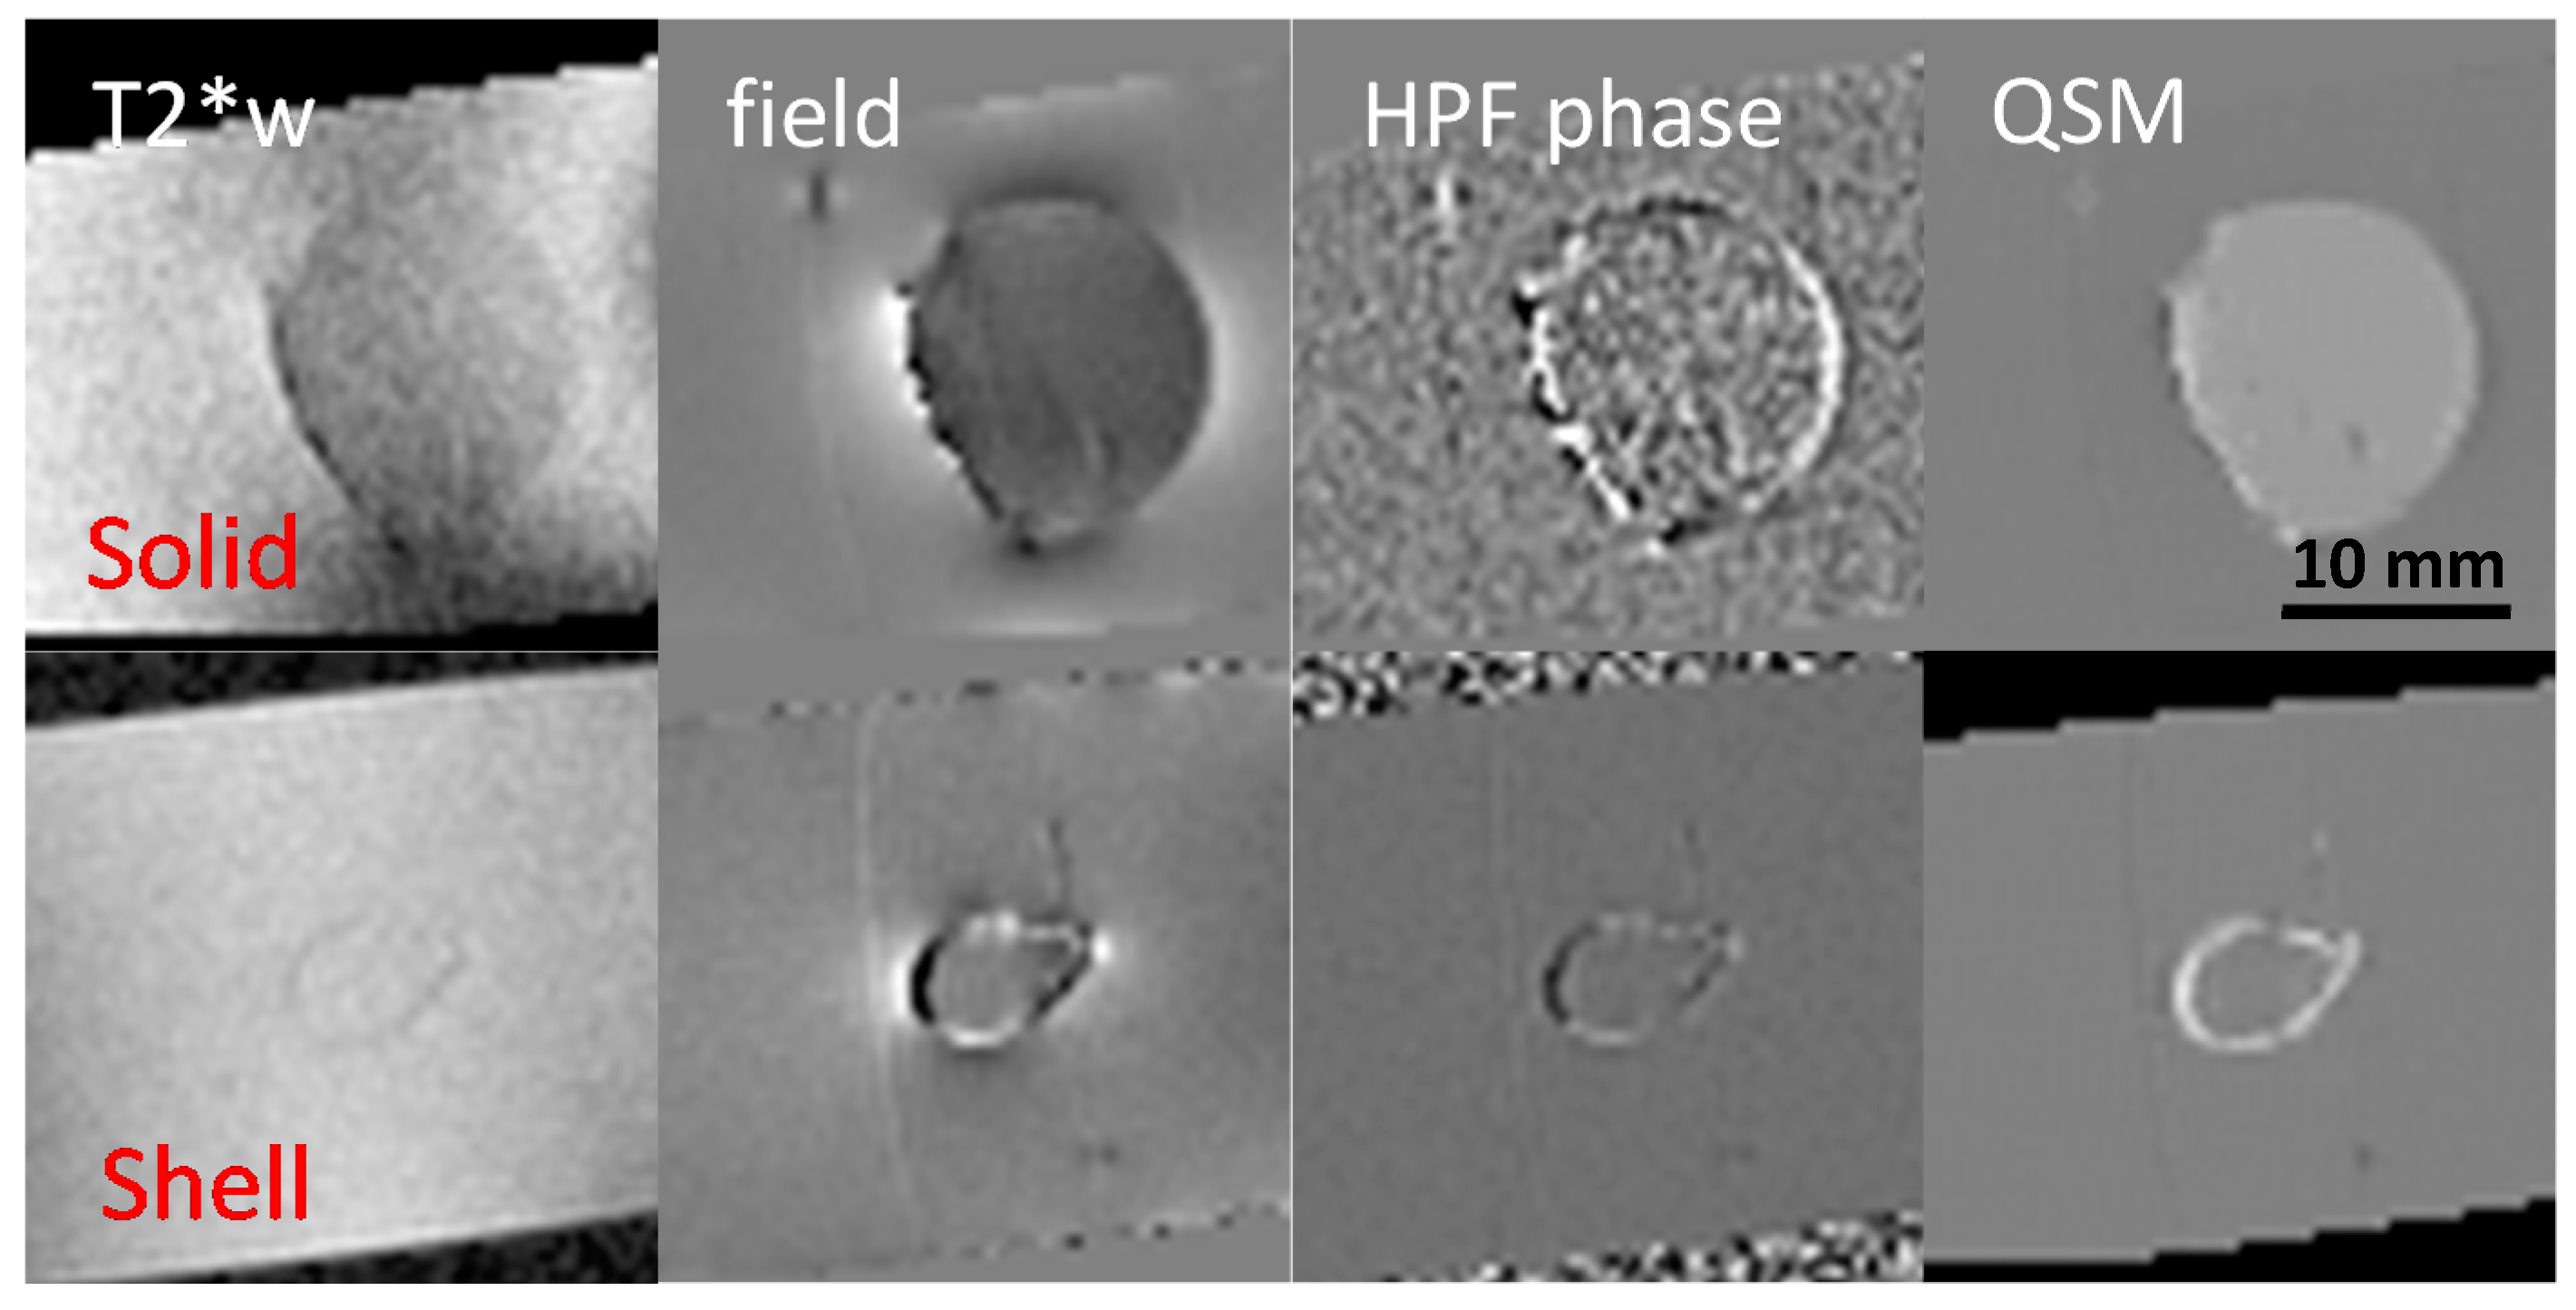
- Susceptibility Weighted Imaging (SWI) SWI has been utilized to see differences of iron content in healthy subjects vs. MS patients [23] and to detect lesions in GM and WM [17,24,30,168,169].Figure 4. Solid and shell susceptibility (ultrasmall superparamagnetic iron oxide particles (USPIO)) object appearance in MRI techniques. Solid and shell lesions can be identified on QSM images; however, they both appear shell-like on phase images. (Source: [170]).Figure 4. Solid and shell susceptibility (ultrasmall superparamagnetic iron oxide particles (USPIO)) object appearance in MRI techniques. Solid and shell lesions can be identified on QSM images; however, they both appear shell-like on phase images. (Source: [170]).
![Ijms 17 00100 g004]()

5.2.2. Semi-Quantitative Iron Detection Using Conventional MRI Contrasts
- Phase Imaging. MS lesions may appear isointense or hypointense on phase images [24,166]. It should be noted that both solid and shell (ring in 2D sectional image) lesions in MS brains have shell appearance, according to physics law and experimental data [170] (shown in Figure 4). The difficulty in interpreting GRE phase data of MS [162,164,165,166] is because phase is not a local tissue property, but a weighted summation of the magnetic properties of the surrounding tissue. Thus, phase cannot be used to quantify local iron density, which was validated experimentally [66].
5.3. Quantitative Susceptibility Mapping (QSM)
5.3.1. Shell vs. Solid Lesions [170]
5.3.2. MS Lesion Susceptibility Time Course Study [42]
5.3.3. QSM Is More Sensitive Than R2* in Detecting MS Basal Ganglia Change [46]
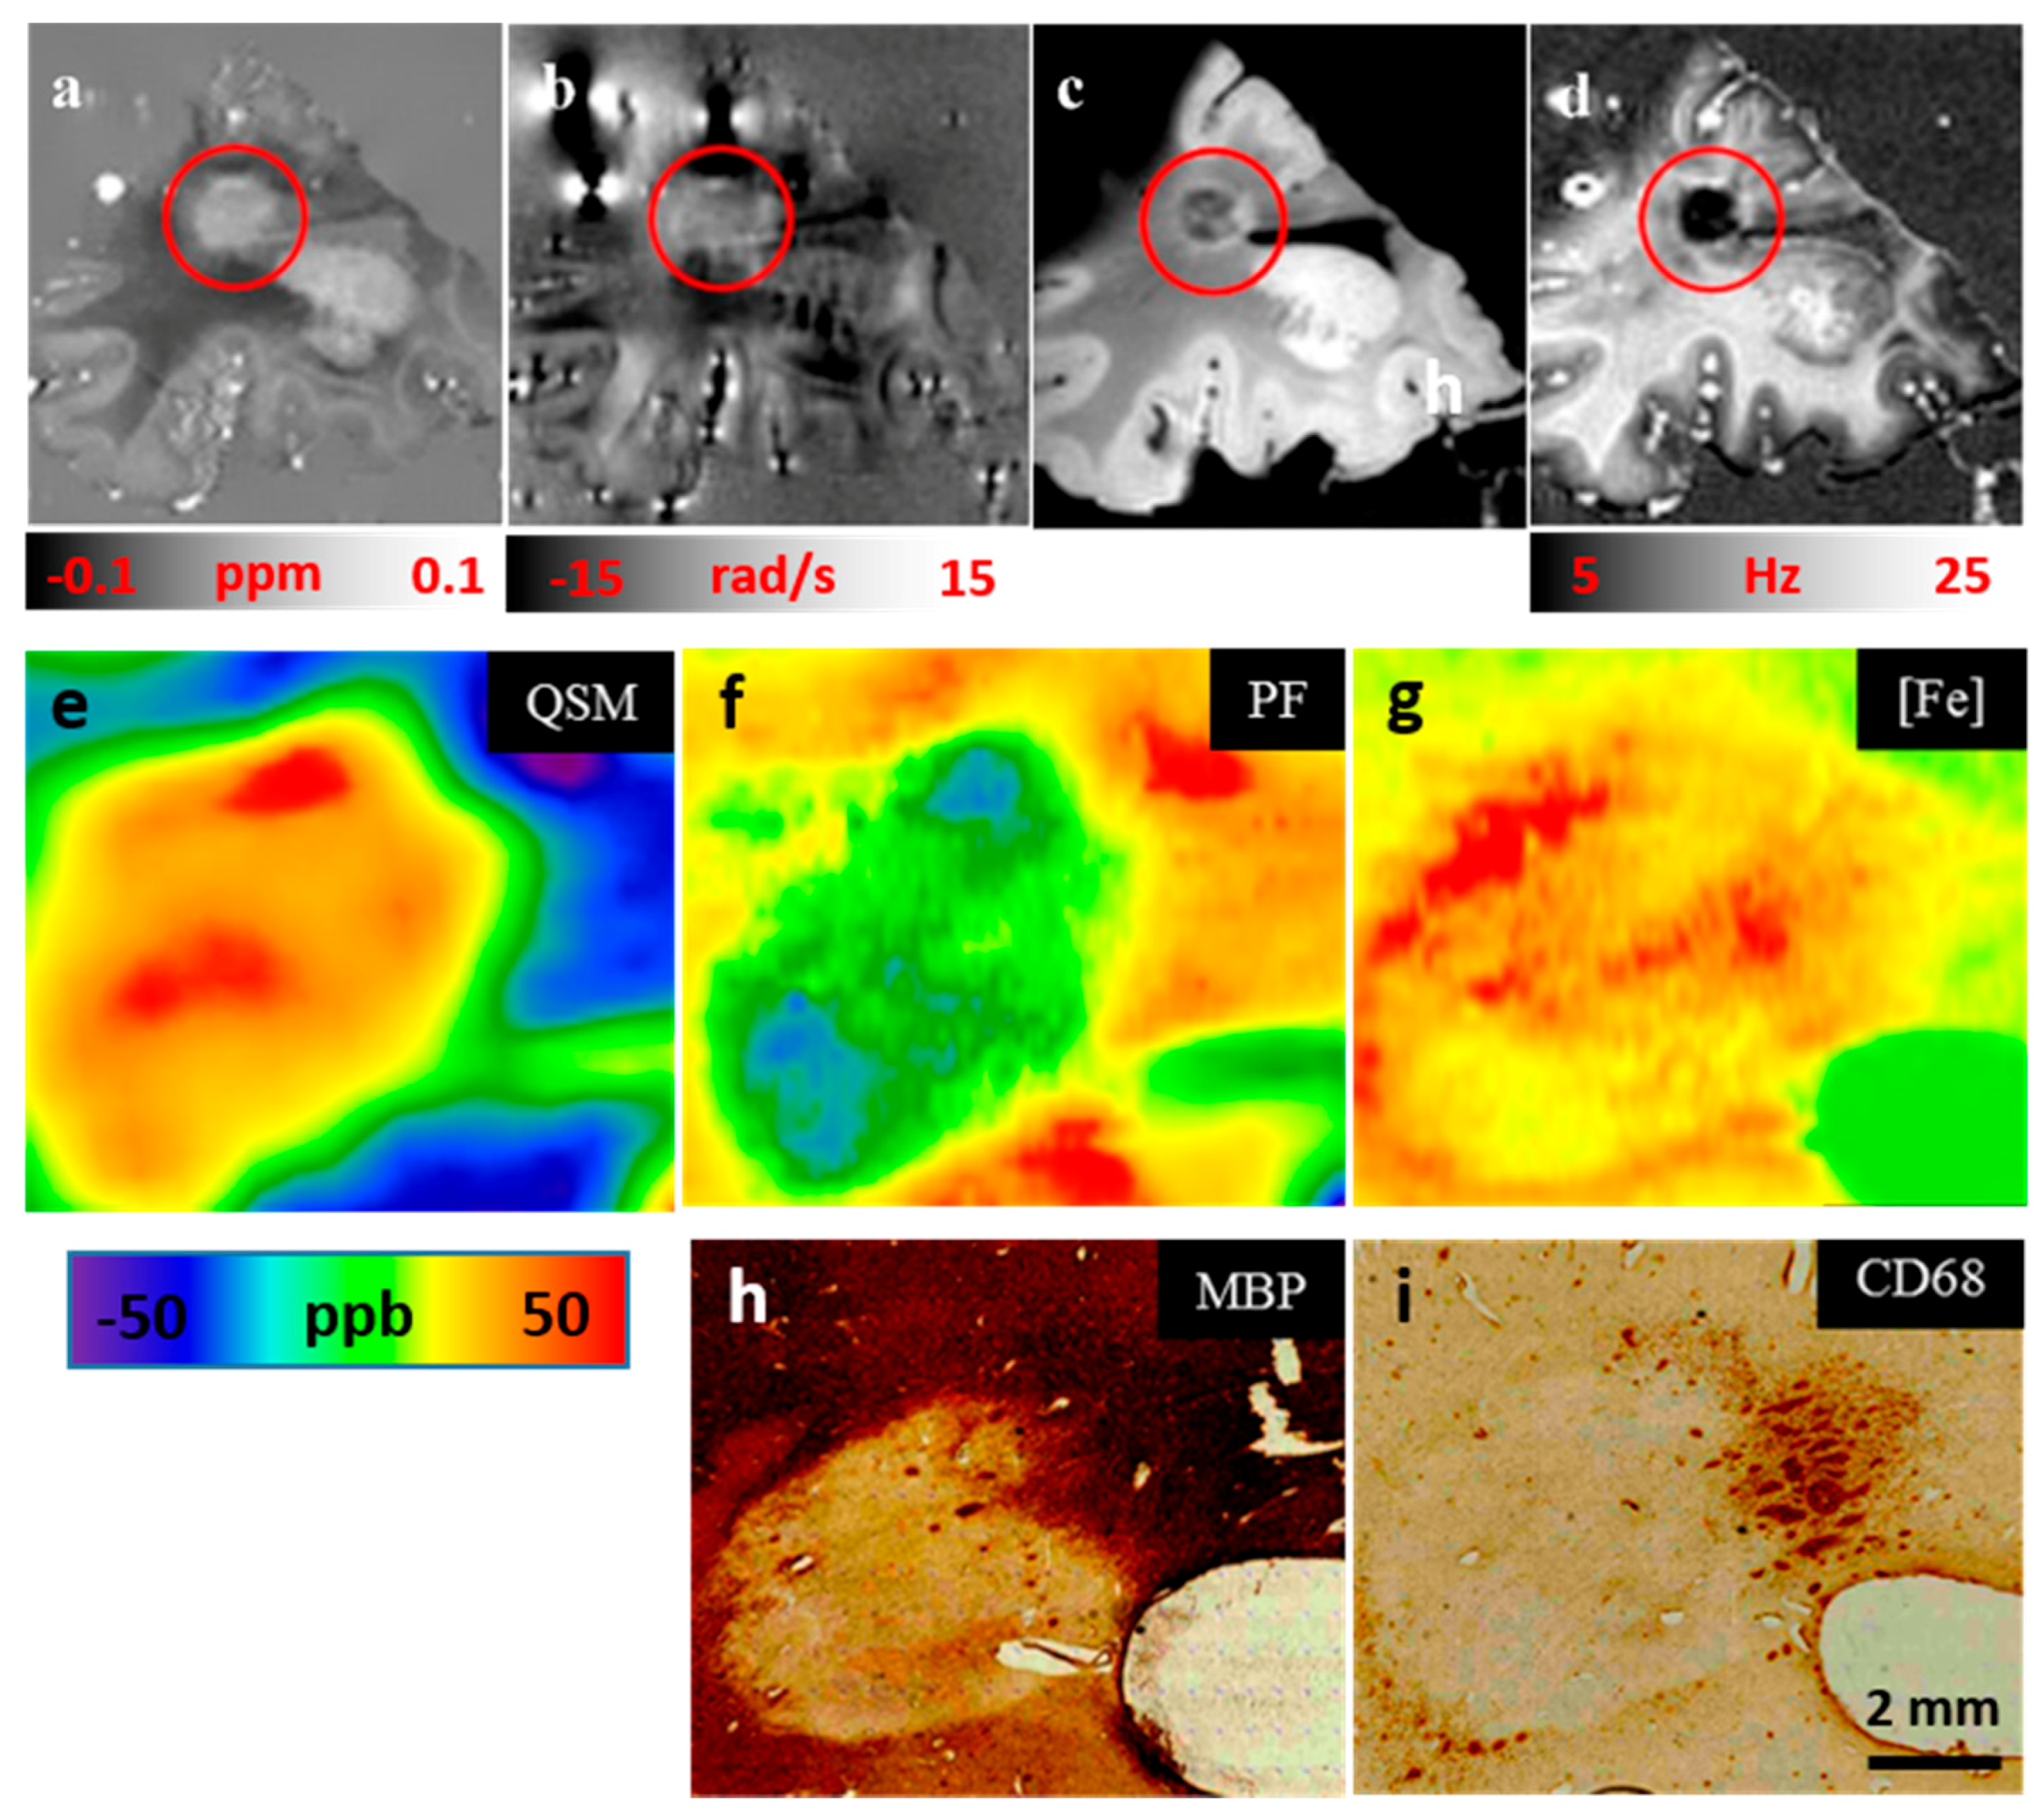
5.3.4. QSM, Laser Ablation Inductively Coupled Plasma Mass Spectrometry (LA-ICP-MS) and Immunohistochemical (IHC) Labeling for Myelin Basic Protein (MBP) and Myeloid Cells (CD68) [41]:
5.3.5. Iron Presence in a White Matter Lesion Can Often Be Unequivocally Identified on QSM
6. Adding QSM in Clinical MS MRI Protocol to Improve Inflammation Monitoring
7. Conclusions
Acknowledgments
Author Contributions
Conflicts of Interest
References
- Zecca, L.; Youdim, M.B.H.; Riederer, P.; Connor, J.R.; Crichton, R.R. Iron, brain ageing and neurodegenerative disorders. Nat. Rev. Neurosci. 2004, 5, 863–873. [Google Scholar] [CrossRef] [PubMed]
- Stankiewicz, J.; Panter, S.S.; Neema, M.; Arora, A.; Batt, C.E.; Bakshi, R. Iron in chronic brain disorders: Imaging and neurotherapeutic implications. Neurotherapeutics 2007, 4, 371–386. [Google Scholar] [CrossRef] [PubMed]
- Lieu, P.T.; Heiskala, M.; Peterson, P.A.; Yang, Y. The roles of iron in health and disease. Mol. Asp. Med. 2001, 22, 1–87. [Google Scholar] [CrossRef]
- Dexter, D.T.; Carayon, A.; Javoy-Agid, F.; Agid, Y.; Wells, F.R.; Daniel, S.E.; Lees, A.J.; Jenner, P.; Marsden, C.D. Alterations in the levels of iron, ferritin and other trace metals in Parkinson’s disease and other neurodegenerative diseases affecting the basal ganglia. Brain 1991, 114, 1953–1975. [Google Scholar] [CrossRef] [PubMed]
- Trapp, B.D.; Nave, K.-A. Multiple sclerosis: An immune or neurodegenerative disorder? Annu. Rev. Neurosci. 2008, 31, 247–269. [Google Scholar] [CrossRef] [PubMed]
- Nylander, A.; Hafler, D.A. Multiple sclerosis. J. Clin. Investig. 2012, 122, 1180–1188. [Google Scholar] [CrossRef] [PubMed]
- Bakshi, R.; Benedict, R.H.B.; Bermel, R.A.; Caruthers, S.D.; Puli, S.R.; Tjoa, C.W.; Fabiano, A.J.; Jacobs, L. T2 hypointensity in the deep gray matter of patients with multiple sclerosis: A quantitative magnetic resonance imaging study. Arch. Neurol. 2002, 59, 62–68. [Google Scholar] [CrossRef] [PubMed]
- Hammond, K.E.; Metcalf, M.; Carvajal, L.; Okuda, D.T.; Srinivasan, R.; Vigneron, D.; Nelson, S.J.; Pelletier, D. Quantitative in vivo magnetic resonance imaging of multiple sclerosis at 7 Tesla with sensitivity to iron. Ann. Neurol. 2008, 64, 707–713. [Google Scholar] [CrossRef] [PubMed]
- Hametner, S.; Wimmer, I.; Haider, L.; Pfeifenbring, S.; Brück, W.; Lassmann, H. Iron and neurodegeneration in the multiple sclerosis brain. Ann. Neurol. 2013, 74, 848–861. [Google Scholar] [CrossRef] [PubMed]
- Mehta, V.; Pei, W.; Yang, G.; Li, S.; Swamy, E.; Boster, A.; Schmalbrock, P.; Pitt, D. Iron is a sensitive biomarker for inflammation in multiple sclerosis lesions. PLoS ONE 2013, 8, 1–10. [Google Scholar]
- Drayer, B.; Burger, P.; Darwin, R.; Riederer, S.; Herfkens, R.; Johnson, G.A. MRI of brain iron. AJR Am. J. Roentgenol. 1986, 147, 103–110. [Google Scholar] [CrossRef] [PubMed]
- Drayer, B.; Burger, P.; Hurwitz, B.; Dawson, D.; Cain, J. Reduced signal intensity on MR images of thalamus and putamen in multiple sclerosis: Increased iron content? AJR Am. J. Roentgenol. 1987, 149, 357–363. [Google Scholar] [CrossRef] [PubMed]
- Adams, C.W. Perivascular iron deposition and other vascular damage in multiple sclerosis. J. Neurol. Neurosurg. Psychiatry 1988, 51, 260–265. [Google Scholar] [CrossRef] [PubMed]
- Dousset, V.; Brochet, B.; Deloire, M.S.; Lagoarde, L.; Barroso, B.; Caille, J.M.; Petry, K.G. MR imaging of relapsing multiple sclerosis patients using ultra-small-particle iron oxide and compared with gadolinium. AJNR Am. J. Neuroradiol. 2006, 27, 1000–1005. [Google Scholar] [PubMed]
- Ge, Y.; Jensen, J.H.; Lu, H.; Helpern, J.A.; Miles, L.; Inglese, M.; Babb, J.S.; Herbert, J.; Grossman, R.I. Quantitative assessment of iron accumulation in the deep gray matter of multiple sclerosis by magnetic field correlation imaging. AJNR Am. J. Neuroradiol. 2007, 28, 1639–1644. [Google Scholar] [CrossRef] [PubMed]
- Vellinga, M.M.; Oude Engberink, R.D.; Seewann, A.; Pouwels, P.J.W.; Wattjes, M.P.; van Der Pol, S.M.A.; Pering, C.; Polman, C.H.; de Vries, H.E.; Geurts, J.J.G.; et al. Pluriformity of inflammation in multiple sclerosis shown by ultra-small iron oxide particle enhancement. Brain 2008, 131, 800–807. [Google Scholar] [CrossRef] [PubMed]
- Haacke, E.M.; Makki, M.; Ge, Y.; Maheshwari, M.; Sehgal, V.; Hu, J.; Selvan, M.; Wu, Z.; Latif, Z.; Xuan, Y.; et al. Characterizing iron deposition in multiple sclerosis lesions using susceptibility weighted imaging. J. Magn. Reson. Imaging 2009, 29, 537–544. [Google Scholar] [CrossRef] [PubMed]
- Khalil, M.; Enzinger, C.; Langkammer, C.; Tscherner, M.; Wallner-Blazek, M.; Jehna, M.; Ropele, S.; Fuchs, S.; Fazekas, F. Quantitative assessment of brain iron by R(2)* relaxometry in patients with clinically isolated syndrome and relapsing-remitting multiple sclerosis. Mult. Scler. 2009, 15, 1048–1054. [Google Scholar] [CrossRef] [PubMed]
- Burgetova, A.; Seidl, Z.; Krasensky, J.; Horakova, D.; Vaneckova, M. Multiple sclerosis and the accumulation of iron in the basal ganglia: Quantitative assessment of brain iron using MRI T(2) relaxometry. Eur. Neurol. 2010, 63, 136–143. [Google Scholar] [CrossRef] [PubMed]
- Bagnato, F.; Hametner, S.; Yao, B.; van Gelderen, P.; Merkle, H.; Cantor, F.K.; Lassmann, H.; Duyn, J.H. Tracking iron in multiple sclerosis: A combined imaging and histopathological study at 7 Tesla. Brain 2011, 134, 3599–3612. [Google Scholar] [CrossRef] [PubMed]
- Khalil, M.; Langkammer, C.; Ropele, S.; Petrovic, K.; Wallner-Blazek, M.; Loitfelder, M.; Jehna, M.; Bachmaier, G.; Schmidt, R.; Enzinger, C.; et al. Determinants of brain iron in multiple sclerosis: A quantitative 3T MRI study. Neurology 2011, 77, 1691–1697. [Google Scholar] [CrossRef] [PubMed]
- Ropele, S.; de Graaf, W.; Khalil, M.; Wattjes, M.P.; Langkammer, C.; Rocca, M.A.; Rovira, A.; Palace, J.; Barkhof, F.; Filippi, M.; et al. MRI assessment of iron deposition in multiple sclerosis. J. Magn. Reson. Imaging 2011, 34, 13–21. [Google Scholar] [CrossRef] [PubMed]
- Habib, C.A.; Liu, M.; Bawany, N.; Garbern, J.; Krumbein, I.; Mentzel, H.J.; Reichenbach, J.; Magnano, C.; Zivadinov, R.; Haacke, E.M. Assessing abnormal iron content in the deep gray matter of patients with multiple sclerosis versus healthy controls. AJNR Am. J. Neuroradiol. 2012, 33, 252–258. [Google Scholar] [CrossRef] [PubMed]
- Hagemeier, J.; Heininen-Brown, M.; Poloni, G.U.; Bergsland, N.; Magnano, C.R.; Durfee, J.; Kennedy, C.; Carl, E.; Weinstock-Guttman, B.; Dwyer, M.G.; et al. Iron deposition in multiple sclerosis lesions measured by susceptibility-weighted imaging filtered phase: A case control study. J. Magn. Reson. Imaging 2012, 36, 73–83. [Google Scholar] [CrossRef] [PubMed]
- Paling, D.; Tozer, D.; Wheeler-Kingshott, C.; Kapoor, R.; Miller, D.H.; Golay, X. Reduced R2’ in multiple sclerosis normal appearing white matter and lesions may reflect decreased myelin and iron content. J. Neurol. Neurosurg. Psychiatry 2012, 83, 785–792. [Google Scholar] [CrossRef] [PubMed]
- Tourdias, T.; Roggerone, S.; Filippi, M.; Kanagaki, M.; Rovaris, M.; Miller, D.H.; Petry, K.G.; Brochet, B.; Pruvo, J.P.; Radue, E.W.; et al. Assessment of disease activity in multiple sclerosis phenotypes with combined gadolinium- and superparamagnetic iron oxide-enhanced MR imaging. Radiology 2012, 264, 225–233. [Google Scholar] [CrossRef] [PubMed]
- Williams, R.; Buchheit, C.L.; Berman, N.E.J.; Levine, S.M. Pathogenic implications of iron accumulation in multiple sclerosis. J. Neurochem. 2012, 120, 7–25. [Google Scholar] [CrossRef] [PubMed]
- Bagnato, F.; Hametner, S.; Welch, E.B. Visualizing iron in multiple sclerosis. Magn. Reson. Imaging 2013, 31, 376–384. [Google Scholar] [CrossRef] [PubMed]
- Hagemeier, J.; Yeh, E.A.; Brown, M.H.; Bergsland, N.; Dwyer, M.G.; Carl, E.; Weinstock-Guttman, B.; Zivadinov, R. Iron content of the pulvinar nucleus of the thalamus is increased in adolescent multiple sclerosis. Mult. Scler. 2013, 19, 567–576. [Google Scholar] [CrossRef] [PubMed]
- Nathoo, N.; Agrawal, S.; Wu, Y.; Haylock-Jacobs, S.; Yong, V.W.; Foniok, T.; Barnes, S.; Obenaus, A.; Dunn, J.F. Susceptibility-weighted imaging in the experimental autoimmune encephalomyelitis model of multiple sclerosis indicates elevated deoxyhemoglobin, iron deposition and demyelination. Mult. Scler. 2013, 19, 721–731. [Google Scholar] [CrossRef] [PubMed]
- Walsh, A.J.; Lebel, R.M.; Eissa, A.; Blevins, G.; Catz, I.; Lu, J.Q.; Resch, L.; Johnson, E.S.; Emery, D.J.; Warren, K.G.; et al. Multiple sclerosis: Validation of MR imaging for quantification and detection of iron. Radiology 2013, 267, 531–542. [Google Scholar] [CrossRef] [PubMed]
- Blazejewska, A.I.; Al-Radaideh, A.M.; Wharton, S.; Lim, S.Y.; Bowtell, R.W.; Constantinescu, C.S.; Gowland, P.A. Increase in the iron content of the substantia nigra and red nucleus in multiple sclerosis and clinically isolated syndrome: A 7 Tesla MRI study. J. Magn. Reson. Imaging 2014, 1070, 1065–1070. [Google Scholar] [CrossRef] [PubMed]
- Haider, L.; Simeonidou, C.; Steinberger, G.; Hametner, S.; Grigoriadis, N.; Deretzi, G.; Kovacs, G.G.; Kutzelnigg, A.; Lassmann, H.; Frischer, J.M. Multiple sclerosis deep grey matter: the relation between demyelination, neurodegeneration, inflammation and iron. J. Neurol. Neurosurg. Psychiatry 2014, 85, 1386–1395. [Google Scholar] [CrossRef] [PubMed]
- Raz, E.; Branson, B.; Jensen, J.H.; Bester, M.; Babb, J.S.; Herbert, J.; Grossman, R.I.; Inglese, M. Relationship between iron accumulation and white matter injury in multiple sclerosis: A case–control study. J. Neurol. 2014, 262, 402–409. [Google Scholar] [CrossRef] [PubMed]
- Ropele, S.; Kilsdonk, I.D.; Wattjes, M.P.; Langkammer, C.; de Graaf, W.L.; Frederiksen, J.L.; Larsson, H.B.; Yiannakas, M.; Wheeler-Kingshott, C.A.; Enzinger, C.; et al. Determinants of iron accumulation in deep grey matter of multiple sclerosis patients. Mult. Scler. 2014, 20, 1692–1698. [Google Scholar] [CrossRef] [PubMed]
- Stankiewicz, J.M.; Neema, M.; Ceccarelli, A. Iron and multiple sclerosis. Neurobiol. Aging 2014, 35, S51–S58. [Google Scholar] [CrossRef] [PubMed]
- Stephenson, E.; Nathoo, N.; Mahjoub, Y.; Dunn, J.F.; Yong, V.W. Iron in multiple sclerosis: roles in neurodegeneration and repair. Nat. Rev. Neurol. 2014, 10, 459–468. [Google Scholar] [CrossRef] [PubMed]
- Walsh, A.J.; Blevins, G.; Lebel, R.M.; Seres, P.; Emery, D.J.; Wilman, A.H. Longitudinal MR imaging of iron in multiple sclerosis: An imaging marker of disease. Radiology 2014, 270, 186–196. [Google Scholar] [CrossRef] [PubMed]
- Du, S.; Sah, S.K.; Zeng, C.; Wang, J.; Liu, Y.; Xiong, H.; Li, Y. Iron deposition in the gray matter in patients with relapse-remitting multiple sclerosis: A longitudinal study using three-dimensional (3D)-enhanced T2*-weighted angiography (ESWAN). Eur. J. Radiol. 2015, 84, 1325–1332. [Google Scholar] [CrossRef] [PubMed]
- Khalil, M.; Langkammer, C.; Pichler, A.; Pinter, D.; Gattringer, T.; Bachmaier, G.; Ropele, S.; Fuchs, S.; Enzinger, C.; Fazekas, F. Dynamics of brain iron levels in multiple sclerosis: A longitudinal 3T MRI study. Neurology 2015, 84, 2396–2402. [Google Scholar] [CrossRef] [PubMed]
- Wisnieff, C.; Ramanan, S.; Olesik, J.; Gauthier, S.; Wang, Y.; Pitt, D. Quantitative susceptibility mapping (QSM) of white matter multiple sclerosis lesions: Interpreting positive susceptibility and the presence of iron. Magn. Reson. Med. 2015, 74, 564–570. [Google Scholar] [CrossRef] [PubMed]
- Chen, W.; Gauthier, S.A.; Gupta, A.; Comunale, J.; Liu, T.; Wang, S.; Pei, M.; Pitt, D.; Wang, Y. Quantitative susceptibility mapping of multiple sclerosis lesions at various ages. Radiology 2014, 271, 183–192. [Google Scholar] [CrossRef] [PubMed]
- Kakeda, S.; Futatsuya, K.; Ide, S.; Watanabe, K.; Miyata, M.; Moriya, J.; Ogasawara, A.; Sato, T.; Narimatsu, H.; Okada, K.; et al. Improved detection of cortical gray matter involvement in multiple sclerosis with quantitative susceptibility mapping. Acad. Radiol. 2015, 22, 1427–1432. [Google Scholar] [CrossRef] [PubMed]
- De Rochefort, L.; Liu, T.; Kressler, B.; Liu, J.; Spincemaille, P.; Lebon, V.; Wu, J.; Wang, Y. Quantitative susceptibility map reconstruction from MR phase data using bayesian regularization: Validation and application to brain imaging. Magn. Reson. Med. 2010, 63, 194–206. [Google Scholar] [CrossRef] [PubMed]
- Wang, Y.; Liu, T. Quantitative susceptibility mapping (QSM): Decoding MRI data for a tissue magnetic biomarker. Magn. Reson. Med. 2015, 73, 82–101. [Google Scholar] [CrossRef] [PubMed]
- Langkammer, C.; Liu, T.; Khalil, M.; Enzinger, C.; Jehna, M.; Fuchs, S.; Fazekas, F.; Wang, Y.; Ropele, S. Quantitative susceptibility mapping in multiple sclerosis. Radiology 2013, 267, 551–559. [Google Scholar] [CrossRef] [PubMed]
- Connor, J.R.; Menzies, S.L.; St Martin, S.M.; Mufson, E.J. A histochemical study of iron, transferrin, and ferritin in Alzheimer‘s diseased brains. J. Neurosci. Res. 1992, 31, 75–83. [Google Scholar] [CrossRef] [PubMed]
- Fukunaga, M.; Li, T.-Q.; van Gelderen, P.; de Zwart, J.A.; Shmueli, K.; Yao, B.; Lee, J.; Maric, D.; Aronova, M.A.; Zhang, G.; et al. Layer-specific variation of iron content in cerebral cortex as a source of MRI contrast. Proc. Natl. Acad. Sci. USA 2010, 107, 3834–3839. [Google Scholar] [CrossRef] [PubMed]
- Connor, J.R.; Menzies, S.L. Cellular management of iron in the brain. J. Neurol. Sci. 1995, 134, 33–44. [Google Scholar] [CrossRef]
- Koeppen, A.H. The history of iron in the brain. J. Neurol. Sci. 1995, 134, 1–9. [Google Scholar] [CrossRef]
- Lassmann, H. Mechanisms of white matter damage in multiple sclerosis. Glia 2014, 62, 1816–1830. [Google Scholar] [CrossRef] [PubMed]
- Houk, R.S.; Fassel, V.A.; Flesch, G.D.; Svec, H.J.; Gray, A.L.; Taylor, C.E. Inductively coupled argon plasma as an ion source for mass spectrometric determination of trace elements. Anal. Chem. 1980, 52, 2283–2289. [Google Scholar] [CrossRef]
- Watt, F.; Landsberg, J. Nuclear microscopy: Biomedical applications. Nucl. Instrum. Meth. B 1993, 77, 249–260. [Google Scholar] [CrossRef]
- Hallgren, B.; Sourander, P. The effect of age on the non-haemin iron in the human brain. J. Neurochem. 1958, 3, 41–51. [Google Scholar] [CrossRef] [PubMed]
- Loeffler, D.A.; Connor, J.R.; Juneau, P.L.; Snyder, B.S.; Kanaley, L.; DeMaggio, A.J.; Nguyen, H.; Brickman, C.M.; LeWitt, P.A. Transferrin and iron in normal, Alzheimer’s disease, and Parkinson’s disease brain regions. J. Neurochem. 1995, 65, 710–724. [Google Scholar] [CrossRef] [PubMed]
- Walsh, A. The application of atomic absorption spectra to chemical analysis. Spectrochim. Acta 1955, 7, 108–117. [Google Scholar] [CrossRef]
- Riederer, P.; Sofic, E.; Rausch, W.D.; Schmidt, B.; Reynolds, G.P.; Jellinger, K.; Youdim, M.B.H. Transition metals, ferritin, glutathione, and ascorbic acid in parkinsonian brains. J. Neurochem. 1989, 52, 515–520. [Google Scholar] [CrossRef] [PubMed]
- Sofic, E.; Paulus, W.; Jellinger, K.; Riederer, P.; Youdim, M.B. Selective increase of iron in substantia nigra zona compacta of parkinsonian brains. J. Neurochem. 1991, 56, 978–982. [Google Scholar] [CrossRef] [PubMed]
- Deibel, M.A.; Landsberger, S.; Wu, D.; Ehmann, W.D. Non-destructive analysis of copper in human brain tissue by neutron activation analysis using coincidence and anti-coincidence techniques. J. Radioanal. Nucl. Chem. 1997, 217, 153–155. [Google Scholar] [CrossRef]
- Brooks, D.J.; Luthert, P.; Gadian, D.; Marsden, C.D. Does signal-attenuation on high-field T2-weighted MRI of the brain reflect regional cerebral iron deposition? Observations on the relationship between regional cerebral water proton T2 values and iron levels. J. Neurol. Neurosurg. Psychiatry 1989, 52, 108–111. [Google Scholar] [CrossRef] [PubMed]
- Deibel, M.A.; Ehmann, W.D.; Markesbery, W.R. Copper, iron, and zinc imbalances in severely degenerated brain regions in Alzheimer’s disease: Possible relation to oxidative stress. J. Neurol. Sci. 1996, 143, 137–142. [Google Scholar] [CrossRef]
- Tohno, S.; Ishizaki, T.; Shida, Y.; Tohno, Y.; Minami, T.; Mahakkanukrauh, P. Element distribution in visual system, the optic chiasma, lateral geniculate body, and superior colliculus. Biol. Trace Elem. Res. 2010, 142, 335–349. [Google Scholar] [CrossRef] [PubMed]
- Tohno, Y.; Tohno, S.; Ongkana, N.; Suwannahoy, P.; Azuma, C.; Minami, T.; Mahakkanukrauh, P. Age-related changes of elements and relationships among elements in human hippocampus, dentate gyrus, and fornix. Biol. Trace Elem. Res. 2010, 138, 42–52. [Google Scholar] [CrossRef] [PubMed]
- Haacke, E.M.; Miao, Y.; Liu, M.; Habib, C.A.; Katkuri, Y.; Liu, T.; Yang, Z.; Lang, Z.; Hu, J.; Wu, J. Correlation of putative iron content as represented by changes in R2* and phase with age in deep gray matter of healthy adults. J. Magn. Reson. Imaging 2010, 32, 561–576. [Google Scholar] [CrossRef] [PubMed]
- Li, T.-Q.; van Gelderen, P.; Merkle, H.; Talagala, L.; Koretsky, A.P.; Duyn, J. Extensive heterogeneity in white matter intensity in high-resolution T2*-weighted MRI of the human brain at 7.0 T. Neuroimage 2006, 32, 1032–1040. [Google Scholar] [CrossRef] [PubMed]
- Yao, B.; Li, T.-Q.; van Gelderen, P.; Shmueli, K.; de Zwart, J.A.; Duyn, J.H. Susceptibility contrast in high field MRI of human brain as a function of tissue iron content. Neuroimage 2009, 44, 1259–1266. [Google Scholar] [CrossRef] [PubMed]
- Li, T.-Q.; Yao, B.; van Gelderen, P.; Merkle, H.; Dodd, S.; Talagala, L.; Koretsky, A.P.; Duyn, J. Characterization of T2* heterogeneity in human brain white matter. Magn. Reson. Med. 2009, 62, 1652–1657. [Google Scholar] [CrossRef] [PubMed]
- Oros-Peusquens, A.M.; Matusch, A.; Becker, J.S.; Shah, N.J. Automatic segmentation of tissue sections using the multielement information provided by LA-ICP-MS imaging and k-means cluster analysis. Int. J. Mass Spectrom. 2011, 307, 245–252. [Google Scholar] [CrossRef]
- Becker, J.S.; Zoriy, M.; Pickhardt, C.; Damoc, E.; Juhacz, G.; Palkovits, M.; Przybylski, M. Determination of phosphorus-, copper-, and zinc-containing human brain proteins by LA-ICPMS and MALDI-FTICR-MS. Anal. Chem. 2005, 77, 5851–5860. [Google Scholar] [CrossRef] [PubMed]
- Becker, J.S. Bioimaging of metals in brain tissue from micrometre to nanometre scale by laser ablation inductively coupled plasma mass spectrometry: State of the art and perspectives. Int. J. Mass Spectrom. 2010, 289, 65–75. [Google Scholar] [CrossRef]
- Zheng, W.; Nichol, H.; Liu, S.; Cheng, Y.-C.N.; Haacke, E.M. Measuring iron in the brain using quantitative susceptibility mapping and X-ray fluorescence imaging. Neuroimage 2013, 78, 68–74. [Google Scholar] [CrossRef] [PubMed]
- McCrea, R.P.E.; Harder, S.L.; Martin, M.; Buist, R.; Nichol, H. A comparison of rapid-scanning X-ray fluorescence mapping and magnetic resonance imaging to localize brain iron distribution. Eur. J. Radiol. 2008, 68, S109–S113. [Google Scholar] [CrossRef] [PubMed]
- Hopp, K.; Popescu, B.F.G.; McCrea, R.P.E.; Harder, S.L.; Robinson, C.A.; Haacke, M.E.; Rajput, A.H.; Rajput, A.; Nichol, H. Brain iron detected by SWI high pass filtered phase calibrated with synchrotron X-ray fluorescence. J. Magn. Reson. Imaging 2010, 31, 1346–1354. [Google Scholar] [CrossRef] [PubMed]
- Antharam, V.; Collingwood, J.F.; Bullivant, J.-P.; Davidson, M.R.; Chandra, S.; Mikhaylova, A.; Finnegan, M.E.; Batich, C.; Forder, J.R.; Dobson, J. High field magnetic resonance microscopy of the human hippocampus in Alzheimer’s disease: Quantitative imaging and correlation with iron. Neuroimage 2012, 59, 1249–1260. [Google Scholar] [CrossRef] [PubMed]
- Ryan, C.G.; Kirkham, R.; Siddons, D.P.; Dunn, P.A.; Laird, J.S.; Kuczewski, A.; Moorhead, G.; de Geronimo, G.; Davey, P.; Jensen, M.; et al. The Maia 384 detector array in a nuclear microprobe: A platform for high definition PIXE elemental imaging. Nucl. Instrum. Meth. B 2010, 268, 1899–1902. [Google Scholar] [CrossRef]
- Meinecke, C.; Morawski, M.; Reinert, T.; Arendt, T.; Butz, T. Cellular distribution and localisation of iron in adult rat brain (substantia nigra). Nucl. Instrum. Meth. B 2006, 249, 688–691. [Google Scholar] [CrossRef]
- Butz, T.; Meinecke, C.; Morawski, M.; Reinert, T.; Schwertner, M.; Spemann, D.; Vogt, J. Morphological and elemental characterisation with the high-energy ion-nanoprobe LIPSION. Appl. Surf. Sci. 2005, 252, 43–48. [Google Scholar] [CrossRef]
- Morawski, M.; Meinecke, C.; Reinert, T.; Dorffel, A.; Riederer, P.; Arendt, T.; Butz, T. Determination of trace elements in the human substantia nigra. Nucl. Instrum. Meth. B 2005, 231, 224–228. [Google Scholar] [CrossRef]
- Barapatre, N.; Morawski, M.; Butz, T.; Reinert, T. Trace element mapping in parkinsonian brain by quantitative ion beam microscopy. Nucl. Instrum. Meth. B 2010, 268, 2156–2159. [Google Scholar] [CrossRef]
- Fiedler, A.; Reinert, T.; Morawski, M.; Bruckner, G.; Arendt, T.; Butz, T. Intracellular iron concentration of neurons with and without perineuronal nets. Nucl. Instrum. Meth. B 2007, 260, 153–158. [Google Scholar] [CrossRef]
- Stüber, C.; Morawski, M.; Schäfer, A.; Labadie, C.; Wähnert, M.; Leuze, C.; Streicher, M.; Barapatre, N.; Reimann, K.; Geyer, S.; et al. Myelin and iron concentration in the human brain: A quantitative study of MRI contrast. Neuroimage 2014, 93, 95–106. [Google Scholar] [CrossRef] [PubMed]
- Vymazal, J.; Brooks, R.A.; Zak, O.; McRill, C.; Shen, C.; di Chiro, G. T1 and T2 of ferritin at different field strengths: Effect on MRI. Magn. Reson. Med. 1992, 27, 368–374. [Google Scholar] [CrossRef] [PubMed]
- Vymazal, J.; Brooks, R.A.; Patronas, N.; Hajek, M.; Bulte, J.W.; di Chiro, G. Magnetic resonance imaging of brain iron in health and disease. J. Neurol. Sci. 1995, 134, 19–26. [Google Scholar] [CrossRef]
- Ogg, R.J.; Steen, R.G. Age-related changes in brain T1 are correlated with iron concentration. Magn. Reson. Med. 1998, 40, 749–753. [Google Scholar] [CrossRef] [PubMed]
- Rooney, W.D.; Johnson, G.; Li, X.; Cohen, E.R.; Kim, S.-G.; Ugurbil, K.; Springer, C.S. Magnetic field and tissue dependencies of human brain longitudinal 1H2O relaxation in vivo. Magn. Reson. Med. 2007, 57, 308–318. [Google Scholar] [CrossRef] [PubMed]
- Vymazal, J.; Brooks, R.A.; Baumgarner, C.; Tran, V.; Katz, D.; Bulte, J.W.; Bauminger, R.; di Chiro, G. The relation between brain iron and NMR relaxation times: An in vitro study. Magn. Reson. Med. 1996, 35, 56–61. [Google Scholar] [CrossRef] [PubMed]
- Langkammer, C.; Krebs, N.; Goessler, W.; Scheurer, E.; Ebner, F.; Yen, K.; Fazekas, F.; Ropele, S. Quantitative MR imaging of brain iron: A postmortem validation study. Radiology 2010, 257, 455–462. [Google Scholar] [CrossRef] [PubMed]
- Neema, M.; Arora, A.; Healy, B.C.; Guss, Z.D.; Brass, S.D.; Duan, Y.; Buckle, G.J.; Glanz, B.I.; Stazzone, L.; Khoury, S.J.; et al. Deep gray matter involvement on brain MRI scans is associated with clinical progression in multiple sclerosis. J. Neuroimaging 2009, 19, 3–8. [Google Scholar] [CrossRef] [PubMed]
- Frahm, J.; Haase, A.; Matthaei, D. Rapid NMR imaging of dynamic processes using the flash technique. Magn. Reson. Med. 1986, 3, 321–327. [Google Scholar] [CrossRef] [PubMed]
- Ordidge, R.J.; Gorell, J.M.; Deniau, J.C.; Knight, R.A.; Helpern, J.A. Assessment of relative brain iron concentrations using T2-weighted and T2*-weighted MRI at 3 Tesla. Magn. Reson. Med. 1994, 32, 335–341. [Google Scholar] [CrossRef] [PubMed]
- Chavhan, G.B.; Babyn, P.S.; Thomas, B.; Shroff, M.M.; Haacke, E.M. Principles, techniques, and applications of T2*-based MR imaging and its special applications. Radiographics 2009, 29, 1433–1449. [Google Scholar] [CrossRef] [PubMed]
- Peters, A.M.; Brookes, M.J.; Hoogenraad, F.G.; Gowland, P.A.; Francis, S.T.; Morris, P.G.; Bowtell, R. T2* measurements in human brain at 1.5, 3 and 7 T. Magn. Reson. Imaging 2007, 25, 748–753. [Google Scholar] [CrossRef] [PubMed]
- Rauscher, A.; Sedlacik, J.; Barth, M.; Mentzel, H.-J.; Reichenbach, J.R. Magnetic susceptibility-weighted MR phase imaging of the human brain. AJNR Am. J. Neuroradiol. 2005, 26, 736–742. [Google Scholar] [PubMed]
- Jensen, J.H.; Szulc, K.; Hu, C.; Ramani, A.; Lu, H.; Xuan, L.; Falangola, M.F.; Chandra, R.; Knopp, E.A.; Schenck, J.; et al. Magnetic field correlation as a measure of iron-generated magnetic field inhomogeneities in the brain. Magn. Reson. Med. 2009, 61, 481–485. [Google Scholar] [CrossRef] [PubMed]
- Jensen, J.H.; Chandra, R.; Ramani, A.; Lu, H.; Johnson, G.; Lee, S.-P.; Kaczynski, K.; Helpern, J.A. Magnetic field correlation imaging. Magn. Reson. Med. 2006, 55, 1350–1361. [Google Scholar] [CrossRef] [PubMed]
- Ogg, R.J. The correlation between phase shifts in gradient-echo MR images and regional brain iron concentration. Magn. Reson. Imaging 1999, 17, 1141–1148. [Google Scholar] [CrossRef]
- Duyn, J.H.; van Gelderen, P.; Li, T.-Q.; de Zwart, J.A.; Koretsky, A.P.; Fukunaga, M. High-field MRI of brain cortical substructure based on signal phase. Proc. Natl. Acad. Sci. USA 2007, 104, 11796–11801. [Google Scholar] [CrossRef] [PubMed]
- Deistung, A.; Schäfer, A.; Schweser, F.; Biedermann, U.; Turner, R.; Reichenbach, J.R. Toward in vivo histology: A comparison of quantitative susceptibility mapping (QSM) with magnitude-, phase-, and R2*-imaging at ultra-high magnetic field strength. Neuroimage 2013, 65, 299–314. [Google Scholar] [CrossRef] [PubMed]
- Li, J.; Chang, S.; Liu, T.; Wang, Q.; Cui, D.; Chen, X.; Jin, M.; Wang, B.; Pei, M.; Wisnieff, C.; et al. Reducing the object orientation dependence of susceptibility effects in gradient echo MRI through quantitative susceptibility mapping. Magn. Reson. Med. 2012, 68, 1563–1569. [Google Scholar] [CrossRef] [PubMed]
- Wang, S.; Lou, M.; Liu, T.; Cui, D.; Chen, X.; Wang, Y. Hematoma volume measurement in gradient echo MRI using quantitative susceptibility mapping. Stroke 2013, 44, 2315–2317. [Google Scholar] [CrossRef] [PubMed]
- Ogawa, S.; Menon, R.S.; Tank, D.W.; Kim, S.G.; Merkle, H.; Ellermann, J.M.; Ugurbil, K. Functional brain mapping by blood oxygenation level-dependent contrast magnetic resonance imaging. A comparison of signal characteristics with a biophysical model. Biophys. J. 1993, 64, 803–812. [Google Scholar] [CrossRef]
- Davis, T.L.; Kwong, K.K.; Weisskoff, R.M.; Rosen, B.R. Calibrated functional MRI: Mapping the dynamics of oxidative metabolism. Proc. Natl. Acad. Sci. USA 1998, 95, 1834–1839. [Google Scholar] [CrossRef] [PubMed]
- Boxerman, J.L.; Hamberg, L.M.; Rosen, B.R.; Weisskoff, R.M. MR contrast due to intravascular magnetic susceptibility perturbations. Magn. Reson. Med. 1995, 34, 555–566. [Google Scholar] [CrossRef] [PubMed]
- Kennan, R.P.; Zhong, J.; Gore, J.C. Intravascular susceptibility contrast mechanisms in tissues. Magn. Reson. Med. 1994, 31, 9–21. [Google Scholar] [CrossRef] [PubMed]
- Yablonskiy, D.A.; Haacke, E.M. Theory of NMR signal behavior in magnetically inhomogeneous tissues: The static dephasing regime. Magn. Reson. Med. 1994, 32, 749–763. [Google Scholar] [CrossRef] [PubMed]
- Liu, J.; Liu, T.; de Rochefort, L.; Ledoux, J.; Khalidov, I.; Chen, W.; Tsiouris, A.J.; Wisnieff, C.; Spincemaille, P.; Prince, M.R.; et al. Morphology enabled dipole inversion for quantitative susceptibility mapping using structural consistency between the magnitude image and the susceptibility map. Neuroimage 2012, 59, 2560–2568. [Google Scholar] [CrossRef] [PubMed]
- Liu, T.; Wisnieff, C.; Lou, M.; Chen, W.; Spincemaille, P.; Wang, Y. Nonlinear formulation of the magnetic field to source relationship for robust quantitative susceptibility mapping. Magn. Reson. Med. 2013, 69, 467–476. [Google Scholar] [CrossRef] [PubMed]
- Li, L.; Leigh, J.S. Quantifying arbitrary magnetic susceptibility distributions with MR. Magn. Reson. Med. 2004, 51, 1077–1082. [Google Scholar] [CrossRef] [PubMed]
- Haacke, E.M.; Cheng, N.Y.C.; House, M.J.; Liu, Q.; Neelavalli, J.; Ogg, R.J.; Khan, A.; Ayaz, M.; Kirsch, W.; Obenaus, A. Imaging iron stores in the brain using magnetic resonance imaging. Magn. Reson. Imaging 2005, 23, 1–25. [Google Scholar] [CrossRef] [PubMed]
- Shmueli, K.; de Zwart, J.A.; van Gelderen, P.; Li, T.-Q.; Dodd, S.J.; Duyn, J.H. Magnetic susceptibility mapping of brain tissue in vivo using MRI phase data. Magn. Reson. Med. 2009, 62, 1510–1522. [Google Scholar] [CrossRef] [PubMed]
- De Rochefort, L.; Brown, R.; Prince, M.R.; Wang, Y. Quantitative MR susceptibility mapping using piece-wise constant regularized inversion of the magnetic field. Magn. Reson. Med. 2008, 60, 1003–1009. [Google Scholar] [CrossRef] [PubMed]
- Yeo, D.T.B.; Fessler, J.A.; Kim, B. Motion robust magnetic susceptibility and field inhomogeneity estimation using regularized image restoration techniques for fMRI. Med. Image Comput. Comput. Assist. Interv. 2008, 11, 991–998. [Google Scholar] [PubMed]
- Liu, T.; Spincemaille, P.; de Rochefort, L.; Kressler, B.; Wang, Y. Calculation of susceptibility through multiple orientation sampling (COSMOS): A method for conditioning the inverse problem from measured magnetic field map to susceptibility source image in MRI. Magn. Reson. Med. 2009, 61, 196–204. [Google Scholar] [CrossRef] [PubMed]
- Wang, Y.; de Rochefort, L.; Liu, T.; Kressler, B. Magnetic source MRI: A new quantitative imaging of magnetic biomarkers. Conf. Proc. IEEE Eng. Med. Biol. Soc. 2009, 2009, 53–56. [Google Scholar] [PubMed]
- Schweser, F.; Sommer, K.; Deistung, A.; Reichenbach, J.R. Quantitative susceptibility mapping for investigating subtle susceptibility variations in the human brain. Neuroimage 2012, 62, 2083–2100. [Google Scholar] [CrossRef] [PubMed]
- Kressler, B.; de Rochefort, L.; Liu, T.; Spincemaille, P.; Jiang, Q.; Wang, Y. Nonlinear regularization for per voxel estimation of magnetic susceptibility distributions from MRI field maps. IEEE Trans. Med. Imaging 2010, 29, 273–281. [Google Scholar] [CrossRef] [PubMed]
- Wharton, S.; Schäfer, A.; Bowtell, R. Susceptibility mapping in the human brain using threshold-based k-space division. Magn. Reson. Med. 2010, 63, 1292–1304. [Google Scholar] [CrossRef] [PubMed]
- Li, W.; Wu, B.; Liu, C. Quantitative susceptibility mapping of human brain reflects spatial variation in tissue composition. Neuroimage 2011, 55, 1645–1656. [Google Scholar] [CrossRef] [PubMed]
- Chen, Z.; Calhoun, V. Computed inverse resonance imaging for magnetic susceptibility map reconstruction. J. Comput. Assist. Tomogr. 2012, 36, 265–274. [Google Scholar] [CrossRef] [PubMed]
- Schweser, F.; Deistung, A.; Sommer, K.; Reichenbach, J.R. Toward online reconstruction of quantitative susceptibility maps: Superfast dipole inversion. Magn. Reson. Med. 2013, 69, 1582–1594. [Google Scholar] [CrossRef] [PubMed]
- Langkammer, C.; Schweser, F.; Krebs, N.; Deistung, A.; Goessler, W.; Scheurer, E.; Sommer, K.; Reishofer, G.; Yen, K.; Fazekas, F.; et al. Quantitative susceptibility mapping (QSM) as a means to measure brain iron? A post mortem validation study. Neuroimage 2012, 62, 1593–1599. [Google Scholar] [CrossRef] [PubMed]
- Wu, B.; Li, W.; Guidon, A.; Liu, C. Whole brain susceptibility mapping using compressed sensing. Magn. Reson. Med. 2012, 67, 137–147. [Google Scholar] [CrossRef] [PubMed]
- Bilgic, B.; Fan, A.P.; Polimeni, J.R.; Cauley, S.F.; Bianciardi, M.; Adalsteinsson, E.; Wald, L.L.; Setsompop, K. Fast quantitative susceptibility mapping with L1-regularization and automatic parameter selection. Magn. Reson. Med. 2014, 72, 1444–1459. [Google Scholar] [CrossRef] [PubMed]
- Bilgic, B.; Chatnuntawech, I.; Fan, A.P.; Setsompop, K.; Cauley, S.F.; Wald, L.L.; Adalsteinsson, E. Fast image reconstruction with L2-regularization. J. Magn. Reson. Imaging 2014, 40, 181–191. [Google Scholar] [CrossRef] [PubMed]
- Tang, J.; Liu, S.; Neelavalli, J.; Cheng, Y.C.N.; Buch, S.; Haacke, E.M. Improving susceptibility mapping using a threshold-based k-space/image domain iterative reconstruction approach. Magn. Reson. Med. 2013, 69, 1396–1407. [Google Scholar] [CrossRef] [PubMed]
- Schäfer, A.; Forstmann, B.U.; Neumann, J.; Wharton, S.; Mietke, A.; Bowtell, R.; Turner, R. Direct visualization of the subthalamic nucleus and its iron distribution using high-resolution susceptibility mapping. Hum. Brain Mapp. 2012, 33, 2831–2842. [Google Scholar] [CrossRef] [PubMed]
- Liu, C.; Li, W.; Johnson, G.A.; Wu, B. High-field (9.4 T) MRI of brain dysmyelination by quantitative mapping of magnetic susceptibility. Neuroimage 2011, 56, 930–938. [Google Scholar] [CrossRef] [PubMed]
- Schenck, J.F. Health and physiological effects of human exposure to whole-body four-Tesla magnetic fields during MRI. Ann. N. Y. Acad. Sci. 1992, 649, 285–301. [Google Scholar] [CrossRef] [PubMed]
- Rouault, T.A.; Cooperman, S. Brain iron metabolism. Semin. Pediatr. Neurol. 2006, 13, 142–148. [Google Scholar] [CrossRef] [PubMed]
- Schenck, J.F. The role of magnetic susceptibility in magnetic resonance imaging: MRI magnetic compatibility of the first and second kinds. Med. Phys. 1996, 23, 815–850. [Google Scholar] [CrossRef] [PubMed]
- Connor, J.R.; Menzies, S.L.; St. Martin, S.M.; Mufson, E.J. Cellular distribution of transferrin, ferritin, and iron in normal and aged human brains. J. Neurosci. Res. 1990, 27, 595–611. [Google Scholar] [CrossRef] [PubMed]
- Zheng, W.; Monnot, A.D. Regulation of brain iron and copper homeostasis by brain barrier systems: Implication in neurodegenerative diseases. Pharmacol. Ther. 2012, 133, 177–188. [Google Scholar] [CrossRef] [PubMed]
- Langkammer, C.; Krebs, N.; Goessler, W.; Scheurer, E.; Yen, K.; Fazekas, F.; Ropele, S. Susceptibility induced gray–white matter MRI contrast in the human brain. Neuroimage 2012, 59, 1413–1419. [Google Scholar] [CrossRef] [PubMed]
- Connor, J.R.; Menzies, S.L. Relationship of iron to oligodendrocytes and myelination. Glia 1996, 17, 83–93. [Google Scholar] [CrossRef]
- Cairo, G.; Bernuzzi, F.; Recalcati, S. A precious metal: Iron, an essential nutrient for all cells. Genes Nutr. 2006, 1, 25–39. [Google Scholar] [CrossRef] [PubMed]
- Mosser, D.M.; Edwards, J.P. Exploring the full spectrum of macrophage activation. Nat. Rev. Immunol. 2008, 8, 958–969. [Google Scholar] [CrossRef] [PubMed]
- Martinez, F.O.; Helming, L.; Gordon, S. Alternative activation of macrophages: An immunologic functional perspective. Annu. Rev. Immunol. 2009, 27, 451–483. [Google Scholar] [CrossRef] [PubMed]
- Gordon, S.; Taylor, P.R. Monocyte and macrophage heterogeneity. Nat. Rev. Immunol. 2005, 5, 953–964. [Google Scholar] [CrossRef] [PubMed]
- Corna, G.; Campana, L.; Pignatti, E.; Castiglioni, A.; Tagliafico, E.; Bosurgi, L.; Campanella, A.; Brunelli, S.; Manfredi, A.A.; Apostoli, P.; et al. Polarization dictates iron handling by inflammatory and alternatively activated macrophages. Haematologica 2010, 95, 1814–1822. [Google Scholar] [CrossRef] [PubMed]
- Recalcati, S.; Locati, M.; Marini, A.; Santambrogio, P.; Zaninotto, F.; de Pizzol, M.; Zammataro, L.; Girelli, D.; Cairo, G. Differential regulation of iron homeostasis during human macrophage polarized activation. Eur. J. Immunol. 2010, 40, 824–835. [Google Scholar] [CrossRef] [PubMed]
- Xiong, S.; She, H.; Takeuchi, H.; Han, B.; Engelhardt, J.F.; Barton, C.H.; Zandi, E.; Giulivi, C.; Tsukamoto, H. Signaling role of intracellular iron in NF-κB activation. J. Biol. Chem. 2003, 278, 17646–17654. [Google Scholar] [CrossRef] [PubMed]
- Chen, L.; Xiong, S.; She, H.; Lin, S.W.; Wang, J.; Tsukamoto, H. Iron causes interactions of TAK1, p21ras, and phosphatidylinositol 3-kinase in caveolae to activate IκB kinase in hepatic macrophages. J. Biol. Chem. 2007, 282, 5582–5588. [Google Scholar] [CrossRef] [PubMed]
- Martinez, F.O.; Gordon, S. The M1 and M2 paradigm of macrophage activation: Time for reassessment. F1000Prime Rep. 2014, 6, 1–13. [Google Scholar] [CrossRef] [PubMed]
- Yao, B.; Bagnato, F.; Matsuura, E.; Merkle, H.; van Gelderen, P.; Cantor, F.K.; Duyn, J.H. Chronic multiple sclerosis lesions: Characterization with high-field-strength MR imaging. Radiology 2012, 262, 206–215. [Google Scholar] [CrossRef] [PubMed]
- Boven, L.A.; van Meurs, M.; van Zwam, M.; Wierenga-Wolf, A.; Hintzen, R.Q.; Boot, R.G.; Aerts, J.M.; Amor, S.; Nieuwenhuis, E.E.; Laman, J.D. Myelin-laden macrophages are anti-inflammatory, consistent with foam cells in multiple sclerosis. Brain 2006, 129, 517–526. [Google Scholar] [CrossRef] [PubMed]
- Taetzsch, T.; Levesque, S.; McGraw, C.; Brookins, S.; Luqa, R.; Bonini, M.G.; Mason, R.P.; Oh, U.; Block, M.L. Redox regulation of NF-κB p50 and M1 polarization in microglia. Glia 2015, 63, 423–440. [Google Scholar] [CrossRef] [PubMed]
- Pitt, D.; Boster, A.; Pei, W.; Wohleb, E.; Jasne, A.; Zachariah, C.R.; Rammohan, K.; Knopp, M.V.; Schmalbrock, P. Imaging cortical lesions in multiple sclerosis with ultra-high-field magnetic resonance imaging. Arch. Neurol. 2010, 67, 812–818. [Google Scholar] [CrossRef] [PubMed]
- Yao, B.; Hametner, S.; van Gelderen, P.; Merkle, H.; Chen, C.; Lassmann, H.; Duyn, J.H.; Bagnato, F. 7 Tesla magnetic resonance imaging to detect cortical pathology in multiple sclerosis. PLoS ONE 2014, 9, e108863. [Google Scholar] [CrossRef] [PubMed]
- Tjoa, C.W.; Benedict, R.H.B.; Weinstock-Guttman, B.; Fabiano, A.J.; Bakshi, R. MRI T2 hypointensity of the dentate nucleus is related to ambulatory impairment in multiple sclerosis. J. Neurol. Sci. 2005, 234, 17–24. [Google Scholar] [CrossRef] [PubMed]
- Neema, M.; Stankiewicz, J.; Arora, A.; Dandamudi, V.S.; Batt, C.E.; Guss, Z.D.; Al-Sabbagh, A.; Bakshi, R. T1- and T2-based MRI measures of diffuse gray matter and white matter damage in patients with multiple sclerosis. J. Neuroimaging 2007, 17, 16s–21s. [Google Scholar] [CrossRef] [PubMed]
- Bermel, R.A.; Puli, S.R.; Rudick, R.A.; Weinstock-Guttman, B.; Fisher, E.; Munschauer, F.E.; Bakshi, R. Prediction of longitudinal brain atrophy in multiple sclerosis by gray matter magnetic resonance imaging T2 hypointensity. Arch. Neurol. 2005, 62, 1371–1376. [Google Scholar] [CrossRef] [PubMed]
- Brass, S.D.; Benedict, R.H.B.; Weinstock-Guttman, B.; Munschauer, F.; Bakshi, R. Cognitive impairment is associated with subcortical magnetic resonance imaging grey matter T2 hypointensity in multiple sclerosis. Mult. Scler. 2006, 12, 437–444. [Google Scholar] [CrossRef] [PubMed]
- Altamura, S.; Muckenthaler, M.U. Iron toxicity in diseases of aging: Alzheimer’s disease, Parkinson’s disease and atherosclerosis. J. Alzheimers Dis. 2009, 16, 879–895. [Google Scholar] [PubMed]
- Brass, S.D.; Chen, N.K.; Mulkern, R.V.; Bakshi, R. Magnetic resonance imaging of iron deposition in neurological disorders. Top. Magn. Reson. Imaging 2006, 17, 31–40. [Google Scholar] [CrossRef] [PubMed]
- Oakley, A.E.; Collingwood, J.F.; Dobson, J.; Love, G.; Perrott, H.R.; Edwardson, J.A.; Elstner, M.; Morris, C.M. Individual dopaminergic neurons show raised iron levels in parkinson disease. Neurology 2007, 68, 1820–1825. [Google Scholar] [CrossRef] [PubMed]
- Bakshi, R.; Thompson, A.J.; Rocca, M.A.; Pelletier, D.; Dousset, V.; Barkhof, F.; Inglese, M.; Guttmann, C.R.; Horsfield, M.A.; Filippi, M. MRI in multiple sclerosis: Current status and future prospects. Lancet Neurol. 2008, 7, 615–625. [Google Scholar] [CrossRef]
- Duyn, J.H. High-field MRI of brain iron. Methods Mol. Biol. 2011, 711, 239–249. [Google Scholar] [PubMed]
- Schmierer, K.; Parkes, H.G.; So, P.W.; An, S.F.; Brandner, S.; Ordidge, R.J.; Yousry, T.A.; Miller, D.H. High field (9.4 Tesla) magnetic resonance imaging of cortical grey matter lesions in multiple sclerosis. Brain 2010, 133, 858–867. [Google Scholar] [CrossRef] [PubMed]
- Filippi, M.; Evangelou, N.; Kangarlu, A.; Inglese, M.; Mainero, C.; Horsfield, M.A.; Rocca, M.A. Ultra-high-field MR imaging in multiple sclerosis. J. Neurol. Neurosurg. Psychiatry 2014, 85, 60–66. [Google Scholar] [CrossRef] [PubMed]
- MacKay, A.L.; Vavasour, I.M.; Rauscher, A.; Kolind, S.H.; Mädler, B.; Moore, G.R.W.; Traboulsee, A.L.; Li, D.K.B.; Laule, C. MR relaxation in multiple sclerosis. Neuroimaging Clin. N. Am. 2009, 19, 1–26. [Google Scholar] [CrossRef] [PubMed]
- Geurts, J.J.G.; Bö, L.; Pouwels, P.J.W.; Castelijns, J.A.; Polman, C.H.; Barkhof, F. Cortical lesions in multiple sclerosis: Combined postmortem MR imaging and histopathology. AJNR Am. J. Neuroradiol. 2005, 26, 572–577. [Google Scholar] [PubMed]
- Yablonskiy, D.A.; Luo, J.; Sukstanskii, A.L.; Iyer, A.; Cross, A.H. Biophysical mechanisms of MRI signal frequency contrast in multiple sclerosis. Proc. Natl. Acad. Sci. USA 2012, 109, 14212–14217. [Google Scholar] [CrossRef] [PubMed]
- Lee, J.; Shmueli, K.; Kang, B.-T.; Yao, B.; Fukunaga, M.; van Gelderen, P.; Palumbo, S.; Bosetti, F.; Silva, A.C.; Duyn, J.H. The contribution of myelin to magnetic susceptibility-weighted contrasts in high-field MRI of the brain. Neuroimage 2012, 59, 3967–3975. [Google Scholar] [CrossRef] [PubMed]
- Wiggermann, V.; Hernández Torres, E.; Vavasour, I.M.; Moore, G.R.W.; Laule, C.; MacKay, A.L.; Li, D.K.B.; Traboulsee, A.; Rauscher, A. Magnetic resonance frequency shifts during acute MS lesion formation. Neurology 2013, 81, 211–218. [Google Scholar] [CrossRef] [PubMed]
- Bian, W.; Harter, K.; Hammond-Rosenbluth, K.E.; Lupo, J.M.; Xu, D.; Kelley, D.A.; Vigneron, D.B.; Nelson, S.J.; Pelletier, D. A serial in vivo 7T magnetic resonance phase imaging study of white matter lesions in multiple sclerosis. Mult. Scler. 2013, 19, 69–75. [Google Scholar] [CrossRef] [PubMed]
- Absinta, M.; Sati, P.; Gaitán, M.I.; Maggi, P.; Cortese, I.C.M.; Filippi, M.; Reich, D.S. Seven-Tesla phase imaging of acute multiple sclerosis lesions: A new window into the inflammatory process. Ann. Neurol. 2013, 74, 669–678. [Google Scholar] [CrossRef] [PubMed]
- Kollia, K.; Maderwald, S.; Putzki, N.; Schlamann, M.; Theysohn, J.M.; Kraff, O.; Ladd, M.E.; Forsting, M.; Wanke, I. First clinical study on ultra-high-field MR imaging in patients with multiple sclerosis: Comparison of 1.5T and 7T. Am. J. Neuroradiol. 2009, 30, 699–702. [Google Scholar] [CrossRef] [PubMed]
- Zivadinov, R.; Dwyer, M.; Markovic-Plese, S.; Hayward, B.; Bergsland, N.; Heininen-Brown, M.; Carl, E.; Kennedy, C.; Dangond, F.; Weinstock-Guttman, B. A pilot, longitudinal, 24-week study to evaluate the effect of interferon β-1a subcutaneous on changes in susceptibility-weighted imaging-filtered phase assessment of lesions and subcortical deep-gray matter in relapsing-remitting multiple sclerosis. Ther. Adv. Neurol. Disord. 2015, 8, 59–70. [Google Scholar] [CrossRef] [PubMed]
- Grabner, G.; Dal-Bianco, A.; Schernthaner, M.; Vass, K.; Lassmann, H.; Trattnig, S. Analysis of multiple sclerosis lesions using a fusion of 3.0 T FLAIR and 7.0 T SWI phase: FLAIR SWI. J. Magn. Reson. Imaging 2011, 33, 543–549. [Google Scholar] [CrossRef] [PubMed]
- Eskreis-Winkler, S.; Deh, K.; Gupta, A.; Liu, T.; Wisnieff, C.; Jin, M.; Gauthier, S.A.; Wang, Y.; Spincemaille, P. Multiple sclerosis lesion geometry in quantitative susceptibility mapping (QSM) and phase imaging. J. Magn. Reson. Imaging 2015, 42, 224–229. [Google Scholar] [CrossRef] [PubMed]
- Lebel, R.M.; Eissa, A.; Seres, P.; Blevins, G.; Wilman, A.H. Quantitative high-field imaging of sub-cortical gray matter in multiple sclerosis. Mult. Scler. 2012, 18, 433–441. [Google Scholar] [CrossRef] [PubMed]
- Rudko, D.A.; Solovey, I.; Gati, J.S.; Kremenchutzky, M.; Menon, R.S. Multiple sclerosis: Improved identification of disease-relevant changes in gray and white matter by using susceptibility-based MR imaging. Radiology 2014, 272, 851–864. [Google Scholar] [CrossRef] [PubMed]
- Mainero, C.; Louapre, C.; Govindarajan, S.T.; Gianni, C.; Nielsen, A.S.; Cohen-Adad, J.; Sloane, J.; Kinkel, R.P. A gradient in cortical pathology in multiple sclerosis by in vivo quantitative 7 T imaging. Brain 2015, 138, 932–945. [Google Scholar] [CrossRef] [PubMed]
- Jonkman, L.E.; Klaver, R.; Fleysher, L.; Inglese, M.; Geurts, J.J.G. Ultra-high-field MRI visualization of cortical multiple sclerosis lesions with T2 and T2*: A postmortem MRI and histopathology study. AJNR Am. J. Neuroradiol. 2015, 36, 2062–2067. [Google Scholar] [CrossRef] [PubMed]
- Raj, A.; Pandya, S.; Shen, X.; LoCastro, E.; Nguyen, T.D.; Gauthier, S.A. Multi-compartment T2 relaxometry using a spatially constrained multi-Gaussian model. PLoS ONE 2014, 9, e98391. [Google Scholar] [CrossRef] [PubMed]
- Nguyen, T.D.; Wisnieff, C.; Cooper, M.A.; Kumar, D.; Raj, A.; Spincemaille, P.; Wang, Y.; Vartanian, T.; Gauthier, S.A. T2 prep three-dimensional spiral imaging with efficient whole brain coverage for myelin water quantification at 1.5 Tesla. Magn. Reson. Med. 2012, 67, 614–621. [Google Scholar] [CrossRef] [PubMed]
- Kumar, D.; Nguyen, T.D.; Gauthier, S.A.; Raj, A. Bayesian algorithm using spatial priors for multiexponential T2 relaxometry from multiecho spin echo MRI. Magn. Reson. Med. 2012, 68, 1536–1543. [Google Scholar] [CrossRef] [PubMed]
- Wisnieff, C.; Liu, T.; Spincemaille, P.; Wang, S.; Zhou, D.; Wang, Y. Magnetic susceptibility anisotropy: Cylindrical symmetry from macroscopically ordered anisotropic molecules and accuracy of MRI measurements using few orientations. Neuroimage 2013, 70, 363–376. [Google Scholar] [CrossRef] [PubMed]
- Chen, W.; Gauthier, S.; Gupta, A.; Comunale, J.; Liu, T.; Wang, S.; Pei, M.; Pitt, D.; Wang, Y. Dynamic Magnetic Property of Multiple Sclerosis Lesions at Various Ages Measured by Quantitative Susceptibility Mapping; ISMRM: Salt Lake City, UT, USA, 2013; p. 0692. [Google Scholar]
- Barber, T.W.; Brockway, J.A.; Higgins, L.S. The density of tissues in and about the head. Acta Neurol. Scand. 1970, 46, 85–92. [Google Scholar] [CrossRef] [PubMed]
- Wisnieff, C.; Ryan, R.; Pitt, D.; Wang, Y. Investigation of susceptibility contrast in grey and white matter multiple sclerosis lesions. Proc. Int. Soc. Magn. Reson. Med. 2014, 22, 3403. [Google Scholar]
- Wisnieff, C.; Ramanan, S.; Wang, Y.; Pitt, D. Iron in Multiple Sclerosis Lesions Can be Detected by Larger Volumes on Quantitative Susceptibility Mapping Than T2 Weighted Imaging. Mult. Scler. J. 2014, 20, 262. [Google Scholar]
- Ladewig, G.; Jestaedt, L.; Misselwitz, B.; Solymosi, L.; Toyka, K.; Bendszus, M.; Stoll, G. Spatial diversity of blood-brain barrier alteration and macrophage invasion in experimental autoimmune encephalomyelitis: A comparative MRI study. Exp. Neurol. 2009, 220, 207–211. [Google Scholar] [CrossRef] [PubMed]
- Gaitán, M.I.; Shea, C.D.; Evangelou, I.E.; Stone, R.D.; Fenton, K.M.; Bielekova, B.; Massacesi, L.; Reich, D.S. Evolution of the blood-brain barrier in newly forming multiple sclerosis lesions. Ann. Neurol. 2011, 70, 22–29. [Google Scholar] [CrossRef] [PubMed]
- Zhang, Y.; Gauthier, S.; Tu, L.; Gupta, A.; Comunale, J.; Chiang, G.C.; Zhou, D.; Wang, Y. Increase in Magnetic Susceptibility After MS Lesion Formation and Potential Diagnostic Utility. In Proceedings of the ECTRIMS, Barcelona, Spain, 7–10 October 2015; p. 986.
© 2016 by the authors; licensee MDPI, Basel, Switzerland. This article is an open access article distributed under the terms and conditions of the Creative Commons by Attribution (CC-BY) license (http://creativecommons.org/licenses/by/4.0/).
Share and Cite
Stüber, C.; Pitt, D.; Wang, Y. Iron in Multiple Sclerosis and Its Noninvasive Imaging with Quantitative Susceptibility Mapping. Int. J. Mol. Sci. 2016, 17, 100. https://doi.org/10.3390/ijms17010100
Stüber C, Pitt D, Wang Y. Iron in Multiple Sclerosis and Its Noninvasive Imaging with Quantitative Susceptibility Mapping. International Journal of Molecular Sciences. 2016; 17(1):100. https://doi.org/10.3390/ijms17010100
Chicago/Turabian StyleStüber, Carsten, David Pitt, and Yi Wang. 2016. "Iron in Multiple Sclerosis and Its Noninvasive Imaging with Quantitative Susceptibility Mapping" International Journal of Molecular Sciences 17, no. 1: 100. https://doi.org/10.3390/ijms17010100
APA StyleStüber, C., Pitt, D., & Wang, Y. (2016). Iron in Multiple Sclerosis and Its Noninvasive Imaging with Quantitative Susceptibility Mapping. International Journal of Molecular Sciences, 17(1), 100. https://doi.org/10.3390/ijms17010100