Article

Identification of Predictive Markers for Response to Neoadjuvant Chemoradiation in Rectal Carcinomas by Proteomic Isotope Coded Protein Label (ICPL) Analysis

1
Department of Surgery, University Hospital Erlangen, Erlangen 91054, Germany
2
Max-Planck-Institute of Biochemistry, Martinsried 82152, Germany
3
School of Biological Sciences/Proteomics Unit, University of Essex; Wivenhoe Park, Colchester, Essex CO4 3SQ, UK
4
Department of Surgery, University Hospital Göttingen, Göttingen 37075, Germany
5
Department of Pathology, University Hospital Erlangen, Erlangen 91054, Germany
6
Division of Molecular and Experimental Surgery, University Hospital Erlangen, Erlangen 91054, Germany
*
Author to whom correspondence should be addressed.
These authors contributed equally to this work.
Int. J. Mol. Sci. 2016, 17(2), 209; https://doi.org/10.3390/ijms17020209
Submission received: 29 October 2015 / Revised: 20 January 2016 / Accepted: 25 January 2016 / Published: 4 February 2016
(This article belongs to the Section Biochemistry)

Abstract

:
Neoadjuvant chemoradiation (nCRT) is an established procedure in stage union internationale contre le cancer (UICC) II/III rectal carcinomas. Around 53% of the tumours present with good tumor regression after nCRT, and 8%–15% are complete responders. Reliable selection markers would allow the identification of poor or non-responders prior to therapy. Tumor biopsies were harvested from 20 patients with rectal carcinomas, and stored in liquid nitrogen prior to therapy after obtaining patients’ informed consent (Erlangen-No.3784). Patients received standardized nCRT with 5-Fluoruracil (nCRT I) or 5-Fluoruracil ± Oxaliplatin (nCRT II) according to the CAO/ARO/AIO-04 protocol. After surgery, regression grading (Dworak) of the tumors was performed during histopathological examination of the specimens. Tumors were classified as poor (Dworak 1 + 2) or good (Dworak 3 + 4) responders. Laser capture microdissection (LCM) for tumor enrichment was performed on preoperative biopsies. Differences in expressed proteins between poor and good responders to nCRT I and II were identified by proteomic analysis (Isotope Coded Protein Label, ICPL™) and selected markers were validated by immunohistochemistry. Tumors of 10 patients were classified as histopathologically poor (Dworak 1 or 2) and the other 10 tumor samples as histopathologically good (Dworak 3 or 4) responders to nCRT after surgery. Sufficient material in good quality was harvested for ICPL analysis by LCM from all biopsies. We identified 140 differentially regulated proteins regarding the selection criteria and the response to nCRT. Fourteen of these proteins were synchronously up-regulated at least 1.5-fold after nCRT I or nCRT II (e.g., FLNB, TKT, PKM2, SERINB1, IGHG2). Thirty-five proteins showed a complete reciprocal regulation (up or down) after nCRT I or nCRT II and the rest was regulated either according to nCRT I or II. The protein expression of regulated proteins such as PLEC1, TKT, HADHA and TAGLN was validated successfully by immunohistochemistry. ICPL is a valid method to identify differentially expressed proteins in rectal carcinoma tissue between poor vs. good responders to nCRT. The identified protein markers may act as selection criteria for nCRT in the future, but our preliminary findings must be reproduced and validated in a prospective cohort.

1. Introduction

Neoadjuvant chemoradiation (nCRT) is an established procedure for locally advanced rectal carcinomas stage union internationale contre le cancer (UICC) II and lymph node positive rectal carcinomas stage UICC III [1,2,3,4,5]. Local tumor control is improved by nCRT. The percentage of sphincter preservation rate is increased and local recurrence rates after complete surgical removal of the tumor (R0) is decreased [4,6]. No improvement on overall patients’ survival is noted after nCRT [4]. The response to nCRT varies considerably with the patient cohorts. Applying the histopathological regression grading described by Dworak, poor regression was observed in 15%, intermediate regression in 70% and complete regression in 15% of the carcinomas [7]. The regression rate seems to improve prognosis significantly and there may be a correlation between tumor response, distant metastasis and patients’ survival [8]. However, in 6% of complete tumor response to nCRT (ypT0) lymph node metastases can be detected in the resected specimens. Lymph node metastases are considered as crucial prognostic indicators [8].
Neoadjuvant therapy comes with costs, not only is it associated with toxic side effects but it also represents an economic burden. Because the therapeutic effect of nCRT is variable and around 15% of the treated patients do not experience a therapeutic benefit at all, a case selection prior to therapy is desirable [9]. But currently no predictive indicators for nCRT response exist for routine clinical use. Today selection for nCRT is based on imaging techniques. These imaging techniques have limitations in detecting tumor-affected lymph nodes. Molecular markers of the tumor would be ideal to select patients, because they can be analysed prior to therapy in endoscopically harvested tissues. As of today no such markers exist.
To identify molecular markers predictive for nCRT therapy response, we analyzed the proteome of laser captured micro dissected rectal carcinoma biopsies prior to nCRT with isotope coded protein label (ICPL), a recent quantitative technique for protein analysis [10,11]. These results were postoperatively correlated with histopathological tumor response grade (Dworak) of the resected specimens.

2. Results

2.1. Tumor Samples and Laser Capture Microdissection

We harvested two tumor biopsies from rectal carcinomas from each patient prior to nCRT. One was harvested in liquid nitrogen and stored at −80 °C for proteome analysis, the second one underwent formalin fixation and paraffin embedding procedure (FFPE) fixation for immunohistochemistry. No complications occurred during biopsy sampling. Fresh frozen samples were cut in 8–10 µm slices and prepared for Laser capture microdissection (LCM) as described. A total of 100 mm2 pure tumor tissue was collected by LCM. There was sufficient tumor material within a 5 mm tumor biopsy to harvest this amount of carcinoma. From 100 mm2 of tumor tissue an amount of 20 µg total protein could be isolated for ICPL.

2.2. Proteome Analysis by Isotope Coded Protein Label (ICPL)

The proteome analysis of the 2 × 24 OFFGEL-fraction and the non-fractionated samples (50 samples in total) was performed via ICPL-ESIQuant Software. Proteins were referred as quantified and identified with at least two multiplets per protein and a unique peptide per protein. A protein was identified as a single protein species in neighbouring OFFGEL-fractions, whereas, a protein was identified as a separate protein species or isoform in several non side-by-side OFFGEL-fractions. In total 3222 protein species were detected in all 24 fractions of the first OFFGEL-analysis (645 unique protein species). However, because many of the proteins have been found in several fractions, this number was reduced to 131. In the second technical replicate, 3734 protein species were detected in total in all 24 fractions of the OFFGEL-analysis (734 unique protein species). Likewise proteins appearing in several fractions were removed, with 146 proteins left over. Eight-two proteins were identical in both technical replicates. In the first analysis of the not-fractionated samples, from in total 291 detected protein species, 62 unique proteins were identified. The second analysis of the non-fractionated samples could not be included in the evaluation, because that generated by the LC-MS/MS spectra did not permit reliable statements. A repeat of the experiment could not be performed due to insufficient sample amount. Forty-two of the identified proteins were found in all analyses (fractionated and non-fractionated). The identified proteins were classified as differentially expressed with a regulation value of 1.5 ≥ 1 ≥ 0.66, with at least two quadruplets per protein and a unique peptide per protein (CV ≤ 30%). The analysis for nCRT I and nCRT II was carried out separately because of the different chemotherapy regimens added to radiation therapy. Thus, in the data set of nCRT I, 201 proteins (non-redundant) were identified in 2 × 24 OFFGEL fractions and in the non-fractioned sample and the corresponding protein IDs are allocated from the IPI database; of these, 140 proteins could meet the described regulation value. Out of these 140 differentially regulated proteins, 79 proteins are downregulated in the proteome of poor/moderate responses of nCRT I and 61 proteins were upregulated. In the data set of nCRT II, and 201 proteins (non-redundant) were identified in 2 × 24 OFFGEL fractions and in the non-fractioned sample, and the corresponding protein IDs are allocated from the IPI database. Of these, 114 proteins met the described regulation values. Out of these 114 differentially regulated proteins, 91 proteins are downregulated in the proteome of poor/moderate responses of nCRT 1 and 23 proteins were upregulated.
Fourteen of these proteins showed a synchronous regulation after nCRT I and 2: A high expression of FLNB Isoform 1 of Filamin-B, Transketolase, PKM2 Isoform M2 of Pyruvate kinase isozymes M1/M2 and SERPINB1 Leukocyte elastase inhibitor and a low expression of IGHG2, Putative uncharacterized protein DKFZp686C15213 was particularly predictive for nCRT without any preference to the added chemotherapy throughout the applied RCT regiments. Thirty-five proteins were completely reciprocally regulated in response to nCRT I vs. nCRT II. Transgelin, LOC440786 Ig kappa chain V–II region TEW and kappa light chain variable region (Fragment) were highly expressed in good responders to nCRT II and expressed at very low levels in good responders to nCRT I. But heterogeneous nuclear ribonucleoprotein F, Adenine phosphoribosyltransferase (APRT) or Tubulin α-1C chain (TUBA1C) were highly expressed in response to nCRT I and expressed at very low levels in response to nCRT II. Eighty-nine proteins were regulated either in response to nCRT I or II. Of these proteins thirty eight were upregulated and 20 down-regulated in good response to nCRT I. Peroxiredoxin-4 (PRDX4), Tubulin α-1A chain (TUBA1A) and Fatty acid-binding protein, epidermal (FABP5; FABP5L7) were highly expressed and Isoform 1 of Fibrinogen α chain precursor (FGA), Isoform 1 of Caldesmon (CALD1) or Isoform Gamma-A of Fibrinogen gamma chain precursor (FGG) were very low expressed in response to nCRT I. Twenty-one proteins were up and 10 proteins were down regulated in response to nCRT II. Of these proteins Actin, α skeletal muscle (ACTA1), Actin, α cardiac muscle 1 (ACTC1) and filamin A, α isoform 1 (FLNA) were extremely highly expressed and Histone H1.5 (HIST1H1B) and 60S ribosomal protein L1i3a (RPL13A) were expressed at very low levels in response to nCRT II. A detailed list of differentially regulated proteins is provided in Table 1.
Table 1. Differentially regulated proteins identified by isotope coded protein label (isotope coded protein label (ICPL)) between poor (Dworak 1 + 2) and good (Dworak 3 + 4) responders to neoadjuvant chemoradiation (nCRT) I or II; n.r.: not regulated regarding the selection criteria (regulation value 1.5 ≥ 1 ≥ 0.66 and CV ≤ 30%); nCRT I: 50.4 Gy + 5-FU; nCRT II: 50.4 Gy + 5-FU/Oxaliplatin.
Accession NumberProtein NameProtein Expression ICPL in nCRT I (Dworak 1 + 2/Dworak 3 + 4)Protein Expression ICPL in nCRT II (Dworak 1+2/Dworak 3 + 4)
Synchronously regulated proteins in nCRT I and II
IPI00006663ALDH2 Aldehyde dehydrogenase, mitochondrial precursor0.530.53
IPI00010290FABP1 FABP1 protein (Fragment)0.540.33
IPI00013847UQCRC1 Cytochrome b-c1 complex subunit 1, mitochondrial precursor0.630.52
IPI00014898PLEC1 Isoform 1 of Plectin-10.480.43
IPI00026185CAPZB Isoform 1 of F-actin-capping protein subunit beta0.640.58
IPI00027444SERPINB1 Leukocyte elastase inhibitor0.300.49
IPI00216256WDR1 Isoform 2 of WD repeat-containing protein 10.400.56
IPI00289334FLNB Isoform 1 of Filamin-B0.360.39
IPI00298860LTF Growth-inhibiting protein 120.560.41
IPI00337335MYH14 Isoform 1 of Myosin-140.410.57
IPI00426051IGHG2, Putative uncharacterized protein DKFZp686C152132.362.35
IPI00479186PKM2 Isoform M2 of Pyruvate kinase isozymes M1/M20.430.43
IPI00643920TKT Transketolase0.380.47
IPI00793199ANXA4 annexin IV0.410.58
Up regulated proteins in good responders (Dworak 3 + 4) nCRT I
IPI00000105MVP Major vault protein0.48n.r.
IPI00000874PRDX1 Peroxiredoxin-10.59n.r.
IPI00004657HLA-B major histocompatibility complex, class I, B0.45n.r.
IPI00007750TUBA4A Tubulin α-4A chain0.37n.r.
IPI00007752TUBB2C Tubulin beta-2C chain0.40n.r.
IPI00007797FABP5;FABP5L7 Fatty acid-binding protein, epidermal0.31n.r.
IPI00008274CAP1 Adenylyl cyclase-associated protein0.55n.r.
IPI00010133CORO1A Coronin-1A0.57n.r.
IPI00010154GDI1 Rab GDP dissociation inhibitor α0.53n.r.
IPI00011654TUBB Tubulin beta chain0.51n.r.
IPI00011937PRDX4 Peroxiredoxin-40.11n.r.
IPI00013683TUBB3 Tubulin beta-3 chain0.50n.r.
IPI00013881HNRPH1 Heterogeneous nuclear ribonucleoprotein H0.59n.r.
IPI00013890SFN Isoform 1 of 14-3-3 protein sigma0.44n.r.
IPI00024095ANXA3 Annexin A30.51n.r.
IPI00025252PDIA3 Protein disulfide-isomerase A3 precursor0.49n.r.
IPI00025874RPN1 Dolichyl-diphosphooligosaccharide--protein glycosyltransferase 67 kDa subunit precursor0.50n.r.
IPI00027463S100A6 Protein S100-A60.49n.r.
IPI00028931DSG2 Desmoglein-2 precursor0.49n.r.
IPI00031461GDI2 Rab GDP dissociation inhibitor beta0.56n.r.
IPI00169383PGK1 Phosphoglycerate kinase 10.42n.r.
IPI00171903HNRPM Isoform 1 of Heterogeneous nuclear ribonucleoprotein M0.65n.r.
IPI00180675TUBA1A Tubulin α-1A chain0.31n.r.
IPI00216049HNRPK Isoform 1 of Heterogeneous nuclear ribonucleoprotein K0.50n.r.
IPI00218782CAPZB Capping protein0.64n.r.
IPI00218852VIL1 Villin-10.50n.r.
IPI00219153RPL22 60S ribosomal protein L220.53n.r.
IPI00220644PKM2 Isoform M1 of Pyruvate kinase isozymes M1/M20.53n.r.
IPI00220739PGRMC1 Membrane-associated progesterone receptor component 10.56n.r.
IPI00297779CCT2 T-complex protein 1 subunit beta0.46n.r.
IPI00299000PA2G4 Proliferation-associated protein 2G40.46n.r.
IPI00401264TXNDC4 Thioredoxin domain-containing protein 4 precursor0.48n.r.
IPI00410693SERBP1 Isoform 1 of Plasminogen activator inhibitor 1 RNA-binding protein0.51n.r.
IPI00419585PPIA;PPIAL3;LOC654188 Peptidyl-prolyl cis-trans isomerase A0.59n.r.
IPI00419880RPS3A 40S ribosomal protein S3a0.39n.r.
IPI00465431LGALS3 Galectin-30.46n.r.
IPI00465439ALDOA Fructose-bisphosphate aldolase A0.47n.r.
IPI00472855HLA-A HLA class I histocompatibility antigen, A-30 α chain precursor0.45n.r.
Down regulated proteins in good responders (Dworak 3 + 4) nCRT I
IPI00010790BGN Biglycan precursor2.46n.r.
IPI00014516CALD1 Isoform 1 of Caldesmon3.16n.r.
IPI00020986LUM Lumican precursor2.22n.r.
IPI00021885FGA Isoform 1 of Fibrinogen α chain precursor4.12n.r.
IPI00021891FGG Isoform Gamma-B of Fibrinogen gamma chain precursor3.04n.r.
IPI00022391APCS Serum amyloid P-component precursor2.41n.r.
IPI00022395C9 Complement component C9 precursor1.74n.r.
IPI00022418FN1 Isoform 1 of Fibronectin precursor2.26n.r.
IPI00029717FGA Isoform 2 of Fibrinogen α chain precursor1.90n.r.
IPI00031008TNC Isoform 1 of Tenascin precursor1.89n.r.
IPI00168728IGHM FLJ00385 protein (Fragment)1.82n.r.
IPI00215983CA1 Carbonic anhydrase 11.79n.r.
IPI00216134TPM1 tropomyosin 1 α chain isoform 73.04n.r.
IPI00218695CALD1 Isoform 3 of Caldesmon2.55n.r.
IPI00219713FGG Isoform Gamma-A of Fibrinogen gamma chain precursor3.05n.r.
IPI00298497FGB Fibrinogen beta chain precursor2.64n.r.
IPI00399007IGHG2 Putative uncharacterized protein DKFZp686I04196 (Fragment)1.83n.r.
IPI00472961IGKC IGKC protein2.08n.r.
IPI00550640IGHG4 IGHG4 protein2.30n.r.
IPI00553153ATPIF1 Putative uncharacterized protein DKFZp564G04221.86n.r.
Up regulated proteins in good responders (Dworak 3 + 4) nCRT II
IPI00001539ACAA2 3-ketoacyl-CoA thiolase, mitochondrialn.r.0.48
IPI00003269Beta-actin-like protein 2_DKFZp686D0972 hypothetical protein LOC345651n.r.0.52
IPI00008603ACTA2 Actin, aortic smooth musclen.r.0.58
IPI00011107IDH2 Isocitrate dehydrogenase [NADP], mitochondrial precursorn.r.0.23
IPI00013508ACTN1 α-actinin-1n.r.0.52
IPI00019502MYH9 Myosin-9n.r.0.40
IPI00021428ACTA1 Actin, α skeletal musclen.r.0.19
IPI00021439ACTB Actin, cytoplasmic 1n.r.0.57
IPI00021440Actin, cytoplasmic 2n.r.0.45
IPI00023006ACTC1 Actin, α cardiac muscle 1n.r.0.29
IPI00024145VDAC2 Voltage-dependent anion-selective channel protein 2n.r.0.46
IPI00024870MYH11 smooth muscle myosin heavy chain 11 isoform SM2An.r.0.50
IPI00024919PRDX3 Thioredoxin-dependent peroxide reductase, mitochondrial precursorn.r.0.53
IPI00031522HADHA Trifunctional enzyme subunit α, mitochondrial precursorn.r.0.38
IPI00103467ALDH1B1 Aldehyde dehydrogenase X, mitochondrial precursorn.r.0.27
IPI00216308VDAC1 Voltage-dependent anion-selective channel proten.r.0.45
IPI00217975LMNB1 Lamin-B1n.r.0.47
IPI00291006MDH2 Malate dehydrogenase, mitochondrial precursorn.r.0.46
IPI00302592FLNA filamin A, α isoform 1n.r.0.22
IPI00418169ANXA2 annexin A2 isoform 1n.r.0.50
IPI00555733Actin-like protein (Fragment)n.r.0.61
Down regulated proteins in good responders (Dworak 3 + 4) nCRT II
IPI00002535FKBP2 FK506-binding protein 2 precursor_Peptidyl-prolyl cis-trans isomerase FKBP2n.r.1.70
IPI00014263EIF4H;LOC653994 Isoform Long of Eukaryotic translation initiation factor 4Hn.r.1.85
IPI00021841APOA1 Apolipoprotein A-I precursorn.r.1.78
IPI00032313S100A4 Protein S100-A4n.r.0.23
IPI00102821MGC29506 hypothetical protein LOC51237n.r.2.58
IPI00217468HIST1H1B Histone H1.5n.r.2.16
IPI00304612RPL13A 60S ribosomal protein L13an.r.1.83
IPI00412714SERBP1 Isoform 4 of Plasminogen activator inhibitor 1 RNA-binding proteinn.r.1.68.
IPI00470498SERBP1 Isoform 3 of Plasminogen activator inhibitor 1 RNA-binding proteinn.r.1.71
IPI00479997STMN1 Stathminn.r.1.65
Reciprocal regulated proteins in nCRT I and II
IPI00000230TPM1 tropomyosin 1 α chain isoform 22.580.47
IPI00003881HNRPF Heterogeneous nuclear ribonucleoprotein F0.312.26
IPI00003949UBE2N Ubiquitin-conjugating enzyme E2 N0.521.51
IPI00004573PIGR Polymeric immunoglobulin receptor precursor0.561.78
IPI00008176SHROOM4 Isoform 1 of Protein Shroom42.260.53
IPI00022792MFAP4 Microfibril-associated glycoprotein 4 precursor4.810.09
IPI00096066SUCLG2 Succinyl-CoA ligase (GDP-forming) beta-chain, mitochondrial precursor2.130.46
IPI00010779TPM4 Isoform 1 of Tropomyosin α-4 chain2.440.30
IPI00016801GLUD1 Glutamate dehydrogenase 1, mitochondrial precursor1.180.50
IPI00018853TPM1 Tropomyosin isoform1.870.54
IPI00020501MYH11 Myosin-113.090.43
IPI00218820TPM2 Isoform 3 of Tropomyosin beta chain2.090.52
IPI00218693APRT Adenine phosphoribosyltransferase0.532.02
IPI00219757GSTP1 Glutathione S-transferase P0431.85
IPI00025512HSPB1 Heat shock protein beta-11.550.41
IPI00027350PRDX2 Peroxiredoxin-22.180.49
IPI00183968TPM3 tropomyosin 3 isoform 12.000.30
IPI00216135TPM1 Isoform 3 of Tropomyosin α-1 chain2.280.51
IPI00216138TAGLN Transgelin4.030.28
IPI00218319TPM3 Isoform 2 of Tropomyosin α-3 chain2.440.56
IPI00218343TUBA1C Tubulin α-1C chain0.362.10
IPI00220362HSPE1 10 kDa heat shock protein, mitochondrial1.780.49
IPI00220709TPM2 Isoform 2 of Tropomyosin beta chain2.520.51
IPI00299547LCN2 Neutrophil gelatinase-associated lipocalin precursor0.461.90
IPI00333771CALD1 Isoform 5 of Caldesmon3.160.55
IPI00335168MYL6 Isoform Non-muscle of Myosin light polypeptide 62.180.49
IPI00382606F7 Factor VII active site mutant immunoconjugate2.550.53
IPI00549291IGHM IGHM protein2.290.24
IPI00604537TPM1 tropomyosin 1 α chain isoform 32.550.47
IPI00736885LOC440786 Ig kappa chain V-II region TEW3.380.34
IPI00743194Kappa light chain variable region (Fragment)3.380.34
IPI00746963IGKC IGKC protein2.030.43
IPI00815926IGHG1 IGHG1 protein2.160.47
IPI00843757TPM2 Uncharacterized protein TPM2 (Fragment)1.960.19
IPI00876888IGHV4-31 immunoglobulin heavy variable 4-31- cDNA FLJ783872.370.20

2.3. Immunohistochemistry
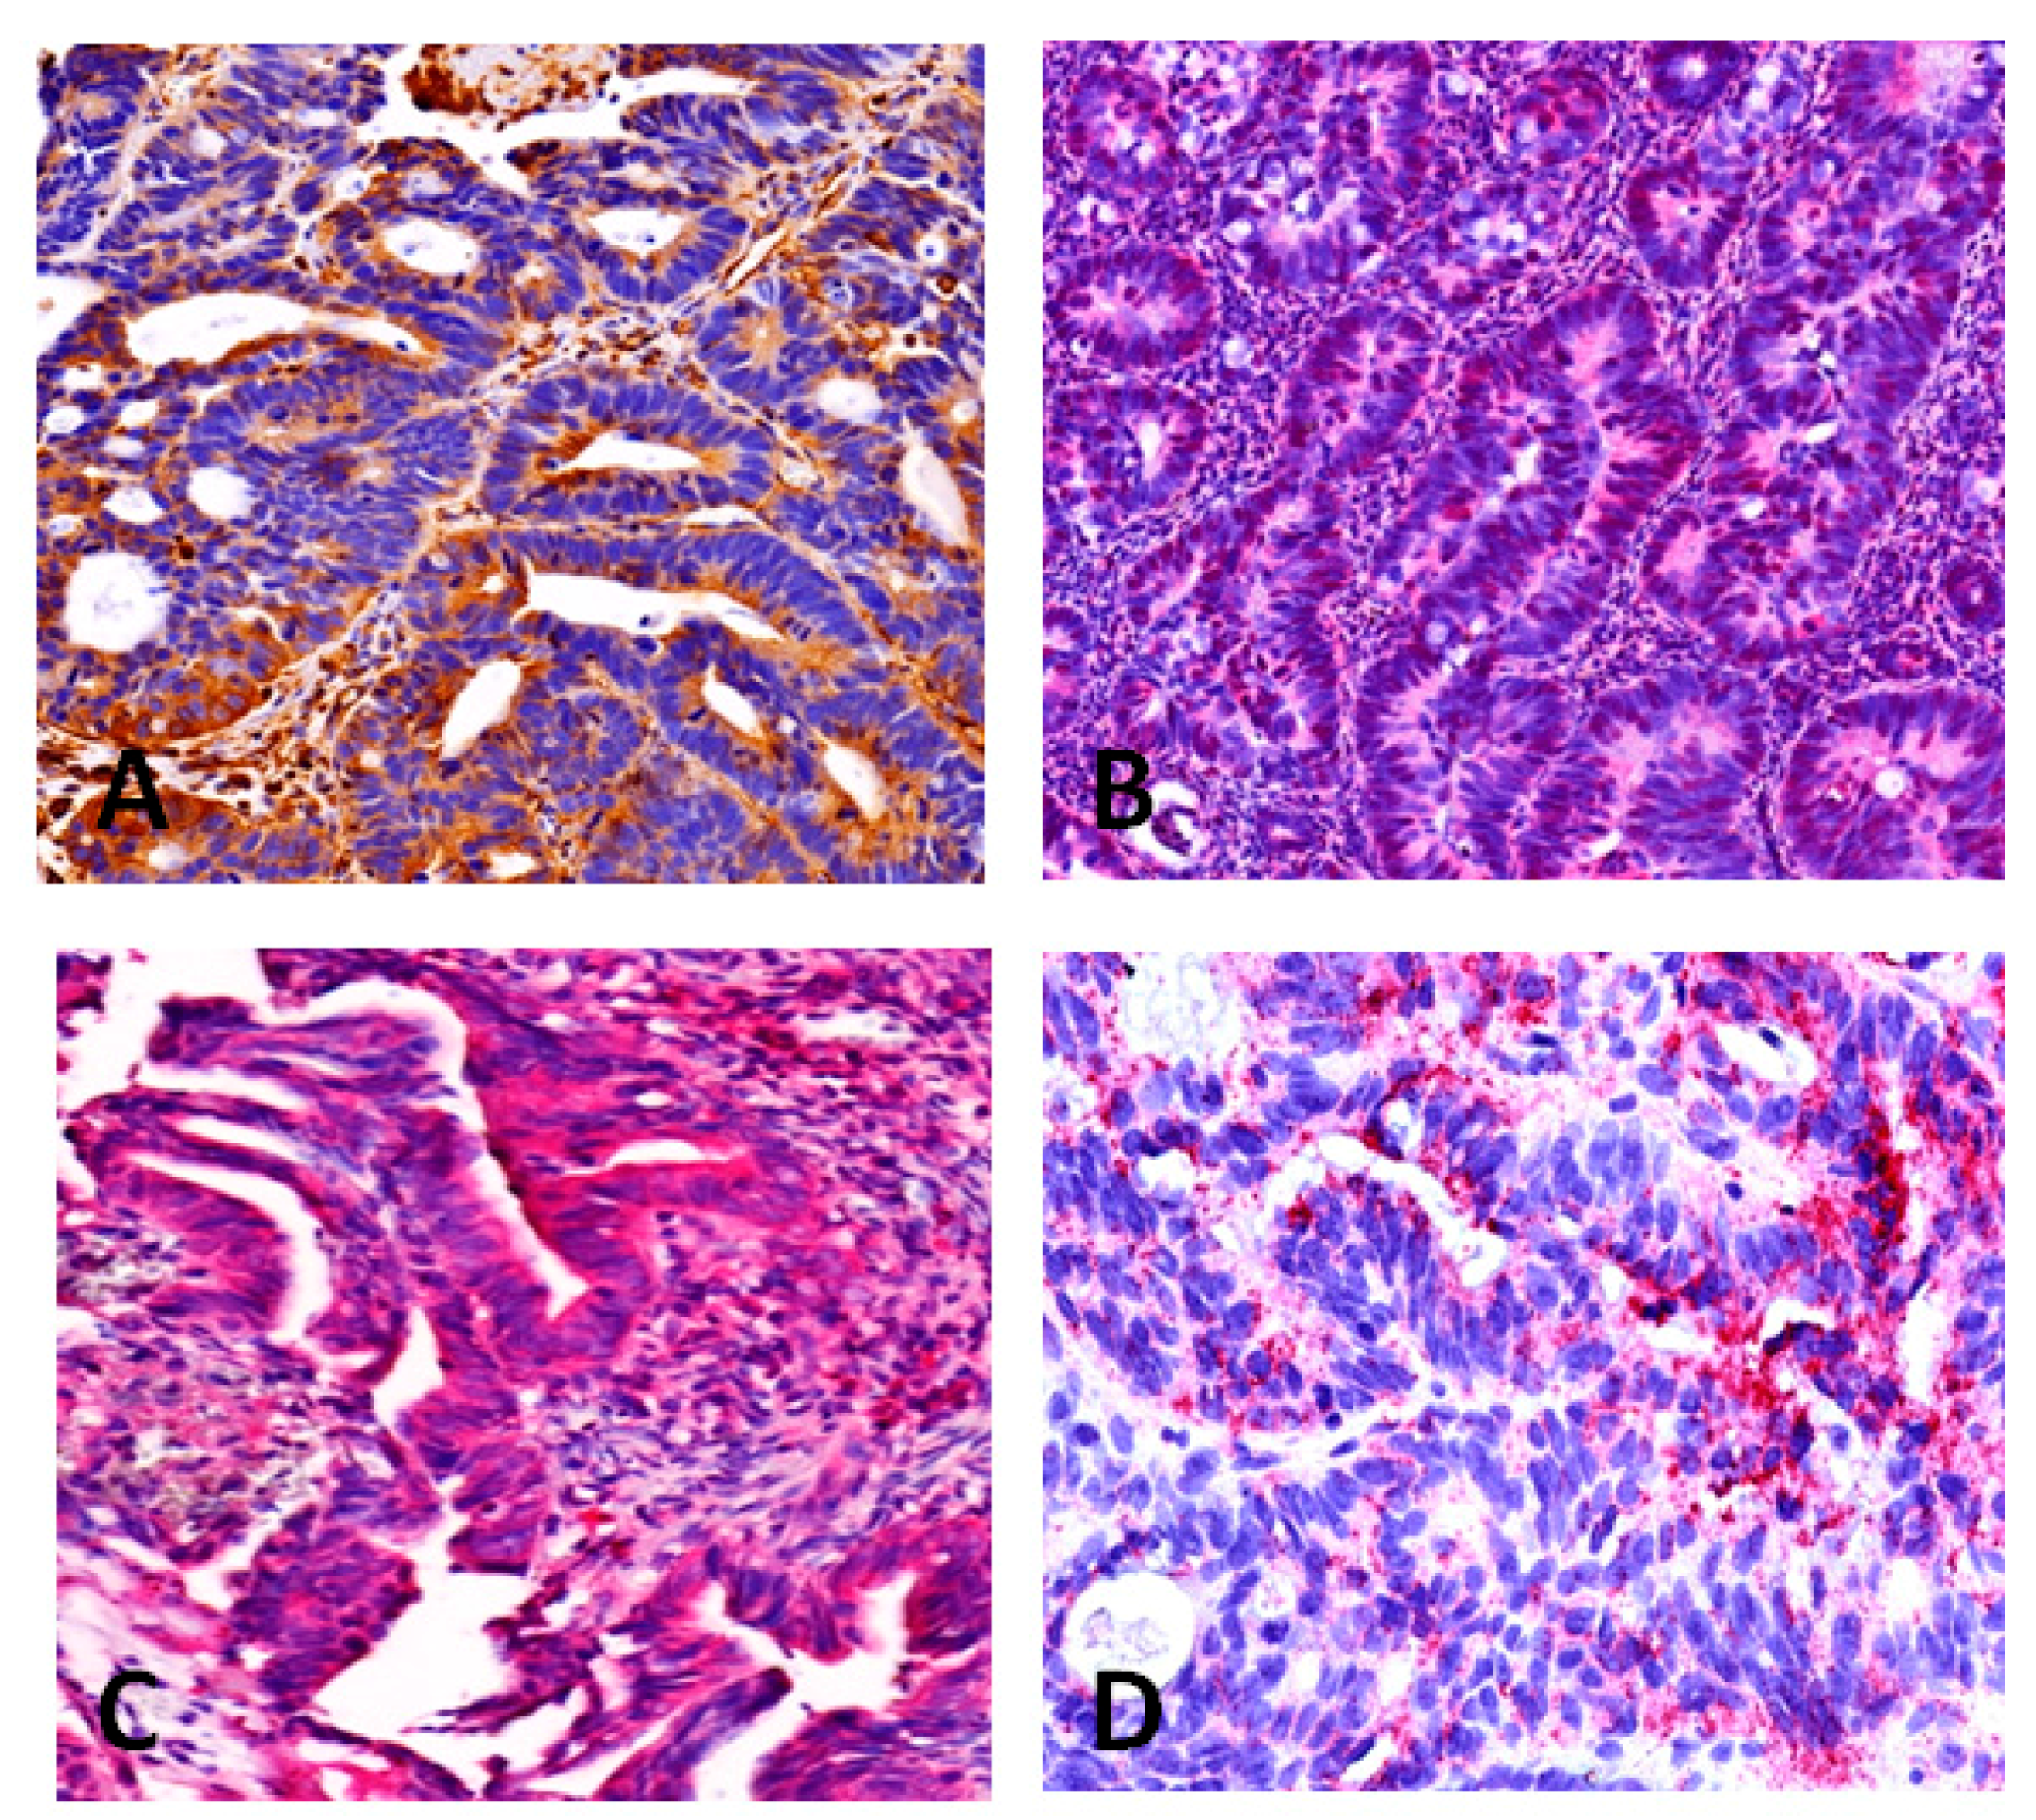
The validation of protein expression from the randomly selected markers: Plectin-1 (PLEC1), Transketolase (TKT), HADHA Trifunctional enzyme subunit α, mitochondrial precursor and Transgelin (TAGLN) by immunohistochemistry was successful in all cases. The proteins showed clear expression within the tumor cells either in the nucleus or cytoplasm (Figure 1).
Figure 1. Immunohistochemical validation of protein expression in colorectal carcinoma biopsy tissue identified by isotope coded protein label (ICPL); (A) Plectin-1; (B) Transketolase; (C) Transgelin; (D) HADHA Trifunctional enzyme subunit α, mitochondrial precursor.
Ijms 17 00209 g001

3. Discussion

We identified a panel of predictive markers for nCRT response in rectal carcinomas with ICPL. ICPL was recently described as powerful tool to identify thousands of proteins in extracts of body fluids or tissue. The technique is characterized by a highly accurate and reproducible quantification method for proteins [10,11]. ICPL is especially useful to identify regulated proteins in different samples. It is an innovative technology, which showed its value for marker screening in human tissue samples in our study. It was possible to validate randomly selected proteins by immunohistochemistry of tumor biopsies. This is a further indicator for the reliability of the identified proteins. One crucial point is the amount of tissue needed for proteome analysis. We harvested one tumor biopsy for proteomics which is generally also needed for histological diagnosis under clinical routine conditions. No patient suffered from any complication during sample harvesting. From our biopsies sufficient material was accumulated after LCM to perform ICPL. Thus ICPL not only provides reliable results but is also a valuable tool for proteome studies of human specimens which are harvested under clinical routine conditions.
The patients who underwent nCRT were all included in a clinical trial (CAO/ARO/AIO-04) [12]. This is important because not only standardized tissue sampling and preparation but also standardized patient care and treatment increases the value of molecular predictive marker evaluation. In our cohort two different types of chemotherapy were added to radiation. It is not surprising that several proteins were regulated only in relation to nCRT I or II. These markers may reflect the response to the different chemotherapy regiments. However 14 markers were uniformly regulated in response to radiation. Chemotherapy regiments added to nCRT change more frequently than radiation itself. Therefore these proteins and especially the very highly expressed ones, which indicate good radiation response, may be the most valuable for further validation in the future, because a highly expressed marker such as a stable protein can easily be identified e.g., by immunohistochemistry in a routinely sampled tumor biopsy under clinical conditions. PKM2, which was one of these markers, was recently described as highly expressed in colorectal cancer and correlated with later stage, lymph node metastases and oxaliplatin metabolism [13,14]. It is a cytosolic enzyme involved in nucleic acid, phospholipid- and amino acid synthesis, which provides critical cell building materials for highly proliferating cells, such as tumor cells. A high expression of Transketolase was already described in colorectal and urothelial cancer and was associated with poor prognosis. In breast cancer Transketolase was identified as a potential target against tumor growth [15]. It is involved in the non-oxidative part of the pentose phosphate pathway which is important during cell metabolism. A decrease in Transketolase expression levels in tumor cells was assumed to delay tumor growth. These findings are indicators that several of the markers identified in this study are related to cancer.
We classified our patients for good and poor nCRT response referring to the regression grading of Dworak [7,16]. This histological method is based on the stroma/tumor cell relation within the tumor after nCRT. It is a commonly used method to quantify tumor response after neoadjuvant treatment under clinical routine. Unfortunately it is of no value for identification of response to CRT prior to CRT application. Chemoradiation in rectal carcinoma is clinical routine as it is of clinical benefit in certain tumors stages: It is recommended in a neoadjuvant setting prior to surgery in stage UICC II and III rectal carcinomas. It decreases local recurrence rates and may increase anal sphincter preservation [1,2,4,6]. Its effect on survival, especially after good or complete response to nCRT, is currently unclear [1,2,4,6]. However, good or complete response to nCRT is seen in only about 60% of patients [9]. The rest of the patients show moderate or poor response to CRT. In these cases nCRT does not add any benefit to the patients, but increases perioperative risks and postoperative morbidity. Furthermore these patients are unnecessarily exposed to partially severe side effects of CRT [1]. Molecular markers may help to identify responders to nCRT. Tools such as these are urgently needed to predict the risk/benefit ratio for the patients during clinical routine.

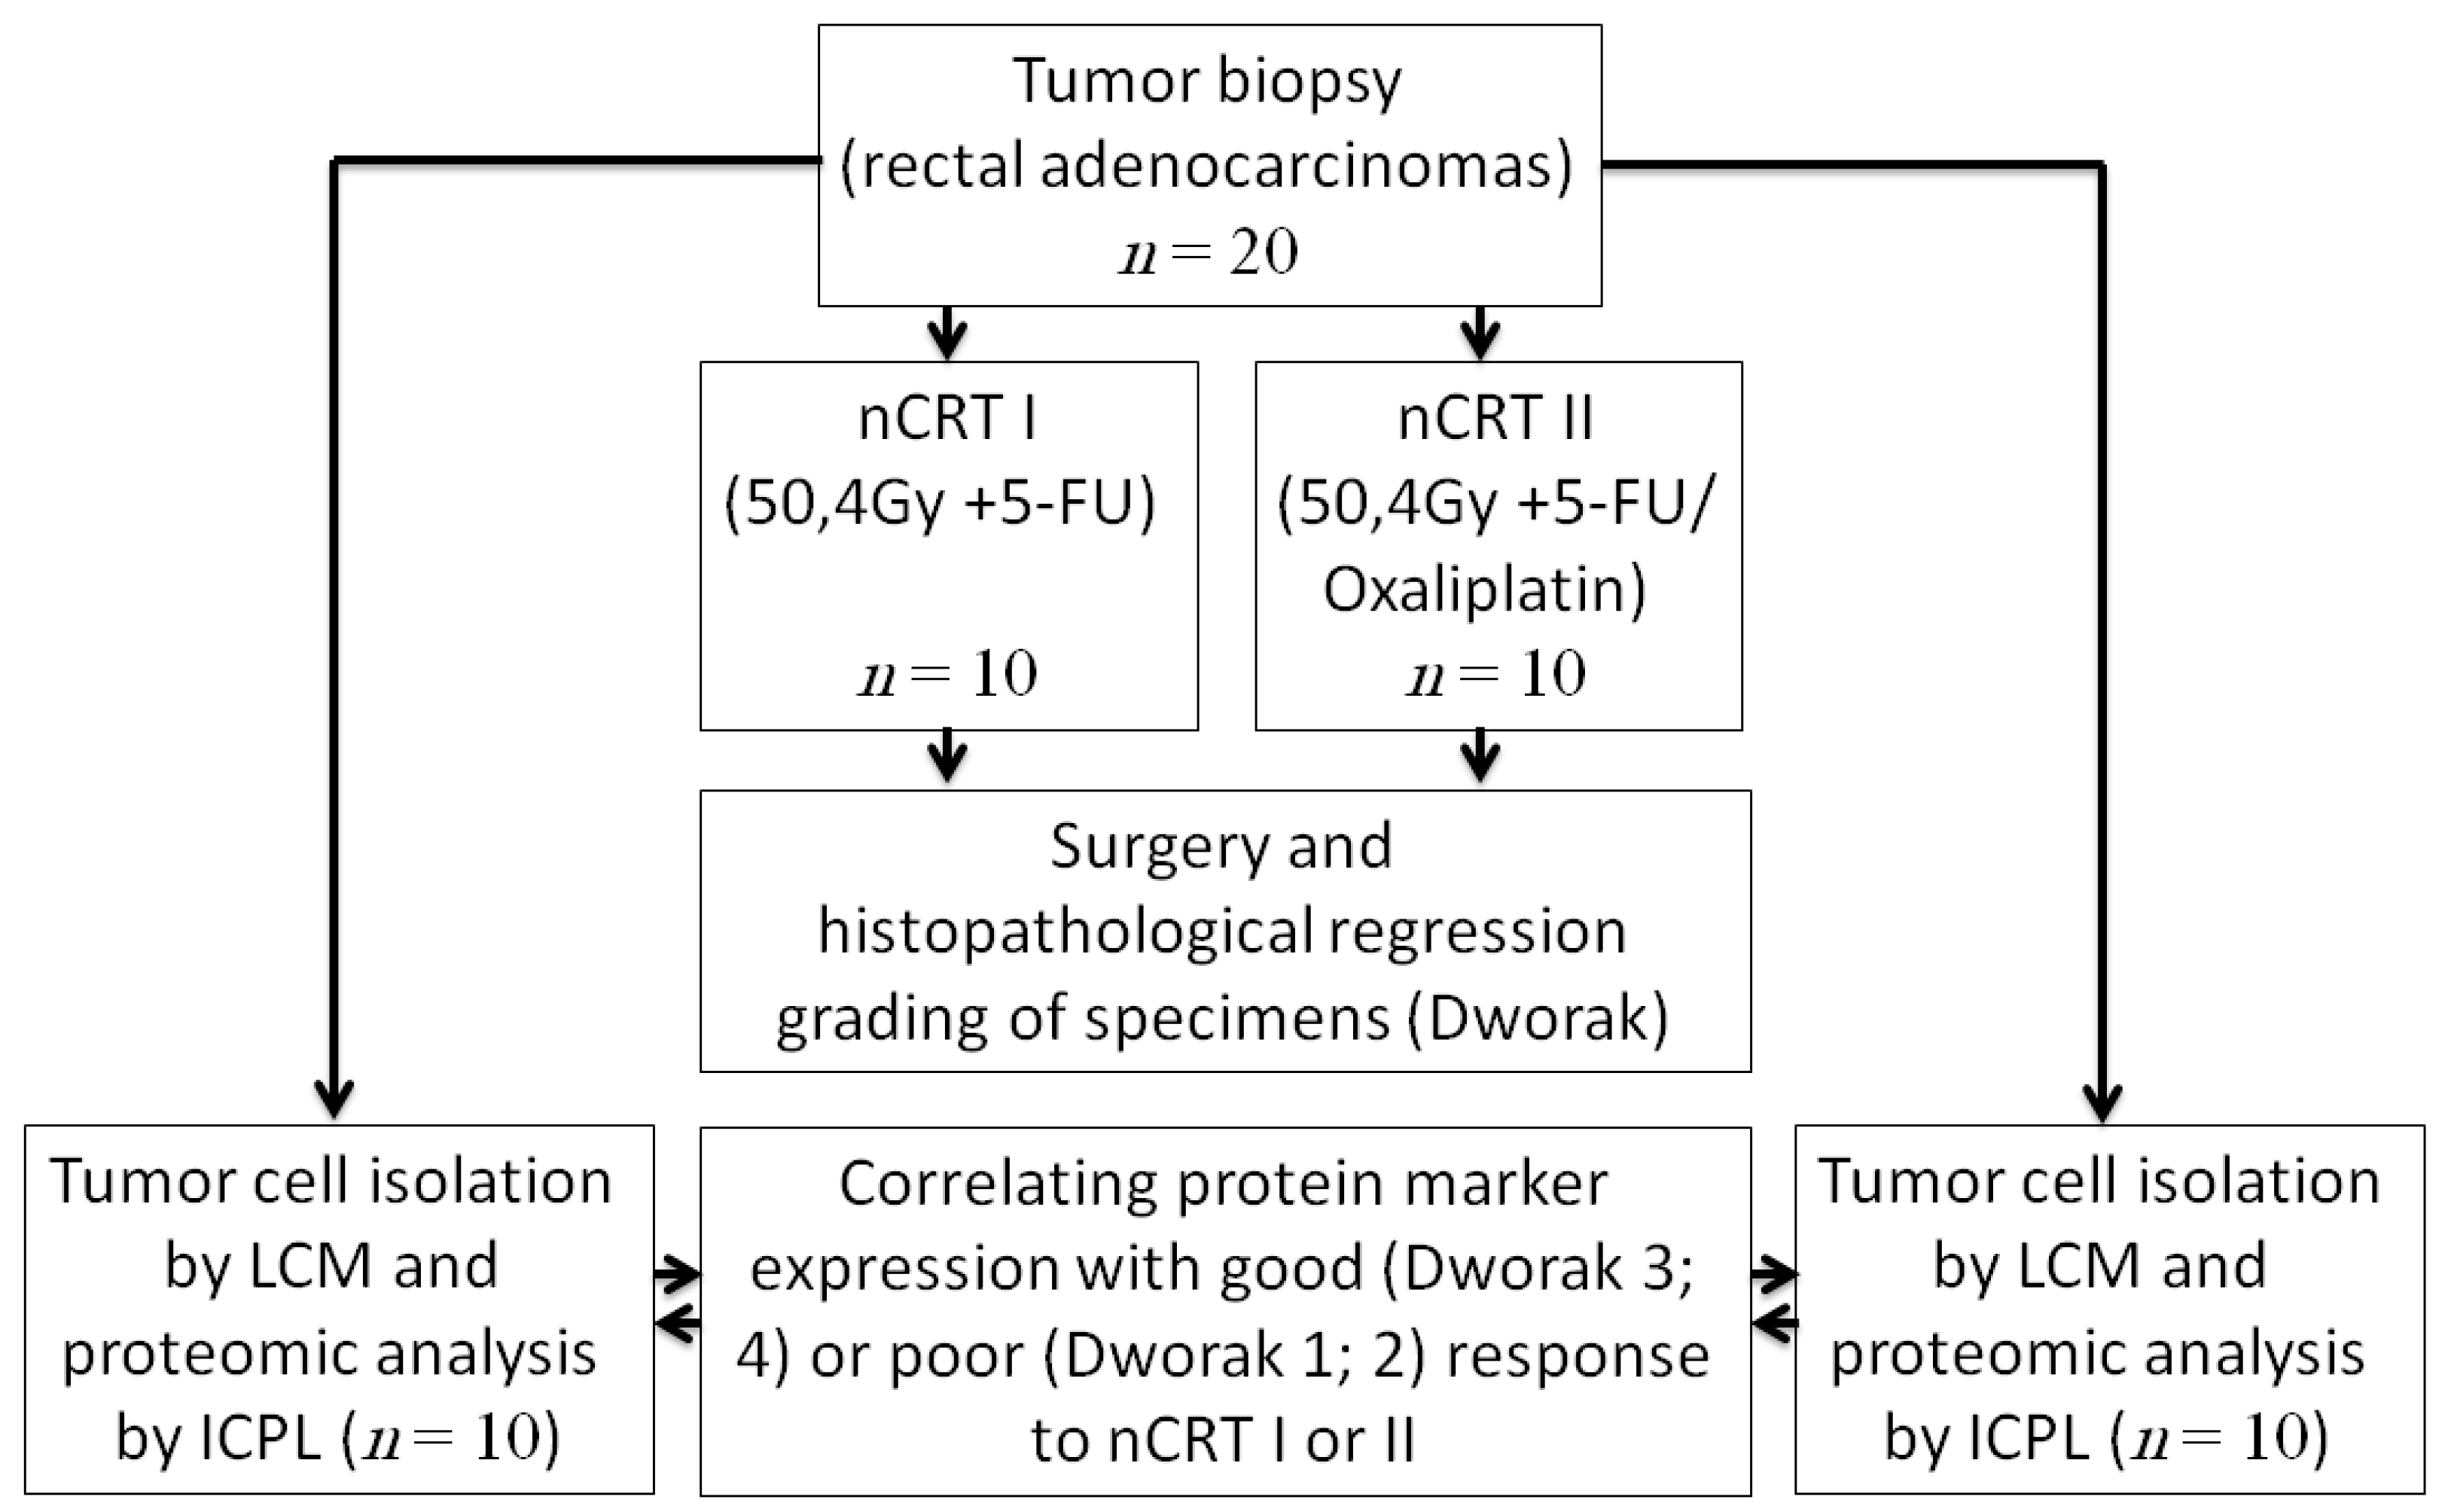
4. Material and Methods

4.1. Patients and Tumor Biopsies

The study was carried out after obtaining ethical approval by the ethical commission University of Erlangen (ID 3784). For the ICPL analysis, 20 patients with histopathology-proven rectal adenocarcinoma (stage UICC II–IV)—which were recruited for a standardized clinical study (CAO/ARO/AIO-04)—were selected after informed consent [12]. Patients with synchronous second colon carcinomas or younger than 18 years of age were excluded. Tumors with a distance of maximal 16 cm from the anal verge (measured by a rigid endoscopy) were classified as rectal carcinomas. Patients received a total dose of 50.4 Gy radiation, fractioned in 28 × 1.8 Gy single applications. During radiation they received either 5-Fluorouracil (5-FU: 1000 mg/m2/day; nCRT I) or 5-FU (250 mg/m2/day + Oxaliplatin 50 mg/m2/day; nCRT II) [12]. Patient characteristics are listed in Table 2.
Table 2. Patients and histopathological tumor characteristics of rectal adenocarcinomas which underwent laser capture microdissection and proteome analysis by isotope coded protein label (ICPL); nCRT I: 50.4 Gy + 5-FU; nCRT II: 50.4 Gy + 5-FU/Oxaliplatin.
PatientsnCRT InCRT II
n1010
Male97
Female23
ypT-category
yT013
yT100
yT231
yT356
yT410
ypN-category
yN047
yN153
yN210
Distant metastasis
M099
M111
Grading
G1/266
G3/432
GX12
Regression Grading (Dworak)
Dworak 120
Dworak 235
Dworak 342
Dworak 413
Tumor biopsies of all patients were performed prior to nCRT by rigid rectoscopy. The samples used for ICPL were immediately harvested in liquid nitrogen and stored by −80 °C until further processing. Samples used for immunohistochemistry examination underwent a formalin fixation and paraffin embedding procedure (FFPE). Standardized surgery such as total mesorectal excision (TME) was performed in all cases.

4.2. Study Protocol

Endoscopic tumor biopsies were obtained from patients with histopathologically confirmed rectal adenocarcinoma prior to nCRT. Six weeks after completion of nCRT, respective surgery was performed and the tumor response to nCRT was classified according to Dworak’s histopathological regression grading. Tumors were separated into two groups regarding the Dworak’s regression grading: Dworak 1 + 2: (poor response), Dworak 3 + 4 (good response) [7,16]. Differences in the tumors’ protein expression were identified by ICPL in the biopsies obtained prior to nCRT, comparing poor (n = 10) vs. good (n = 10) responders (Figure 2).
Figure 2. Study protocol; tumors underwent biopsy prior to neoadjuvant chemoradiation (nCRT); nCRT I: 50.4 Gy + 5-FU; nCRT II: 50.4 Gy + 5-FU/Oxaliplatin; tumor cells were isolated by laser capture microdissection (LCM) from the biopsies and proteomic analysis were performed by isotope coded protein label (ICPL). After nCRT and surgery histopathological tumor regression grading was scored (Dworak) and protein marker expression of the tumor biopsies was correlated with specimens’ response to nCRT.
Ijms 17 00209 g002

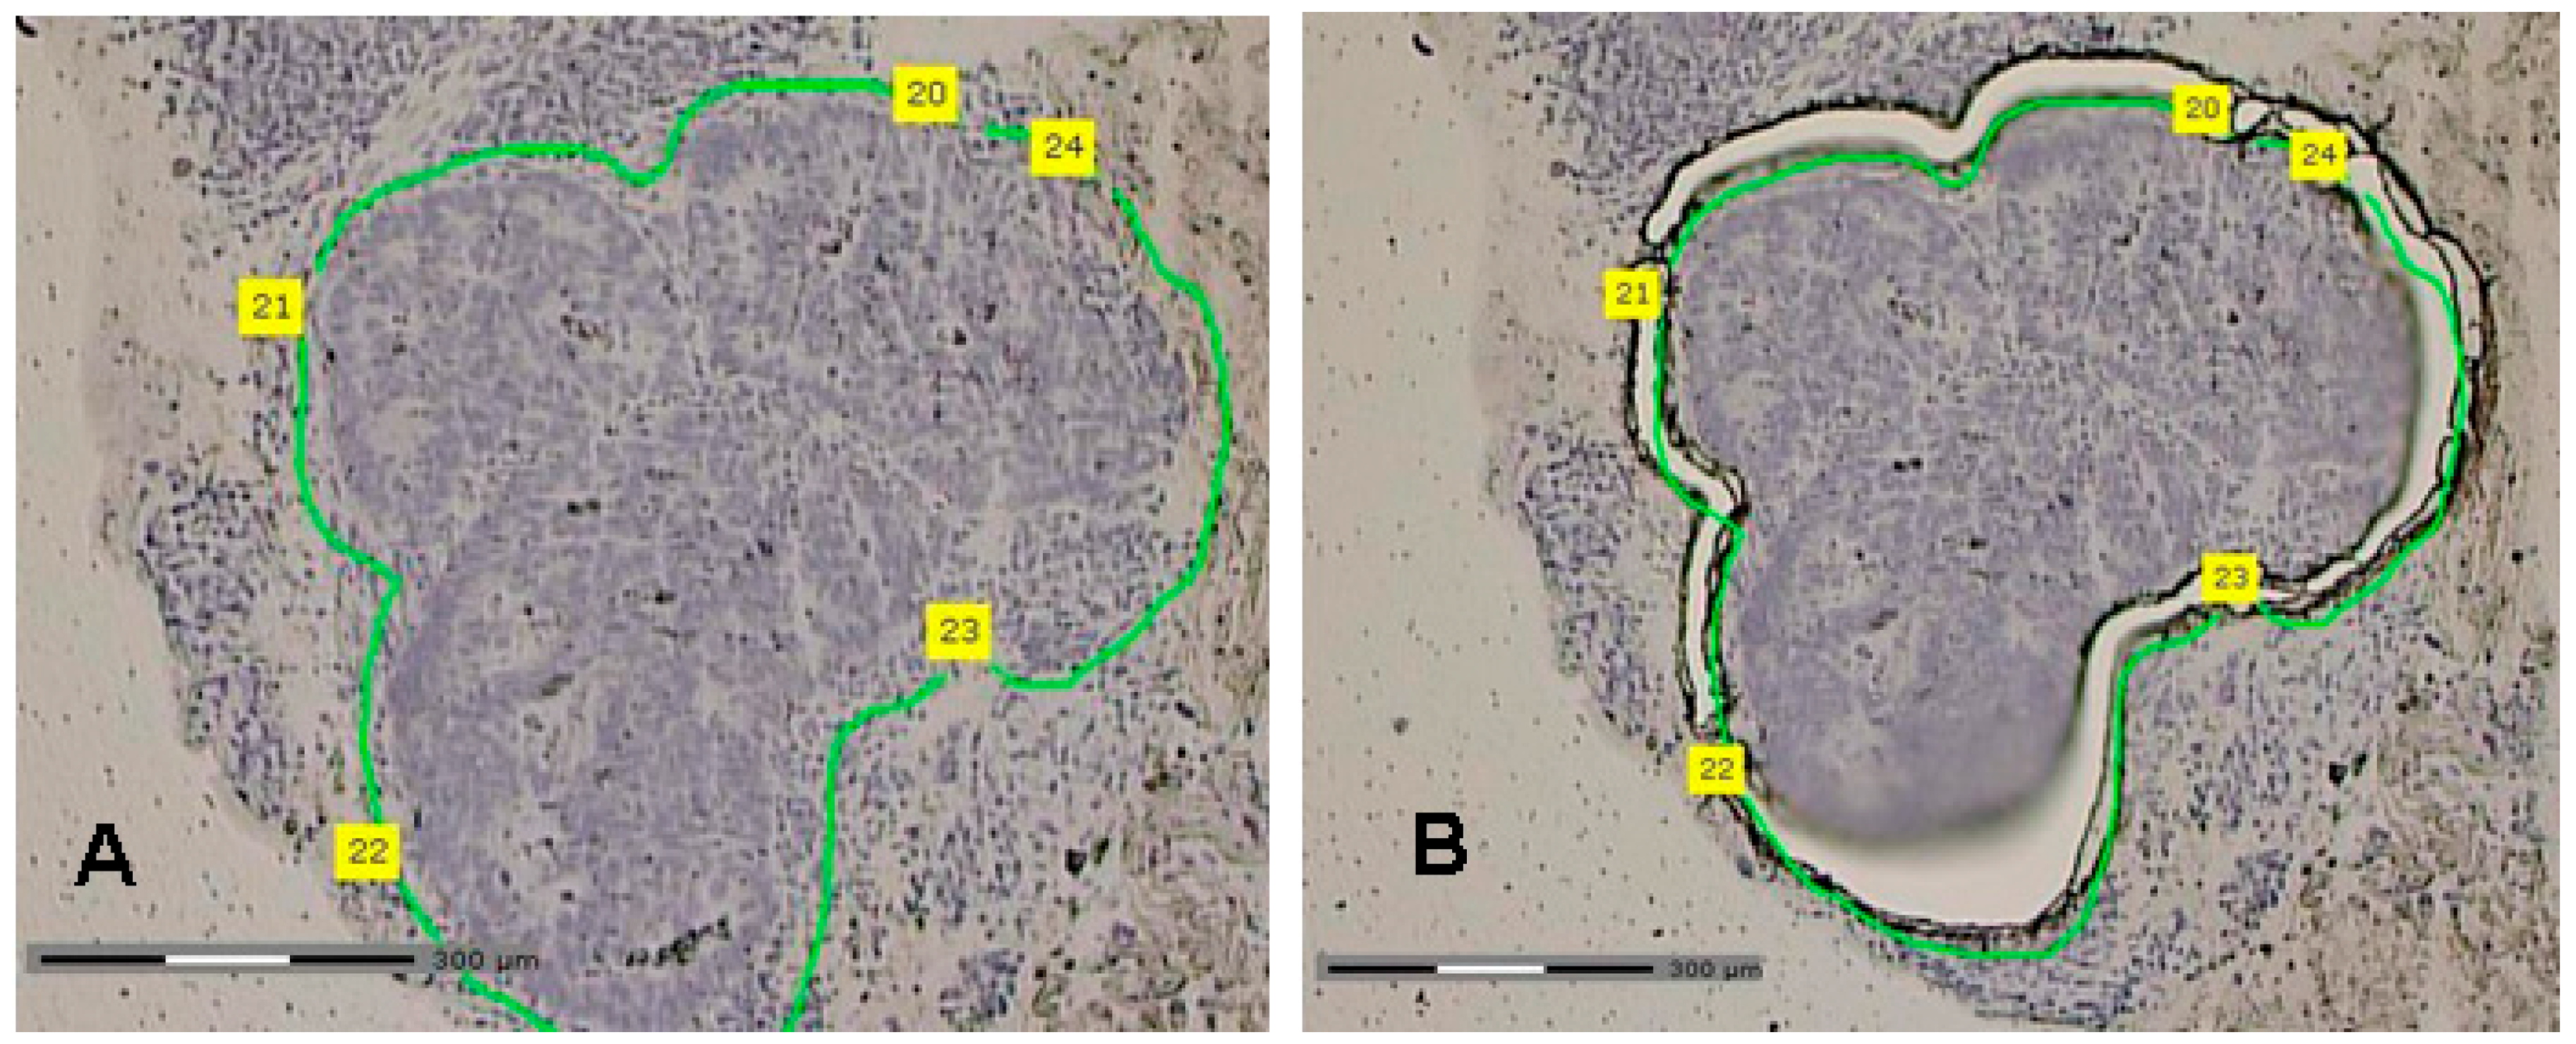
4.3. Laser Capture Microdissection (LCM)

For proteome analysis with ICPL tumor cells were isolated from the biopsies using laser capture microdissection (LCM), according to published protocol [17] (Figure 3). In brief, frozen tissue of each patient was imbedded in OCT tissue freezing medium, cut into 8–10 µm thick sections using Leica Cryostat Jung CM 3000 (Leica Microsystems Vertrieb GmbH, Wetzlar, Germany) at −20 °C, and mounted onto a PET-membrane with 1.0 mm thickness (Carl Zeiss MicroImaging GmbH, Göttingen, Germany). The sectioned tissues were stored for further preparation at −25 °C. For tissue staining, the cresyl violet protocol, Carl Zeiss (Carl Zeiss MicroImaging GmbH, Göttingen, Germany) with minor modification was used. In brief, the sectioned tissues were dried with cold 70% ethanol for 2 min, stained for 30 s in cresyl violet solution containing 1% (w/v) cresyl violet acetate and 50% ethanol, and rinsed with 70% ethanol followed by 100% ethanol. The stained tissues were air-dried for 2 min and LCM was then performed using PALM MicroBeam MB IV (Carl Zeiss MicroImaging GmbH, Göttingen, Germany) with approximately 100 mm2 total area cut per tissue sample, which corresponds to a protein amount of at least 20 µg. Proteins were solubilized out of microdissected tissue for 30 min with 30 µL guanidine/HEPES pH 8.5, centrifuged at 10,000× g at 4 °C for 15 min and sonicated 5 times for 10 s. The protein samples were pooled, due to material limitations of biopsies. The pooling was performed in accordance with the histopathological response grading of the specimens to nCRT (Dworak 1 + 2 or Dworak 3 + 4) [7].
Figure 3. Laser capture micodissection of tumor biopsies. (A) The tumor tissue is circled by a green line; (B) the laser dissects the tumor tissue which will be picked up and separated for proteomic analysis. Scale bar = 300 µm, numbers are starting points for the laser.
Ijms 17 00209 g003

4.4. Isotope Coded Protein Labeling (ICPL)

Before ICPL-labeling, acetone precipitation of solubilized and pooled proteins from microdissected (LCM) tissue was performed [10,11]. To one volume of each sample 5 volumes of 100% acetone cooled to −20 °C were added and incubated overnight at −20 °C. Precipitated proteins were pelleted by centrifugation 30 min at 20,000× g at 4 °C. Pellets were washed twice with cold 80% (v/v) acetone by centrifugation for 5 min at 20,000× g at 4 °C. The protein concentration was determined by a Bradford assay (BioRad Laboratories GmbH, Munich, Germany) before and after acetone precipitation, the last of which was used to adjust sample concentration at 5 µg/µL in ICPL-lysis buffer (40 µL) containing 6 M guanidine-HCL and 0.1 M HEPES pH 8.5. For ICPL-labeling, cysteines were reduced by adding of 1 µL of 2 M TCEP in 0.1 M HEPES pH 8.5 into each of the 4 samples and overfilled with argon. After vortexing for 30 s and 1 min ultrasonic treatment, the samples were incubated for 30 min at 60 °C. For alkylation of cysteines 1 µL of 0.4 M IAA (Iodoacetamide) in 0.1 M HEPES pH8.5 was added into each of the 4 samples and incubated for 30 min at 25 °C. Alkylation was quenched by adding 0.5 M N-acetyl cysteine solution in 0.1 M HEPES pH 8.5 followed by incubation for 15 min at 25 °C. For the differential labeling, four ICPL-reagents, ICPL0, ICPL4, ICPL6 and ICPL10, were used as a quadruplex approach. Proteins were then labeled with one of the 4 ICPL reagents (6 µL of 0.15 M ICPL0, ICPL4, ICPL6 or ICPL10). The reaction was allowed to proceed for 2 h at 25 °C under a nitrogen atmosphere to minimize methionine oxidation. Labeling was quenched by addition of hydroxylamine (1.5 M, pH 8.3), and all four samples were combined and stored by −20 °C. From each of the two separately prepared technical replicates, the sample amount was divided for the OFFGEL-fractionation (95%; 150 µg) and for non-fractionation (5%; 10 µg). For OFFGEL-fractionation , ICPL-labeled and combined proteins (150 µg) were fractionated by isoelectric point (pI) using an Agilent 3100 OFFGEL fractionator (Agilent Technologies, Oberhaching, Germany) according to the manufacturer’s instructions The samples from the first technical replicate (24 OFFGEL-fractions and non-fractionated sample) were analyzed after in-solution digestion with the enzymes Glu-C und Trypsin [17] by the Core Facility (Max-Planck Institute for Biochemistry, Martinsried, Germany) with the LTQ-hybrid mass spectrometer (Thermo Fischer Scientific, Bremen, Germany). Nano-LC-MS/MS was performed on an LTQ-Orbitrap mass spectrometer (Thermo Fisher Scientific, Schwerte) coupled to a nanoHPLC Agilent 1200 system (Agilent Technologies Deutschland GmbH, Böblingen, Germany). Briefly, peptides were preconcentrated on a reversed-phase (RP) trapping column (15 cm-fused silica column with 75 µm ID filled with ReproSil-Pur C18-AQ 3 µm resin (Dr. Maisch GmbH, Ammerbuch-Entringen, Germany) in 0.1% TFA (Trifluoroacetic) using a gradient from 2% to 40% in 0.5% acetic acid in ACN (Acetonitrile) at a flow rate of 250 nL/mL in 100 min.
MS (Mass Spectrometry) survey scans were acquired within the Orbitrap from 300 to 1800 m/z at a resolution of 60.000. The ten most intense signals were subjected to collision induced dissociation (CID) in the ion trap. The samples from the second technical replicates (24 OFFGEL-fractions and non-fractionated sample) were also analyzed after in-solution digestion with the enzymes Glu-C und Trypsin [18] by the group of A. Sickmann (Leibniz–Institut für Analytische Wissenschaften-ISAS-e.V., Dortmund, Germany) with the LTQ-Orbitrap Velos (Thermo Fisher Scientific, Bremen, Germany). Nano-LC-MS/MS was performed on an LTQ-Orbitrap Velos mass spectrometer (Thermo Fisher Scientific, Bremen, Germany) coupled to an Ultimate 3000 Rapid Separation Liquid Chromatography (RSLC) system (Dionex, Germering, Germany). Briefly, peptides were preconcentrated on a reversed-phase (RP) trapping column (Acclaim PepMap, 75 μm × 2 cm C18, 100 Å, Dionex) in 0.1% TFA followed by RP separation (Acclaim PepMap RSLC 75 μm × 15 cm, 2 μm, 100 Å, Dionex) using a binary gradient (solvent A: 0.1% FA, solvent B: 0.1% FA, 84% ACN) from 5% to 50% B at a flow rate of 300 nL/min in 90 min.
MS survey scans were acquired within the Orbitrap from 300 to 2000 m/z at a resolution of 60,000 using polysiloxane m/z 445.120030 as lock mass. The ten most intense signals were subjected to collision induced dissociation (CID) in the ion trap taking into account a dynamic exclusion of 12 s. CID spectra were acquired with a normalized CE (collision energy) of 35%, a default charge state of 2 and an activation time of 30 ms. AGC target values were set to 104 for ion trap MSn and 106 for Orbitrap MS scans.
Since only ICP-samples have been analyzed, these generated MS/MS spectra or MSn spectra were evaluated by the ICPL-ESIQuant software (Max-Planck Institut for Biochemistry, Martinsried, Germany).

4.5. Immunohistochemistry

Selection of markers for immunohistochemistry was performed randomly. Four proteins have been selected for immunohistochemical validation in rectal carcinoma biopsies which were sampled prior to nCRT and fixed in formalin and paraffin embedded. Tissue sections (4 µm) were dewaxed in xylene and rehydrated. For staining, antigene retrieval was performed for 20 min at 95 °C in citrate target retrieval solution pH 6.0 (DAKO, Hamburg, Germany) or tissue sections were digested with hyaluronidase from bovine testis (2 mg/mL in PBS, pH 5.5, Sigma Aldrich, Taufkirchen, Germany) and protease from Streptomyces griseus (1 mg/mL in PBS, pH 7.4, Sigma Aldrich) for 30 min each at 37 °C. Sections were incubated with antibodies raised against human anti-HADHA (ab54477, Abcam, Cambridge, UK), anti-SM22 α [1B8] (Transgelin) (ab28811, Abcam, Cambridge, UK), anti-Transketolase [7H1AA1] (ab112997, Abcam, Cambridge, UK) and anti-Plectin [E398P]; (ab32528, Abcam, Cambridge, UK). As a control, sections were incubated with the same concentration of non binding isotypic mouse immunoglobulins. Immunostaining was detected using the ZytoChem-Plus AP (Alkaline phosphatase) polymer kit (Zytomed Systems, Berlin, Germany) and liquid permanent red (DAKO) according to the manufacturers’ instruction. Slides were counterstained with gill-3 haematoxylin (Merck, Darmstadt, Germany), air-dried and mounted with VectaMount permanent mounting medium (Vector Laboratories, Burlingame, CA, USA) (Figure 1).

4.6. Statistics

Identification and quantification of the proteins were examined separately for the nCRT I and nCRT II group. Before quantification, the raw files were de-isotoped and deconvoluted by the extract function of the Trans Proteomic Pipeline software (TPP); Version 4.3 (Seattle Proteome Center, Washington, WA, USA) and transformed to an mzXML data format. Then quantification was performed using the ICPL-ESIQuant version 2.0 software [19]. Selected parameters were chosen as follows: mass accuracy 60 ppm, co-elution count: ≥2 and ICPL (label 0, monoisotopic mass = 105.02), ICPL:2H(4) (label 4, monoisotopic mass = 109.04), ICPL:13C(6) (label 6, monoisotopic mass = 111.04), and ICPL:13C(6)–2H(4) (label 10, monoisotopic mass = 115.06). For identification, proteins were searched against the IPI (International Protein Index) database using of MASCOT, Version 2.2 (Matrix Science, London, UK) with the following parameter settings: Homo sapiens as organism, carbamidomethylation (C) as a fixed modification, variable modification of oxidized methionine, all 4 variable Protein Nterm and ICPL(K) labels, trypsin digestion with one missed cleavage allowed, minimum Mascot protein score ≥60.0 and minimum Mascot peptide score ≥20.0. For the reliability of the reported database search results an automatic decoy database search was performed with the same selected parameters as described above.

4.7. Quantification and Identification of Potential Protein Signatures

The ICPL-ESIQuant software (Max-Planck Institut for Biochemistry, Martinsried, Germany) was used for the evaluation of the total 50 individual samples (2 × 24 OFFGEL-fractions and 2× non-fractionated samples). Proteins are considered to be quantified and identified, if at least two multiplets per protein and a unique peptide per protein were available. In case of a protein that was identified in neighboring OFFGEL-fractions, this protein was regarded as a single protein species. In case of a protein identified in several OFFGEL-fractions, but not in between two fractions, this protein was regarded as a separate protein species or isoform.
The identified proteins were classified as differentially expressed with a regulation value of 1.5 ≥ 1 ≥ 0.66, with at least two quadruplets per protein and a unique peptide per protein (CV ≤ 30%).

5. Conclusions

In summary we identified a panel of proteome markers which may act as response predictors for neoadjuvant CRT in rectal carcinomas in the future. The main limitation of our study is a limited patient cohort from which we derived our data. For this reason our results have to be considered as preliminary. In a next step these markers must be validated in an independent patient cohort prospectively to elucidate its value for clinical use.

Acknowledgments

This study was sponsored by the German Research Foundation (DFG 136/3-2), the ELAN-Fond of the University Erlangen-Nuremberg, the Federal Department of Education and Science, Germany (BMBF: Polyprobe-Study) and the Interdisciplinary Center for Clinical Research (IZKF) Erlangen (Project D20).

Author Contributions

Roland S. Croner: study design, data analysis, data interpretation, writing the manuscript; Müzeyyen Sevim: proteomic analysis, laser capture microdissection, data analysis, writing the manuscript; Metodi V. Metodiev: data analysis, technical support, proof reading the manuscript; Peter Jo, Michael Ghadimi, Vera Schellerer, Maximillian Brunner: tumor biopsy harvesting, proof reading the manuscript; Carol Geppert, Tilman Rau: immunohistochemistry, data interpretation; Michael Stürzl, Elisabeth Naschberger: data validation, proof reading the manuscript; Klaus E. Matzel, Werner Hohenberger: tumor sampling, data interpretation, proof reading the manuscript; Friedrich Lottspeich, Josef Kellermann: ICPL analysis, data analysis, proteomic analysis, proof reading the manuscript.

Conflicts of Interest

The authors declare no conflict of interest.

References

  1. Sauer, R.; Becker, H.; Hohenberger, W.; Rodel, C.; Wittekind, C.; Fietkau, R.; Martus, P.; Tschmelitsch, J.; Hager, E.; Hess, C.F.; et al. Preoperative versus postoperative chemoradiotherapy for rectal cancer. N. Engl. J. Med. 2004, 351, 1731–1740. [Google Scholar] [CrossRef] [PubMed]
  2. Sauer, R.; Fietkau, R.; Wittekind, C.; Martus, P.; Rodel, C.; Hohenberger, W.; Jatzko, G.; Sabitzer, H.; Karstens, J.H.; Becker, H.; et al. Adjuvant versus neoadjuvant radiochemotherapy for locally advanced rectal cancer. A progress report of a phase-III randomized trial (protocol CAO/ARO/AIO-94). Strahlenther. Onkol. 2001, 177, 173–181. [Google Scholar] [CrossRef] [PubMed]
  3. Sauer, R.; Fietkau, R.; Wittekind, C.; Rodel, C.; Martus, P.; Hohenberger, W.; Tschmelitsch, J.; Sabitzer, H.; Karstens, J.H.; Becker, H.; et al. Adjuvant vs. neoadjuvant radiochemotherapy for locally advanced rectal cancer: The German trial CAO/ARO/AIO-94. Colorectal Dis. 2003, 5, 406–415. [Google Scholar] [CrossRef] [PubMed]
  4. Sauer, R.; Liersch, T.; Merkel, S.; Fietkau, R.; Hohenberger, W.; Hess, C.; Becker, H.; Raab, H.R.; Villanueva, M.T.; Witzigmann, H.; et al. Preoperative versus postoperative chemoradiotherapy for locally advanced rectal cancer: Results of the German CAO/ARO/AIO-94 randomized phase III trial after a median follow-up of 11 years. J. Clin. Oncol. 2012, 30, 1926–1933. [Google Scholar] [CrossRef] [PubMed]
  5. Schmiegel, W.; Pox, C.; Reinacher-Schick, A.; Adler, G.; Arnold, D.; Fleig, W.; Folsch, U.R.; Fruhmorgen, P.; Graeven, U.; Heinemann, V.; et al. S3 guidelines for colorectal carcinoma: Results of an evidence-based consensus conference on 6/7 February 2004 and 8/9 June 2007 (for the topics IV, VI and VII). Z. Gastroenterol. 2010, 48, 65–136. [Google Scholar] [CrossRef] [PubMed]
  6. Sauer, R.; Rodel, C. Adjuvant and neoadjuvant radiochemotherapy of rectal carcinoma. Praxis 2002, 91, 1476–1484. [Google Scholar] [CrossRef] [PubMed]
  7. Dworak, O.; Keilholz, L.; Hoffmann, A. Pathological features of rectal cancer after preoperative radiochemotherapy. Int. J. Colorectal Dis. 1997, 12, 19–23. [Google Scholar] [CrossRef] [PubMed]
  8. Hermanek, P.; Merkel, S.; Hohenberger, W. Prognosis of rectal carcinoma after multimodal treatment: ypTNM classification and tumor regression grading are essential. Anticancer Res. 2013, 33, 559–566. [Google Scholar] [PubMed]
  9. Rodel, C.; Grabenbauer, G.G.; Papadopoulos, T.; Bigalke, M.; Gunther, K.; Schick, C.; Peters, A.; Sauer, R.; Rodel, F. Apoptosis as a cellular predictor for histopathologic response to neoadjuvant radiochemotherapy in patients with rectal cancer. Int. J. Radiat. Oncol. Biol. Phys. 2002, 52, 294–303. [Google Scholar] [CrossRef]
  10. Kellermann, J. ICPL--isotope-coded protein label. Methods Mol. Biol. 2008, 424, 113–123. [Google Scholar] [PubMed]
  11. Lottspeich, F.; Kellermann, J. ICPL labeling strategies for proteome research. Methods Mol. Biol. 2011, 753, 55–64. [Google Scholar] [PubMed]
  12. Rodel, C.; Graeven, U.; Fietkau, R.; Hohenberger, W.; Hothorn, T.; Arnold, D.; Hofheinz, R.D.; Ghadimi, M.; Wolff, H.A.; Lang-Welzenbach, M.; et al. Oxaliplatin added to fluorouracil-based preoperative chemoradiotherapy and postoperative chemotherapy of locally advanced rectal cancer (the German CAO/ARO/AIO-04 study): Final results of the multicentre, open-label, randomised, phase 3 trial. Lancet Oncol. 2015, 16, 979–989. [Google Scholar] [CrossRef]
  13. Gines, A.; Bystrup, S.; Ruiz de Porras, V.; Guardia, C.; Musulen, E.; Martinez-Cardus, A.; Manzano, J.L.; Layos, L.; Abad, A.; Martinez-Balibrea, E. PKM2 subcellular localization is involved in oxaliplatin resistance acquisition in HT29 human colorectal cancer cell lines. PLoS ONE 2015, 10, e0123830. [Google Scholar] [CrossRef] [PubMed]
  14. Zhou, C.F.; Li, X.B.; Sun, H.; Zhang, B.; Han, Y.S.; Jiang, Y.; Zhuang, Q.L.; Fang, J.; Wu, G.H. Pyruvate kinase type M2 is upregulated in colorectal cancer and promotes proliferation and migration of colon cancer cells. IUBMB Life 2012, 64, 775–782. [Google Scholar] [CrossRef] [PubMed]
  15. Foldi, M.; Stickeler, E.; Bau, L.; Kretz, O.; Watermann, D.; Gitsch, G.; Kayser, G.; Zur Hausen, A.; Coy, J.F. Transketolase protein TKTL1 overexpression: A potential biomarker and therapeutic target in breast cancer. Oncol. Rep. 2007, 17, 841–845. [Google Scholar] [CrossRef] [PubMed]
  16. Dworak, O.; Knoch, M. Surgery versus radiotherapy for advanced rectal cancer. Lancet 1997, 349, 877; author reply 877–878. [Google Scholar] [CrossRef]
  17. Espina, V.; Milia, J.; Wu, G.; Cowherd, S.; Liotta, L.A. Laser capture microdissection. Methods Mol. Biol. 2006, 319, 213–229. [Google Scholar] [PubMed]
  18. Biringer, R.G.; Amato, H.; Harrington, M.G.; Fonteh, A.N.; Riggins, J.N.; Huhmer, A.F. Enhanced sequence coverage of proteins in human cerebrospinal fluid using multiple enzymatic digestion and linear ion trap LC-MS/MS. Brief. Funct. Genom. Proteom. 2006, 5, 144–153. [Google Scholar]
  19. Brunner, A.; Keidel, E.M.; Dosch, D.; Kellermann, J.; Lottspeich, F. ICPLQuant-A software for non-isobaric isotopic labeling proteomics. Proteomics 2010, 10, 315–326. [Google Scholar] [CrossRef] [PubMed]

