
Pulmonary Function and Incidence of Selected Respiratory Diseases Depending on the Exposure to Ambient PM10

 ,
,  and
and
Abstract
:1. Introduction
2. Results
- 4.23 in case of chronic bronchitis;
- 2.71 in case of asthma;
- 2.50 in case of pneumonia;
- 2.35 in case of other pulmonary diseases (including COPD);
- 2.33 in case of bronchitis.
- In case of chronic bronchitis: 4.37 in women and 3.85 in men;
- In case of asthma 4.64 in women and 1.57 in men;
- In case of pneumonia 2.50 in women and 2.48 in men;
- In case of other pulmonary diseases (including COPD) 4.05 in women and 1.50 in men;
- In case of bronchitis 2.65 in women and 1.81 in men.
3. Discussion
4. Materials and Methods
- nitrogen dioxide: chemoluminescence method (EN14211);
- carbon monoxide: NDIR gas filter correlation (EN14626);
- particulate matter PM10: nephelometry.
- information on the aim of the pulmonary function test and lack of its adverse effects on human health;
- subjective research (questionnaire);
- objective research (pulmonary function test), which included the measurement of forced vital capacity (FVC), forced expiratory volume during the first second of expiration (FEV1), forced expiratory flow at 50% of FVC (FEF50), peak expiratory flow (PEF) and the calculation of the pseudo-Tiffeneau factor (FEV1/FVC).
5. Conclusions
Acknowledgments
Author Contributions
Conflicts of Interest
References
- Chen, B.H.; Kan, H.D. Air pollution and population health: A global challenge. Environ. Health Prev. Med. 2008, 13, 94–101. [Google Scholar] [CrossRef] [PubMed]
- Kan, H.D.; London, S.J.; Chen, G.; Zhang, Y.; Song, G.; Zhao, N.; Jiang, L.; Chen, B. Differentiating the effects of fine and coarse particle on daily mortality in Shanghai, China. Environ. Res. 2007, 105, 380–389. [Google Scholar] [CrossRef] [PubMed]
- Dockery, D.W.; Pope, C.A., III; Xu, X.; Spengler, J.D.; Ware, J.H.; Fay, M.E.; Ferris, B.G., Jr.; Speizer, F.E. An association between air pollution and mortality in Six U.S. Cities. N. Engl. J. Med. 1993, 329, 1753–1759. [Google Scholar] [CrossRef] [PubMed]
- Kim, H.; Kim, Y.; Hong, Y.C. The lag-effect pattern in the relationship of particulate air pollution to daily mortality in Seoul; Korea. Int. J. Biometeorol. 2003, 48, 25–30. [Google Scholar] [CrossRef] [PubMed]
- Pope, C.A., III; Krewski, D.; Thun, M.J.; Calle, E.E.; Krewski, D.; Ito, K.; Thurston, G.D. Lung cancer; cardiopulmonary mortality; and long-term exposure to fine particulate air pollution. J. Am. Med. Assoc. 2002, 287, 1132–1141. [Google Scholar] [CrossRef]
- Schwartz, J. Short term fluctuations in air pollution and hospital admissions of the elderly for respiratory disease. Thorax 1995, 50, 531–538. [Google Scholar] [CrossRef] [PubMed]
- Schwartz, J. Air pollution and hospital admissions for heart disease in eight U.S. Counties. Epidemiology 1999, 10, 17–22. [Google Scholar] [CrossRef] [PubMed]
- Andreau, K.; Leroux, M.; Bouharrour, A. Health and cellular impacts of air pollutants: From cytoprotection to cytotoxicity. Biochem. Res. Int. 2012, 2012. [Google Scholar] [CrossRef] [PubMed]
- Huang, W.; Wang, G.; Lu, S.E.; Kipen, H.; Wang, Y.; Hu, M.; Lin, W.; Rich, D.; Ohman-Strickland, P.; Diehl, S.R.; et al. Inflammatory and oxidative stress responses of healthy young adults to changes in air quality during the Beijing Olympics. Am. J. Respir. Crit. Care Med. 2012, 186, 1150–1159. [Google Scholar] [CrossRef] [PubMed]
- Atkinson, R.W.; Anderson, H.R.; Sunyer, J.; Ayres, J.; Baccini, M.; Vonk, J.M.; Boumghar, A.; Forastiere, F.; Forsberg, B.; Touloumi, G.; et al. Acute effects of particulate air pollution on respiratory admissions results from APHEA 2 project. Am. J. Respir. Crit. Care Med. 2001, 164, 1860–1866. [Google Scholar] [CrossRef] [PubMed]
- Weinmayr, G.; Romeo, E.; de Sario, M.; Weiland, S.K.; Forastiere, F. Short-term effects of PM10 and NO2 on respiratory health among children with asthma or asthma-like symptoms: A systematic review and meta-analysis. Environ. Health Perspect. 2010, 118, 449–457. [Google Scholar] [CrossRef] [PubMed]
- Zanobetti, A.; Schwartz, J.; Dockery, D.W. Airborne particles are a risk factor for hospital admissions for heart and lung disease. Environ. Health Perspect. 2000, 108, 1071–1077. [Google Scholar] [CrossRef] [PubMed]
- Schikowski, T.; Sugiri, D.; Ranft, U.; Gehring, U.; Heinrich, J.; Wichmann, H.E.; Krämer, U. Long-term air pollution exposure and living close to busy roads are associated with COPD in women. Respir. Res. 2005, 6. [Google Scholar] [CrossRef] [PubMed]
- Perez, L.; Declercq, C.; Iñiguez, C.; Aguilera, I.; Badaloni, C.; Ballester, F.; Bouland, C.; Chanel, O.; Cirarda, F.B.; Forastiere, F.; et al. Chronic burden of near-roadway traffic pollution in 10 European cities (APHEKOM network). Eur. Respir. J. 2013, 42, 594–605. [Google Scholar] [CrossRef] [PubMed]
- Schindler, C.; Keidel, D.; Gerbase, M.W.; Zemp, E.; Bettschart, R.; Brändli, O.; Brutsche, M.H.; Burdet, L.; Karrer, W.; Knöpfli, B.; et al. Improvements in PM10 exposure and reduced rates of respiratory symptoms in a cohort of Swiss adults (SAPALDIA). Am. J. Respir. Crit. Care Med. 2009, 179, 579–587. [Google Scholar] [CrossRef] [PubMed]
- Avol, E.L.; Gauderman, W.J.; Tan, S.M.; London, S.J.; Peters, J.M. Respiratory effects of relocating to areas of differing air pollution levels. Am. J. Respir. Crit. Care Med. 2001, 164, 2067–2072. [Google Scholar] [CrossRef] [PubMed]
- Puett, R.C.; Hart, J.E.; Yanosky, J.D.; Spiegelman, D.; Wang, M.; Fisher, J.A.; Hong, B.; Laden, F. Particulate matter air pollution exposure; distance to road; and incident lung cancer in the Nurses’ Health Study Cohort. Environ. Health Perspect. 2014, 122, 926–932. [Google Scholar] [CrossRef] [PubMed]
- Badyda, A.; Dąbrowiecki, P.; Czechowski, P.O.; Majewski, G.; Doboszyńska, A. Traffic-related air pollution and respiratory tract efficiency. Adv. Exp. Med. Biol. 2015, 3, 31–38. [Google Scholar]
- Badyda, A.; Dąbrowiecki, P.; Czechowski, P.O.; Majewski, G. Risk of bronchi obstruction among non-smokers—Review of environmental factors affecting bronchoconstriction. Respir. Physiol. Neurobiol. 2014, 209, 39–46. [Google Scholar] [CrossRef] [PubMed]
- Hoek, G.; Pattenden, S.; Willers, S.; Antova, T.; Fabianova, E.; Braun-Fahrländer, C.; Forastiere, F.; Gehring, U.; Luttmann-Gibson, H.; Grize, L.; et al. PM10, and children’s respiratory symptoms and lung function in the PATY study. Eur. Respir. J. 2012, 40, 538–547. [Google Scholar] [CrossRef] [PubMed]
- Medina-Ramon, M.; Zanobetti, A.; Schwartz, J. The effect of ozone and PM10 on hospital admissions for pneumonia and chronic obstructive pulmonary disease: A national multicity study. Am. J. Epidemiol. 2006, 163, 579–588. [Google Scholar] [CrossRef] [PubMed]
- Ko, F.W.; Tam, W.; Wong, T.W.; Lai, C.K.; Wong, G.W.; Leung, T.F.; Ng, S.S.; Hui, D.S. Effects of air pollution on asthma hospitalization rates in different age groups in Hong Kong. Clin. Exp. Allergy 2007, 37, 1312–1319. [Google Scholar] [CrossRef] [PubMed]
- Götschi, T.; Heinrich, J.; Sunyer, J.; Künzli, N. Long term effects of ambient air pollution on lung function—A review. Epidemiology 2008, 19, 690–701. [Google Scholar] [CrossRef] [PubMed]
- Forbes, L.J.; Kapetanakis, V.; Rudnicka, A.R.; Cook, D.G.; Bush, T.; Stedman, J.R.; Whincup, P.H.; Strachan, D.P.; Anderson, H.R. Environmental exposure: Chronic exposure to outdoor air pollution and lung function in adults. Thorax 2009, 64, 657–663. [Google Scholar] [CrossRef] [PubMed]
- McConnell, R.; Berhane, K.; Yao, L.; Jerrett, M.; Lurmann, F.; Gilliland, F.; Künzli, N.; Gauderman, J.; Avol, E.; Thomas, D.; et al. Traffic, susceptibility, and childhood asthma. Environ. Health Perspect. 2006, 114, 766–772. [Google Scholar] [CrossRef] [PubMed]
- Clougherty, J.E. A growing role for gender analysis in air pollution epidemiology. Environ. Health Perspect. 2010, 118, 167–176. [Google Scholar] [CrossRef] [PubMed]
- Arbex, M.A.; de Souza, C.; Cendon, S.P.; Arbex, F.F.; Lopes, A.C.; Moysés, E.P.; Santiago, S.L.; Saldiva, P.H.; Pereira, L.A.; Braga, A.L. Urban air pollution and COPD-related emergency room visits. J. Epidemiol. Commun. Health 2009, 63, 777–784. [Google Scholar] [CrossRef] [PubMed]
- Modig, L.; Torén, K.; Janson, C.; Jarvholm, B.; Forsberg, B. Vehicle exhaust outside the home and onset of asthma among adults. Eur. Respir. J. 2009, 33, 1261–1267. [Google Scholar] [CrossRef] [PubMed]
- Behrendt, C.E. Mild and moderate-to-severe COPD in nonsmokers: Distinct demographic profiles. Chest 2005, 128, 1239–1244. [Google Scholar] [CrossRef] [PubMed]
- Birring, S.S.; Brightling, C.E.; Bradding, P.; Entwisle, J.J.; Vara, D.D.; Grigg, J.; Wardlaw, A.J.; Pavord, I.D. Clinical; radiologic; and induced sputum features of chronic obstructive pulmonary disease in nonsmokers: A descriptive study. Am. J. Respir. Crit. Care Med. 2002, 166, 1078–1083. [Google Scholar] [CrossRef] [PubMed]
- Pena, V.; Miravitlles, M.; Gabriel, R.; Jiménez-Ruiz, C.A.; Villasante, C.; Masa, J.F.; Viejo, J.L.; Fernández-Fau, L. Geographic variations in prevalence and under-diagnosis of COPD: Results of the IBERPOC multicentre epidemiological study. Chest 2000, 118, 981–989. [Google Scholar] [CrossRef] [PubMed]
- Janssen, N.A.; Hoek, G.; Simic-Lawson, M.; Fischer, P.; van Bree, L.; ten Brink, H.; Keuken, M.; Atkinson, R.W.; Anderson, H.R.; Brunekreef, B.; et al. Black carbon as an additional indicator of the adverse health effects of airborne particles compared with PM10 and PM2.5. Environ. Health Perspect. 2011, 119, 1691–1699. [Google Scholar] [CrossRef] [PubMed]
- Badyda, A.; Dąbrowiecki, P.; Lubinski, W.; Czechowski, P.O.; Majewski, G.; Chcialowski, A.; Kraszewski, A. Influence of traffic-related air pollutants on lung function. Adv. Exp. Med. Biol. 2013, 788, 229–235. [Google Scholar] [PubMed]
- Baranska, Z. Basics of Statistical Methods for Psychologists; Publishing House of the University of Gdansk: Gdańsk, Poland, 2000; pp. 104–105, 121. [Google Scholar]


| Air Pollutant | Urban Area | Control Area | p | ||
|---|---|---|---|---|---|
| Mean ± SD | Median | Mean ± SD | Median | ||
| CO (μg/m3) | 1308.2 ± 687.4 | 1262.7 | 451.5 ± 45.0 | 444.5 | p < 0.001 |
| NO2 (μg/m3) | 52.7 ± 29.8 | 47.6 | 1.3 ± 0.7 | 1.3 | |
| PM10 (μg/m3) | 42.7 ± 10.7 | 39.1 | 7.2 ± 2.3 | 6.5 | |
| Year | Loc | Number of Data | Mean | Min | Max | SD | Mean in S | Mean in W | Number > 50 |
|---|---|---|---|---|---|---|---|---|---|
| 2008 | UA | 8428 | 35.9 | 1.0 | 411.4 | 24.1 | 33.4 | 38.1 | 62 |
| CA | 8489 | 22.8 | 0.2 | 254.0 | 15.7 | 22.3 | 23.3 | 9 | |
| 2009 | UA | 8465 | 40.3 | 1.7 | 475.4 | 29.1 | 35.1 | 45.8 | 84 |
| CA | 8122 | 23.4 | 1.0 | 404.0 | 19.4 | 23.1 | 24.1 | 12 | |
| 2010 | UA | 7816 | 42.9 | 1.9 | 366.1 | 30.5 | 32.3 | 50.3 | 97 |
| CA | 7421 | 23.2 | 0.9 | 220.2 | 17.8 | 19.1 | 26.9 | 10 | |
| 2011 | UA | 8392 | 40.6 | 2.5 | 360.7 | 27.8 | 32.5 | 48.9 | 81 |
| CA | 6817 | 21.4 | 0.0 | 290.1 | 19.8 | 17.3 | 22.4 | 15 | |
| 2012 | UA | 8040 | 39.3 | 0.8 | 433.6 | 28.2 | 30.4 | 45.5 | 70 |
| CA | 8411 | 20.1 | 0.0 | 213.6 | 17.4 | 18.1 | 22.7 | 9 |
| Variable | City Group | Control Group | p |
|---|---|---|---|
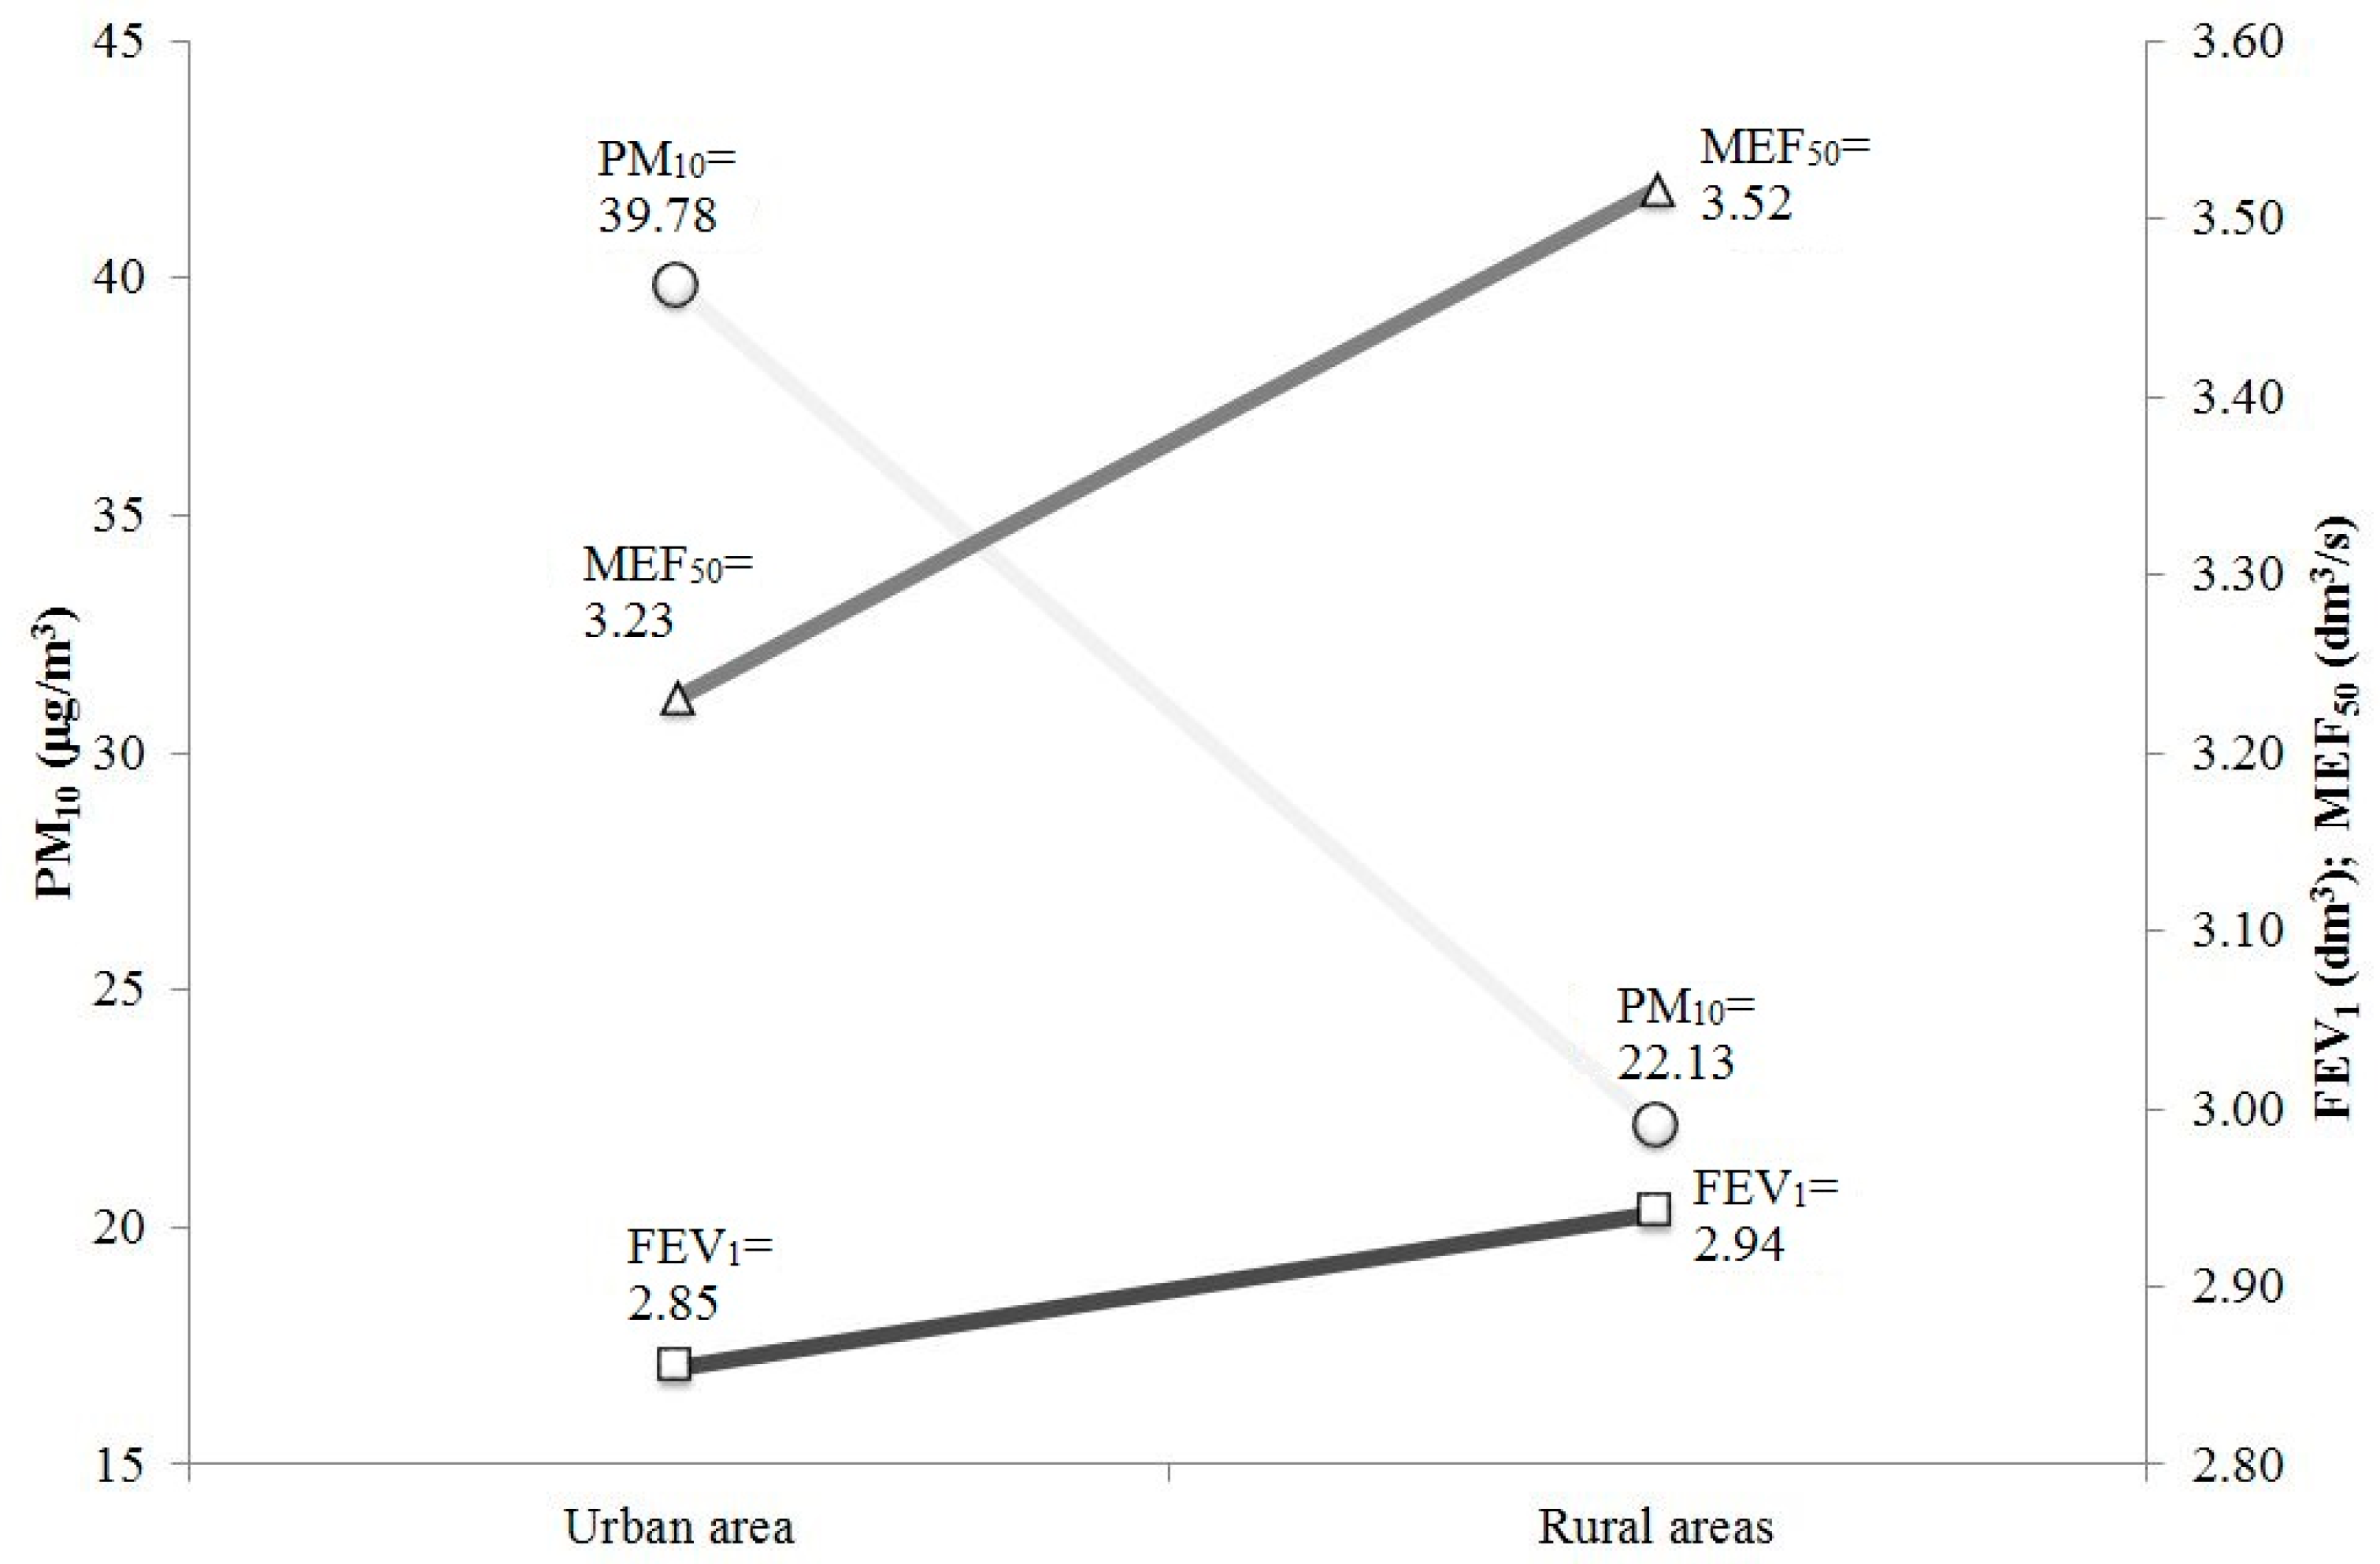
| FEV1 (dm3) | 2.85 ± 1.10 | 2.94 ± 0.99 | p < 0.05 |
| PEF (dm3/s) | 7.11 ± 2.54 | 7.27 ± 2.40 | |
| MEF50 (dm3/s) | 3.23 ± 1.73 | 3.52 ± 1.67 |
| Variable | City Group | Control Group | p |
|---|---|---|---|
| FEV1 (%) | 94.26 ± 19.30 | 97.82 ± 18.30 | p < 0.001 |
| PEF (%) | 95.95 ± 23.93 | 99.14 ± 22.70 | p < 0.01 |
| MEF50 (%) | 73.97 ± 33.04 | 82.42 ± 33.10 | p < 0.001 |
| Variable | City Group | Control Group |
|---|---|---|
| Number of patients | 3834 | 891 |
| Men/Women | 1608/2226 | 420/471 |
| Smokers/Non-smokers | 1896/1938 | 442/449 |
© 2016 by the authors; licensee MDPI, Basel, Switzerland. This article is an open access article distributed under the terms and conditions of the Creative Commons Attribution (CC-BY) license (http://creativecommons.org/licenses/by/4.0/).
Share and Cite
Badyda, A.; Gayer, A.; Czechowski, P.O.; Majewski, G.; Dąbrowiecki, P. Pulmonary Function and Incidence of Selected Respiratory Diseases Depending on the Exposure to Ambient PM10. Int. J. Mol. Sci. 2016, 17, 1954. https://doi.org/10.3390/ijms17111954
Badyda A, Gayer A, Czechowski PO, Majewski G, Dąbrowiecki P. Pulmonary Function and Incidence of Selected Respiratory Diseases Depending on the Exposure to Ambient PM10. International Journal of Molecular Sciences. 2016; 17(11):1954. https://doi.org/10.3390/ijms17111954
Chicago/Turabian StyleBadyda, Artur, Anna Gayer, Piotr Oskar Czechowski, Grzegorz Majewski, and Piotr Dąbrowiecki. 2016. "Pulmonary Function and Incidence of Selected Respiratory Diseases Depending on the Exposure to Ambient PM10" International Journal of Molecular Sciences 17, no. 11: 1954. https://doi.org/10.3390/ijms17111954