
Compartmentalization and Functionality of Nuclear Disorder: Intrinsic Disorder and Protein-Protein Interactions in Intra-Nuclear Compartments


Abstract
:
1. Introduction
2. Results and Discussion
2.1. Intrinsic Disorder in the Annotated and Predicted Intra-Nuclear Localizations Is Equivalent

| Dataset | Description | Number of Proteins |
|---|---|---|
| NNUCLEAR | Complete mouse proteome excluding the nuclear proteins. | 29,863 |
| NUCLEARa | Nuclear mouse proteome with annotated intra-nuclear compartments. | 1285 |
| NUCLEARap | Nuclear mouse proteome with annotated and predicted intra-nuclear compartments. | 3005 |
| PPI | Mouse proteins included in the protein-protein interaction (PPI) network. | 8206 |
| PPINNUCLEAR | Complete mouse proteome without nuclear proteins included in the PPI network (intersection of NNUCLEAR and PPI). | 5687 |
| PPINUCLEARap | Nuclear mouse proteome with annotated and predicted intra-nuclear compartments included in the PPI network (intersection of NUCLEARap and PPI). | 2519 |
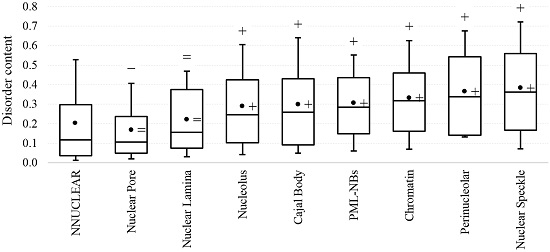
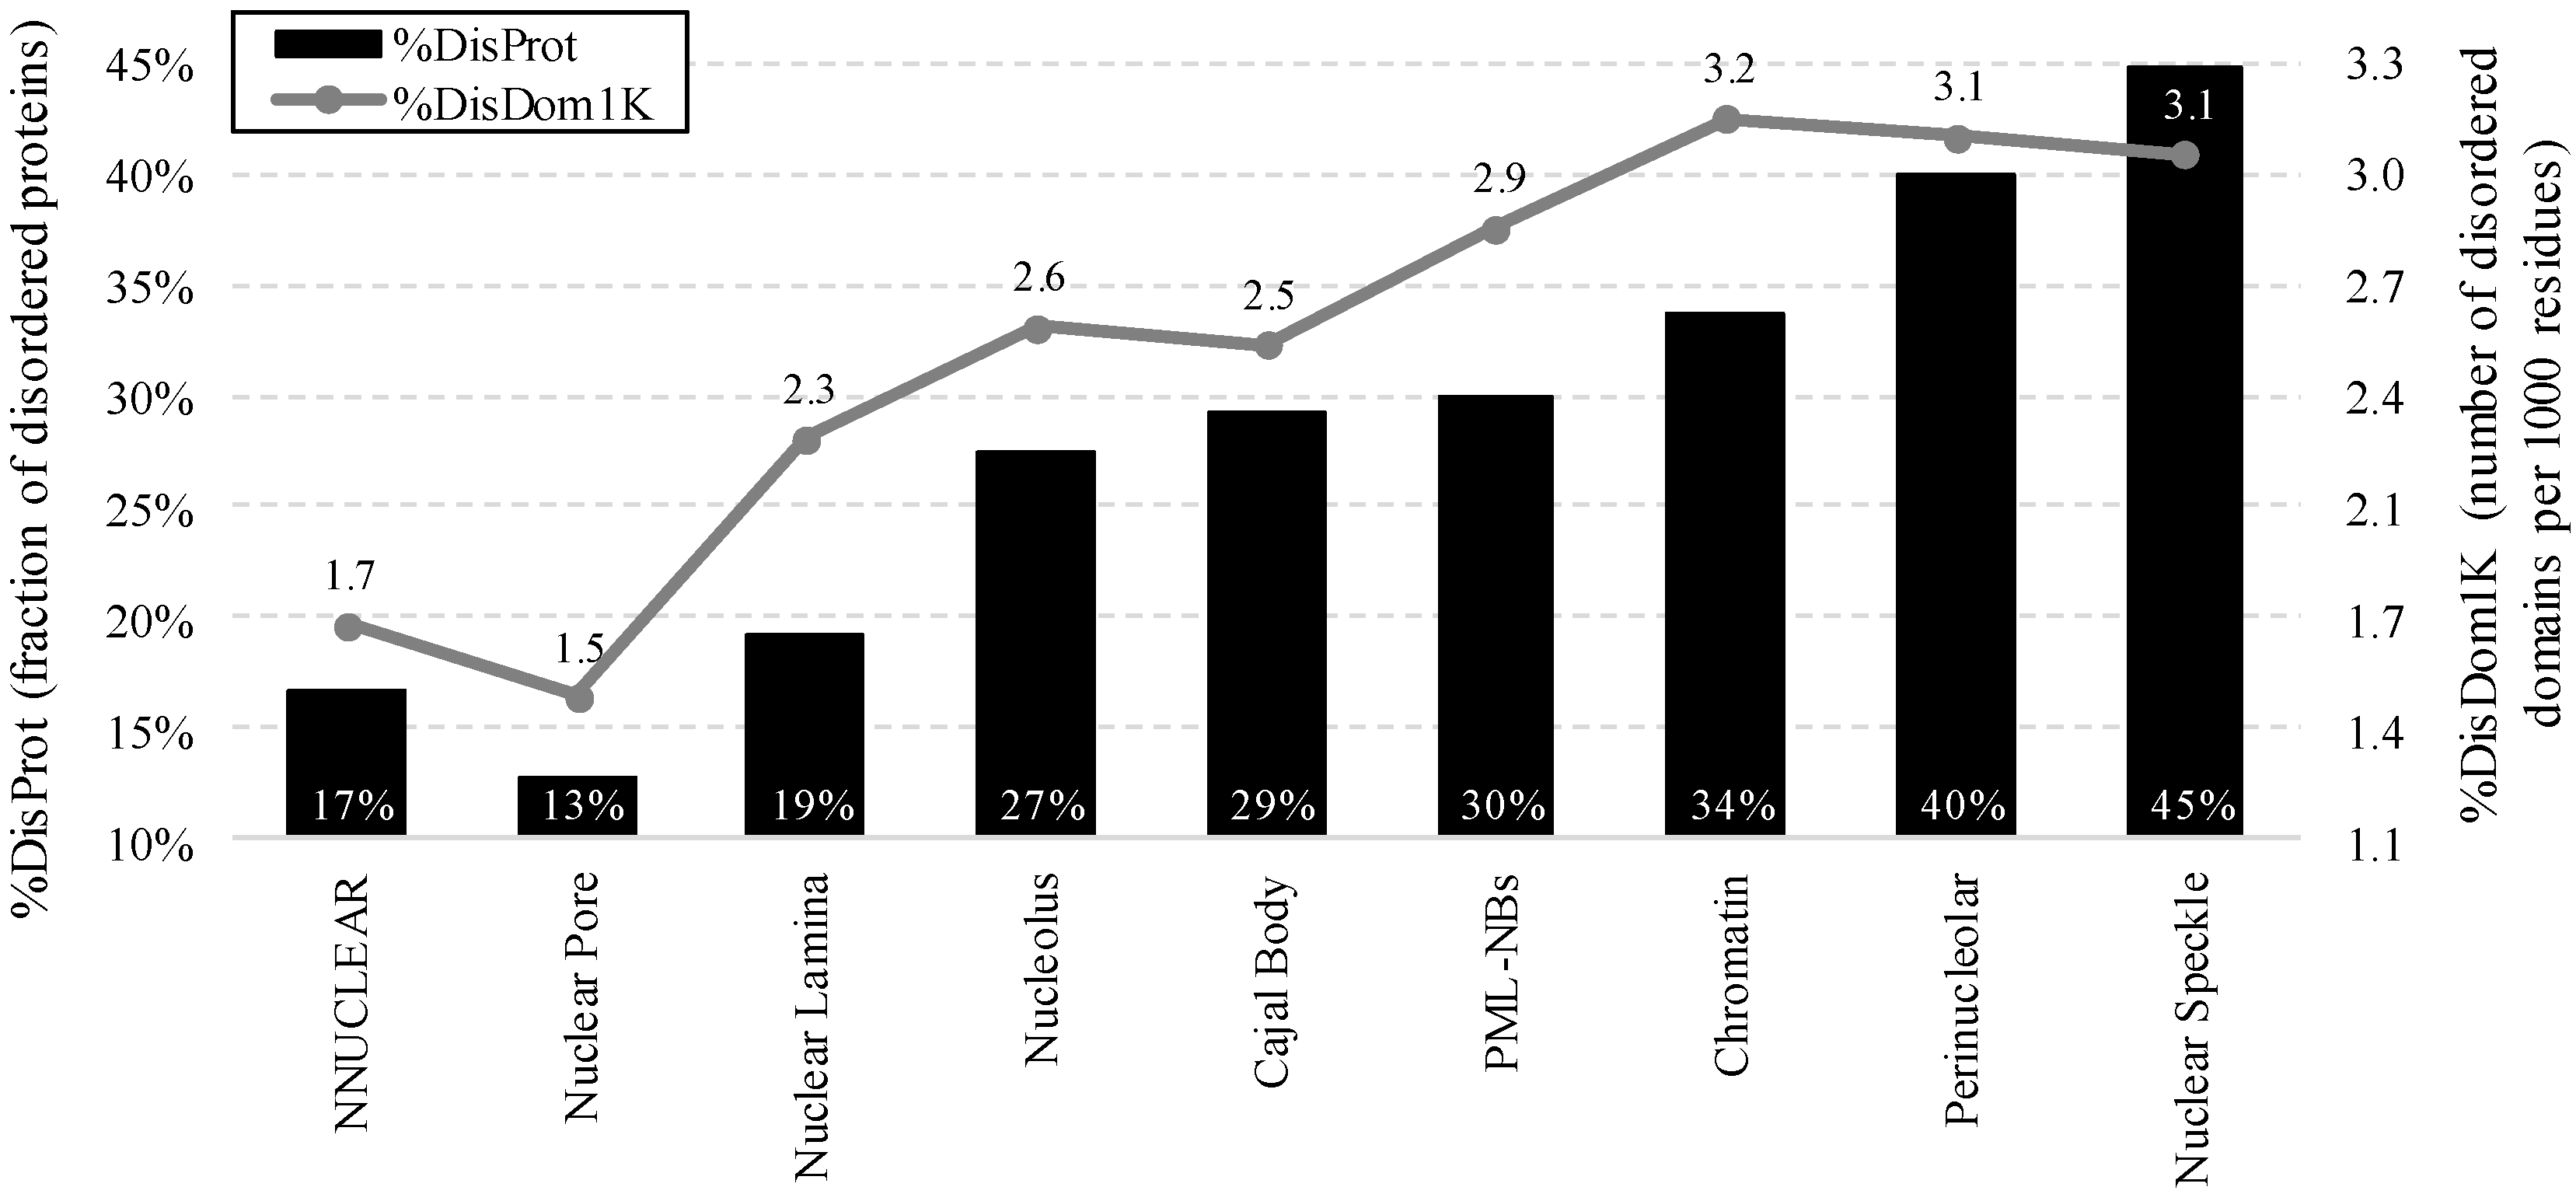
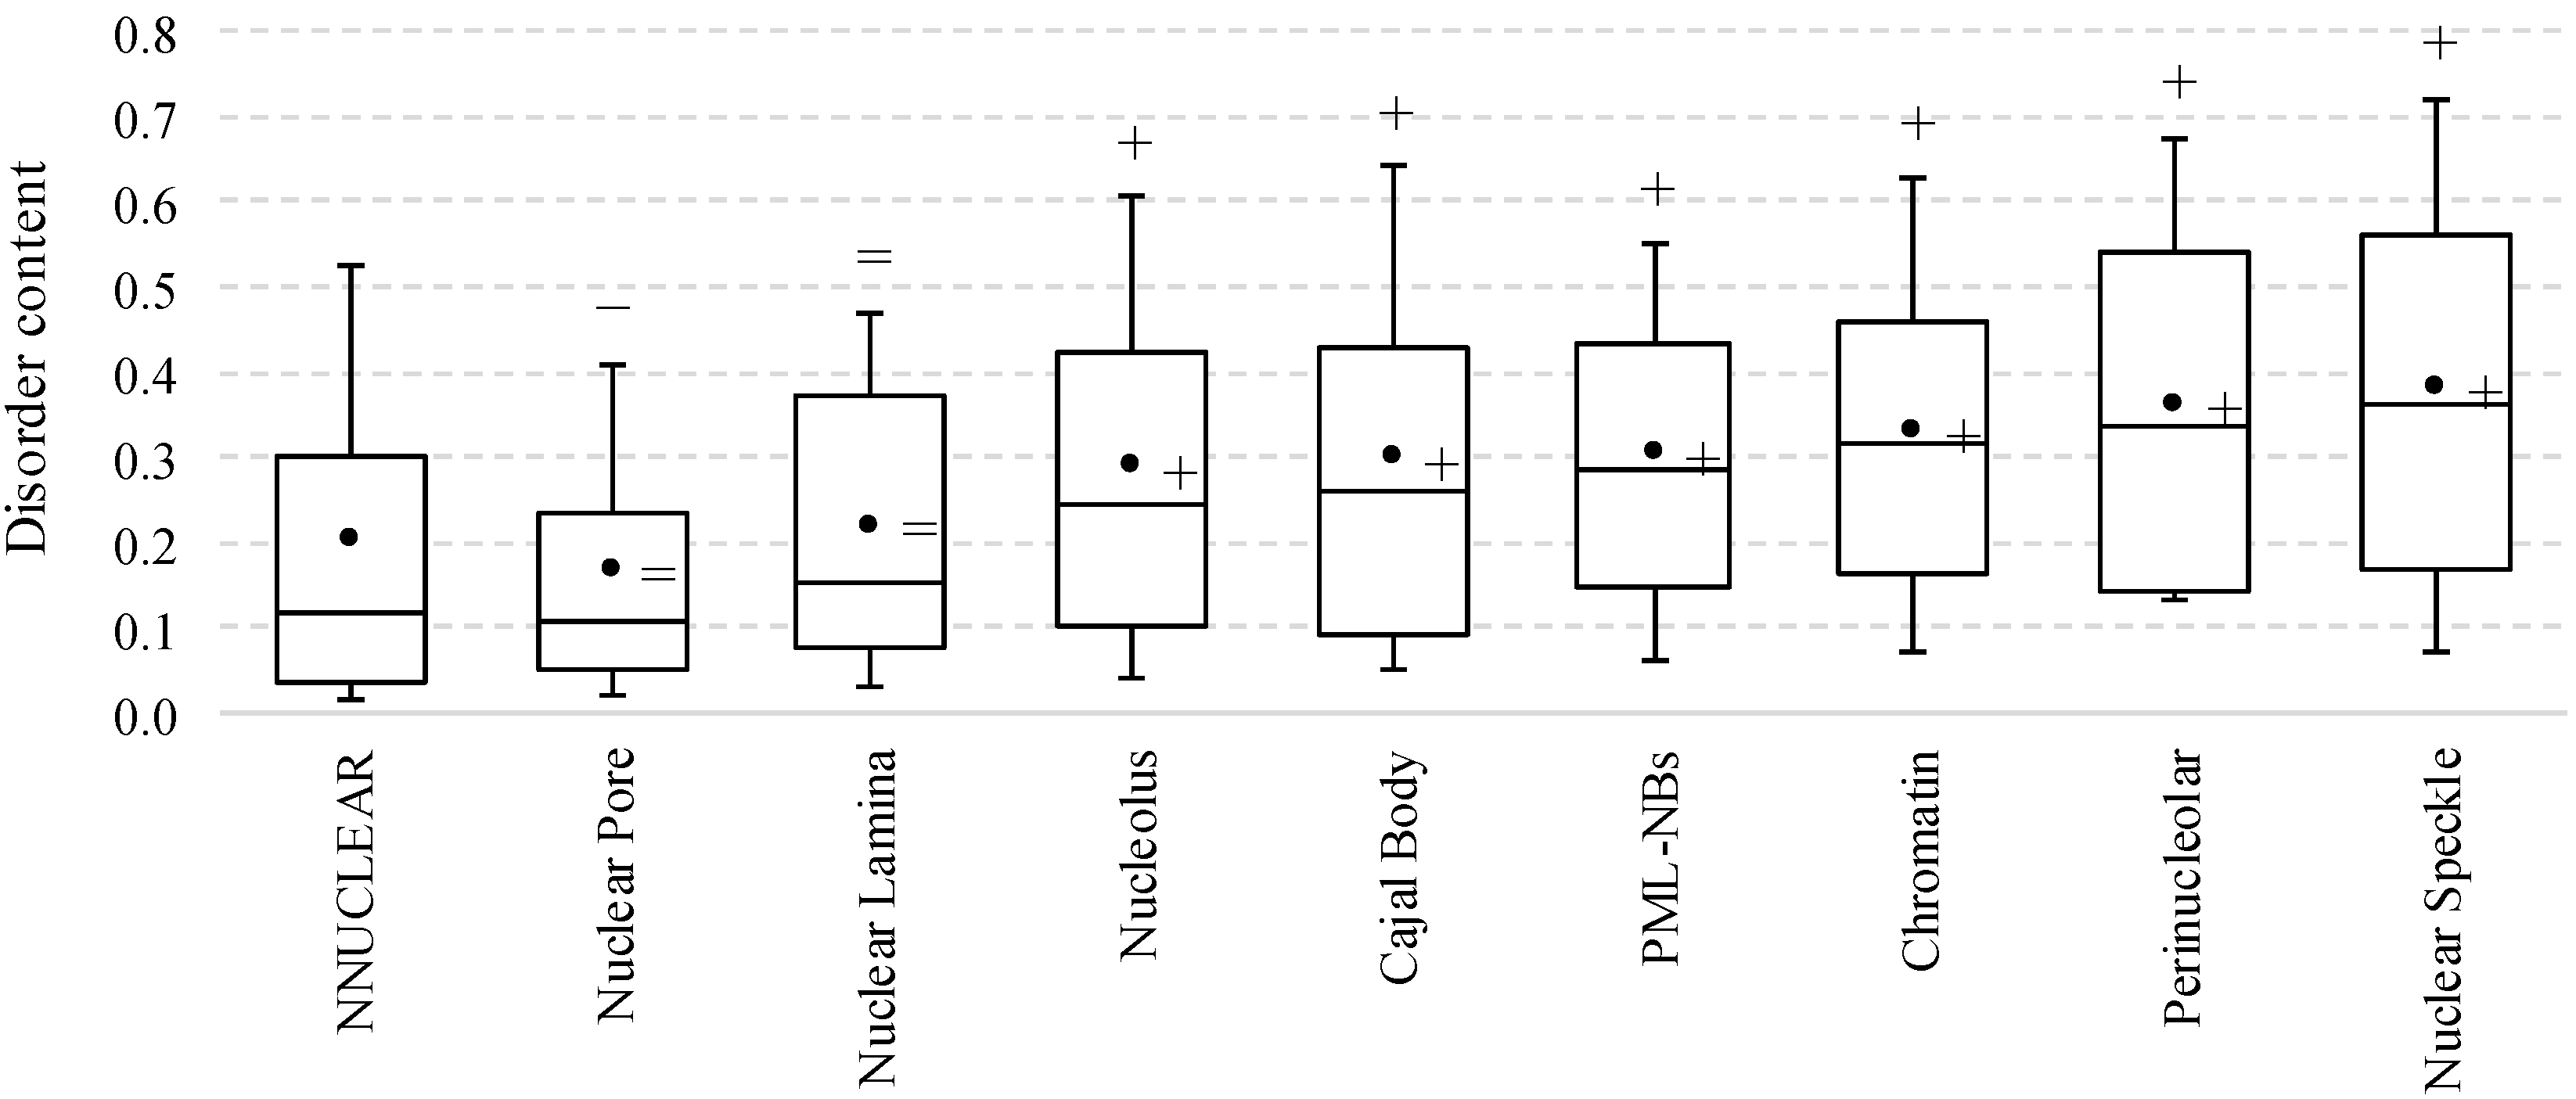
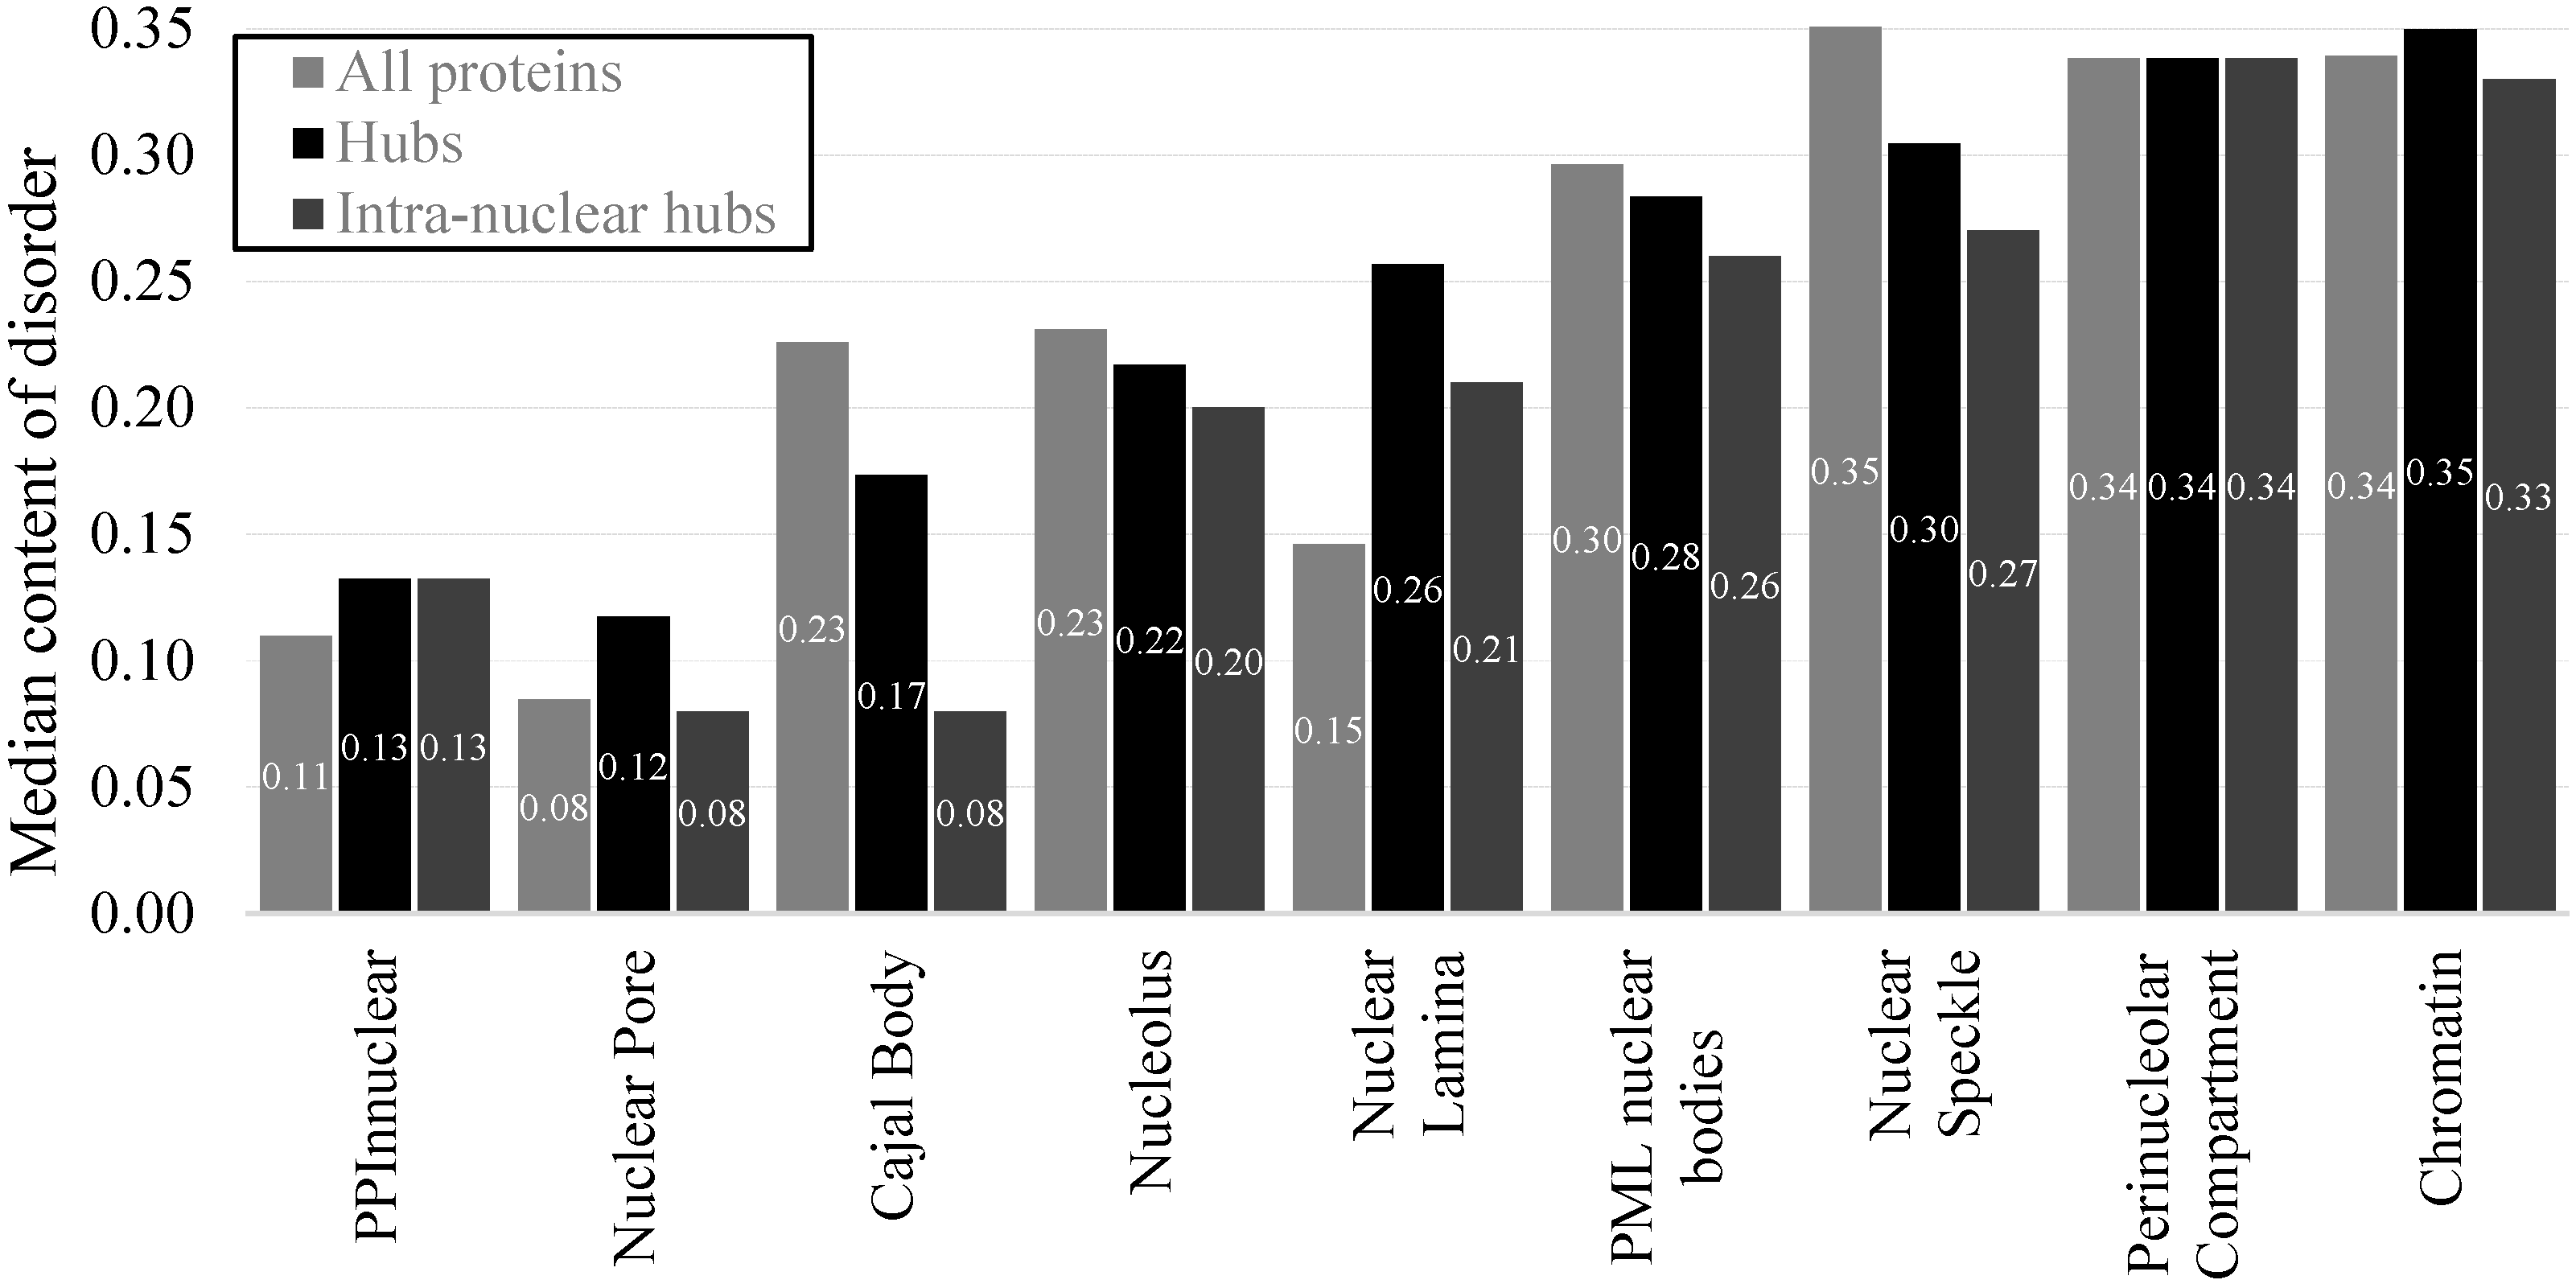
2.2. Intrinsic Disorder in Intra-Nuclear Compartments


| Intra-Nuclear Compartments | Disorder Characteristics by the Per-Residue Predictors | Distribution within the CH-CDF Plot | |||||
|---|---|---|---|---|---|---|---|
| PONDR-FIT a | PONDR VSL2 a | Two HT Consensus b | Q1 (%) | Q2 (%) | Q3 (%) | Q4 (%) | |
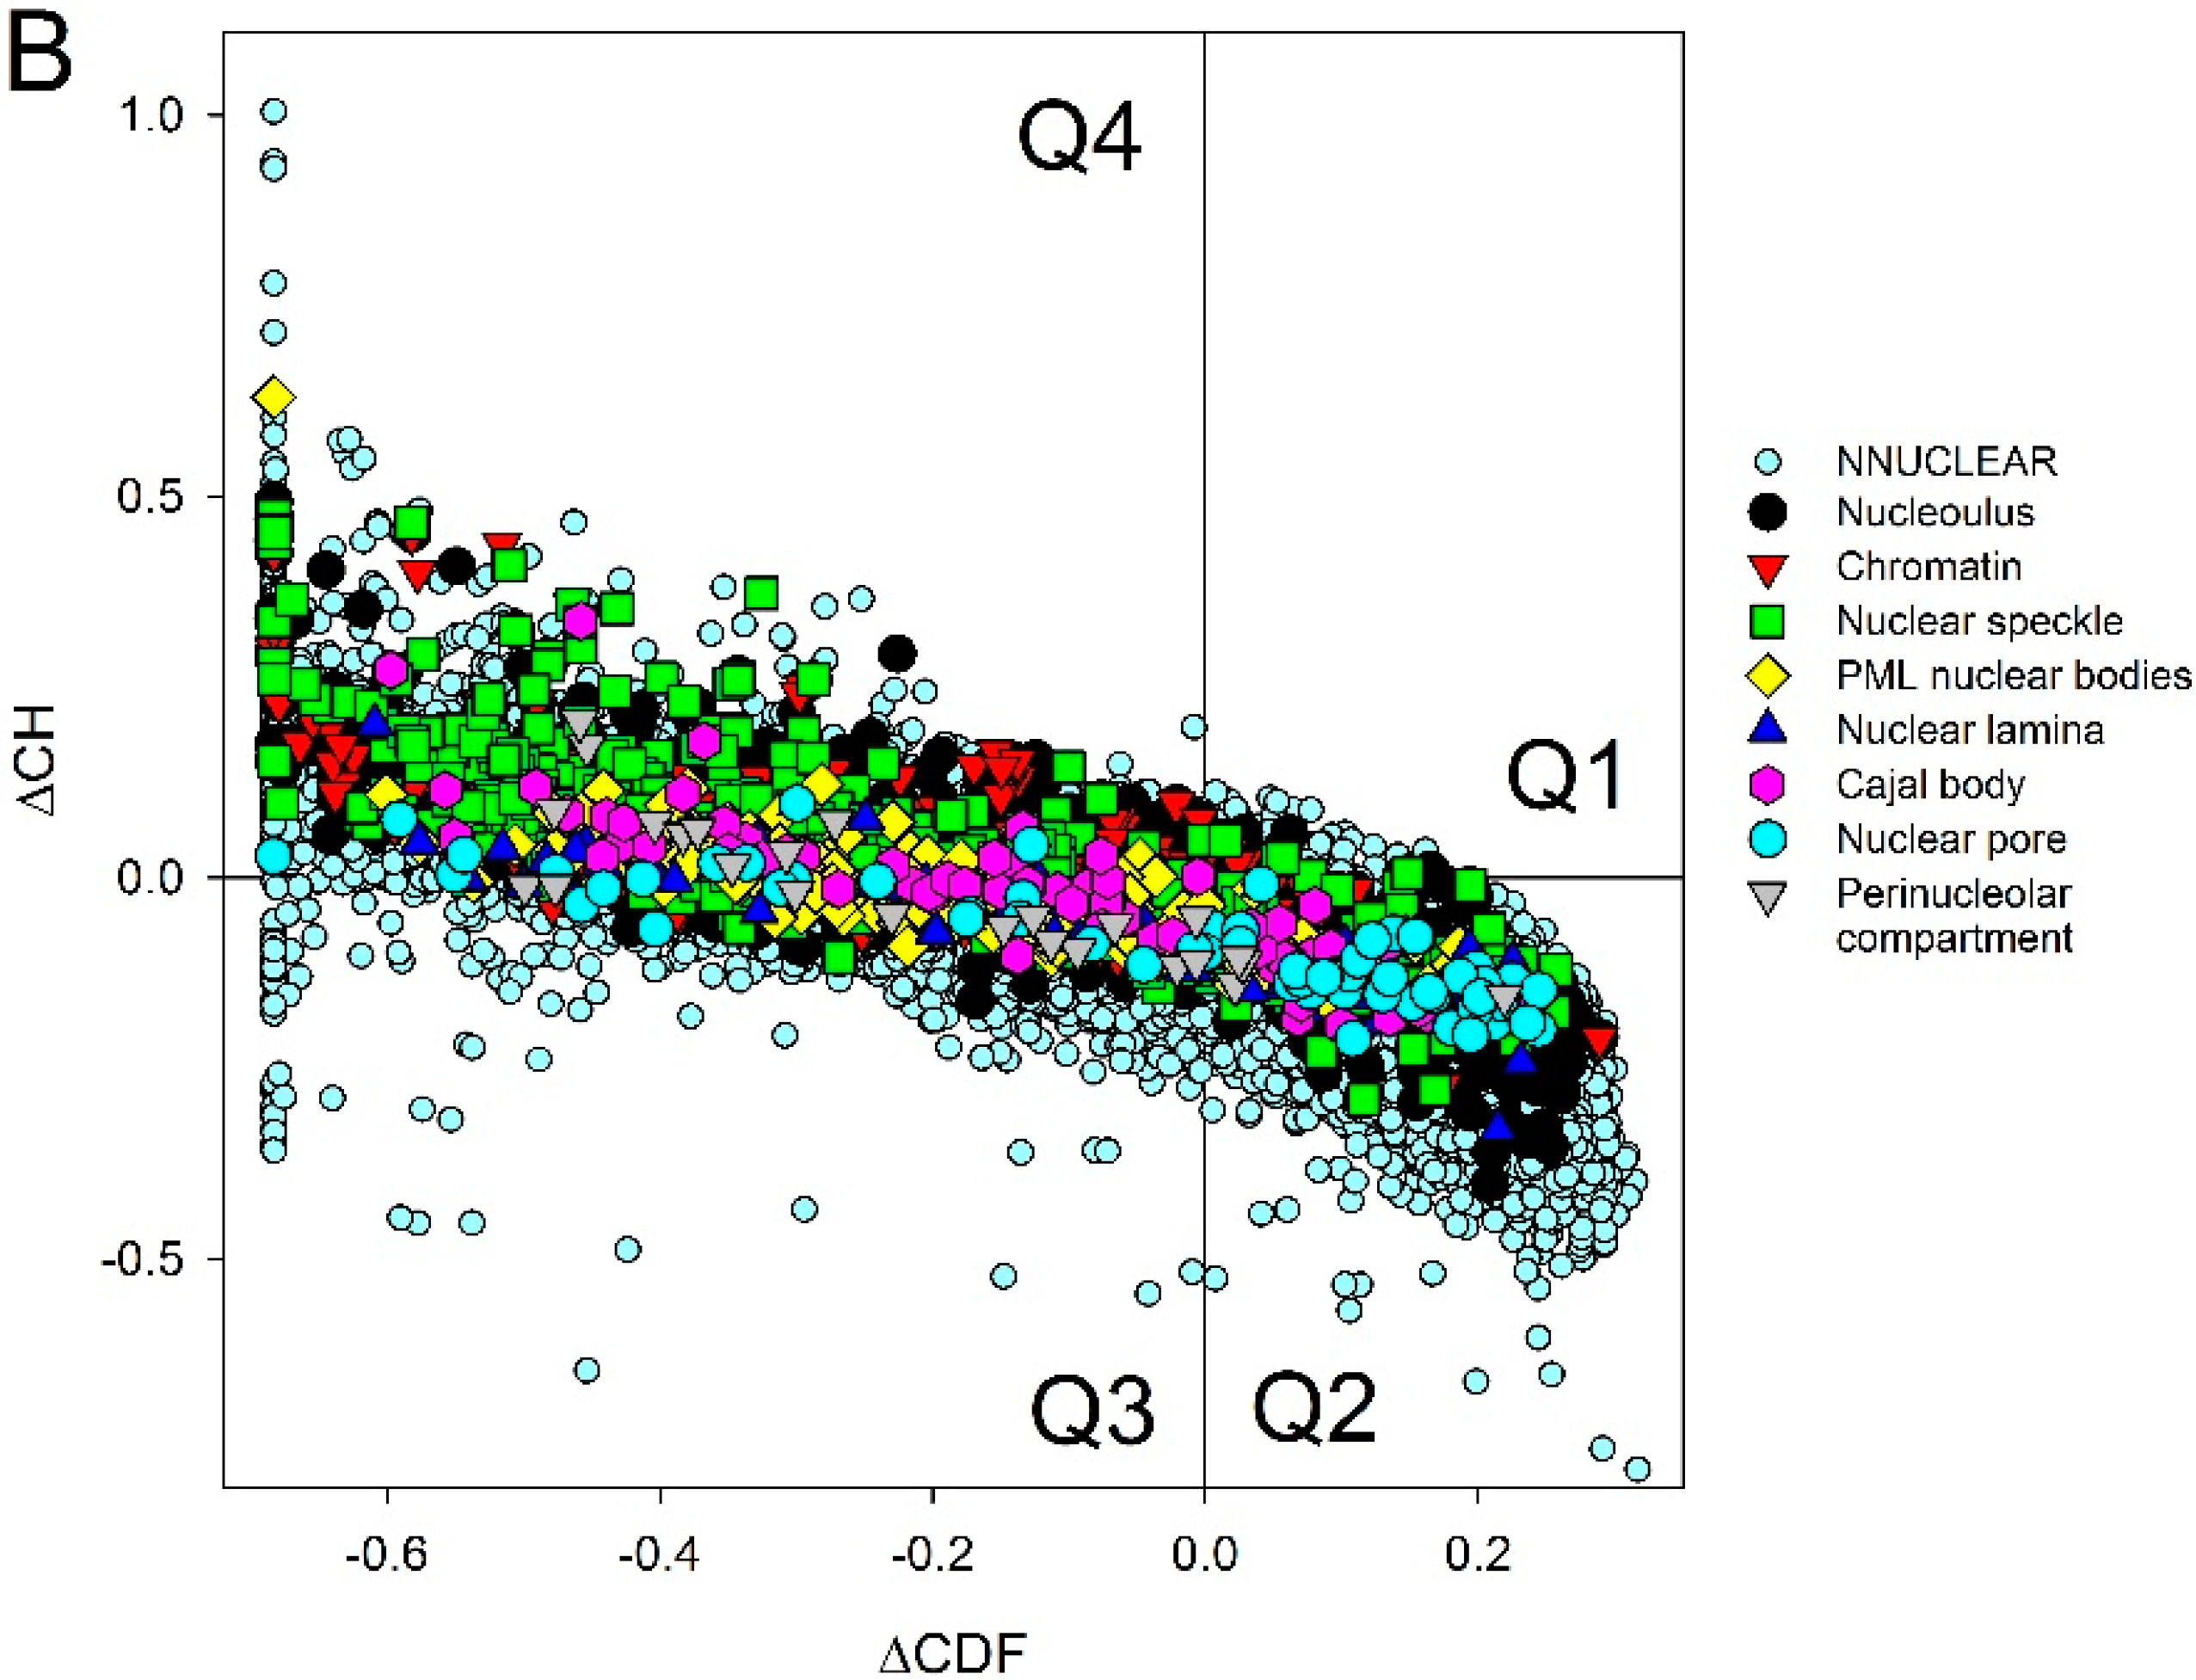
| Perinucleolar | 0.49 ± 0.15 | 0.61 ± 0.15 | 36 ± 21 | 0.0 | 16.0 | 48.0 | 36.0 |
| Nuclear speckle | 0.48 ± 0.17 | 0.60 ± 0.17 | 38 ± 25 | 0.8 | 25.3 | 28.5 | 45.4 |
| Chromatin | 0.45 ± 0.15 | 0.61 ± 0.14 | 33 ± 21 | 0.7 | 15.7 | 33.9 | 49.7 |
| PML | 0.43 ± 0.14 | 0.57 ± 0.13 | 31 ± 19 | 0.0 | 22.4 | 48.7 | 28.9 |
| Nucleolus | 0.43 ± 0.16 | 0.55 ± 0.16 | 29 ± 22 | 1.0 | 34.6 | 29.4 | 35.0 |
| Cajal body | 0.42 ± 0.14 | 0.54 ± 0.13 | 30 ± 23 | 0.0 | 37.5 | 26.4 | 36.1 |
| Nuclear lamina | 0.39 ± 0.17 | 0.52 ± 0.17 | 22 ± 17 | 0.0 | 44.7 | 35.1 | 20.2 |
| Nuclear pore | 0.34 ± 0.16 | 0.47 ± 0.18 | 17 ± 16 | 0.0 | 61.9 | 23.8 | 14.3 |
| Non-nuclear | 0.36 ± 0.17 | 0.46 ± 0.18 | 20 ± 22 | 0.3 | 58.0 | 23.5 | 19.2 |
| Total | 0.37 ± 0.17 | 0.47 ± 0.18 | 21 ± 22 | 0.4 | 55.4 | 24.1 | 20.1 |
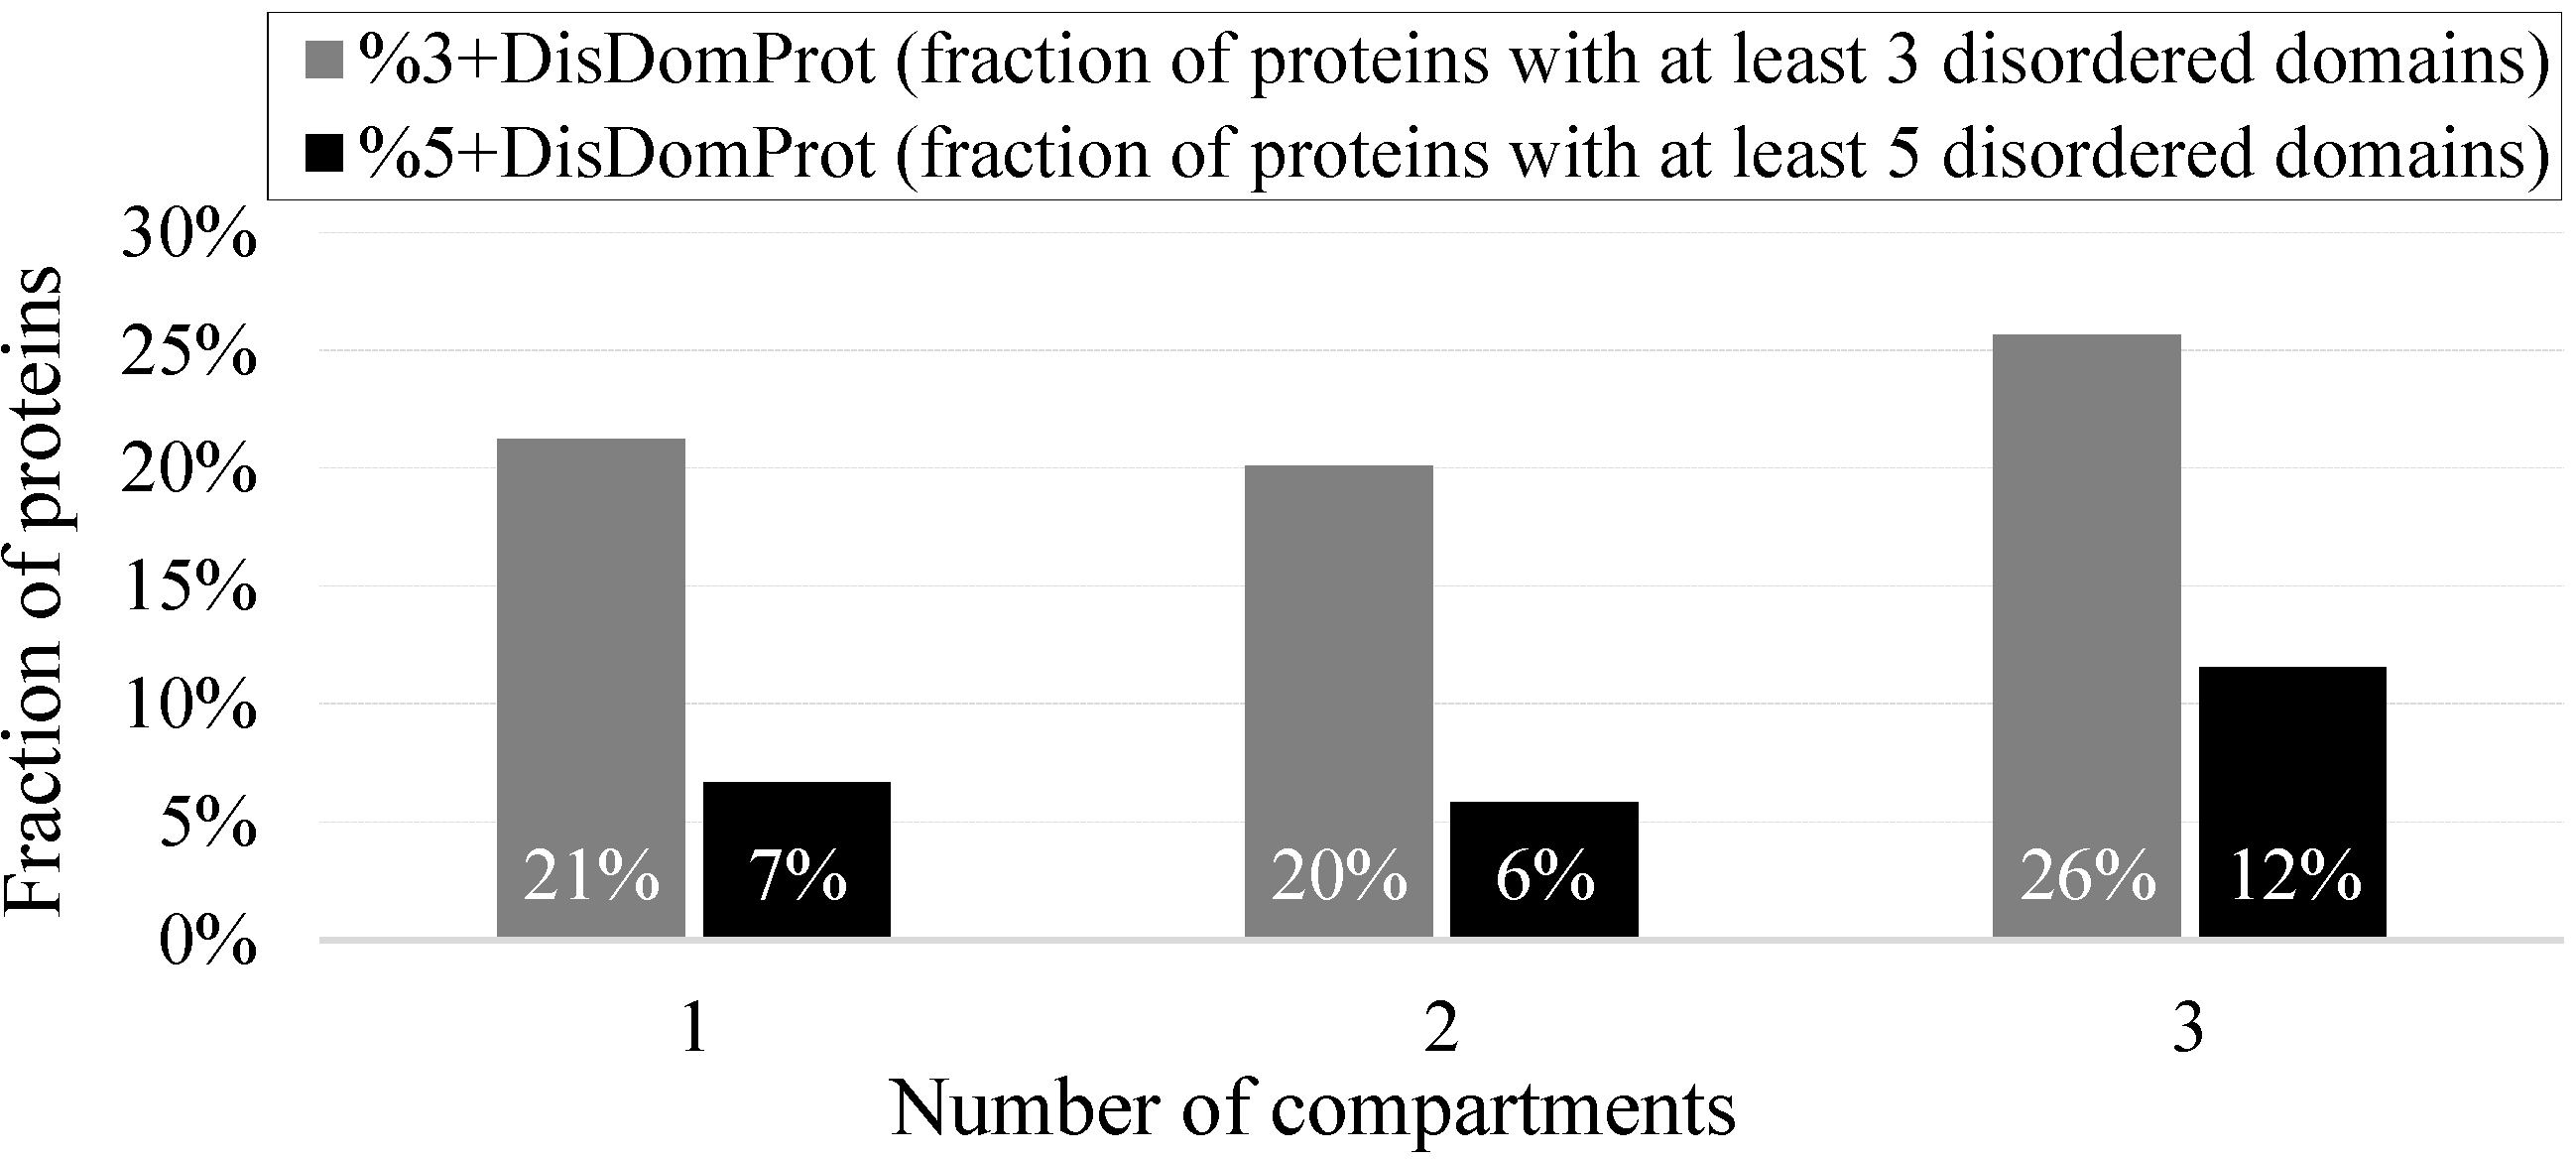
2.3. Intrinsic Disorder in Proteins Co-Localized in Multiple Intra-Nuclear Compartments
| Intra-Nuclear Compartment | Number of Proteins in NUCLEARa | Number of Proteins in NUCLEARap | PPINUCLEARap | ||
|---|---|---|---|---|---|
| Number of Proteins | Number of Hubs | Number of Intra-Compartment Hubs | |||
| Cajal Body | 49 | 72 | 50 | 15 | 11 |
| Chromatin | 323 | 828 | 500 | 192 | 145 |
| Nuclear Lamina | 77 | 94 | 70 | 19 | 14 |
| Nuclear Pore | 51 | 63 | 49 | 15 | 11 |
| Nuclear Speckle | 403 | 632 | 459 | 138 | 104 |
| Nucleolus | 598 | 1860 | 1227 | 392 | 335 |
| Perinucleolar | 24 | 25 | 24 | 14 | 9 |
| PML nuclear bodies | 91 | 187 | 140 | 71 | 49 |

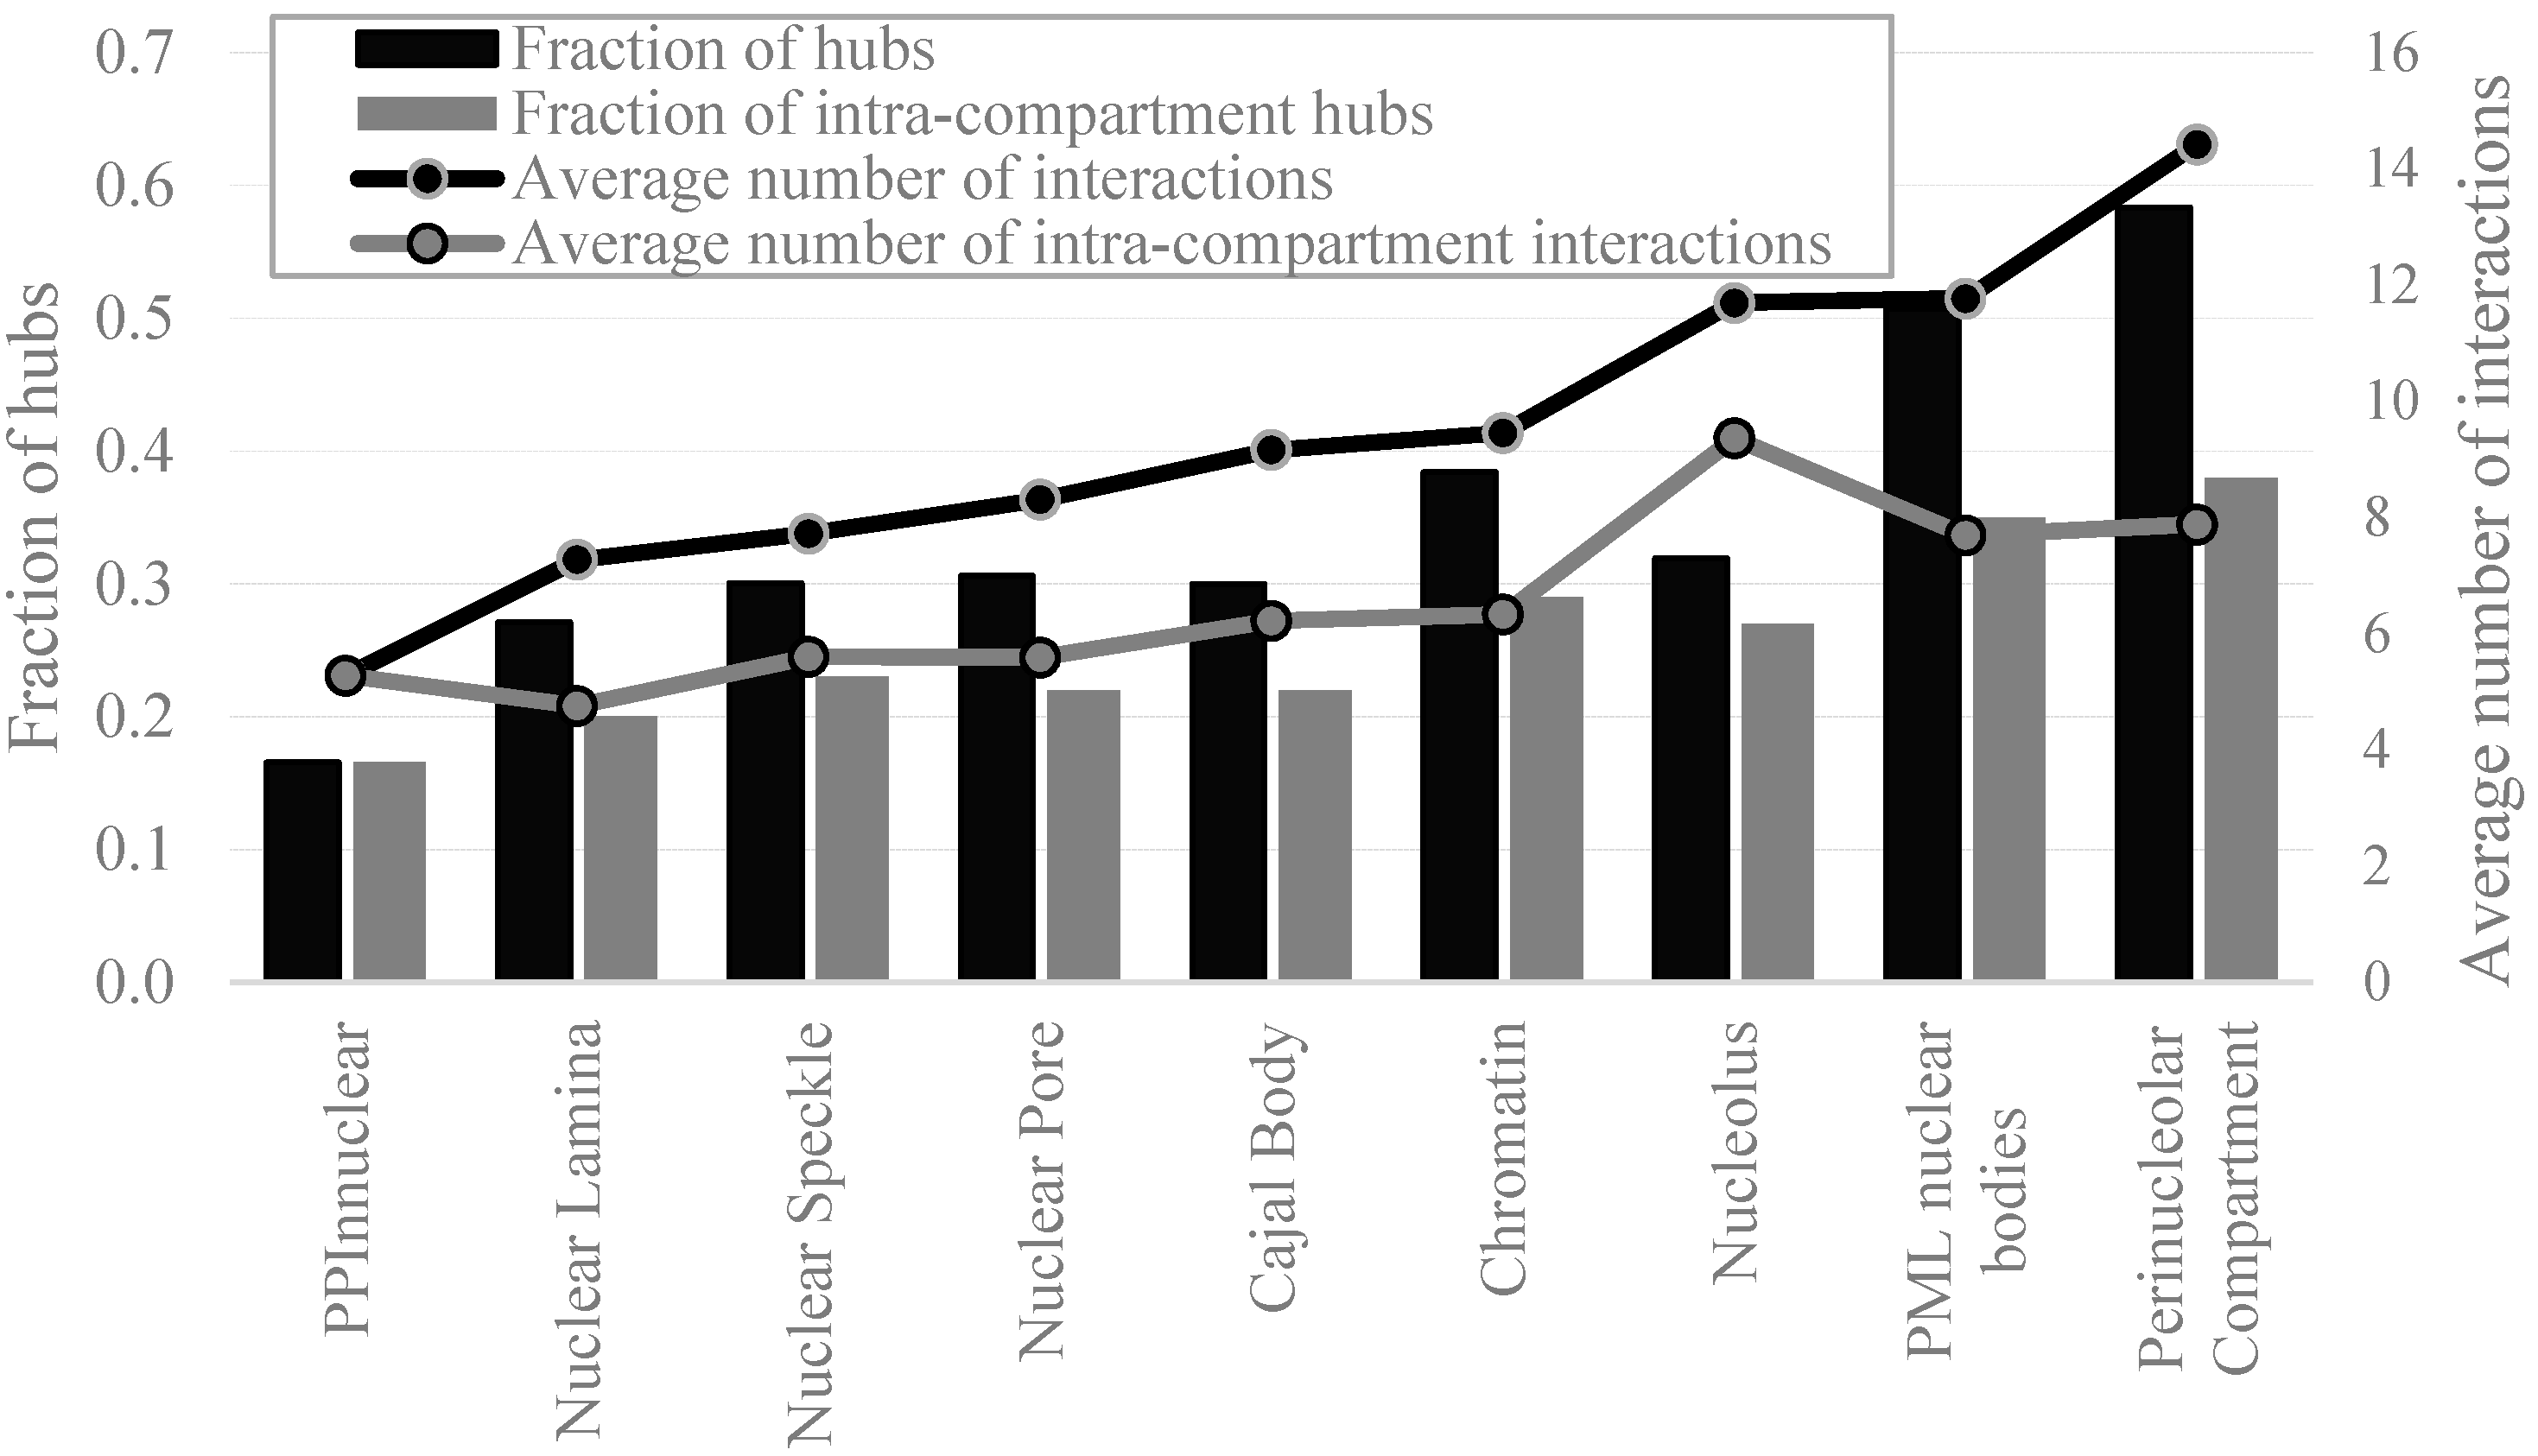
2.4. Protein-Protein Interactions and Intrinsic Disorder in Intra-Nuclear Compartments

3. Materials and Methods
3.1. Datasets
3.2. Annotation and Characterization of Intrinsic Disorder
- Disorder content: fraction of disordered residues in a given protein
- %DisProt (fraction of disordered proteins): fraction of proteins with disorder content ≥0.4 in a given protein set
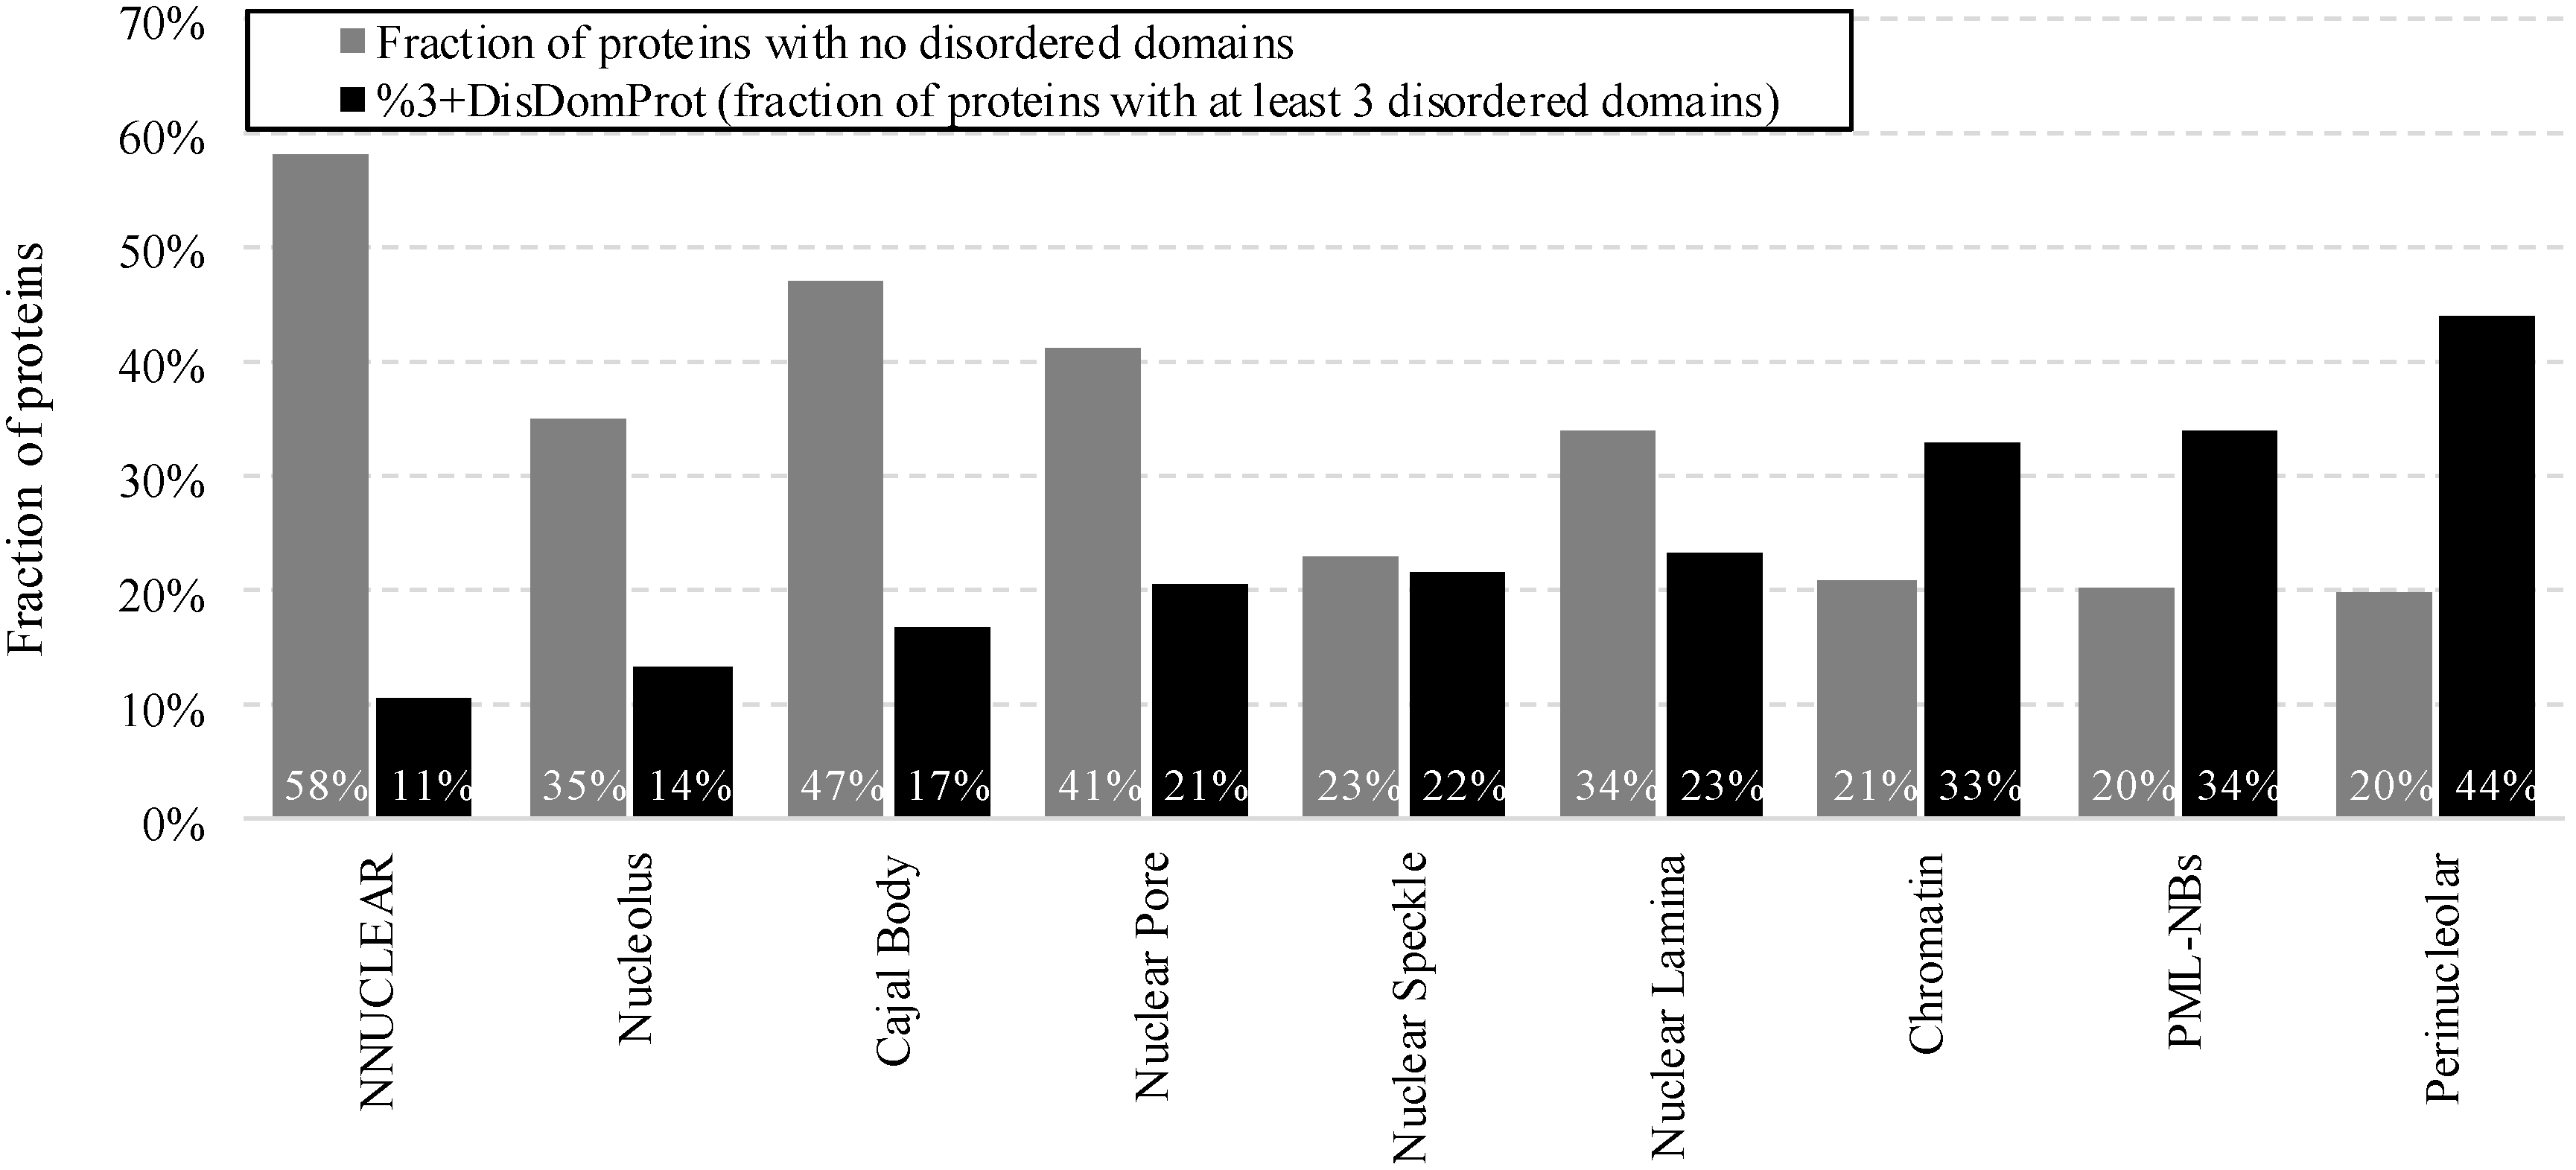
- %DisDomProt (fraction of proteins with disordered domains): fraction of proteins that have at least one long disorder region (≥30 residues long) in a given protein group. Such long regions are recognized as functional protein domains [52,103,104], which means that proteins with the long disorder regions are likely to carry functions through disorder
- %3+DisDomProt (fraction of proteins with at least three disordered domains)
- %5+DisDomProt (fraction of proteins with at least five disordered domains)
- %DisDom1 K (number of disordered domains per 1000 residues).This measure normalizes the count of long disordered regions to a size of a given protein or a set of proteins to accommodate for a potential bias that longer proteins may have more disordered domains because of their length.
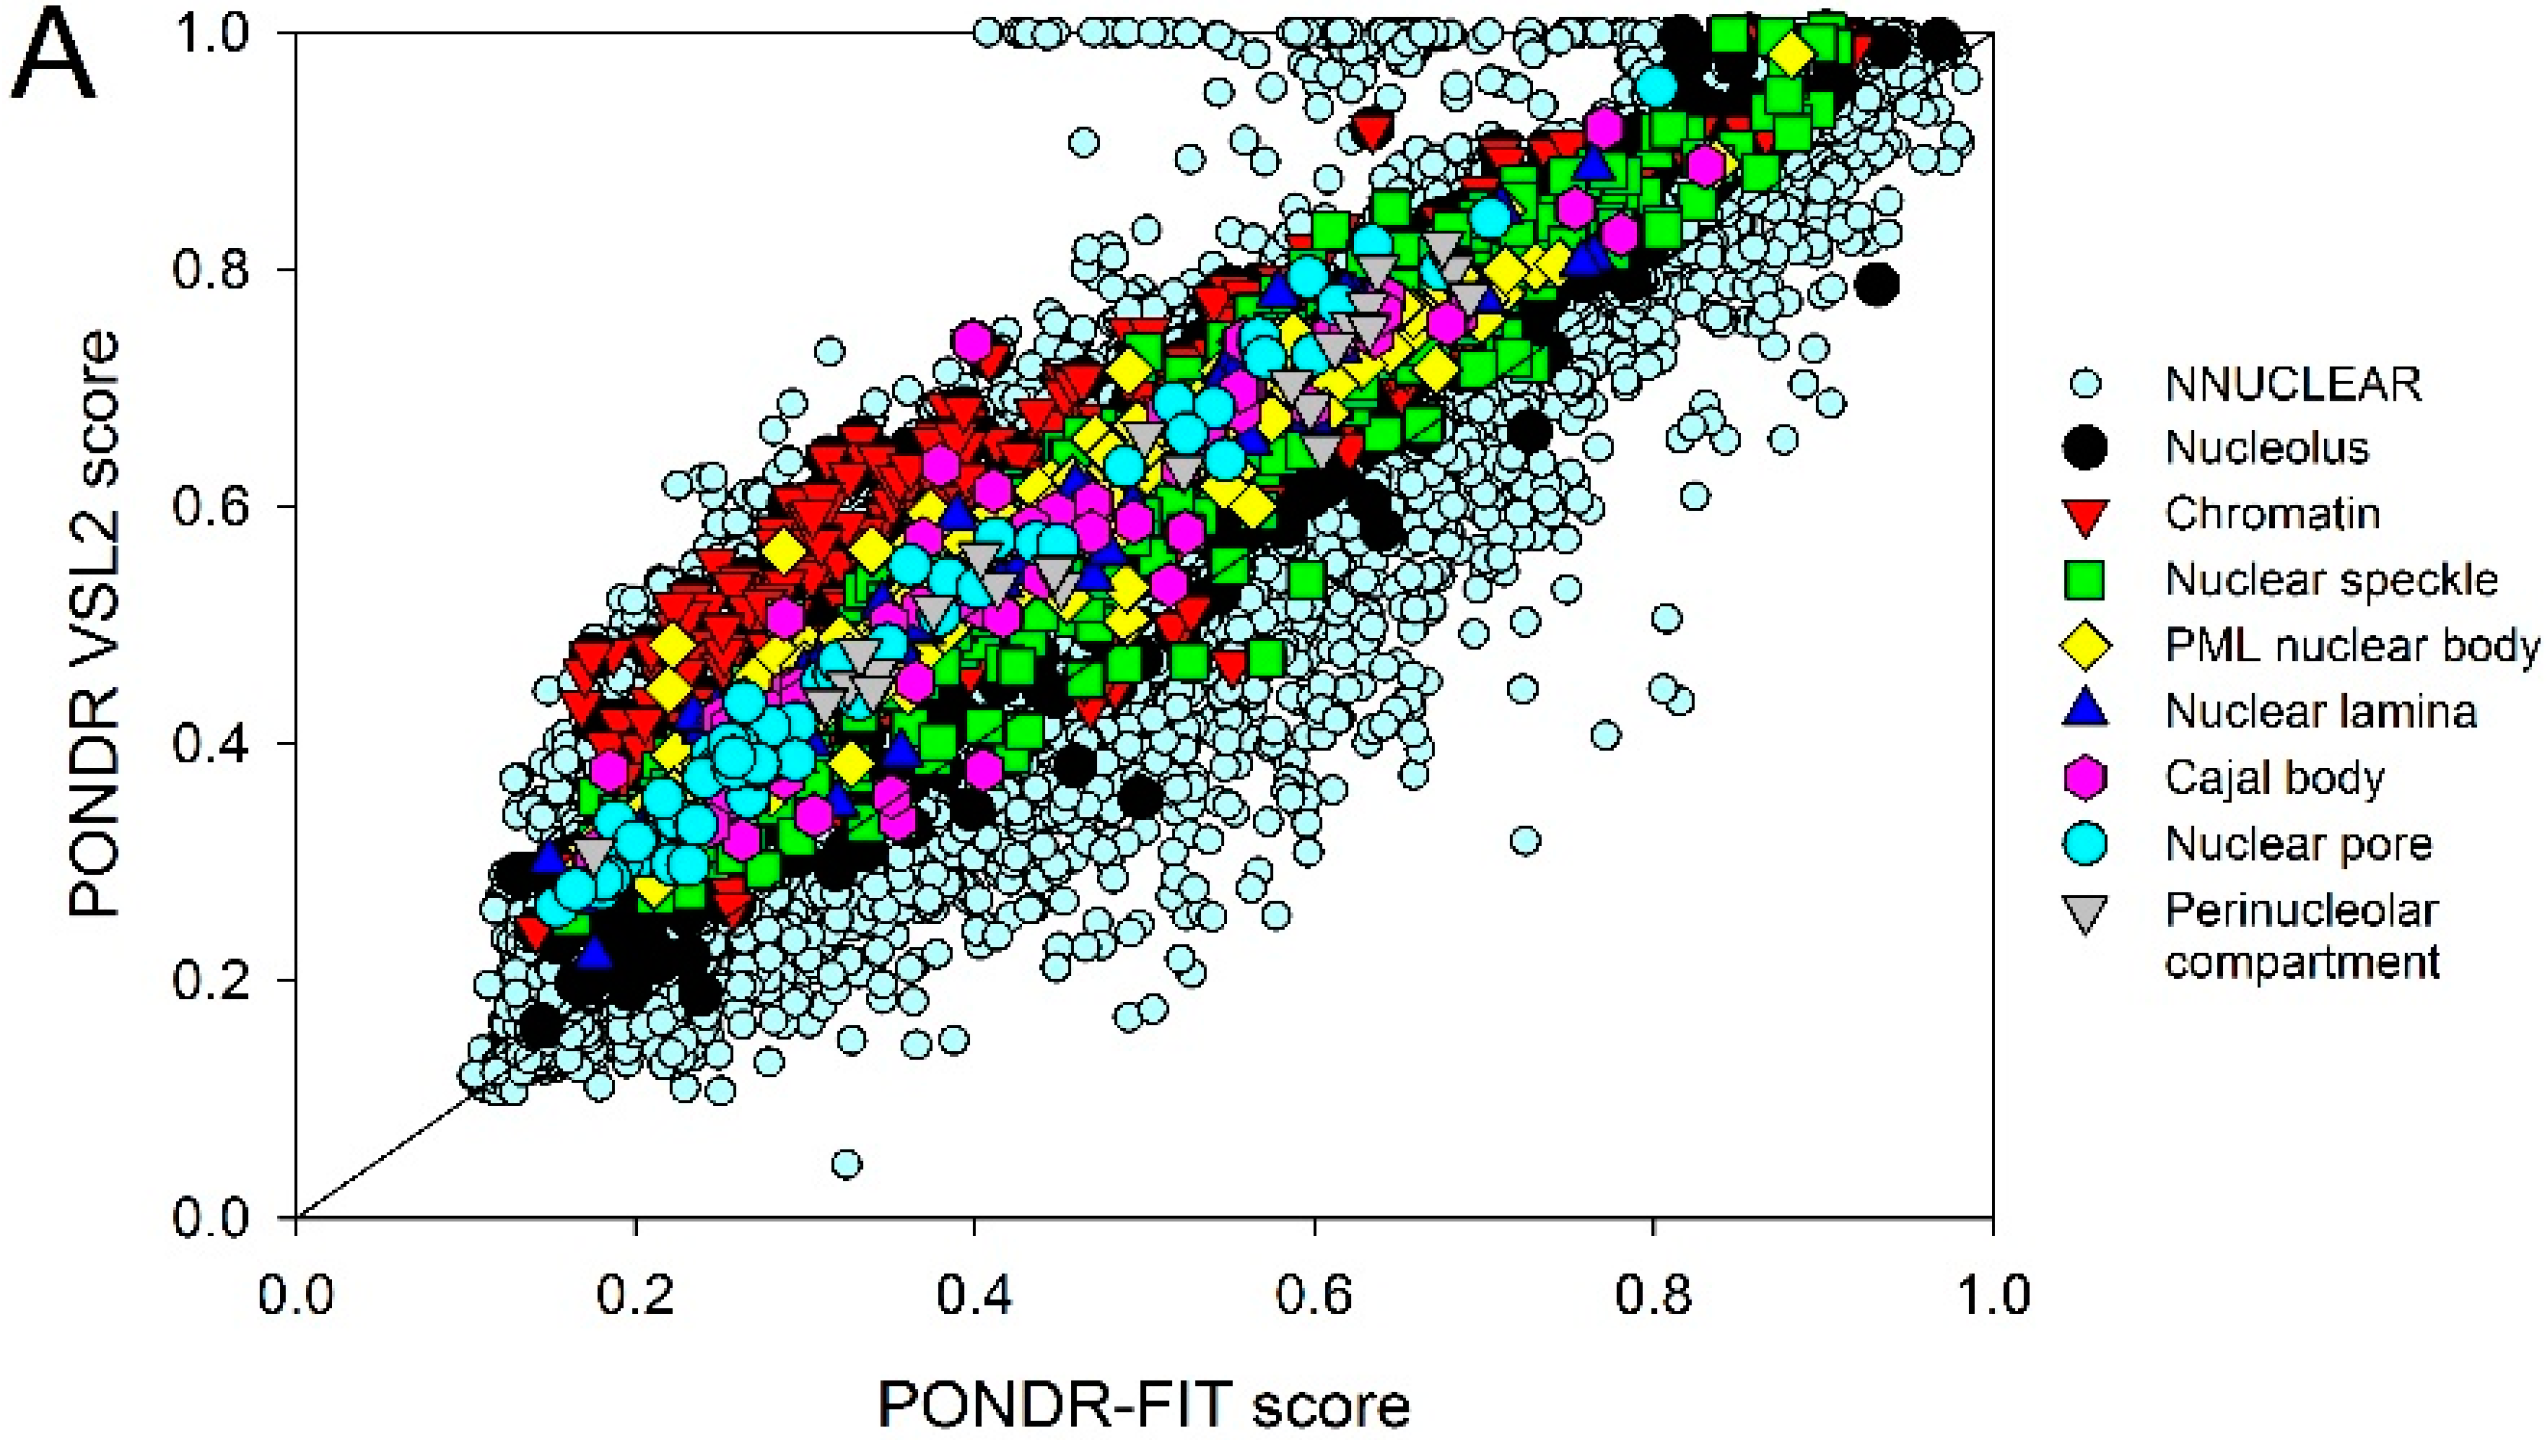
3.3. Disorder Sub-Classification of Mouse Proteins Based on the Charge/Hydropathy-Cumulative Distribution Function Analysis
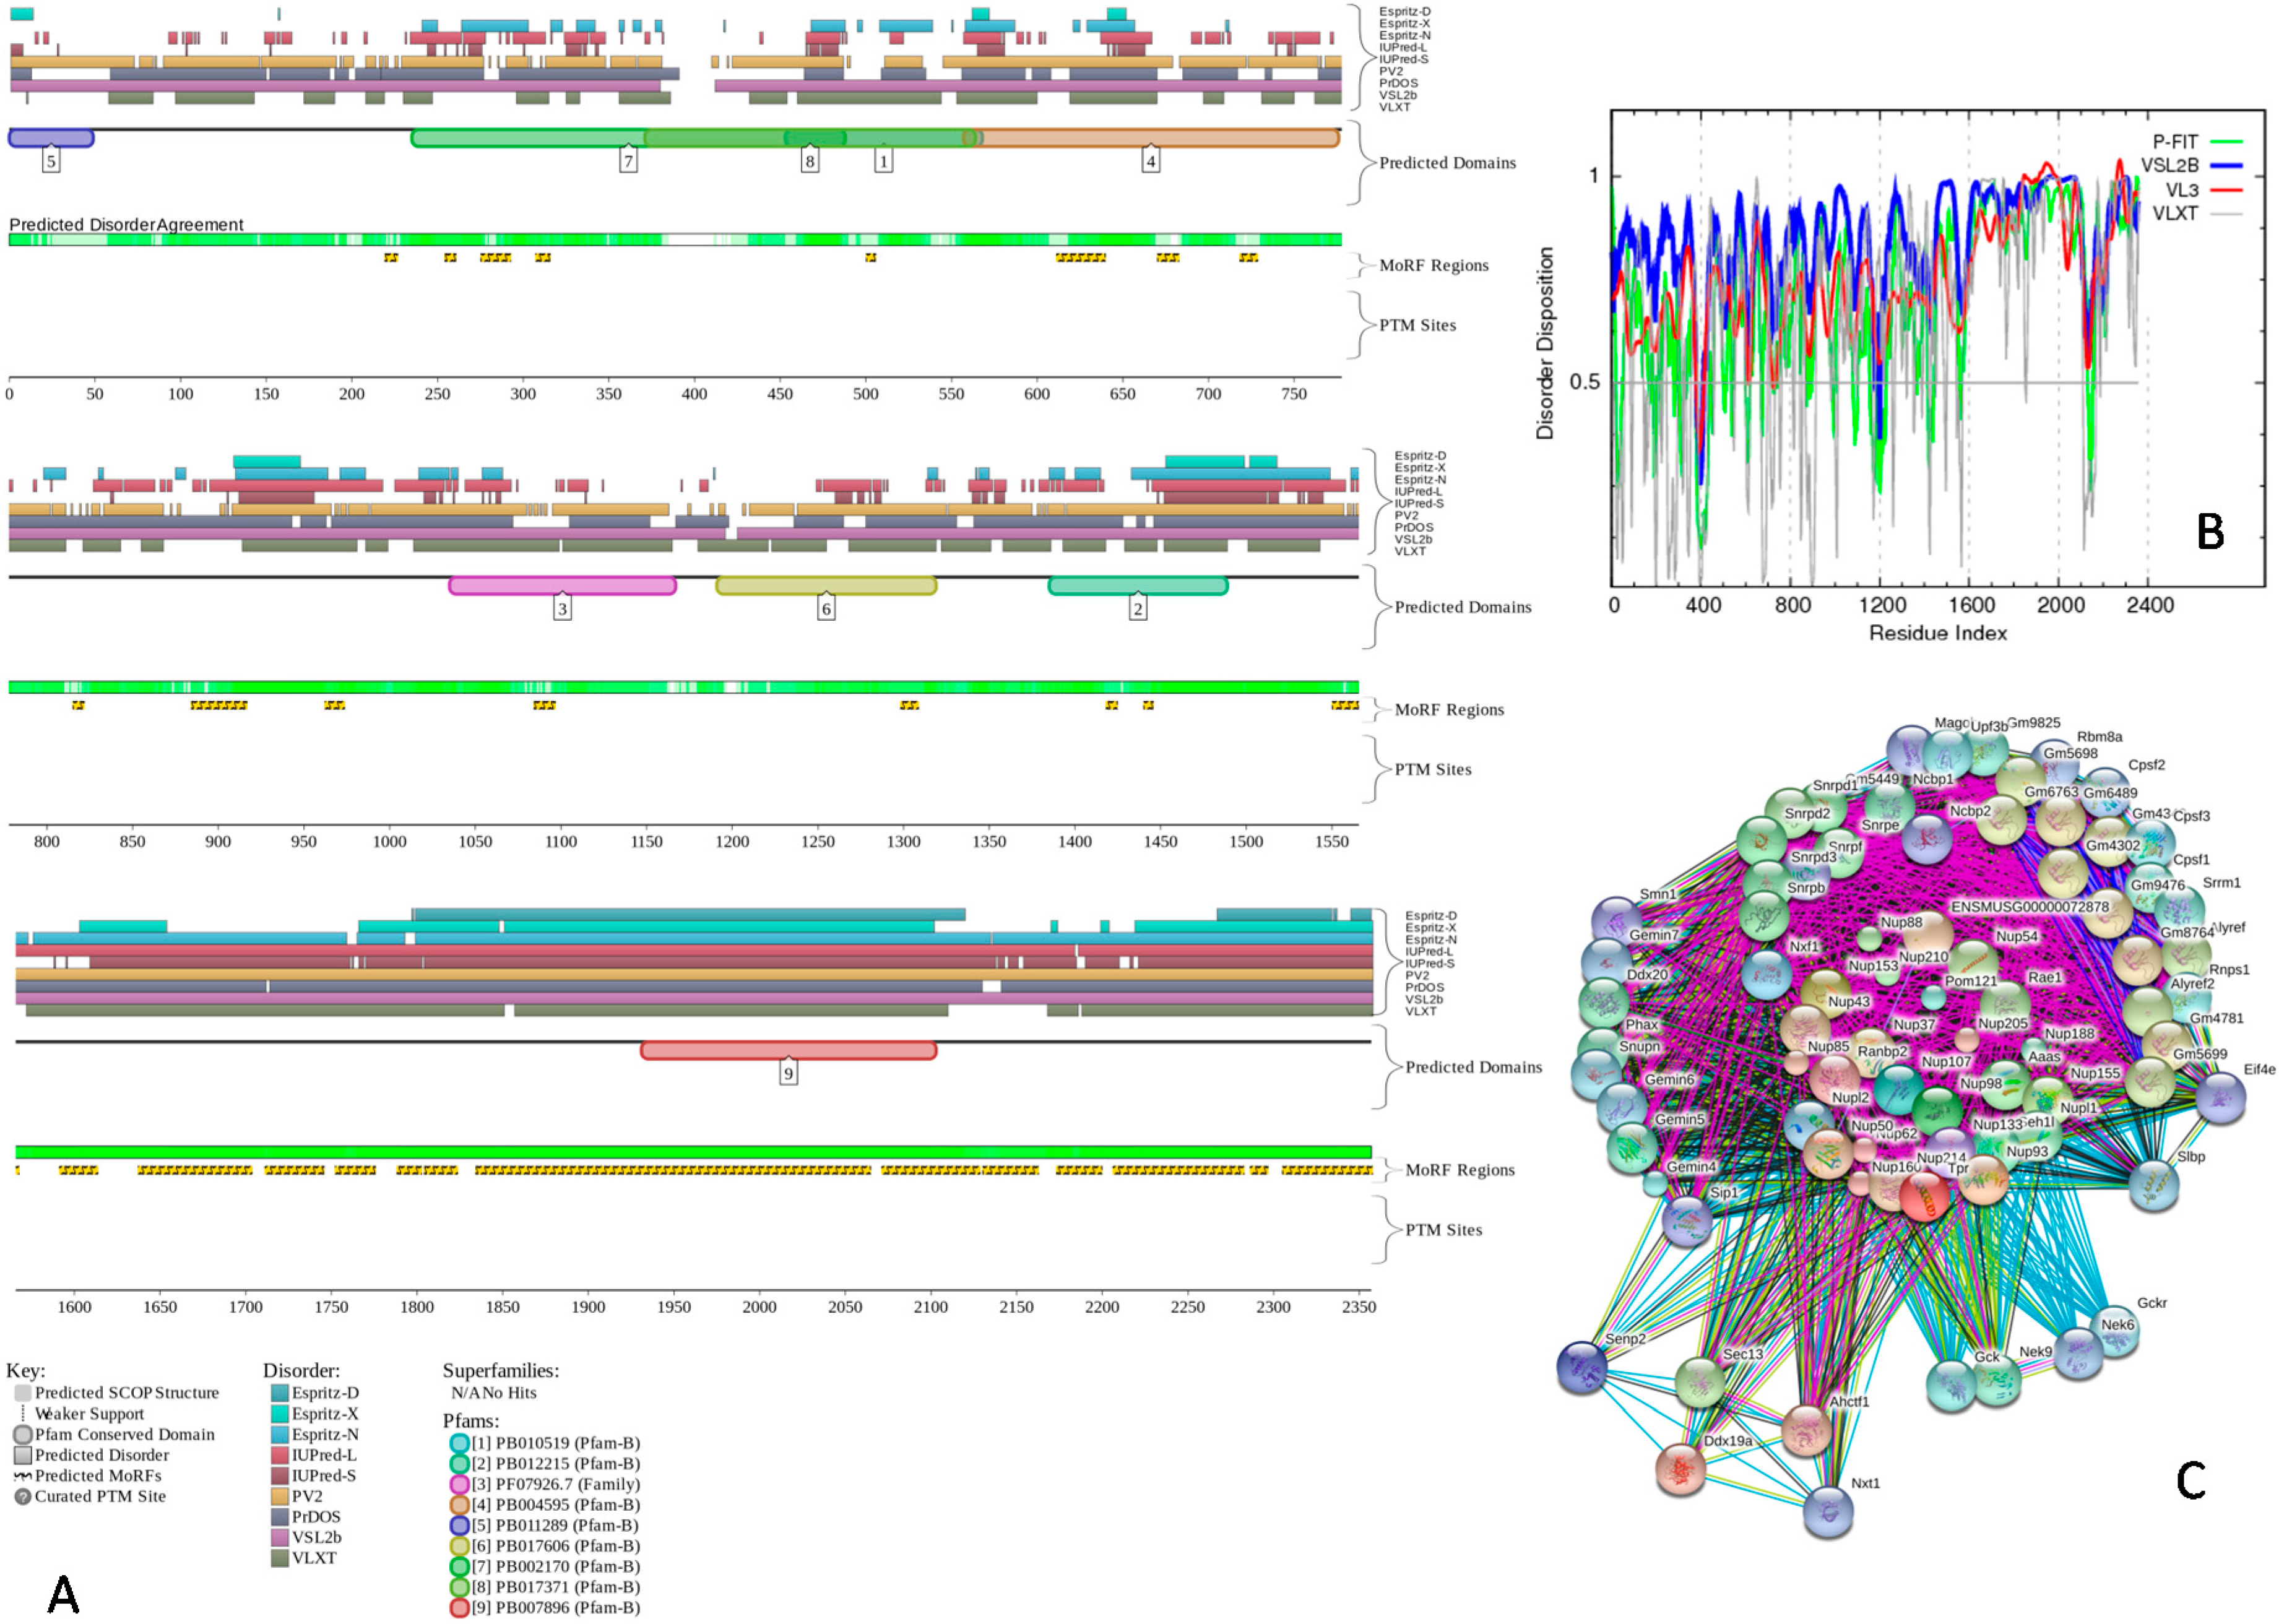
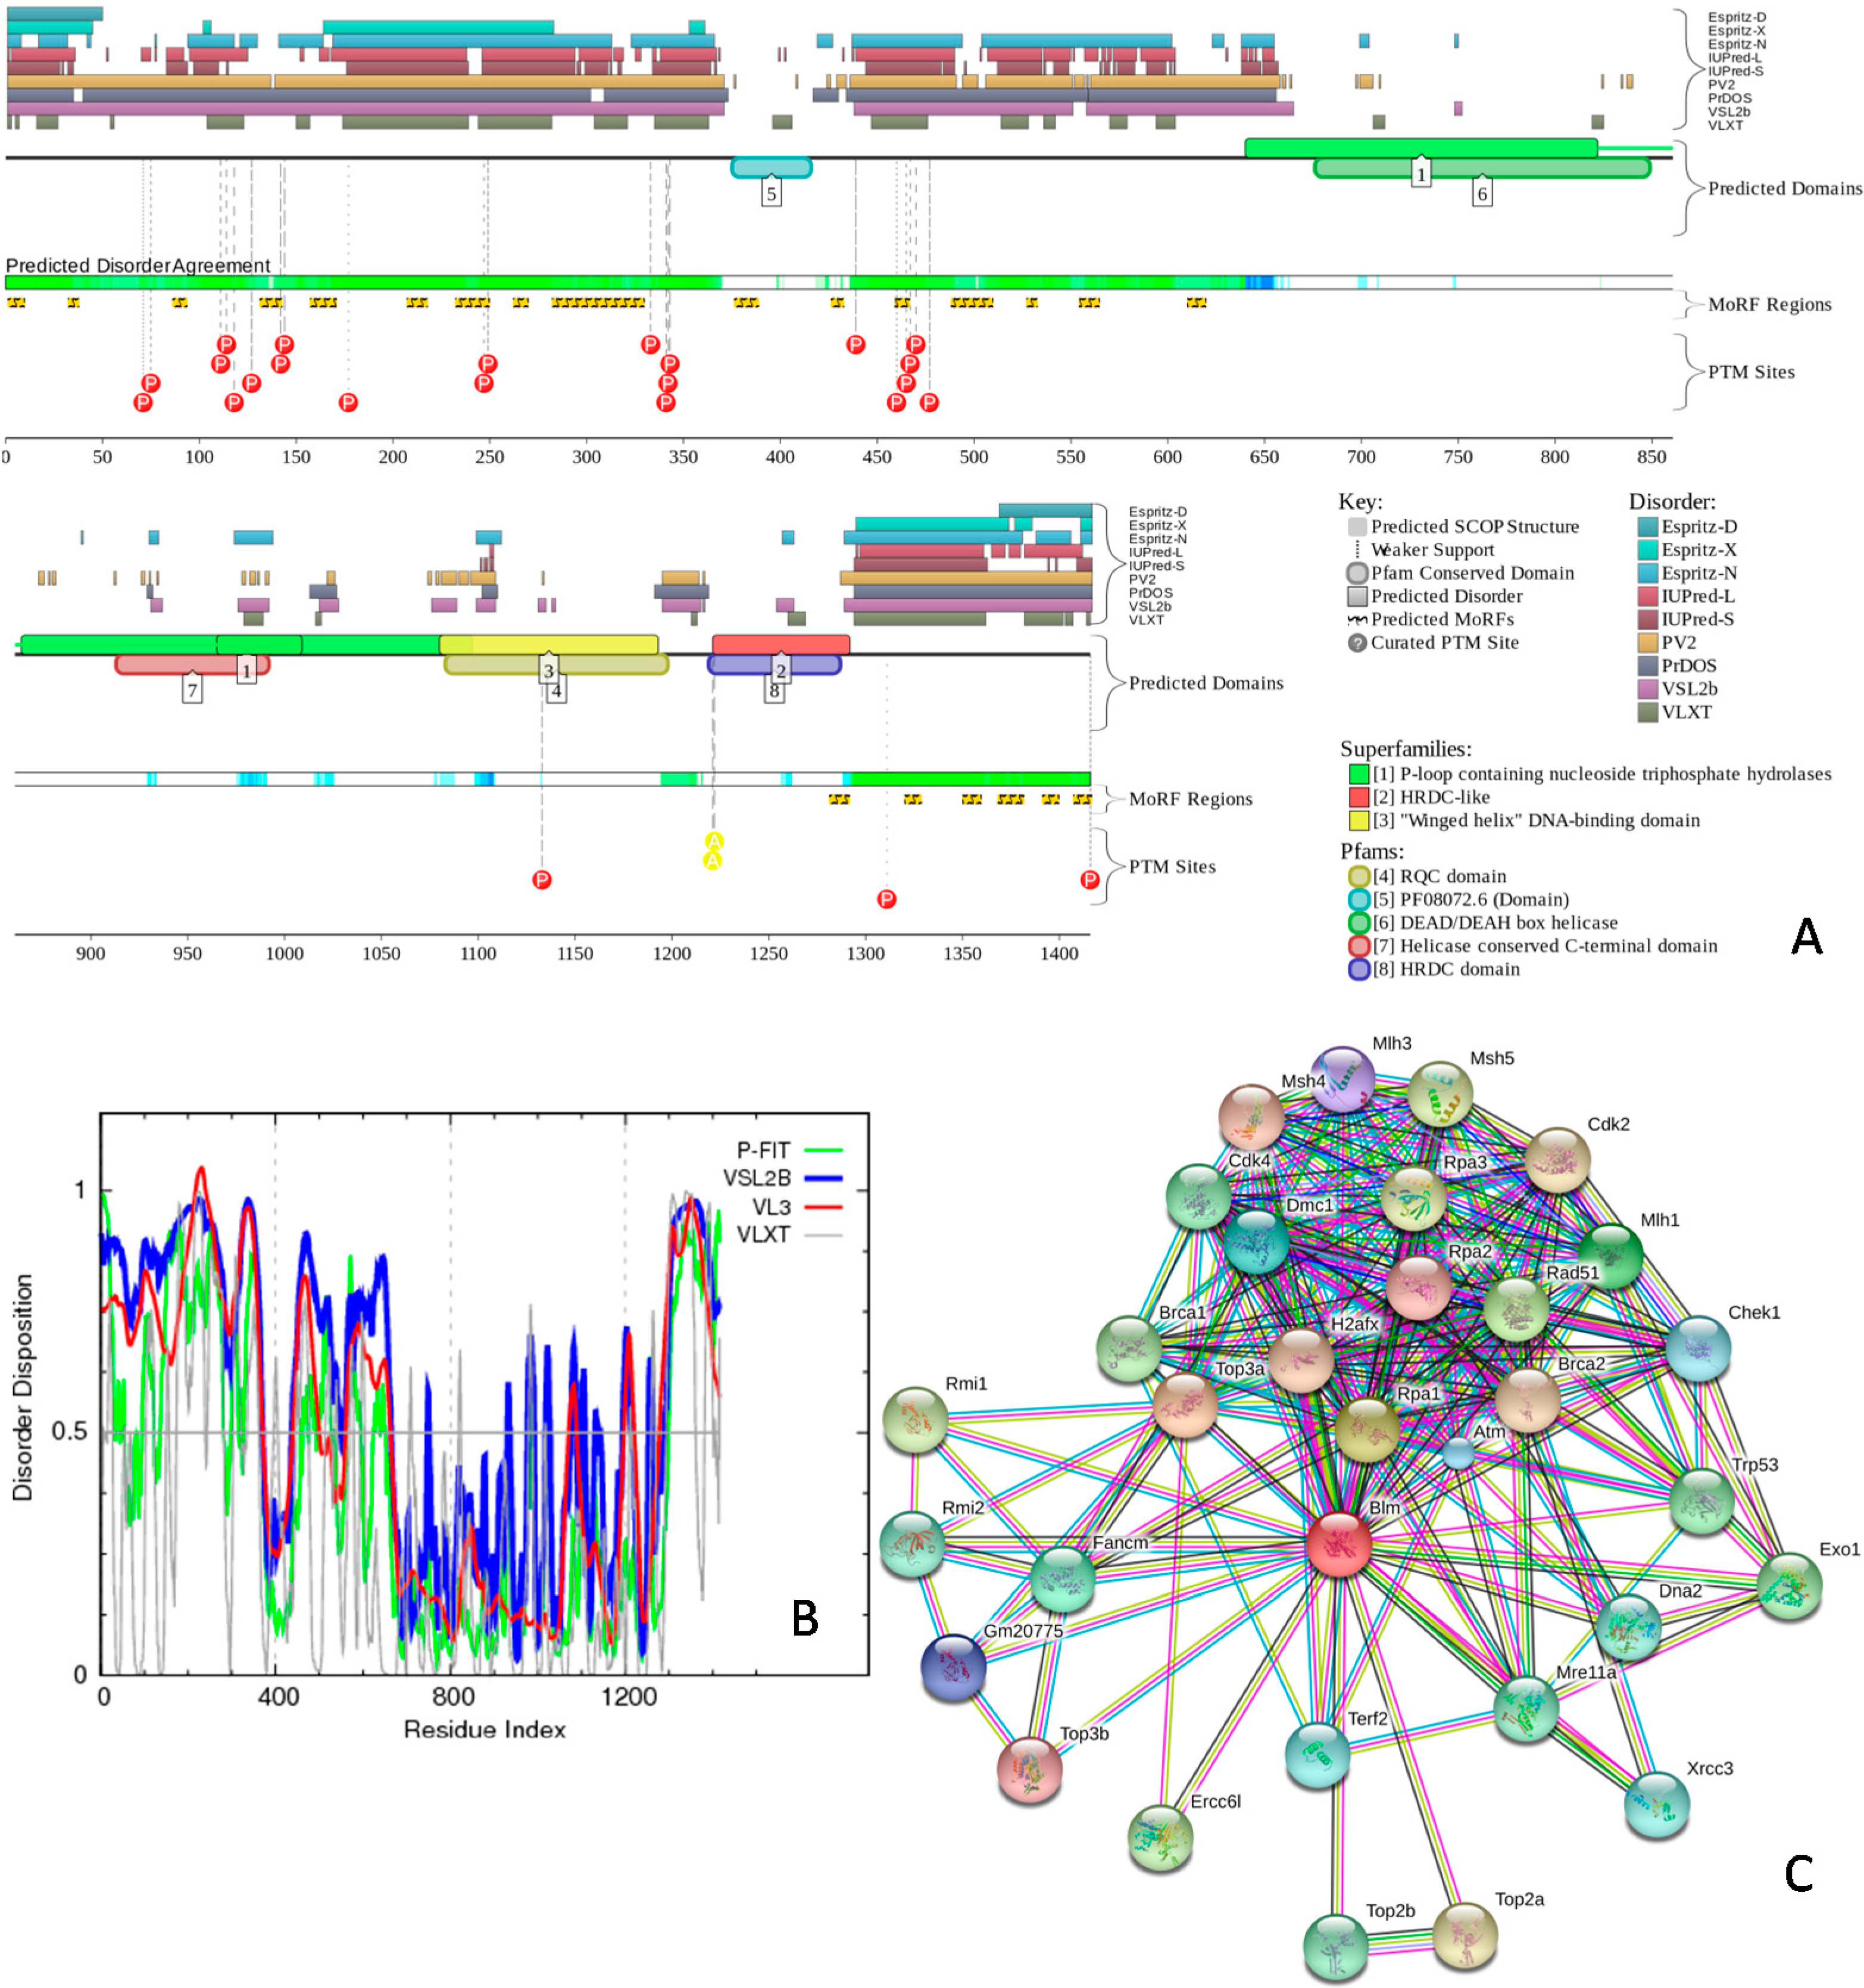
3.4. Disorder and Disorder—Based Functional Analysis of Selected Mouse Nuclear Proteins with Consensus Disorder Predictors, PONDR Predictors, D2P2, STRING, and ANCHOR
3.5. Statistical Analysis
4. Conclusions
Supplementary Materials
Acknowledgments
Author Contributions
Conflicts of Interest
References
- Goodsell, D.S. Miniseries: Illustrating the machinery of life: Eukaryotic cell panorama. Biochem. Mol. Biol. Educ. 2011, 39, 91–101. [Google Scholar] [CrossRef] [PubMed]
- Tripathi, V.; Prasanth, K.V. Cell nucleus. In eLS; John Wiley & Sons Ltd.: Chichester, UK, 2011. [Google Scholar]
- Hancock, R.; Jeon, K. New Models of the Cell Nucleus: Crowding, Entropic Forces, Phase Separation, and Fractals; Academic Press: Amsterdam, The Netherlands; Boston, MA, USA; Heidelberg, Germany; London, UK; New York, NY, USA; Oxford, UK; Paris, France; San Diego, CA, USA; San Francisco, CA, USA; Singapoe; Sydney, Austrilia; Tokyo, Jaoan, 2014; p. 512. [Google Scholar]
- Jevtic, P.; Edens, L.J.; Vukovic, L.D.; Levy, D.L. Sizing and shaping the nucleus: Mechanisms and significance. Curr. Opin. Cell Biol. 2014, 28, 16–27. [Google Scholar] [CrossRef] [PubMed]
- Fakan, S. The functional architecture of the nucleus as analysed by ultrastructural cytochemistry. Histochem. Cell Biol. 2004, 122, 83–93. [Google Scholar] [CrossRef] [PubMed]
- Handwerger, K.E.; Gall, J.G. Sub-nuclear organelles: New insights into form and function. Trends Cell Biol. 2006, 16, 19–26. [Google Scholar] [CrossRef] [PubMed]
- Phair, R.D.; Misteli, T. High mobility of proteins in the mammalian cell nucleus. Nature 2000, 404, 604–609. [Google Scholar] [PubMed]
- Pederson, T. Protein mobility within the nucleus—What are the right moves? Cell 2001, 104, 635–638. [Google Scholar] [CrossRef]
- Brangwynne, C.P.; Eckmann, C.R.; Courson, D.S.; Rybarska, A.; Hoege, C.; Gharakhani, J.; Julicher, F.; Hyman, A.A. Germline p granules are liquid droplets that localize by controlled dissolution/condensation. Science 2009, 324, 1729–1732. [Google Scholar] [CrossRef] [PubMed]
- Brangwynne, C.P.; Mitchison, T.J.; Hyman, A.A. Active liquid-like behavior of nucleoli determines their size and shape in xenopus laevis oocytes. Proc. Natl. Acad. Sci. USA 2011, 108, 4334–4339. [Google Scholar] [CrossRef] [PubMed]
- Li, P.; Banjade, S.; Cheng, H.C.; Kim, S.; Chen, B.; Guo, L.; Llaguno, M.; Hollingsworth, J.V.; King, D.S.; Banani, S.F.; et al. Phase transitions in the assembly of multivalent signalling proteins. Nature 2012, 483, 336–340. [Google Scholar] [CrossRef] [PubMed]
- Aggarwal, S.; Snaidero, N.; Pahler, G.; Frey, S.; Sanchez, P.; Zweckstetter, M.; Janshoff, A.; Schneider, A.; Weil, M.T.; Schaap, I.A.; et al. Myelin membrane assembly is driven by a phase transition of myelin basic proteins into a cohesive protein meshwork. PLoS Biol. 2013, 11, e1001577. [Google Scholar] [CrossRef] [PubMed]
- Feric, M.; Brangwynne, C.P. A nuclear F-actin scaffold stabilizes ribonucleoprotein droplets against gravity in large cells. Nat. Cell Biol. 2013, 15, 1253–1259. [Google Scholar] [CrossRef] [PubMed]
- Wippich, F.; Bodenmiller, B.; Trajkovska, M.G.; Wanka, S.; Aebersold, R.; Pelkmans, L. Dual specificity kinase DYRK3 couples stress granule condensation/dissolution to mTORC1 signaling. Cell 2013, 152, 791–805. [Google Scholar] [CrossRef] [PubMed]
- Spector, D.L. Nuclear domains. J. Cell Sci. 2001, 114, 2891–2893. [Google Scholar] [PubMed]
- Hernandez-Verdun, D.; Roussel, P.; Thiry, M.; Sirri, V.; Lafontaine, D.L. The nucleolus: Structure/function relationship in RNA metabolism. Wiley Interdiscip. Rev. RNA 2010, 1, 415–431. [Google Scholar] [CrossRef] [PubMed]
- Boisvert, F.M.; van Koningsbruggen, S.; Navascues, J.; Lamond, A.I. The multifunctional nucleolus. Nat. Rev. Mol. Cell Biol. 2007, 8, 574–585. [Google Scholar] [CrossRef] [PubMed]
- Li, B.; Carey, M.; Workman, J.L. The role of chromatin during transcription. Cell 2007, 128, 707–719. [Google Scholar] [CrossRef] [PubMed]
- Kornberg, R.D. Chromatin structure: A repeating unit of histones and DNA. Science 1974, 184, 868–871. [Google Scholar] [CrossRef] [PubMed]
- Luger, K.; Mader, A.W.; Richmond, R.K.; Sargent, D.F.; Richmond, T.J. Crystal structure of the nucleosome core particle at 2.8 A resolution. Nature 1997, 389, 251–260. [Google Scholar] [PubMed]
- Li, G.; Reinberg, D. Chromatin higher-order structures and gene regulation. Curr. Opin. Genet. Dev. 2011, 21, 175–186. [Google Scholar] [CrossRef] [PubMed]
- Robinson, P.J.; Fairall, L.; Huynh, V.A.; Rhodes, D. EM measurements define the dimensions of the “30-nm” chromatin fiber: Evidence for a compact, interdigitated structure. Proc. Natl. Acad. Sci. USA 2006, 103, 6506–6511. [Google Scholar] [CrossRef] [PubMed]
- Cremer, T.; Cremer, M.; Dietzel, S.; Muller, S.; Solovei, I.; Fakan, S. Chromosome territories—A functional nuclear landscape. Curr. Opin. Cell Biol. 2006, 18, 307–316. [Google Scholar] [CrossRef] [PubMed]
- Cremer, T.; Cremer, M. Chromosome territories. Cold Spring Harb. Perspect. Biol. 2010, 2, a003889. [Google Scholar] [CrossRef] [PubMed]
- Spector, D.L. Macromolecular domains within the cell nucleus. Annu. Rev. Cell Biol. 1993, 9, 265–315. [Google Scholar] [CrossRef] [PubMed]
- Ogg, S.C.; Lamond, A.I. Cajal bodies and coilin—Moving towards function. J. Cell Biol. 2002, 159, 17–21. [Google Scholar] [CrossRef] [PubMed]
- Morris, G.E. The cajal body. Biochim. Biophys. Acta 2008, 1783, 2108–2115. [Google Scholar] [CrossRef] [PubMed]
- Maul, G.G.; Negorev, D.; Bell, P.; Ishov, A.M. Review: Properties and assembly mechanisms of ND10, PML bodies, or PODs. J. Struct. Biol. 2000, 129, 278–287. [Google Scholar] [CrossRef] [PubMed]
- Boisvert, F.M.; Hendzel, M.J.; Bazett-Jones, D.P. Promyelocytic leukemia (PML) nuclear bodies are protein structures that do not accumulate RNA. J. Cell Biol. 2000, 148, 283–292. [Google Scholar] [CrossRef] [PubMed]
- Luciani, J.J.; Depetris, D.; Usson, Y.; Metzler-Guillemain, C.; Mignon-Ravix, C.; Mitchell, M.J.; Megarbane, A.; Sarda, P.; Sirma, H.; Moncla, A.; et al. PML nuclear bodies are highly organised DNA-protein structures with a function in heterochromatin remodelling at the G2 phase. J. Cell Sci. 2006, 119, 2518–2531. [Google Scholar] [CrossRef] [PubMed]
- Alberts, B.; Johnson, A.; Lewis, J.; Raff, M.; Robers, K.; Walter, P. Intracellular compartments and protein sorting. In Molecular Biology of the Cell; Garland Science: New York, NY, USA, 2008; pp. 695–724. [Google Scholar]
- Mor, A.; White, M.A.; Fontoura, B.M. Nuclear trafficking in health and disease. Curr. Opin. Cell Biol. 2014, 28, 28–35. [Google Scholar] [CrossRef] [PubMed]
- Laba, J.K.; Steen, A.; Veenhoff, L.M. Traffic to the inner membrane of the nuclear envelope. Curr. Opin. Cell Biol. 2014, 28, 36–45. [Google Scholar] [CrossRef] [PubMed]
- Amendola, M.; van Steensel, B. Mechanisms and dynamics of nuclear lamina-genome interactions. Curr. Opin. Cell Biol. 2014, 28, 61–68. [Google Scholar] [CrossRef] [PubMed]
- Grossman, E.; Medalia, O.; Zwerger, M. Functional architecture of the nuclear pore complex. Annu. Rev. Biophys. 2012, 41, 557–584. [Google Scholar] [CrossRef] [PubMed]
- Strambio-De-Castillia, C.; Niepel, M.; Rout, M.P. The nuclear pore complex: Bridging nuclear transport and gene regulation. Nat. Rev. Mol. Cell Biol. 2010, 11, 490–501. [Google Scholar] [CrossRef] [PubMed]
- Hoelz, A.; Debler, E.W.; Blobel, G. The structure of the nuclear pore complex. Annu. Rev. Biochem. 2011, 80, 613–643. [Google Scholar] [CrossRef] [PubMed]
- Matera, A.G.; Frey, M.R.; Margelot, K.; Wolin, S.L. A perinucleolar compartment contains several RNA polymerase III transcripts as well as the polypyrimidine tract-binding protein, hnRNP I. J. Cell Biol. 1995, 129, 1181–1193. [Google Scholar] [CrossRef] [PubMed]
- Huang, S.; Deerinck, T.J.; Ellisman, M.H.; Spector, D.L. The dynamic organization of the perinucleolar compartment in the cell nucleus. J. Cell Biol. 1997, 137, 965–974. [Google Scholar] [CrossRef] [PubMed]
- Pollock, C.; Huang, S. The perinucleolar compartment. Cold Spring Harb. Perspect. Biol. 2010, 2, a000679. [Google Scholar] [CrossRef] [PubMed]
- Decker, M.; Jaensch, S.; Pozniakovsky, A.; Zinke, A.; O’Connell, K.F.; Zachariae, W.; Myers, E.; Hyman, A.A. Limiting amounts of centrosome material set centrosome size in C. elegans embryos. Curr. Biol. 2011, 21, 1259–1267. [Google Scholar] [CrossRef] [PubMed]
- Brangwynne, C.P. Phase transitions and size scaling of membrane-less organelles. J. Cell Biol. 2013, 203, 875–881. [Google Scholar] [CrossRef] [PubMed]
- Dunker, A.K.; Garner, E.; Guilliot, S.; Romero, P.; Albrecht, K.; Hart, J.; Obradovic, Z.; Kissinger, C.; Villafranca, J.E. Protein disorder and the evolution of molecular recognition: Theory, predictions and observations. Pac. Symp. Biocomput. 1998, 473–484. [Google Scholar]
- Wright, P.E.; Dyson, H.J. Intrinsically unstructured proteins: Re-assessing the protein structure-function paradigm. J. Mol. Biol. 1999, 293, 321–331. [Google Scholar] [CrossRef] [PubMed]
- Uversky, V.N.; Gillespie, J.R.; Fink, A.L. Why are “natively unfolded” proteins unstructured under physiologic conditions? Proteins 2000, 41, 415–427. [Google Scholar] [CrossRef]
- Dunker, A.K.; Lawson, J.D.; Brown, C.J.; Williams, R.M.; Romero, P.; Oh, J.S.; Oldfield, C.J.; Campen, A.M.; Ratliff, C.M.; Hipps, K.W.; et al. Intrinsically disordered protein. J. Mol. Graph. Model. 2001, 19, 26–59. [Google Scholar] [CrossRef]
- Tompa, P. Intrinsically unstructured proteins. Trends Biochem. Sci. 2002, 27, 527–533. [Google Scholar] [CrossRef]
- Daughdrill, G.W.; Pielak, G.J.; Uversky, V.N.; Cortese, M.S.; Dunker, A.K. Natively disordered proteins. In Handbook of Protein Folding; Buchner, J., Kiefhaber, T., Eds.; Wiley-VCH, Verlag GmbH & Co.: Weinheim, Germany, 2005; pp. 271–353. [Google Scholar]
- Uversky, V.N.; Dunker, A.K. Understanding protein non-folding. Biochim. Biophys. Acta 2010, 1804, 1231–1264. [Google Scholar] [CrossRef] [PubMed]
- Dunker, A.K.; Obradovic, Z.; Romero, P.; Garner, E.C.; Brown, C.J. Intrinsic protein disorder in complete genomes. Genome Inform. Ser. Workshop Genome Inform. 2000, 11, 161–171. [Google Scholar] [PubMed]
- Romero, P.; Obradovic, Z.; Kissinger, C.R.; Villafranca, J.E.; Garner, E.; Guilliot, S.; Dunker, A.K. Thousands of proteins likely to have long disordered regions. Pac. Symp. Biocomput. 1998, 437–448. [Google Scholar]
- Ward, J.J.; Sodhi, J.S.; McGuffin, L.J.; Buxton, B.F.; Jones, D.T. Prediction and functional analysis of native disorder in proteins from the three kingdoms of life. J. Mol. Biol. 2004, 337, 635–645. [Google Scholar] [CrossRef] [PubMed]
- Oldfield, C.J.; Cheng, Y.; Cortese, M.S.; Brown, C.J.; Uversky, V.N.; Dunker, A.K. Comparing and combining predictors of mostly disordered proteins. Biochemistry 2005, 44, 1989–2000. [Google Scholar] [CrossRef] [PubMed]
- Xue, B.; Dunker, A.K.; Uversky, V.N. Orderly order in protein intrinsic disorder distribution: Disorder in 3500 proteomes from viruses and the three domains of life. J. Biomol. Struct. Dyn. 2012, 30, 137–149. [Google Scholar] [CrossRef] [PubMed]
- Oates, M.E.; Romero, P.; Ishida, T.; Ghalwash, M.; Mizianty, M.J.; Xue, B.; Dosztanyi, Z.; Uversky, V.N.; Obradovic, Z.; Kurgan, L.; et al. D2P2: Database of disordered protein predictions. Nucleic Acids Res. 2013, 41, D508–D516. [Google Scholar] [CrossRef] [PubMed]
- Peng, Z.; Yan, J.; Fan, X.; Mizianty, M.J.; Xue, B.; Wang, K.; Hu, G.; Uversky, V.N.; Kurgan, L. Exceptionally abundant exceptions: Comprehensive characterization of intrinsic disorder in all domains of life. Cell. Mol. Life Sci. 2015, 72, 137–151. [Google Scholar] [CrossRef] [PubMed]
- Iakoucheva, L.M.; Brown, C.J.; Lawson, J.D.; Obradovic, Z.; Dunker, A.K. Intrinsic disorder in cell-signaling and cancer-associated proteins. J. Mol. Biol. 2002, 323, 573–584. [Google Scholar] [CrossRef]
- Dunker, A.K.; Cortese, M.S.; Romero, P.; Iakoucheva, L.M.; Uversky, V.N. Flexible nets: The roles of intrinsic disorder in protein interaction networks. FEBS J. 2005, 272, 5129–5148. [Google Scholar] [CrossRef] [PubMed]
- Uversky, V.N.; Oldfield, C.J.; Dunker, A.K. Showing your ID: Intrinsic disorder as an id for recognition, regulation and cell signaling. J. Mol. Recognit. 2005, 18, 343–384. [Google Scholar] [CrossRef] [PubMed]
- Wright, P.E.; Dyson, H.J. Intrinsically disordered proteins in cellular signalling and regulation. Nat. Rev. Mol. Cell Biol. 2015, 16, 18–29. [Google Scholar] [CrossRef] [PubMed]
- Marasco, D.; Scognamiglio, P.L. Identification of inhibitors of biological interactions involving intrinsically disordered proteins. Int. J. Mol. Sci. 2015, 16, 7394–7412. [Google Scholar] [CrossRef] [PubMed]
- Radivojac, P.; Iakoucheva, L.M.; Oldfield, C.J.; Obradovic, Z.; Uversky, V.N.; Dunker, A.K. Intrinsic disorder and functional proteomics. Biophys. J. 2007, 92, 1439–1456. [Google Scholar] [CrossRef] [PubMed]
- Vucetic, S.; Xie, H.; Iakoucheva, L.M.; Oldfield, C.J.; Dunker, A.K.; Obradovic, Z.; Uversky, V.N. Functional anthology of intrinsic disorder. 2. Cellular components, domains, technical terms, developmental processes, and coding sequence diversities correlated with long disordered regions. J. Proteome Res. 2007, 6, 1899–1916. [Google Scholar] [CrossRef] [PubMed]
- Xie, H.; Vucetic, S.; Iakoucheva, L.M.; Oldfield, C.J.; Dunker, A.K.; Obradovic, Z.; Uversky, V.N. Functional anthology of intrinsic disorder. 3. Ligands, post-translational modifications, and diseases associated with intrinsically disordered proteins. J. Proteome Res. 2007, 6, 1917–1932. [Google Scholar] [CrossRef] [PubMed]
- Xie, H.; Vucetic, S.; Iakoucheva, L.M.; Oldfield, C.J.; Dunker, A.K.; Uversky, V.N.; Obradovic, Z. Functional anthology of intrinsic disorder. 1. Biological processes and functions of proteins with long disordered regions. J. Proteome Res. 2007, 6, 1882–1898. [Google Scholar] [CrossRef] [PubMed]
- Frege, T.; Uversky, V.N. Intrinsically disordered proteins in the nucleus of human cells. Biochem. Biophys. Rep. 2015, 1, 33–51. [Google Scholar] [CrossRef]
- Hetzer, M.W.; Walther, T.C.; Mattaj, I.W. Pushing the envelope: Structure, function, and dynamics of the nuclear periphery. Annu. Rev. Cell Dev. Biol. 2005, 21, 347–380. [Google Scholar] [CrossRef] [PubMed]
- Xue, B.; Dunbrack, R.L.; Williams, R.W.; Dunker, A.K.; Uversky, V.N. Pondr-fit: A meta-predictor of intrinsically disordered amino acids. Biochim. Biophys. Acta 2010, 1804, 996–1010. [Google Scholar] [CrossRef] [PubMed]
- Peng, K.; Vucetic, S.; Radivojac, P.; Brown, C.J.; Dunker, A.K.; Obradovic, Z. Optimizing long intrinsic disorder predictors with protein evolutionary information. J. Bioinform. Comput. Biol. 2005, 3, 35–60. [Google Scholar] [CrossRef] [PubMed]
- Walsh, I.; Martin, A.J.M.; di Domenico, T.; Tosatto, S.C.E. Espritz: Accurate and fast prediction of protein disorder. Bioinformatics 2012, 28, 503–509. [Google Scholar] [CrossRef] [PubMed]
- Dosztányi, Z.; Csizmok, V.; Tompa, P.; Simon, I. Iupred: Web server for the prediction of intrinsically unstructured regions of proteins based on estimated energy content. Bioinformatics 2005, 21, 3433–3434. [Google Scholar] [CrossRef] [PubMed]
- Meszaros, B.; Simon, I.; Dosztanyi, Z. Prediction of protein binding regions in disordered proteins. PLoS Comput. Biol. 2009, 5, e1000376. [Google Scholar] [CrossRef] [PubMed]
- Dosztanyi, Z.; Meszaros, B.; Simon, I. Anchor: Web server for predicting protein binding regions in disordered proteins. Bioinformatics 2009, 25, 2745–2746. [Google Scholar] [CrossRef] [PubMed]
- Di Domenico, T.; Walsh, I.; Martin, A.J.; Tosatto, S.C. Mobidb: A comprehensive database of intrinsic protein disorder annotations. Bioinformatics 2012, 28, 2080–2081. [Google Scholar] [CrossRef] [PubMed]
- Potenza, E.; Domenico, T.D.; Walsh, I.; Tosatto, S.C. Mobidb 2.0: An improved database of intrinsically disordered and mobile proteins. Nucleic Acids Res. 2015. [Google Scholar] [CrossRef] [PubMed]
- Iakoucheva, L.M.; Radivojac, P.; Brown, C.J.; O’Connor, T.R.; Sikes, J.G.; Obradovic, Z.; Dunker, A.K. The importance of intrinsic disorder for protein phosphorylation. Nucleic Acids Res. 2004, 32, 1037–1049. [Google Scholar] [CrossRef] [PubMed]
- Pejaver, V.; Hsu, W.L.; Xin, F.; Dunker, A.K.; Uversky, V.N.; Radivojac, P. The structural and functional signatures of proteins that undergo multiple events of post-translational modification. Protein Sci. 2014, 23, 1077–1093. [Google Scholar] [CrossRef] [PubMed]
- Szklarczyk, D.; Franceschini, A.; Kuhn, M.; Simonovic, M.; Roth, A.; Minguez, P.; Doerks, T.; Stark, M.; Muller, J.; Bork, P.; et al. The string database in 2011: Functional interaction networks of proteins, globally integrated and scored. Nucleic Acids Res. 2011, 39, D561–D568. [Google Scholar] [CrossRef] [PubMed]
- Romero, P.; Obradovic, Z.; Li, X.; Garner, E.C.; Brown, C.J.; Dunker, A.K. Sequence complexity of disordered protein. Proteins 2001, 42, 38–48. [Google Scholar] [CrossRef]
- Peng, K.; Radivojac, P.; Vucetic, S.; Dunker, A.K.; Obradovic, Z. Length-dependent prediction of protein intrinsic disorder. BMC Bioinform. 2006, 7, 208. [Google Scholar] [CrossRef] [PubMed]
- Patil, A.; Nakamura, H. Disordered domains and high surface charge confer hubs with the ability to interact with multiple proteins in interaction networks. FEBS Lett. 2006, 580, 2041–2045. [Google Scholar] [CrossRef] [PubMed]
- Haynes, C.; Oldfield, C.J.; Ji, F.; Klitgord, N.; Cusick, M.E.; Radivojac, P.; Uversky, V.N.; Vidal, M.; Iakoucheva, L.M. Intrinsic disorder is a common feature of hub proteins from four eukaryotic interactomes. PLoS Comput. Biol. 2006, 2, e100. [Google Scholar] [CrossRef] [PubMed]
- Ekman, D.; Light, S.; Bjorklund, A.K.; Elofsson, A. What properties characterize the hub proteins of the protein-protein interaction network of saccharomyces cerevisiae? Genome Biol. 2006, 7, R45. [Google Scholar] [CrossRef] [PubMed]
- Dosztanyi, Z.; Chen, J.; Dunker, A.K.; Simon, I.; Tompa, P. Disorder and sequence repeats in hub proteins and their implications for network evolution. J. Proteome Res. 2006, 5, 2985–2995. [Google Scholar] [CrossRef] [PubMed]
- Singh, G.P.; Ganapathi, M.; Sandhu, K.S.; Dash, D. Intrinsic unstructuredness and abundance of pest motifs in eukaryotic proteomes. Proteins 2006, 62, 309–315. [Google Scholar] [CrossRef] [PubMed]
- Willadsen, K.; Mohamad, N.; Bodén, M. NSort/DB: An intra-nuclear compartment protein database. Genom. Proteom. Bioinform. 2012, 10, 226–229. [Google Scholar] [CrossRef] [PubMed]
- Dellaire, G.; Farrall, R.; Bickmore, W.A. The nuclear protein database (NPD): Sub-nuclear localisation and functional annotation of the nuclear proteome. Nucleic Acids Res. 2003, 31, 328–330. [Google Scholar] [CrossRef] [PubMed]
- Leung, A.K.L.; Trinkle-Mulcahy, L.; Lam, Y.W.; Andersen, J.S.; Mann, M.; Lamond, A.I. NOPdb: Nucleolar proteome database. Nucleic Acids Res. 2006, 34, D218–D220. [Google Scholar] [CrossRef] [PubMed]
- Mika, S.; Rost, B. Nmpdb: Database of nuclear matrix proteins. Nucleic Acids Res. 2005, 33, D160–D163. [Google Scholar] [CrossRef] [PubMed]
- Consortium, T.U. Activities at the universal protein resource (UniProt). Nucleic Acids Res. 2014, 42, D191–D198. [Google Scholar] [CrossRef] [PubMed]
- Keshava-Prasad, T.S.; Goel, R.; Kandasamy, K.; Keerthikumar, S.; Kumar, S.; Mathivanan, S.; Telikicherla, D.; Raju, R.; Shafreen, B.; Venugopal, A.; et al. Human protein reference database—2009 update. Nucleic Acids Res. 2009, 37, D767–D772. [Google Scholar] [CrossRef] [PubMed]
- Bauer, D.C.; Willadsen, K.; Buske, F.A.; lê Cao, K.-A.; Bailey, T.L.; Dellaire, G.; Bodén, M. Sorting the nuclear proteome. Bioinformatics 2011, 27, i7–i14. [Google Scholar] [CrossRef] [PubMed]
- Calderone, A.; Castagnoli, L.; Cesareni, G. Mentha: A resource for browsing integrated protein-interaction networks. Nat. Methods 2013, 10, 690–691. [Google Scholar] [CrossRef] [PubMed]
- Han, J.D.; Bertin, N.; Hao, T.; Goldberg, D.S.; Berriz, G.F.; Zhang, L.V.; Dupuy, D.; Walhout, A.J.; Cusick, M.E.; Roth, F.P.; et al. Evidence for dynamically organized modularity in the yeast protein-protein interaction network. Nature 2004, 430, 88–93. [Google Scholar] [CrossRef] [PubMed]
- Bertin, N.; Simonis, N.; Dupuy, D.; Cusick, M.E.; Han, J.D.; Fraser, H.B.; Roth, F.P.; Vidal, M. Confirmation of organized modularity in the yeast interactome. PLoS Biol. 2007, 5, e153. [Google Scholar] [CrossRef] [PubMed]
- Yu, H.; Kim, P.M.; Sprecher, E.; Trifonov, V.; Gerstein, M. The importance of bottlenecks in protein networks: Correlation with gene essentiality and expression dynamics. PLoS Comput. Biol. 2007, 3, e59. [Google Scholar] [CrossRef] [PubMed]
- Walsh, I.; Giollo, M.; di Domenico, T.; Ferrari, C.; Zimmermann, O.; Tosatto, S.C. Comprehensive large-scale assessment of intrinsic protein disorder. Bioinformatics 2015, 31, 201–208. [Google Scholar] [CrossRef] [PubMed]
- Fan, X.; Kurgan, L. Accurate prediction of disorder in protein chains with a comprehensive and empirically designed consensus. J. Biomol. Struct. Dyn. 2014, 32, 448–464. [Google Scholar] [CrossRef] [PubMed]
- Peng, Z.; Kurgan, L. On the complementarity of the consensus-based disorder prediction. Pac. Symp. Biocomput. 2012, 176–187. [Google Scholar]
- Sickmeier, M.; Hamilton, J.A.; LeGall, T.; Vacic, V.; Cortese, M.S.; Tantos, A.; Szabo, B.; Tompa, P.; Chen, J.; Uversky, V.N.; et al. Disprot: The database of disordered proteins. Nucleic Acids Res. 2007, 35, D786–D793. [Google Scholar] [CrossRef] [PubMed]
- Howell, M.; Green, R.; Killeen, A.; Wedderburn, L.; Picascio, V.; Rabionet, A.; Peng, Z.L.; Larina, M.; Xue, B.; Kurgan, L.; et al. Not that rigid midgets and not so flexible giants: On the abundance and roles of intrinsic disorder in short and long proteins. J. Biol. Syst. 2012, 20, 471–511. [Google Scholar] [CrossRef]
- Peng, Z.; Oldfield, C.J.; Xue, B.; Mizianty, M.J.; Dunker, A.K.; Kurgan, L.; Uversky, V.N. A creature with a hundred waggly tails: Intrinsically disordered proteins in the ribosome. Cell. Mol. Life Sci. 2014, 71, 1477–1504. [Google Scholar] [CrossRef] [PubMed]
- Pentony, M.M.; Jones, D.T. Modularity of intrinsic disorder in the human proteome. Proteins Struct. Funct. Bioinform. 2010, 78, 212–221. [Google Scholar] [CrossRef] [PubMed]
- Tompa, P.; Fuxreiter, M.; Oldfield, C.J.; Simon, I.; Dunker, A.K.; Uversky, V.N. Close encounters of the third kind: Disordered domains and the interactions of proteins. BioEssays 2009, 31, 328–335. [Google Scholar] [CrossRef] [PubMed]
- Prilusky, J.; Felder, C.E.; Zeev-Ben-Mordehai, T.; Rydberg, E.H.; Man, O.; Beckmann, J.S.; Silman, I.; Sussman, J.L. Foldindex: A simple tool to predict whether a given protein sequence is intrinsically unfolded. Bioinformatics 2005, 21, 3435–3438. [Google Scholar] [CrossRef] [PubMed]
- Campen, A.; Williams, R.M.; Brown, C.J.; Meng, J.; Uversky, V.N.; Dunker, A.K. Top-idp-scale: A new amino acid scale measuring propensity for intrinsic disorder. Protein Pept. Lett. 2008, 15, 956–963. [Google Scholar] [CrossRef] [PubMed]
- Mohan, A.; Sullivan, W.J., Jr.; Radivojac, P.; Dunker, A.K.; Uversky, V.N. Intrinsic disorder in pathogenic and non-pathogenic microbes: Discovering and analyzing the unfoldomes of early-branching eukaryotes. Mol. Biosyst. 2008, 4, 328–340. [Google Scholar] [CrossRef] [PubMed]
- Xue, B.; Oldfield, C.J.; Dunker, A.K.; Uversky, V.N. CDF it all: Consensus prediction of intrinsically disordered proteins based on various cumulative distribution functions. FEBS Lett. 2009, 583, 1469–1474. [Google Scholar] [CrossRef] [PubMed]
- Huang, F.; Oldfield, C.J.; Xue, B.; Hsu, W.L.; Meng, J.; Liu, X.; Shen, L.; Romero, P.; Uversky, V.N.; Dunker, A. Improving protein order-disorder classification using charge-hydropathy plots. BMC Bioinform. 2014, 15, S4. [Google Scholar] [CrossRef] [PubMed] [Green Version]
- Huang, F.; Oldfield, C.; Meng, J.; Hsu, W.L.; Xue, B.; Uversky, V.N.; Romero, P.; Dunker, A.K. Subclassifying disordered proteins by the CH-CDF plot method. Pac. Symp. Biocomput. 2012, 128–139. [Google Scholar]
- Linding, R.; Jensen, L.J.; Diella, F.; Bork, P.; Gibson, T.J.; Russell, R.B. Protein disorder prediction: Implications for structural proteomics. Structure 2003, 11, 1453–1459. [Google Scholar] [CrossRef] [PubMed]
- Yang, Z.R.; Thomson, R.; McNeil, P.; Esnouf, R.M. Ronn: The bio-basis function neural network technique applied to the detection of natively disordered regions in proteins. Bioinformatics 2005, 21, 3369–3376. [Google Scholar] [CrossRef] [PubMed]
- Obradovic, Z.; Peng, K.; Vucetic, S.; Radivojac, P.; Dunker, A.K. Exploiting heterogeneous sequence properties improves prediction of protein disorder. Proteins 2005, 61, 176–182. [Google Scholar] [CrossRef] [PubMed]
- Linding, R.; Russell, R.B.; Neduva, V.; Gibson, T.J. Globplot: Exploring protein sequences for globularity and disorder. Nucleic Acids Res. 2003, 31, 3701–3708. [Google Scholar] [CrossRef] [PubMed]
- Peng, Z.L.; Kurgan, L. Comprehensive comparative assessment of in-silico predictors of disordered regions. Curr. Protein Pept. Sci. 2012, 13, 6–18. [Google Scholar] [CrossRef] [PubMed]
- Ishida, T.; Kinoshita, K. Prdos: Prediction of disordered protein regions from amino acid sequence. Nucleic Acids Res. 2007, 35, W460–W464. [Google Scholar] [CrossRef] [PubMed]
- Dosztanyi, Z.; Csizmok, V.; Tompa, P.; Simon, I. The pairwise energy content estimated from amino acid composition discriminates between folded and intrinsically unstructured proteins. J. Mol. Biol. 2005, 347, 827–839. [Google Scholar] [CrossRef] [PubMed]
- Peng, Z.; Sakai, Y.; Kurgan, L.; Sokolowski, B.; Uversky, V. Intrinsic disorder in the bk channel and its interactome. PLoS ONE 2014, 9, e94331. [Google Scholar] [CrossRef] [PubMed]
- Stephens, M.A. Edf statistics for goodness of fit and some comparisons. J. Am. Stat. Assoc. 1974, 69, 730–737. [Google Scholar] [CrossRef]
- Wilcoxon, F. Individual comparisons by ranking methods. Biom. Bull. 1945, 1, 80–83. [Google Scholar] [CrossRef]
- Boublik, M.; Bradbury, E.M.; Crane-Robinson, C. An investigation of the conformational changes in histones F1 and F2A1 by proton magnetic resonance spectroscopy. Eur. J. Biochem. 1970, 14, 486–497. [Google Scholar] [CrossRef] [PubMed]
- Boublik, M.; Bradbury, E.M.; Crane-Robinson, C.; Johns, E.W. An investigation of the conformational changes of histone F2B by high resolution nuclear magnetic resonance. Eur. J. Biochem. 1970, 17, 151–159. [Google Scholar] [CrossRef] [PubMed]
- D’Anna, J.A., Jr.; Isenberg, I. A complex of histones IIB2 and IV. Biochemistry 1973, 12, 1035–1043. [Google Scholar] [CrossRef] [PubMed]
- D’Anna, J.A., Jr.; Isenberg, I. Conformational changes of histone LAK (F2A2). Biochemistry 1974, 13, 2093–2098. [Google Scholar] [CrossRef] [PubMed]
- D’Anna, J.A., Jr.; Isenberg, I. Conformational changes of histone ARE(F3, III). Biochemistry 1974, 13, 4987–4992. [Google Scholar] [CrossRef] [PubMed]
- Hansen, J.C. Conformational dynamics of the chromatin fiber in solution: Determinants, mechanisms, and functions. Annu. Rev. Biophys. Biomol. Struct. 2002, 31, 361–392. [Google Scholar] [CrossRef] [PubMed]
- Hansen, J.C.; Lu, X.; Ross, E.D.; Woody, R.W. Intrinsic protein disorder, amino acid composition, and histone terminal domains. J. Biol. Chem. 2006, 281, 1853–1856. [Google Scholar] [CrossRef] [PubMed]
- Isenberg, I. Histones. Annu. Rev. Biochem. 1979, 48, 159–191. [Google Scholar] [CrossRef] [PubMed]
- Kato, H.; Gruschus, J.; Ghirlando, R.; Tjandra, N.; Bai, Y. Characterization of the N-terminal tail domain of histone H3 in condensed nucleosome arrays by hydrogen exchange and NMR. J. Am. Chem. Soc. 2009, 131, 15104–15105. [Google Scholar] [CrossRef] [PubMed]
- Li, H.J.; Isenberg, I.; Johnson, W.C., Jr. Absorption and circular dichroism studies on nucleohistone IV. Biochemistry 1971, 10, 2587–2593. [Google Scholar] [PubMed]
- Li, H.J.; Wickett, R.; Craig, A.M.; Isenberg, I. Conformational changes in histone IV. Biopolymers 1972, 11, 375–397. [Google Scholar] [CrossRef] [PubMed]
- Luger, K.; Richmond, T.J. The histone tails of the nucleosome. Curr. Opin. Genet. Dev. 1998, 8, 140–146. [Google Scholar] [CrossRef]
- Munishkina, L.A.; Fink, A.L.; Uversky, V.N. Conformational prerequisites for formation of amyloid fibrils from histones. J. Mol. Biol. 2004, 342, 1305–1324. [Google Scholar] [CrossRef] [PubMed]
- Peng, Z.; Mizianty, M.J.; Xue, B.; Kurgan, L.; Uversky, V.N. More than just tails: Intrinsic disorder in histone proteins. Mol. Biosyst. 2012, 8, 1886–1901. [Google Scholar] [CrossRef] [PubMed]
- Wickett, R.R.; Li, H.J.; Isenberg, I. Salt effects on histone iv conformation. Biochemistry 1972, 11, 2952–2957. [Google Scholar] [CrossRef] [PubMed]
- Zheng, C.; Hayes, J.J. Structures and interactions of the core histone tail domains. Biopolymers 2003, 68, 539–546. [Google Scholar] [CrossRef] [PubMed]
- Placek, B.J.; Gloss, L.M. The N-terminal tails of the H2A-H2B histones affect dimer structure and stability. Biochemistry 2002, 41, 14960–14968. [Google Scholar] [CrossRef] [PubMed]
- Potoyan, D.A.; Papoian, G.A. Energy landscape analyses of disordered histone tails reveal special organization of their conformational dynamics. J. Am. Chem. Soc. 2011, 133, 7405–7415. [Google Scholar] [CrossRef] [PubMed]
- Denning, D.P.; Patel, S.S.; Uversky, V.; Fink, A.L.; Rexach, M. Disorder in the nuclear pore complex: The FG repeat regions of nucleoporins are natively unfolded. Proc. Natl. Acad. Sci. USA 2003, 100, 2450–2455. [Google Scholar] [CrossRef] [PubMed]
- Denning, D.P.; Uversky, V.; Patel, S.S.; Fink, A.L.; Rexach, M. The saccharomyces cerevisiae nucleoporin NUP2P is a natively unfolded protein. J. Biol. Chem. 2002, 277, 33447–33455. [Google Scholar] [CrossRef] [PubMed]
- Fuxreiter, M.; Toth-Petroczy, A.; Kraut, D.A.; Matouschek, A.T.; Lim, R.Y.; Xue, B.; Kurgan, L.; Uversky, V.N. Disordered proteinaceous machines. Chem. Rev. 2014, 114, 6806–6843. [Google Scholar] [CrossRef] [PubMed]
- Yamada, J.; Phillips, J.L.; Patel, S.; Goldfien, G.; Calestagne-Morelli, A.; Huang, H.; Reza, R.; Acheson, J.; Krishnan, V.V.; Newsam, S.; et al. A bimodal distribution of two distinct categories of intrinsically disordered structures with separate functions in FG nucleoporins. Mol. Cell. Proteom. 2010, 9, 2205–2224. [Google Scholar] [CrossRef] [PubMed]
- Korneta, I.; Bujnicki, J.M. Intrinsic disorder in the human spliceosomal proteome. PLoS Comput. Biol. 2012, 8, e1002641. [Google Scholar] [CrossRef] [PubMed]
- Coelho-Ribeiro-Mde, L.; Espinosa, J.; Islam, S.; Martinez, O.; Thanki, J.J.; Mazariegos, S.; Nguyen, T.; Larina, M.; Xue, B.; Uversky, V.N. Malleable ribonucleoprotein machine: Protein intrinsic disorder in the saccharomyces cerevisiae spliceosome. PeerJ 2013, 1, e2. [Google Scholar] [CrossRef] [PubMed]
- Liu, J.; Perumal, N.B.; Oldfield, C.J.; Su, E.W.; Uversky, V.N.; Dunker, A.K. Intrinsic disorder in transcription factors. Biochemistry 2006, 45, 6873–6888. [Google Scholar] [CrossRef] [PubMed]
- Minezaki, Y.; Homma, K.; Kinjo, A.R.; Nishikawa, K. Human transcription factors contain a high fraction of intrinsically disordered regions essential for transcriptional regulation. J. Mol. Biol. 2006, 359, 1137–1149. [Google Scholar] [CrossRef] [PubMed]
- Uversky, V.N.; Kuznetsova, I.M.; Turoverov, K.K.; Zaslavsky, B. Intrinsically disordered proteins as crucial constituents of cellular aqueous two phase systems and coacervates. FEBS Lett. 2015, 589, 15–22. [Google Scholar] [CrossRef] [PubMed]
- Keating, C.D. Aqueous phase separation as a possible route to compartmentalization of biological molecules. Acc. Chem. Res. 2012, 45, 2114–2124. [Google Scholar] [CrossRef] [PubMed]
© 2015 by the authors; licensee MDPI, Basel, Switzerland. This article is an open access article distributed under the terms and conditions of the Creative Commons by Attribution (CC-BY) license (http://creativecommons.org/licenses/by/4.0/).
Share and Cite
Meng, F.; Na, I.; Kurgan, L.; Uversky, V.N. Compartmentalization and Functionality of Nuclear Disorder: Intrinsic Disorder and Protein-Protein Interactions in Intra-Nuclear Compartments. Int. J. Mol. Sci. 2016, 17, 24. https://doi.org/10.3390/ijms17010024
Meng F, Na I, Kurgan L, Uversky VN. Compartmentalization and Functionality of Nuclear Disorder: Intrinsic Disorder and Protein-Protein Interactions in Intra-Nuclear Compartments. International Journal of Molecular Sciences. 2016; 17(1):24. https://doi.org/10.3390/ijms17010024
Chicago/Turabian StyleMeng, Fanchi, Insung Na, Lukasz Kurgan, and Vladimir N. Uversky. 2016. "Compartmentalization and Functionality of Nuclear Disorder: Intrinsic Disorder and Protein-Protein Interactions in Intra-Nuclear Compartments" International Journal of Molecular Sciences 17, no. 1: 24. https://doi.org/10.3390/ijms17010024
APA StyleMeng, F., Na, I., Kurgan, L., & Uversky, V. N. (2016). Compartmentalization and Functionality of Nuclear Disorder: Intrinsic Disorder and Protein-Protein Interactions in Intra-Nuclear Compartments. International Journal of Molecular Sciences, 17(1), 24. https://doi.org/10.3390/ijms17010024