
Sleep Disorders Reduce Health-Related Quality of Life in Multiple Sclerosis (Nottingham Health Profile Data in Patients with Multiple Sclerosis)


Abstract
:
1. Introduction
2. Results
2.1. Patients
2.1.1. HRQoL in MS Patients with Sleep Disorders Compared to Patients without Sleep Disorders

| NHP Global Score and Subscales | Average and Range | All Patients | Patients without Sleep Disorders | Patients with Sleep Disorders | Differences between the Two Subgroups |
|---|---|---|---|---|---|
| NHP-Total | Mean (±standard deviation) | 146.1 (±119.8) | 67.3 (±60.0) | 175.2 (±123.6) | p = 0.001 |
| Min–Max | 0.0–78.7 | 0.0–188.6 | 0.0–413.7 | ||
| 25–75 | 0.0–32.6 | 21.8–120.5 | 61.3–273.3 | ||
| median | 126.4 | 34.8 | 175.5 | ||
| Physical abilities | Mean (±standard deviation) | 20.9 (±21.5) | 10.2 (±14.7) | 24.8 (±22.4) | p = 0.010 |
| Min–Max | 0.0–78.7 | 0.0–54.5 | 0.0–78.7 | ||
| 25–75 | 0.0–32.6 | 0.0–22.0 | 10.8–36.5 | ||
| median | 12.7 | 0.0 | 21.7 | ||
| Social isolation | Mean (±standard deviation) | 11.7 (±19.6) | 3.6 (±8.0) | 14.7 (±21.8) | p = 0.048 |
| Min–Max | 0.0–80.6 | 0.0–22.5 | 0.0–80.6 | ||
| 25–75 | 0.0–20.1 | 0.0–0.0 | 0.0–22.5 | ||
| median | 0.0 | 0.0 | 0.0 | ||
| Sleep | Mean (±standard deviation) | 29.3 (±29.5) | 10.6 (±15.1) | 36.2 (±30.6) | p = 0.001 |
| Min–Max | 0.0–100.0 | 0.0–50.4 | 0.0–100.0 | ||
| 25–75 | 0.0–16.1 | 0.0–12.6 | 12.6–72.7 | ||
| median | 50.4 | 0.0 | 28.7 | ||
| Pain | Mean (±standard deviation) | 15.8 (±24.8) | 3.8 (±9.8) | 20.2 (±27.2) | p = 0.009 |
| Min–Max | 0.0–100.0 | 0.0–32.3 | 0.0–100.0 | ||
| 25–75 | 0.0–0.0 | 0.0–0.0 | 0.0–30.6 | ||
| median | 26.0 | 0.0 | 9.9 | ||
| Energy | Mean (±standard deviation) | 48.9 (±40.9) | 29.9 (±35.5) | 55.8 (±40.9) | p = 0.016 |
| Min–Max | 0.0–100.0 | 0.0–100.0 | 0.0–100.0 | ||
| 25–75 | 0.0–60.8 | 0.0–62.0 | 24.0–100.0 | ||
| median | 100.0 | 0.0 | 62.0 | ||
| Emotional | Mean (±standard deviation) | 19.6 (±18.8) | 9.3 (±12.2) | 23.5 (±19.5) | p = 0.006 |
| Min–Max | 0.0–69.0 | 0.0–41.4 | 0.0–69.0 | ||
| 25–75 | 0.0–30.9 | 0.0–18.6 | 5.3–41.4 | ||
| median | 16.8 | 0.0 | 21.0 |
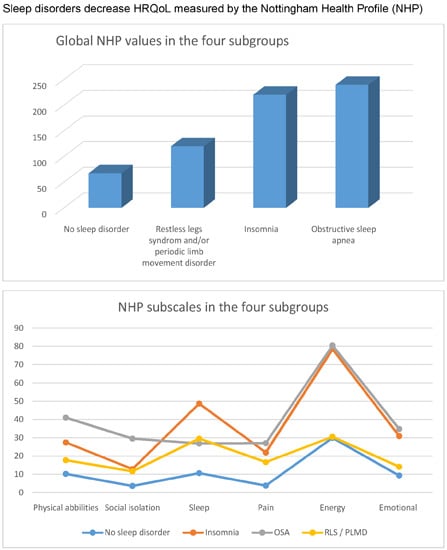
2.1.2. Comparison of the Global NHP Values (Global HRQoL) in the Four Subgroups

| NHP Values | Average and Range | All Patients | NSD | INS | OSA | PLM | Differences between the Two Subgroups |
|---|---|---|---|---|---|---|---|
| Total | Mean (SD) | 146.1 | 67.3 | 220.3 | 239.6 | 119.9 | NSD
vs. OSA p = 0.003 NSD vs. INS p < 0.0001 INS vs. PLM p = 0.002 OSA vs. PLM p = 0.042 NSD vs. PLM p = 0.210 OSA vs. INS p = 0.804 |
| Standard deviation | 119.8 | 60.0 | 88.2 | 136.2 | 123.7 | ||
| Min–Max | 0.0–78.7 | 0.0–188.6 | 60.7–369.9 | 24.7–413.7 | 0.0–408.61 | ||
| 25–75 | 0.0–32.6 | 21.8–120.5 | 147.0–276.0 | 180.8–393.3 | 29.7–174.4 | ||
| Median | 126.4 | 34.8 | 212.3 | 194.9 | 75.8 |
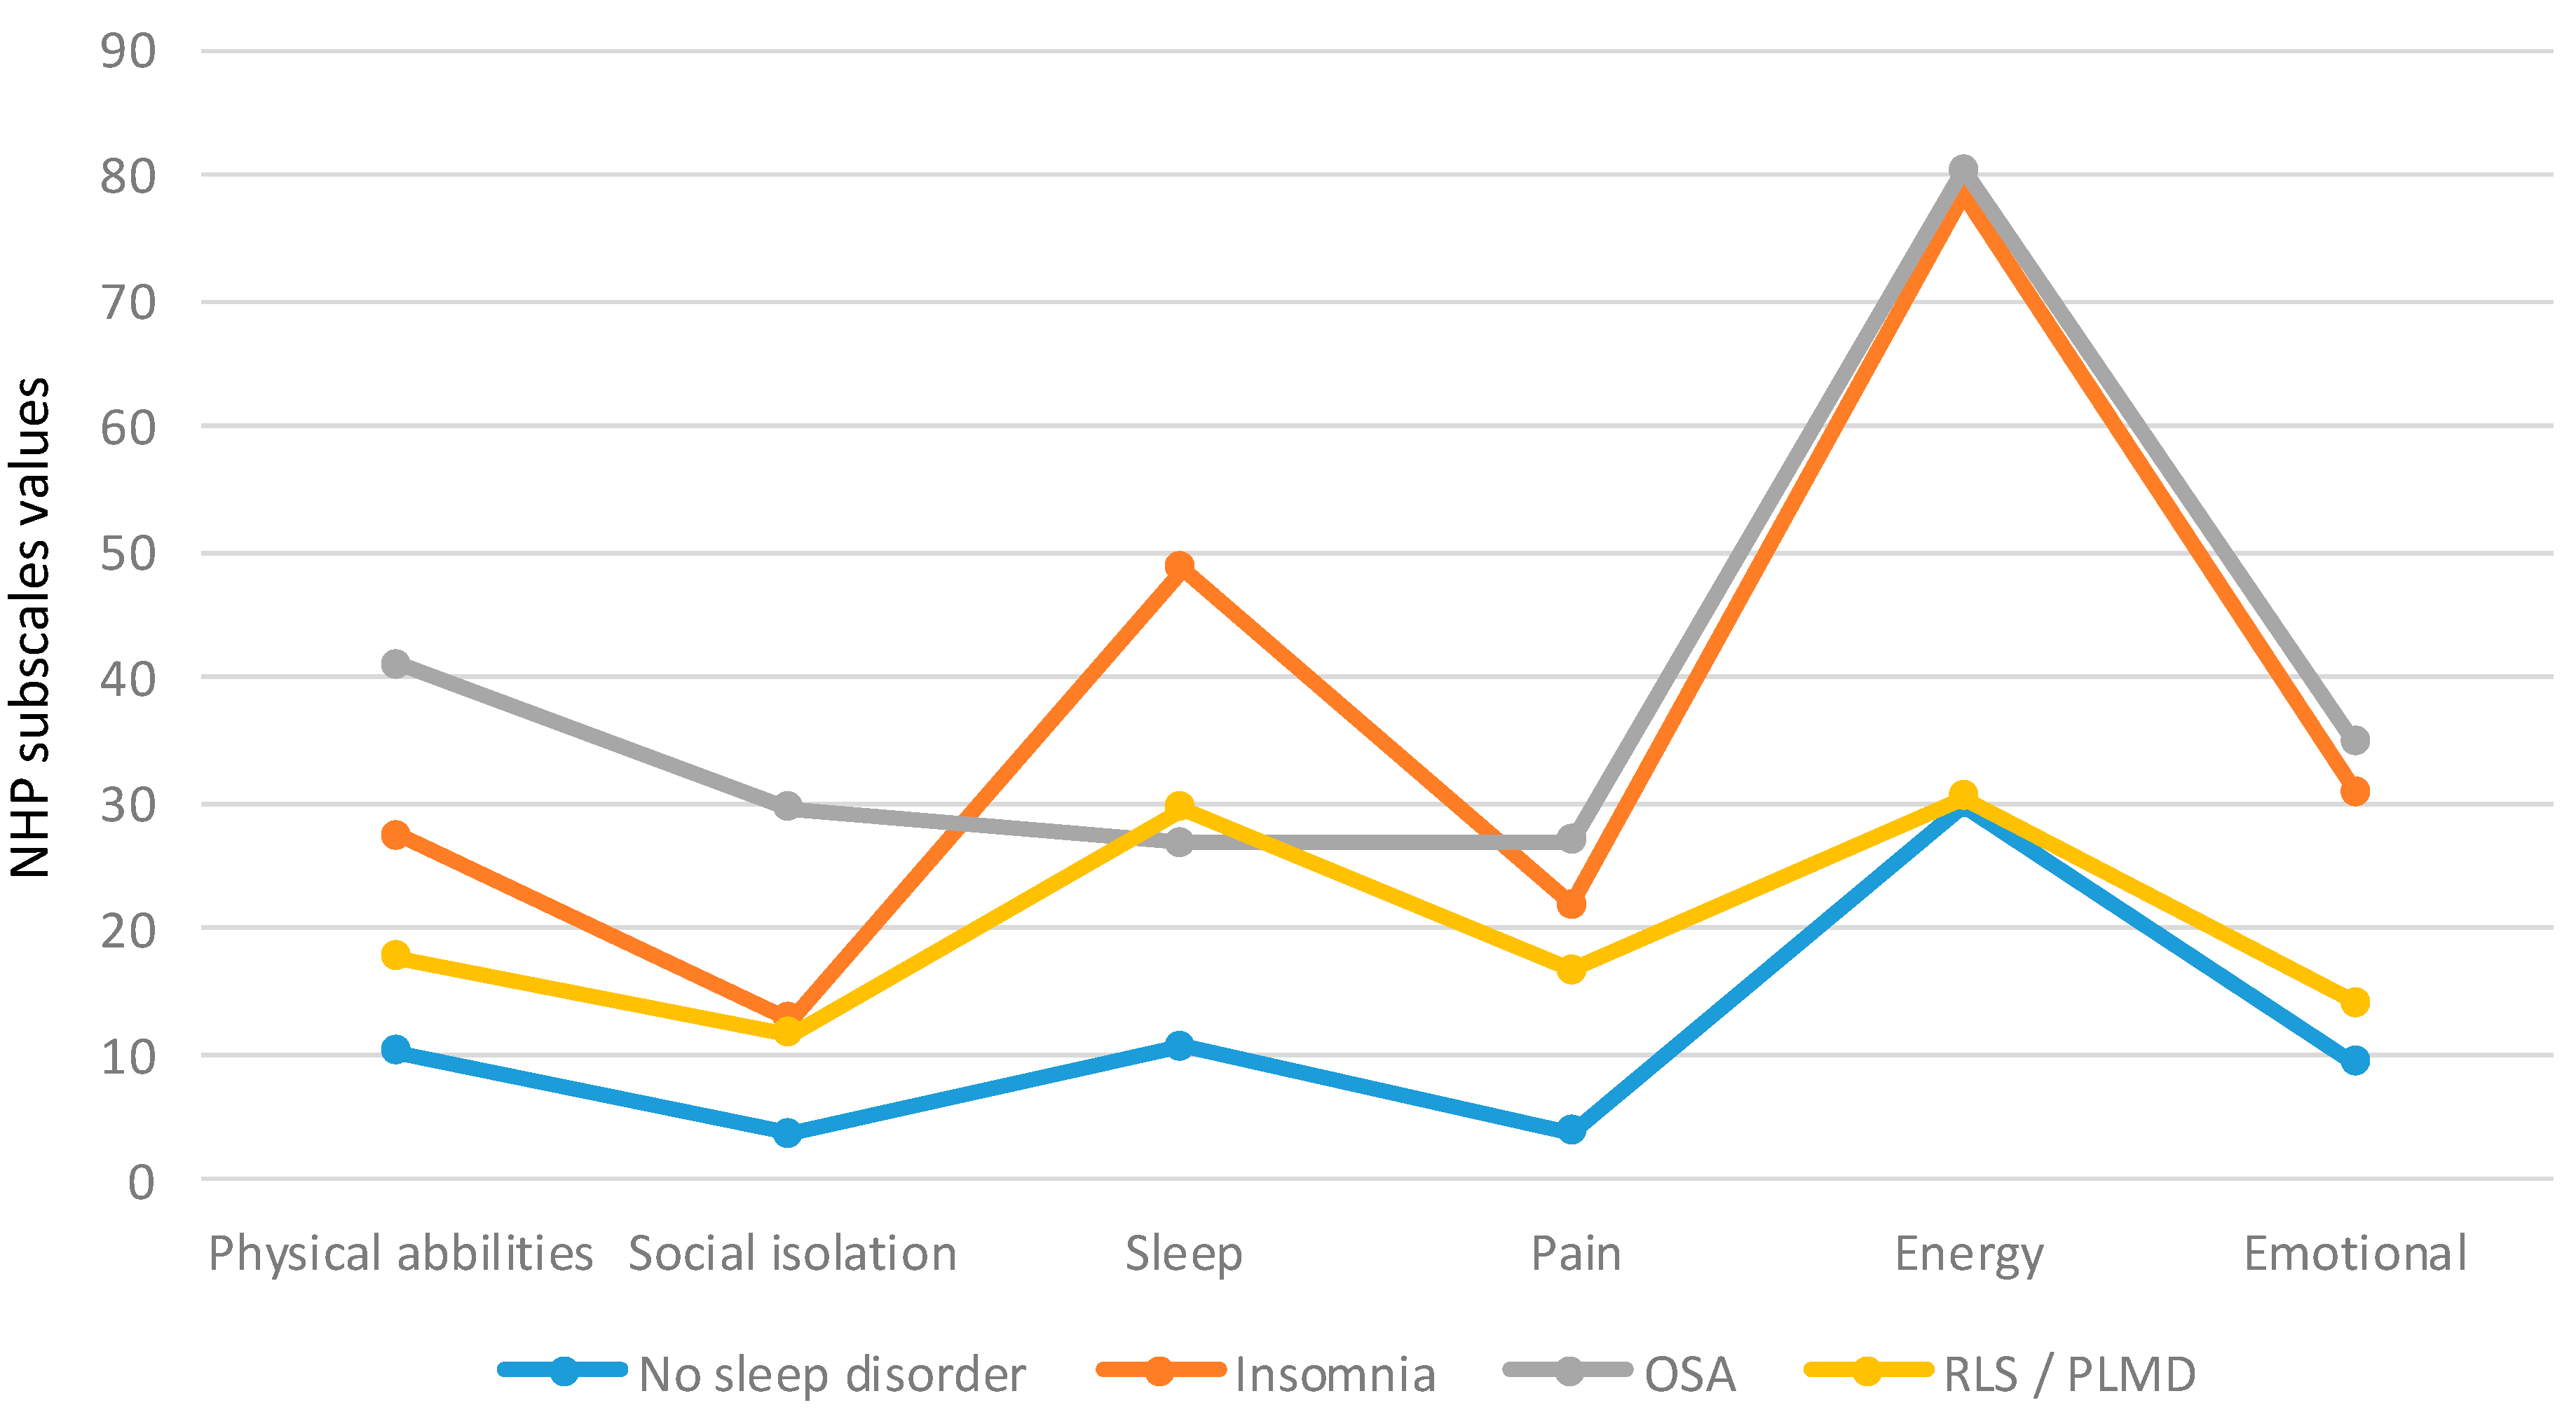
2.1.3. Comparison of the NHP Subscales in the Four Subgroups

Kruskal–Wallis-Test
| NHP Total | Physical Abilities | Social Isolation | Sleep | Pain | Energy | Emotional |
|---|---|---|---|---|---|---|
| p < 0.0001 | p = 0.007 | p = 0.054 | p = 0.001 | p = 0.034 | p < 0.0001 | p < 0.0001 |
Mann–Whitney-U-Test
| Subscales | Average and Range | All Patients | NSD | INS | OSA | PLM | Differences between the Two Subgroups |
|---|---|---|---|---|---|---|---|
| Physical abilities | Mean (Standard deviation) | 20.9 (21.5) | 10.2 (14.7) | 27.4 (20.8) | 41.0 (24.3) | 17.7 (20.8) | NSD
vs. OSA p = 0.003 NSD vs. INS p = 0.009 INS vs. PLM p = 0.138 OSA vs. PLM p = 0.032 NSD vs. PLM p = 0.211 OSA vs. INS p = 0.260 |
| Min–Max | 0.0–78.7 | 0.0–54.5 | 0.0–77.3 | 10.8–78.2 | 0.0–78.7 | ||
| 25–75 | 0.0–32.6 | 0.0–21.9 | 10.8–42.6 | 21.7–67.2 | 0.0–25.8 | ||
| Median | 12.7 | 0.0 | 22.0 | 32.6 | 11.2 | ||
| Social isolation | Mean (Standard deviation) | 11.7 (19.6) | 3.6 (8.0) | 12.8 (19.0) | 29.5 (31.0) | 11.6 (19.4) | For this subgroup no Mann–Whitney-U-Test was performed (see Table 2) |
| Min–Max | 0.0–80.6 | 0.0–22.5 | 0.0–64.7 | 0.0–80.6 | 0.0–63.9 | ||
| 25–75 | 0.0–20.1 | 0.0–0.0 | 0.0–22.5 | 0.0–63.9 | 0.0–20.2 | ||
| Median | 0.0 | 0.0 | 0.0 | 20.1 | 0.0 | ||
| Sleep | Mean (Standard deviation) | 29.3 (29.5) | 10.6 (15.2) | 48.7 (26.7) | 26.8 (27.4) | 29.5 (32.4) | NSD
vs. OSA p = 0.087 NSD vs. INS p < 0.0001 INS vs. PLM p = 0.048 OSA vs. PLM p = 0.980 NSD vs. PLM p = 0.063 OSA vs. INS p = 0.075 |
| Min–Max | 0.0–100.0 | 0.0–50.4 | 0.0–77.6 | 0.0–77.6 | 0.0–100 | ||
| 25–75 | 0.0–16.1 | 0.0–12.6 | 25.2–75.2 | 12.6–50.4 | 0.0–50.4 | ||
| Median | 50.4 | 0.0 | 50.4 | 12.6 | 14.3 | ||
| Pain | Mean (Standard deviation) | 15.8 (24.8) | 3.8 (9.8) | 21.9 (23.9) | 27.0 (31.4) | 16.6 (28.9) | NSD
vs. OSA p = 0.114 NSD vs. INS p = 0.012 INS vs. PLM p = 0.221 OSA vs. PLM p = 0.469 NSD vs. PLM p = 0.117 OSA vs. INS p = 0.804 |
| Min–Max | 0.0–100.0 | 0.0–32.7 | 0.0–69.8 | 0.0–80.2 | 0.0–100.0 | ||
| 25–75 | 0.0–0.0 | 0.0–0.0 | 0.0–40.1 | 0.0–56.9 | 0.0–18.6 | ||
| Median | 26.0 | 0.0 | 15.8 | 26.0 | 0.0 | ||
| Energy | Mean (Standard deviation) | 48.9 (40.9) | 29.9 (35.5) | 78.5 (28.7) | 80.5 (38.0) | 30.5 (35.4) | NSD
vs. OSA p = 0.007 NSD vs. INS p < 0.0001 INS vs. PLM p < 0.0001 OSA vs. PLM p = 0.013 NSD vs. PLM p = 0.790 OSA vs. INS p = 0.710 |
| Min–Max | 0.0–100.0 | 0.0–100.0 | 24.0–100.0 | 0.0–100.0 | 0.0–100.0 | ||
| 25–75 | 0.0–60.8 | 0.0–62.0 | 60.8–100.0 | 63.2–100.0 | 0.0–61.4 | ||
| Median | 100.0 | 0.0 | 100.0 | 100.0 | 24.0 | ||
| Emotional | Mean (Standard deviation) | 19.6 (18.8) | 9.3 (12.2) | 30.9 (19.8) | 34.8 (16.8) | 14.1 (15.9) | NSD
vs. OSA p = 0.001 NSD vs. INS p = 0.001 INS vs. PLM p = 0.007 OSA vs. PLM p = 0.008 NSD vs. PLM p = 0.392 OSA vs. INS p = 0.619 |
| Min–Max | 0.0–69.0 | 0.0–41.4 | 0.0–69.0 | 13.6–55.9 | 0.0–48.5 | ||
| 25–75 | 0.0–30.9 | 0.0–18.6 | 14.1–47.1 | 17.0–52.0 | 0.0–22.7 | ||
| Median | 16.8 | 0.0 | 30.9 | 30.9 | 10.9 |
2.1.4. Comparison of the Objective (PSG) Sleep Parameters and the NHP Sleep Items
| Items | Average and Range | Sleep Efficiency | Awakenings | Arousal-Index | Sleep Latency | Wake after Sleep Onset |
|---|---|---|---|---|---|---|
| I sleep badly at night YES | Mean (±standard deviation) | 73.6 (±12.6) | 25.5 (±7.7) | 18.5 (±9.6) | ||
| Min–Max | 50–94 | 9–41 | 3.9–43.9 | |||
| 25–75 | 63.7–83.5 | 20–30.5 | 12.2–22.9 | |||
| median | 74.8 | 26.0 | 16.5 | |||
| I sleep badly at night NO | Mean (±standard deviation) | 76.7 (±16.2) | 27.5 (±14.2) | 20.5 (±10.0) | ||
| Min–Max | 8–93 | 8–72 | 1.1–47.1 | |||
| 25–75 | 73.0–87.1 | 17.8–33.3 | 14.4–24.9 | |||
| median | 80.45 | 26.0 | 21.7 | |||
| Differences between YES and NO | p = 0.148 | p = 0.860 | p = 0.255 | |||
| I lie awake for most of the night YES | Mean (±standard deviation) | 76.2 (±15.0) | ||||
| Min–Max | 8–93 | |||||
| 25–75 | 69.8–87.0 | |||||
| median | 79.7 | |||||
| I lie awake for most of the night NO | Mean (±standard deviation) | 71.1 (±13.5) | ||||
| Min–Max | 50–94 | |||||
| 25–75 | 60.0–80.7 | |||||
| median | 69.6 | |||||
| Differences between YES and NO | p = 0.175 | |||||
| It takes me a long time to get to sleep YES | Mean (±standard deviation) | 38.5 (±39.8) | ||||
| Min–Max | 2–198 | |||||
| 25–75 | 15.3–49.5 | |||||
| median | 29.0 | |||||
| It takes me a long time to get to sleep NO | Mean (±standard deviation) | 26.4 (±31.1) | ||||
| Min–Max | 0–190 | |||||
| 25–75 | 11.0–32.0 | |||||
| median | 21.0 | |||||
| Differences between YES and NO | p = 0.08 | |||||
| I’m waking up in the early hours of the morning YES | Mean (±standard deviation) | 88.4 (±59.0) | ||||
| Min–Max | 27–258 | |||||
| 25–75 | 43.0–73.0 | |||||
| median | 73.0 | |||||
| I’m waking up in the early hours of the morning NO | Mean (±standard deviation) | 69.8 (±41.4) | ||||
| Min–Max | 20–173 | |||||
| 25–75 | 43.3–88.8 | |||||
| median | 52.5 | |||||
| Differences between YES and NO | p = 0.336 | |||||
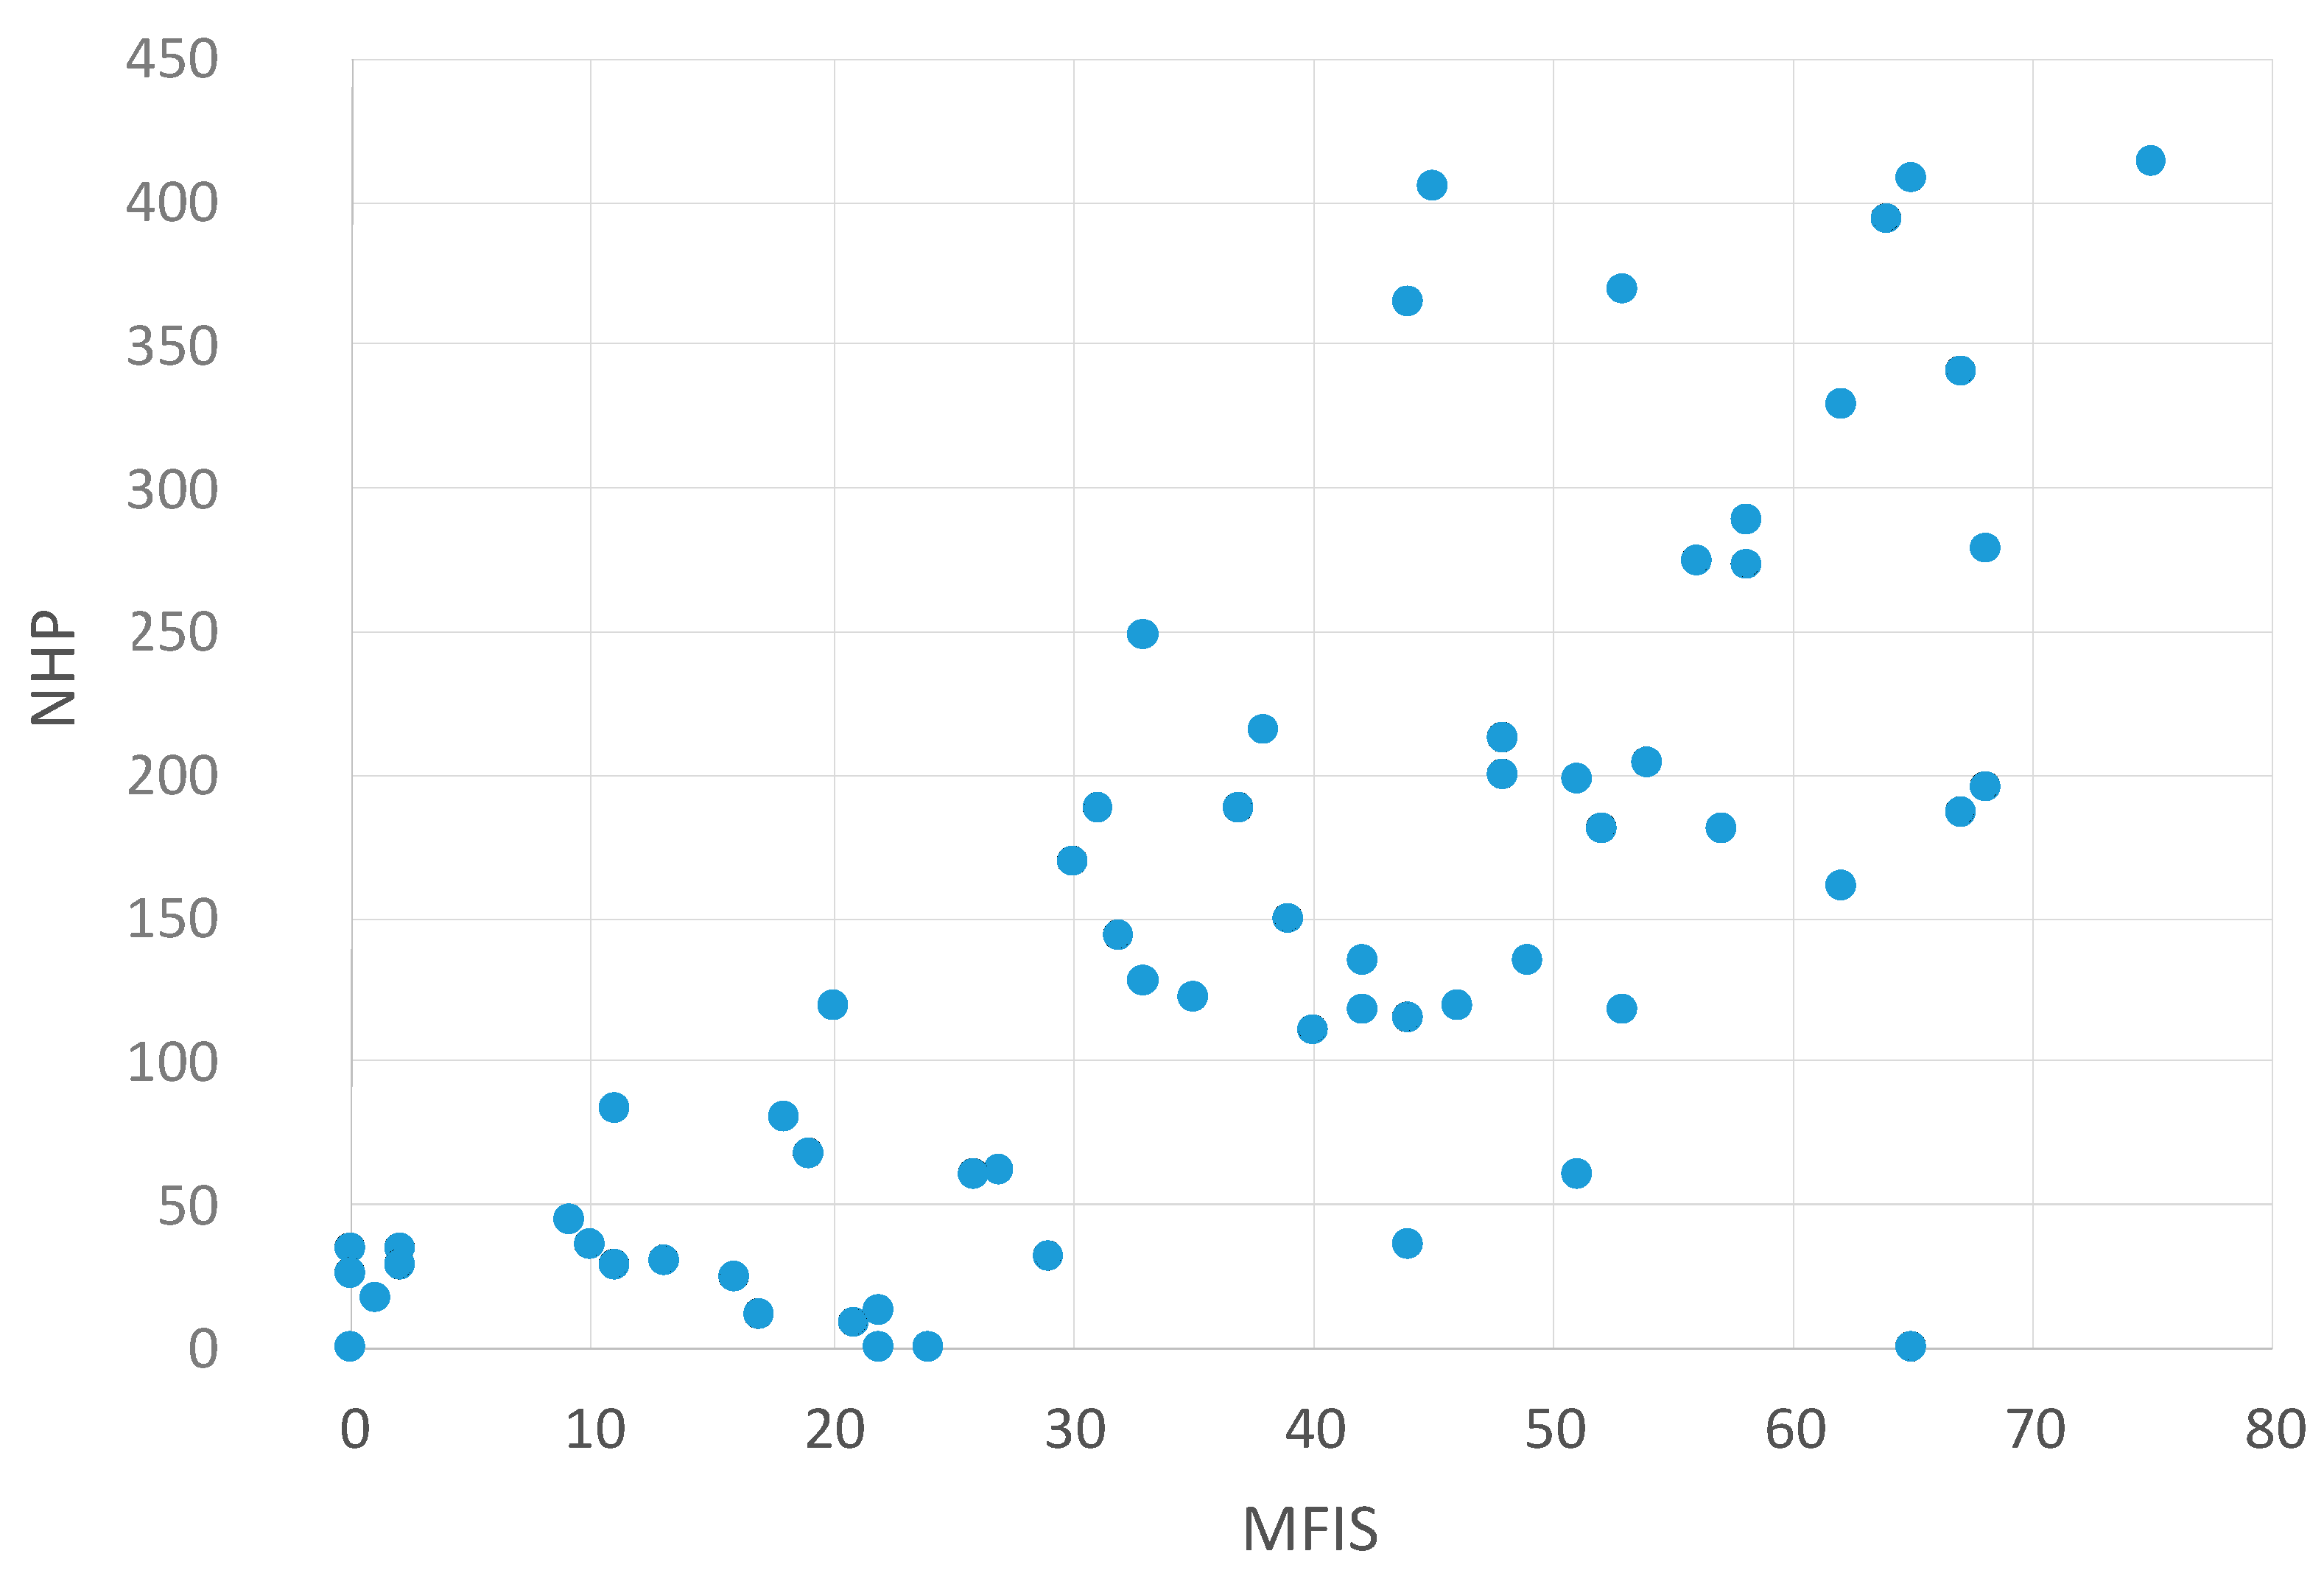
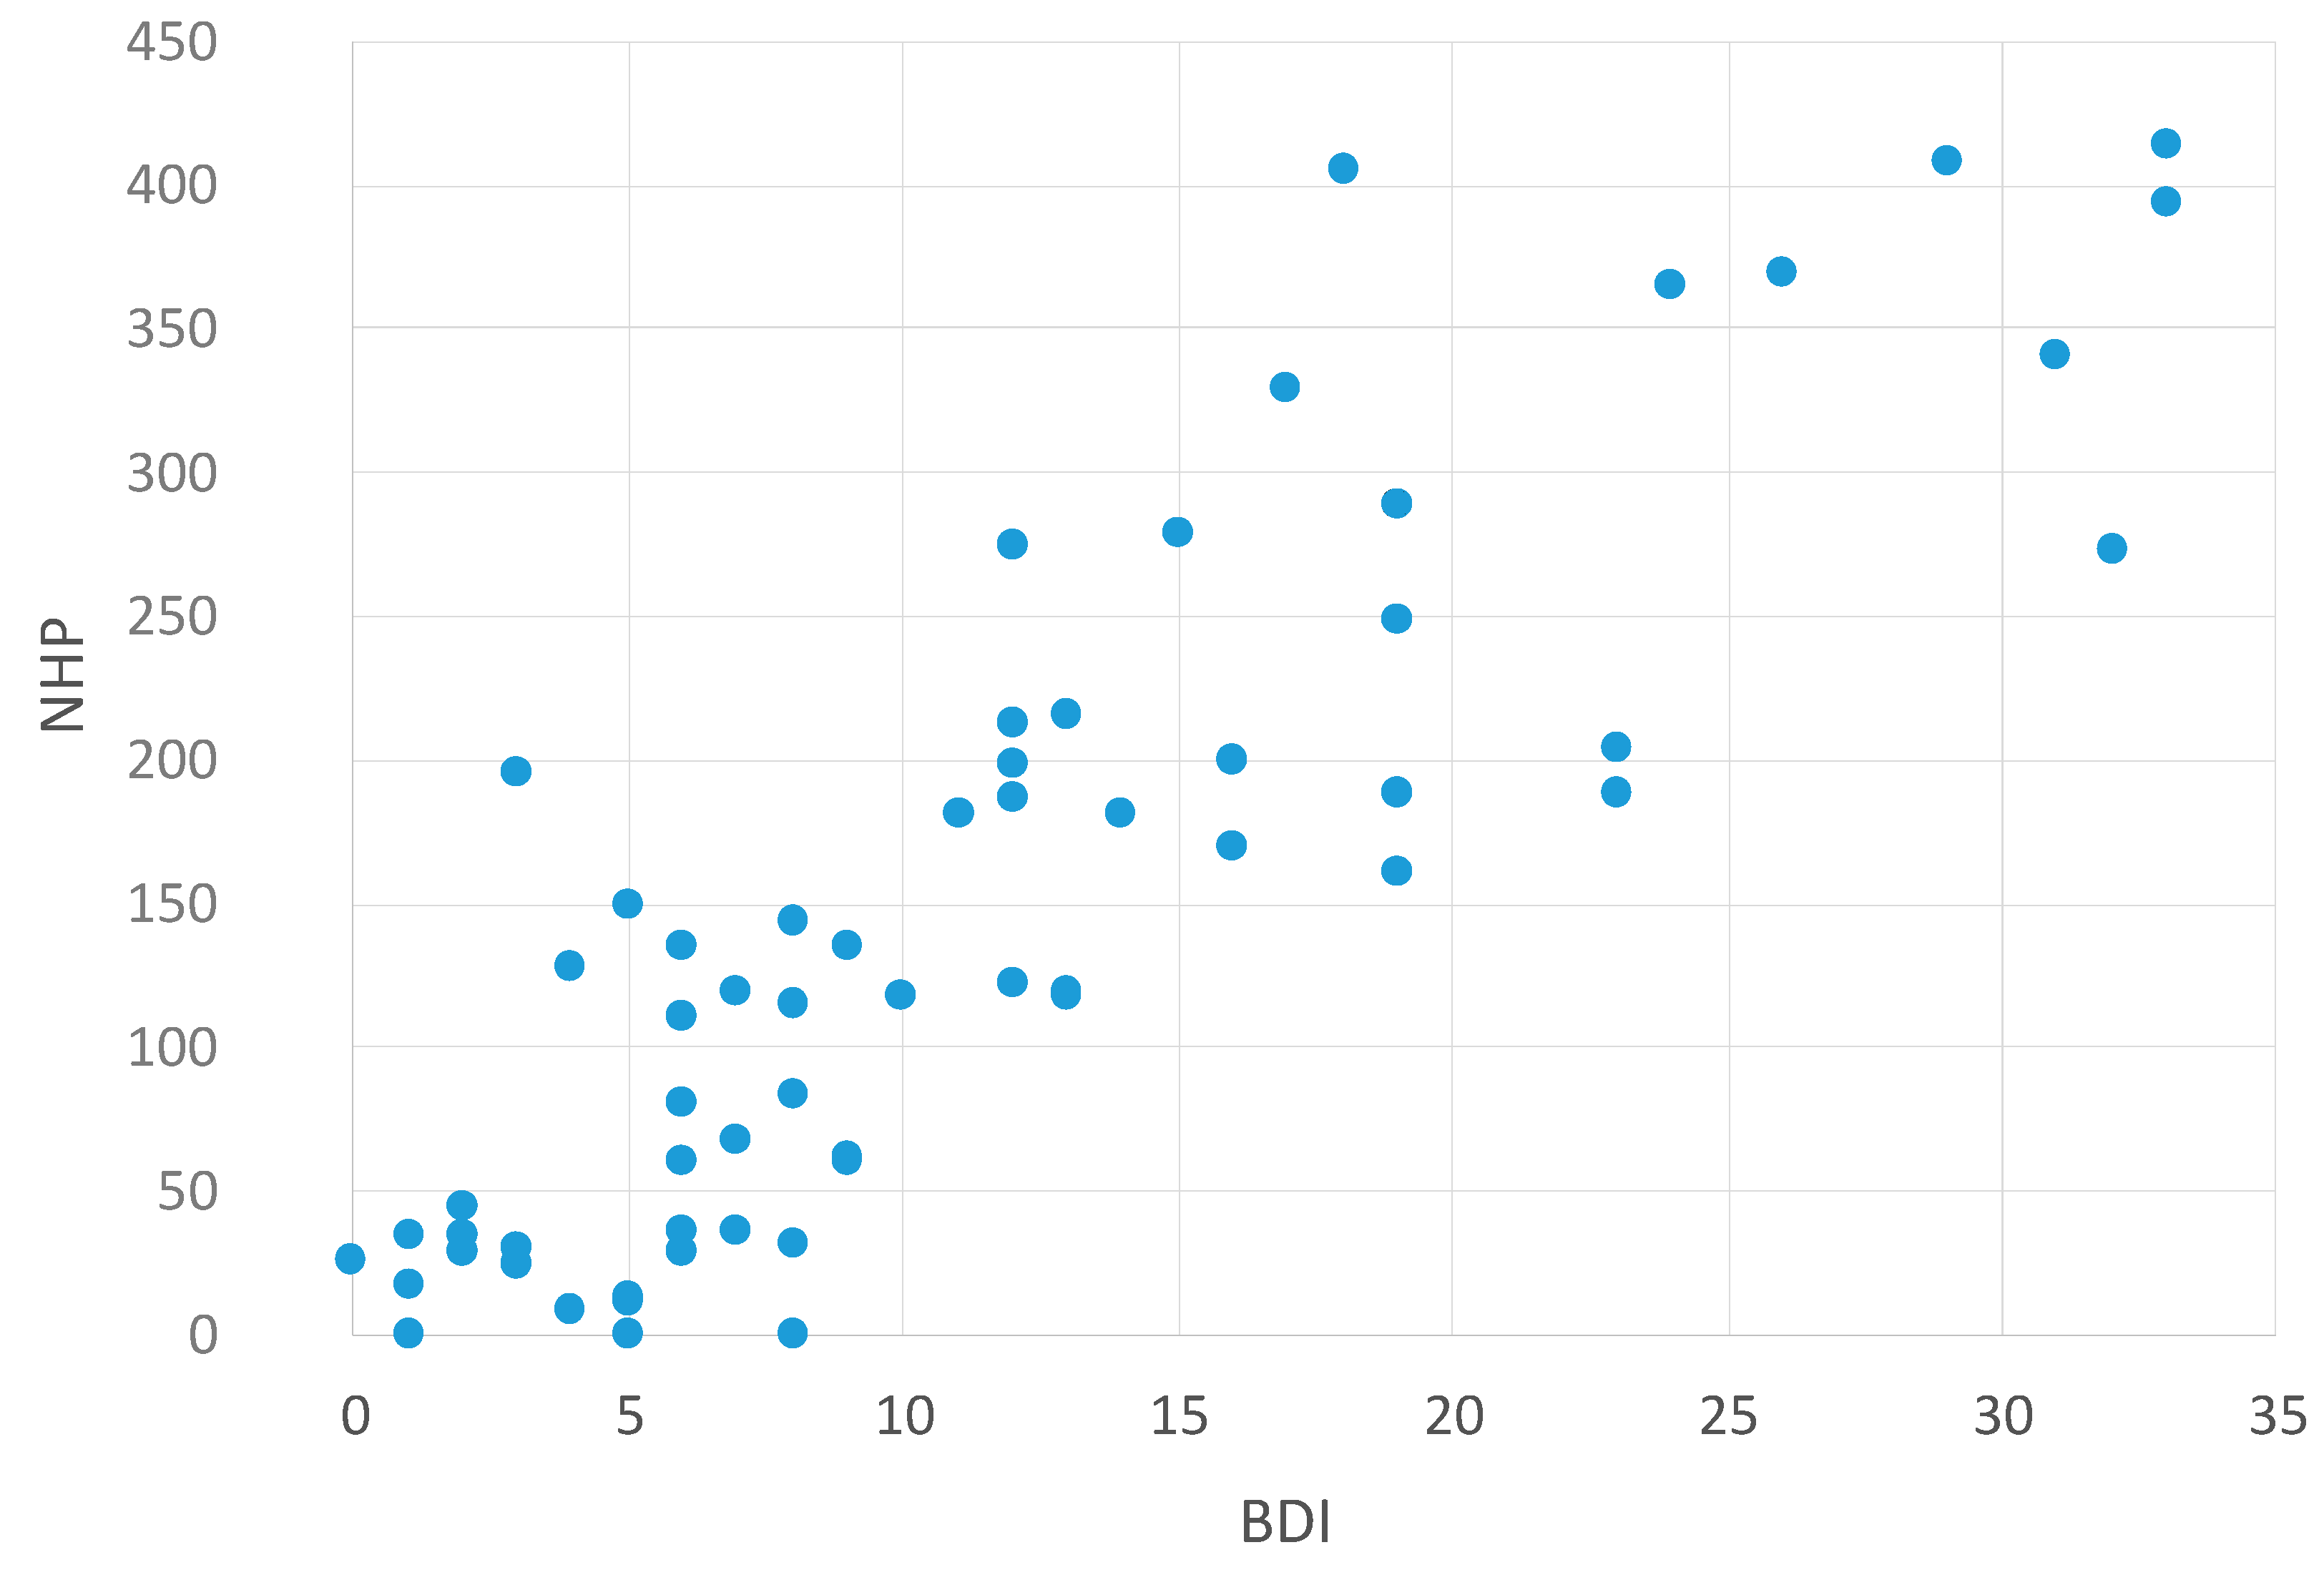
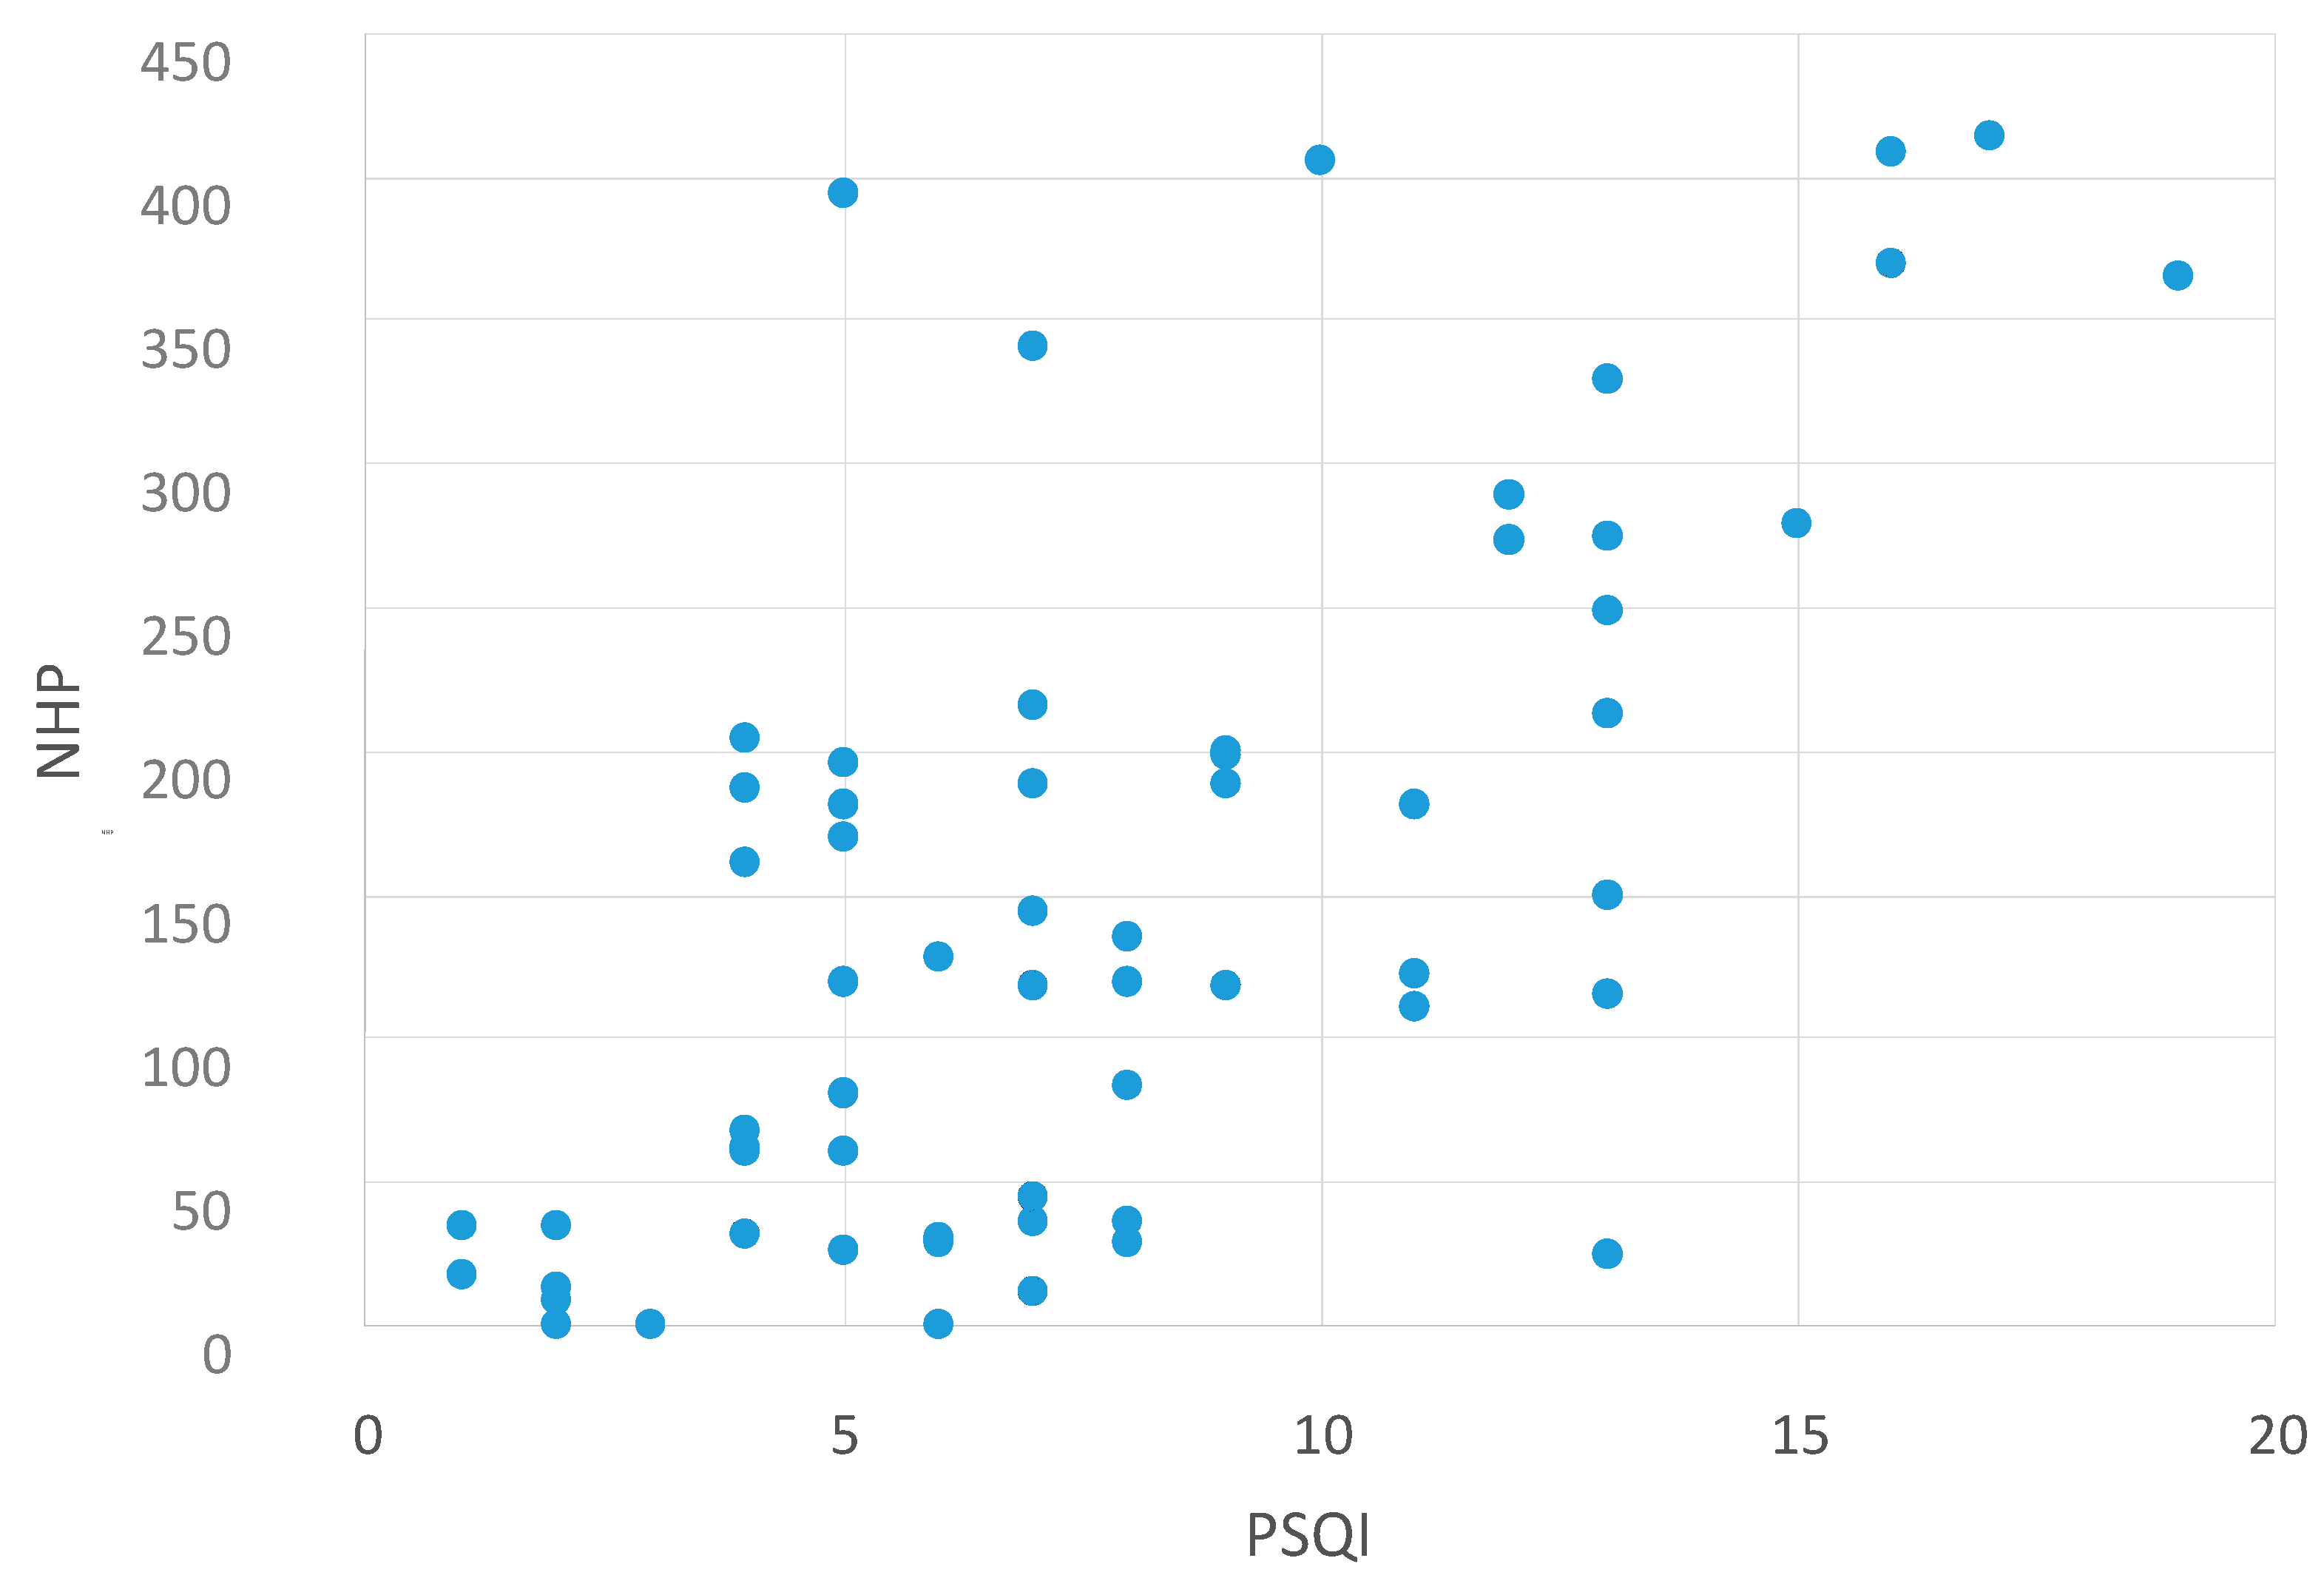
2.2. Correlation between NHP Values and Other Questionnaires
| NHP and MFIS | NHP and BDI | NHP and PSQI |
|---|---|---|
| p < 0.0001 | p < 0.0001 | p < 0.0001 |
| r = 0.737 | r = 0.836 | r = 0.612 |


Correlation between NHP Values and the MFIS Subscales
| NHP and Cognitive MFIS-Subscale | NHP and Physical MFIS-Subscale | NHP and Psychosocial MFIS-Subscale |
|---|---|---|
| p < 0.0001 | p < 0.0001 | p < 0.0001 |
| r = 0.635 | r = 0.726 | r = 0.548 |
3. Discussion
4. Experimental Section
4.1. Literature Search
4.2. Patients
4.3. Data Collection
4.4. Polysomnography and Scoring Criteria
4.5. Statistical Analyses
5. Conclusions
Acknowledgments
Author Contributions
Conflicts of Interest
References
- Veauthier, C.; Radbruch, H.; Gaede, G.; Pfueller, C.F.; Dörr, J.; Bellmann-Strobl, J.; Wernecke, K.D.; Zipp, F.; Paul, F; Sieb, J.P. Fatigue in multiple sclerosis is closely related to sleep disorders: A polysomnographic cross-sectional study. Mult. Scler. 2011, 17, 613–622. [Google Scholar] [CrossRef] [PubMed]
- Veauthier, C.; Gaede, G.; Radbruch, H.; Gottschalk, S.; Wernecke, K.D.; Paul, F. Treatment of sleep disorders may improve fatigue in multiple sclerosis. Clin. Neurol. Neurosurg. 2013, 115, 1826–1830. [Google Scholar] [CrossRef] [PubMed]
- Côté, I.; Trojan, D.A.; Kaminska, M.; Cardoso, M.; Benedetti, A.; Weiss, D.; Robinson, A.; Bar-Or, A.; Lapierre, Y.; Kimoff, R.J. Impact of sleep disorder treatment on fatigue in multiple sclerosis. Mult. Scler. 2013, 19, 480–489. [Google Scholar] [CrossRef] [PubMed]
- Neau, J.P.; Paquereau, J.; Auche, V.; Mathis, S.; Godeneche, G.; Ciron, J.; Moinot, N.; Bouche, G. Sleep disorders and multiple sclerosis: A clinical and polysomnography study. Eur. Neurol. 2012, 68, 8–15. [Google Scholar] [CrossRef] [PubMed]
- Sarraf, P.; Azizi, S.; Moghaddasi, A.N.; Sahraian, M.A.; Tafakhori, A.; Ghajarzadeh, M. Relationship between sleep quality and quality of life in patients with multiple sclerosis. Int. J. Prev. Med. 2014, 5, 1582–1586. [Google Scholar] [PubMed]
- Buysse, D.J.; Reynolds, C.F., 3rd.; Monk, T.H.; Berman, S.R.; Kupfer, D.J. The pittsburgh sleep quality index: A new instrument for psychiatric practice and research. Psychiatry Res. 1989, 28, 193–213. [Google Scholar] [CrossRef]
- Vickrey, B.G.; Hays, R.D.; Harooni, R.; Myers, L.W.; Ellison, G.W. A health-related quality of life measure for multiple sclerosis. Qual. Life Res. 1995, 4, 187–206. [Google Scholar] [CrossRef] [PubMed]
- Trojan, D.A.; Kaminska, M.; Bar-Or, A.; Benedetti, A.; Lapierre, Y.; da Costa, D.; Robinson, A.; Cardoso, M.; Schwartzman, K.; Kimoff, R.J. Polysomnographic measures of disturbed sleep are associated with reduced quality of life in multiple sclerosis. Neurol. Sci. 2012, 316, 158–163. [Google Scholar] [CrossRef] [PubMed]
- Brazier, J.E.; Harper, R.; Jones, N.M.; O’Cathain, A.; Thomas, K.J.; Usherwood, T.; Westlake, L. Validating the SF-36 health survey questionnaire: New outcome measure for primary care. BMJ 1992, 305, 160–164. [Google Scholar] [CrossRef] [PubMed]
- Hunt, S.M.; McEwen, J.; McKenna, S.P. Measuring health status: A new tool for clinicians and epidemiologists. J. R. Coll. Gen. Pract. 1985, 35, 185–188. [Google Scholar] [PubMed]
- Verwimp, J.; Ameye, L.; Bruyneel, M. Correlation between sleep parameters, physical activity and quality of life in somnolent moderate to severe obstructive sleep apnea adult patients. Sleep Breath. 2013, 17, 1039–1046. [Google Scholar] [CrossRef] [PubMed]
- Kurtzke, J.F. Rating neurologic impairment in multiple sclerosis: An expanded disability status scale (EDSS). Neurology 1983, 33, 1444–1452. [Google Scholar] [CrossRef] [PubMed]
- Multiple Sclerosis Council for Clinical Practice Guidelines. Fatigue and Multiple Sclerosis: Evidence-Based Management Strategies for Fatigue in Multiple Sclerosis; Paralyzed Veterans of America: Washington, DC, USA, 1998. [Google Scholar]
- Beck, A.T.; Steer, R.A. Internal consistencies of the original and revised Beck Depression Inventory. J. Clin. Psychol. 1984, 40, 1365–1367. [Google Scholar] [CrossRef]
- Veauthier, C.; Paul, F. Sleep disorders in multiple sclerosis and their relationship to fatigue. Sleep Med. 2014, 15, 5–14. [Google Scholar] [CrossRef] [PubMed]
- El-Sherbini, A.M.; Bediwy, A.S.; El-Mitwalli, A. Association between obstructive sleep apnea (OSA) and depression and the effect of continuous positive airway pressure (CPAP) treatment. Neuropsychiatr. Dis. Treat. 2011, 7, 715–721. [Google Scholar] [PubMed]
- Baglioni, C.; Riemann, D. Is chronic insomnia a precursor to major depression? Epidemiological and biological findings. Curr. Psychiatry Rep. 2012, 14, 511–518. [Google Scholar] [CrossRef] [PubMed]
- Veauthier, C.; Paul, F. Fatigue in multiple sclerosis: Which patient should be referred to a sleep specialist? Mult. Scler. 2012, 18, 248–249. [Google Scholar] [CrossRef] [PubMed]
- Paul, F.; Veauthier, C. Fatigue in multiple sclerosis: A diagnostic and therapeutic challenge. Expert Opin. Pharmacother. 2012, 13, 791–793. [Google Scholar] [CrossRef] [PubMed]
- Weinges-Evers, N.; Brandt, A.U.; Bock, M.; Pfueller, C.F.; Dörr, J.; Bellmann-Strobl, J.; Scherer, P.; Urbanek, C.; Boers, C.; Ohlraun, S.; et al. Correlation of self-assessed fatigue and alertness in multiple sclerosis. Mult. Scler. 2010, 16, 1134–1140. [Google Scholar] [CrossRef] [PubMed]
- Veauthier, C. Younger age, female sex, and high number of awakenings and arousals predict fatigue in patients with sleep disorders: A retrospective polysomnographic observational study. Neuropsychiatr. Dis. Treat. 2013, 9, 1483–1494. [Google Scholar] [CrossRef] [PubMed]
- Chotinaiwattarakul, W.; O’Brien, L.M.; Fan, L.; Chervin, R.D. Fatigue, tiredness, and lack of energy improve with treatment for OSA. J. Clin. Sleep Med. 2009, 5, 222–227. [Google Scholar] [PubMed]
- Kohlmann, T.; Bullinger, M.; Kirchberger-Blumstein, I. German version of the Nottingham Health Profile (NHP): Translation and psychometric validation. Soz. Praventivmed. 1997, 42, 175–185. (In German) [Google Scholar] [CrossRef] [PubMed]
- Zimmermann, C.; Hohlfeld, R. “Fatigue” in multiple sclerosis. Nervenarzt 1999, 70, 566–574. (In German) [Google Scholar] [CrossRef] [PubMed]
- Kühner, C.; Bürger, C.; Keller, F.; Hautzinger, M. Reliability and validity of the Revised Beck Depression Inventory (BDI-II). Results from German samples. Nervenarzt 2007, 78, 651–656. (In German) [Google Scholar] [CrossRef] [PubMed]
- Backhaus, J.; Junghanns, K.; Broocks, A.; Riemann, D.; Hohagen, F. Test-retest reliability and validity of the Pittsburgh Sleep Quality Index in primary insomnia. J. Psychosom. Res. 2002, 53, 737–740. [Google Scholar] [CrossRef]
- Canisius, S.; Roth, H.; Ploch, T.; Loh, A.; Astrid, S.; Werner, C. Validation of Signal Quality in a New Ambulatory Polysomnography System; European Respiratory Society: Stockholm, Sweden, 2007; p. 3523. [Google Scholar]
- Rechtschaffen, A.; Kales, A. A Manual of Standardized Terminology Techniques and Scoring System for Sleep Stages of Human Subjects; Brain Information Service, Brain Research Institute (National Institutes of Health, US): Los Angeles, CA, USA, 1968; Number 204. [Google Scholar]
- American Academy of Sleep Medicine Task Force. Sleep-related breathing disorders in adults: Recommendations for syndrome definition and measurement techniques in clinical research. Sleep 1999, 22, 667–689. [Google Scholar]
- Coleman, R.M.; Guilleminault, C. Periodic movement in sleep (nocturnal myoclonus) and restless legs syndrome. In Sleeping and Waking Disorders: Indications and Techniques; Addison-Wesley: New York, NY, USA, 1982; pp. 265–295. [Google Scholar]
- American Academy of Sleep Medicine (AASM). In International Classification of Sleep Disorders, 2nd ed.; AASM: Westchester, IL, USA, 2005.
© 2015 by the authors; licensee MDPI, Basel, Switzerland. This article is an open access article distributed under the terms and conditions of the Creative Commons Attribution license (http://creativecommons.org/licenses/by/4.0/).
Share and Cite
Veauthier, C.; Gaede, G.; Radbruch, H.; Wernecke, K.-D.; Paul, F. Sleep Disorders Reduce Health-Related Quality of Life in Multiple Sclerosis (Nottingham Health Profile Data in Patients with Multiple Sclerosis). Int. J. Mol. Sci. 2015, 16, 16514-16528. https://doi.org/10.3390/ijms160716514
Veauthier C, Gaede G, Radbruch H, Wernecke K-D, Paul F. Sleep Disorders Reduce Health-Related Quality of Life in Multiple Sclerosis (Nottingham Health Profile Data in Patients with Multiple Sclerosis). International Journal of Molecular Sciences. 2015; 16(7):16514-16528. https://doi.org/10.3390/ijms160716514
Chicago/Turabian StyleVeauthier, Christian, Gunnar Gaede, Helena Radbruch, Klaus-Dieter Wernecke, and Friedemann Paul. 2015. "Sleep Disorders Reduce Health-Related Quality of Life in Multiple Sclerosis (Nottingham Health Profile Data in Patients with Multiple Sclerosis)" International Journal of Molecular Sciences 16, no. 7: 16514-16528. https://doi.org/10.3390/ijms160716514