
A Quantum Chemical and Statistical Study of Cytotoxic Activity of Compounds Isolated from Curcuma zedoaria

 ,
,
Abstract
:
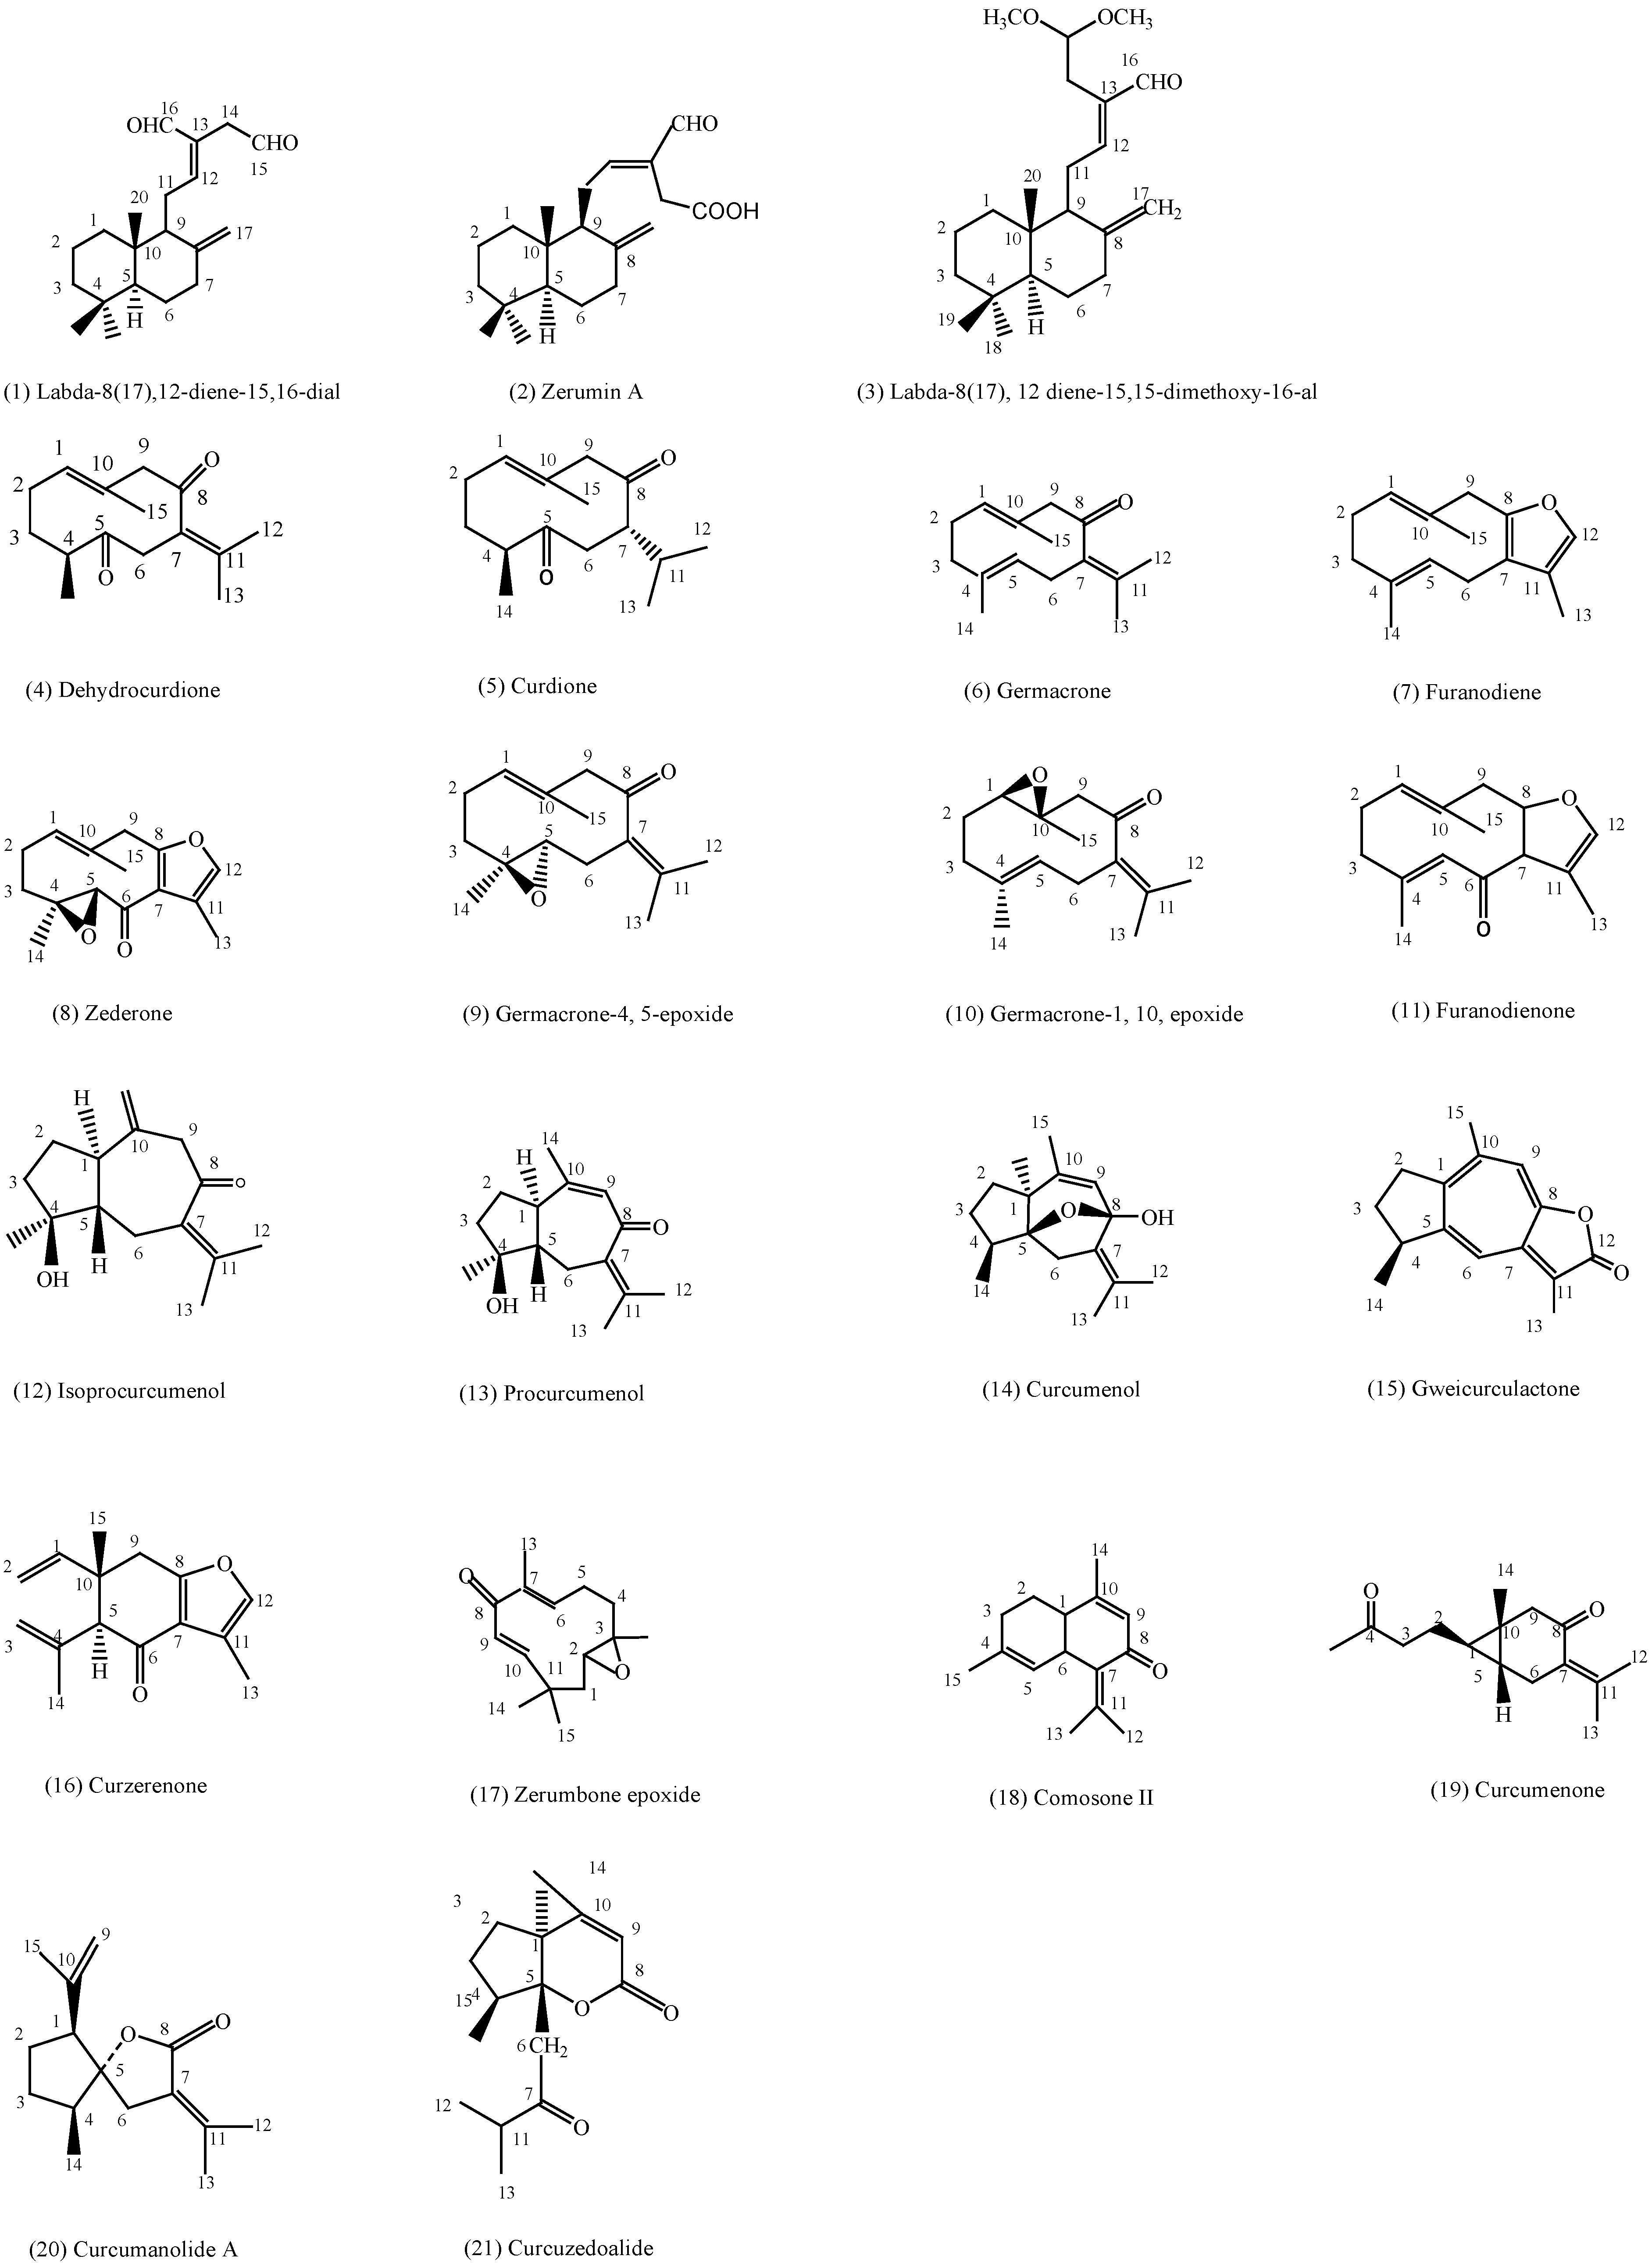
1. Introduction
2. Results and Discussion
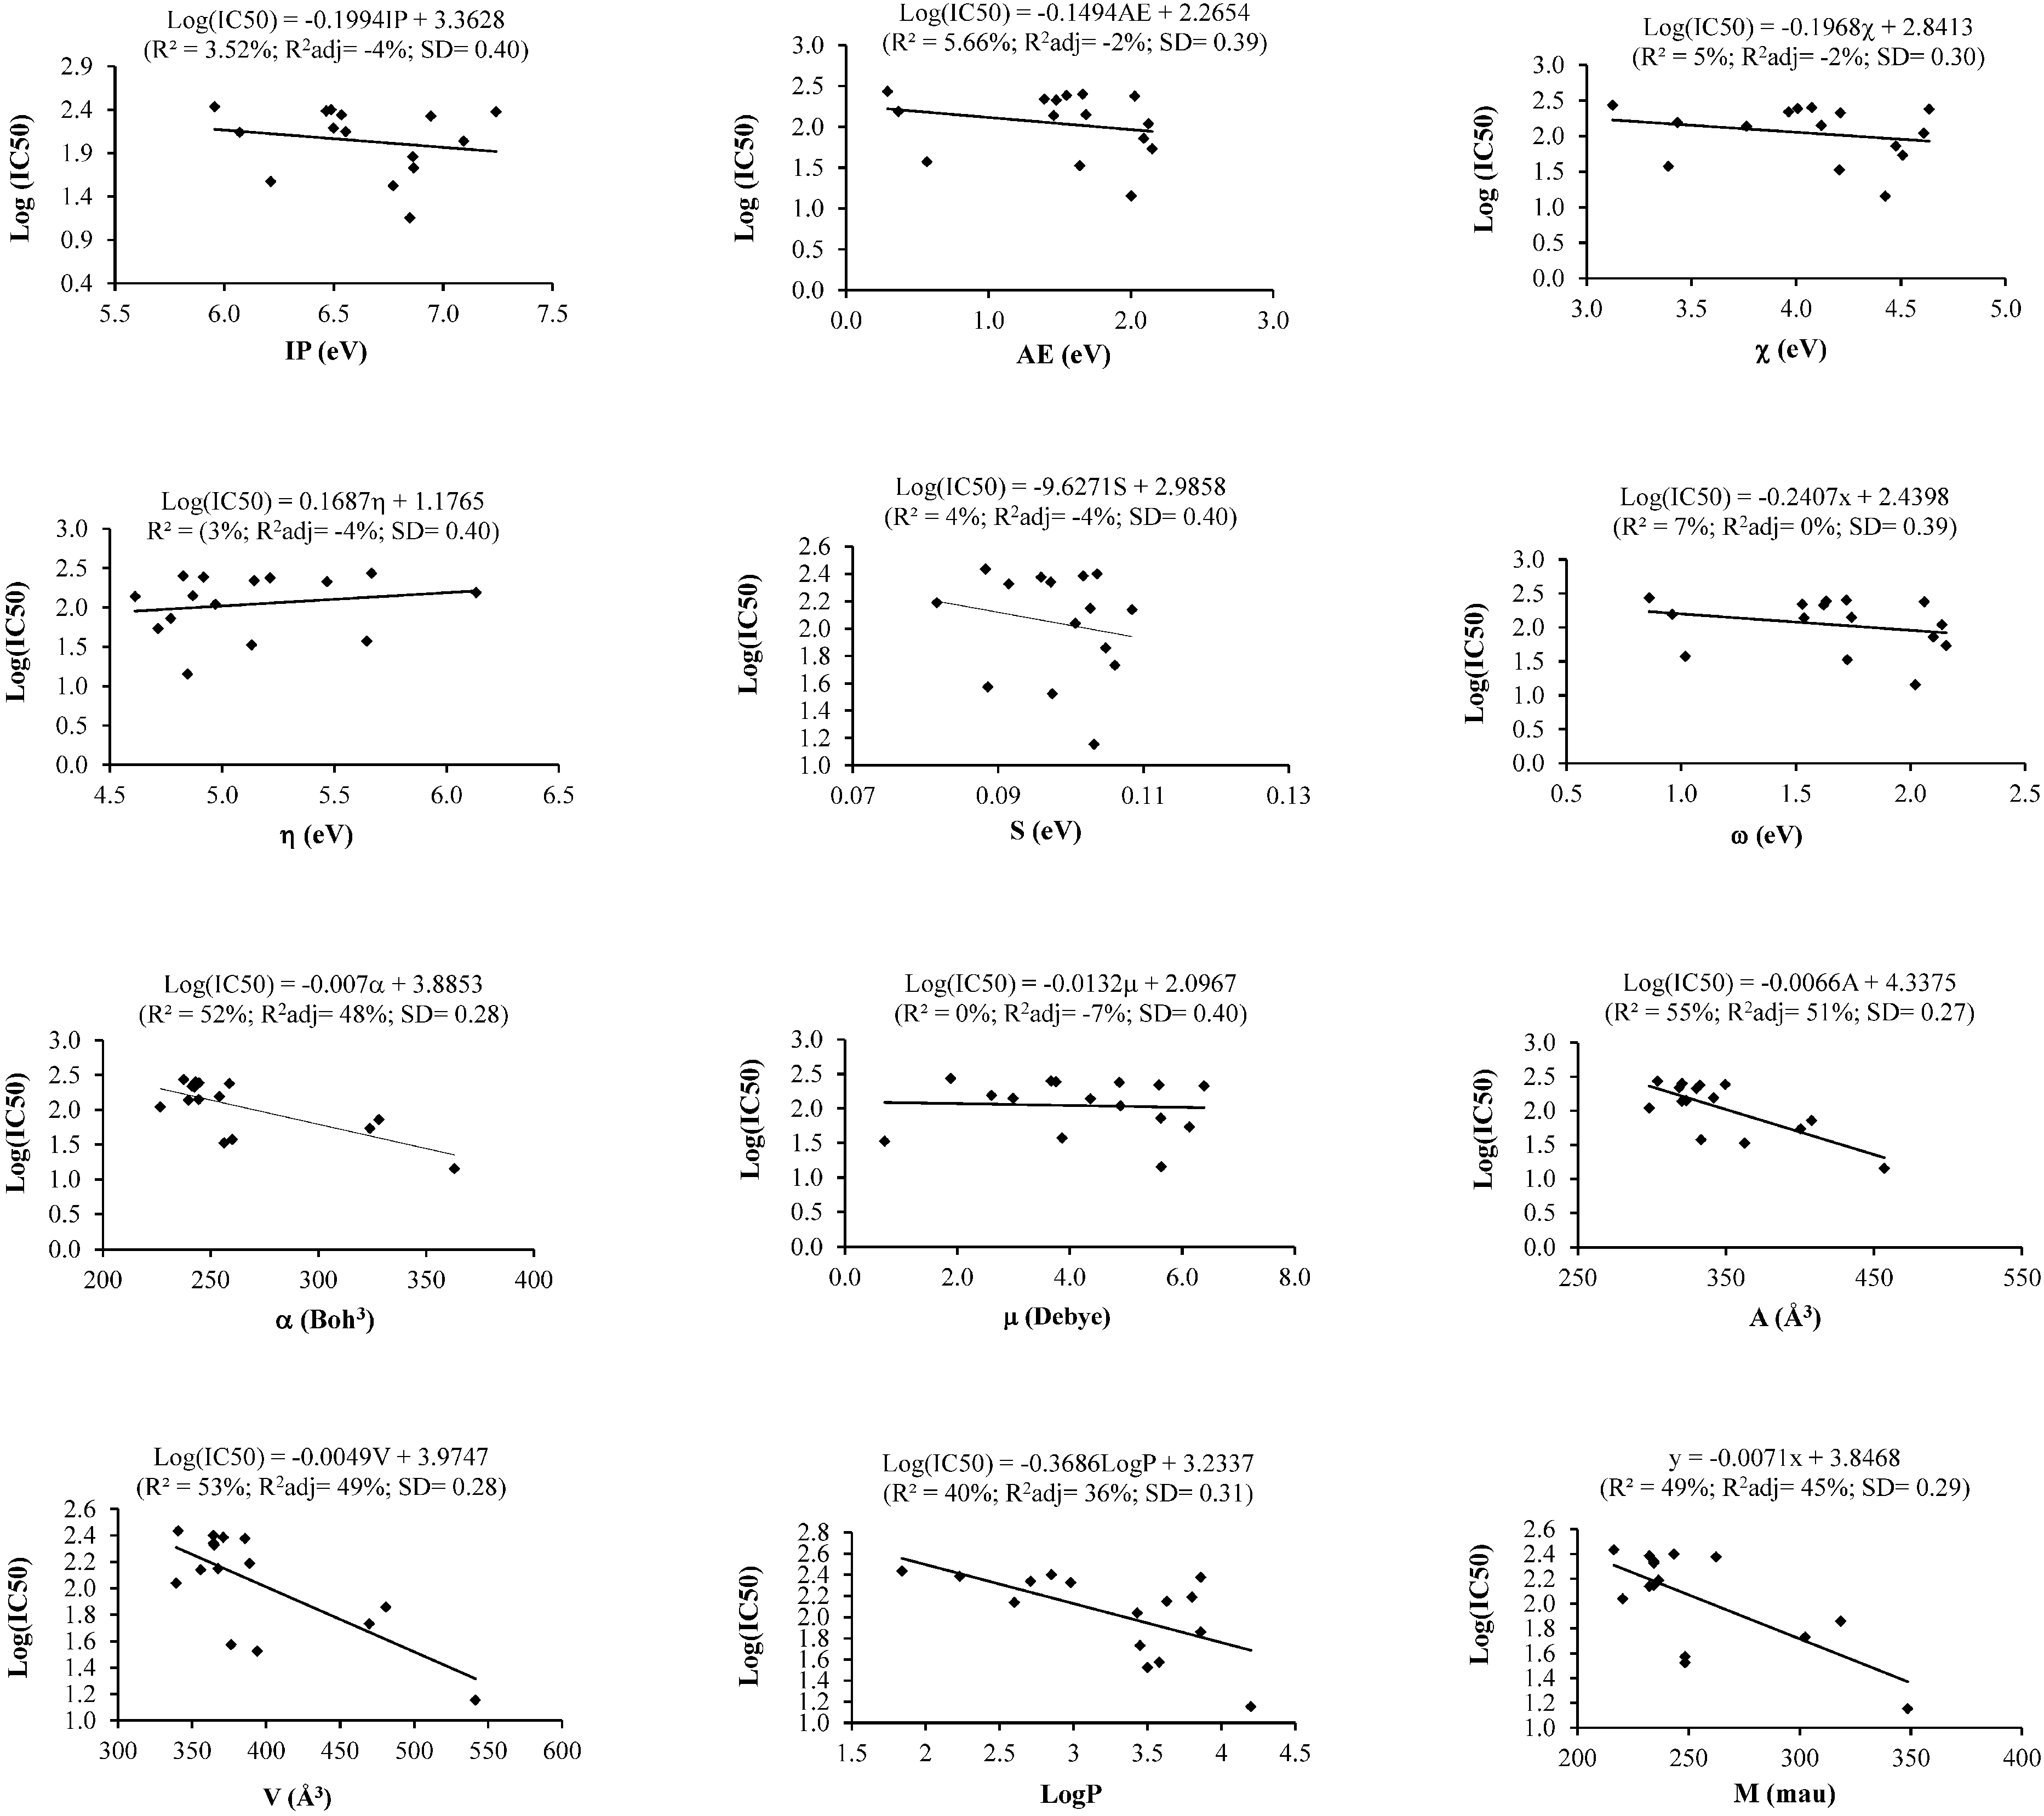
2.1. Simple Linear Regression (SLR) Analysis
2.1.1. Cytotoxicity against MCF-7 Cells and SLR Analysis
2.1.2. Cytotoxicity against Ca Ski Cells and SLR Analysis

| NO. | IP | EA | χ | η | ω | α | μ | A | V | Log P | M | IC50 (µM) a | ||||
|---|---|---|---|---|---|---|---|---|---|---|---|---|---|---|---|---|
| MCF-7 | Ca Ski | PC-3 | HT-29 | HUVEC | ||||||||||||
| 1 | 6.87 | 2.15 | 4.51 | 4.71 | 2.16 | 324 | 6.13 | 400 | 470 | 3.45 | 302.46 | 53.9 ± 0.7 | 47.9 ± 0.3 | 87.0 ± 7.9 | 71.1 ± 10.2 | 149.8 ± 6.3 |
| 2 | 6.86 | 2.09 | 4.48 | 4.77 | 2.10 | 328 | 5.62 | 408 | 481 | 3.86 | 318.46 | 70.0 ± 3.3 | NA b | 68.8 ± 5.0 | 54.6 ± 6.3 | 81.0 ± 6.0 |
| 3 | 6.85 | 2.00 | 4.43 | 4.85 | 2.02 | 363 | 5.63 | 457 | 541 | 4.20 | 348.53 | 14.3 ± 0.6 | NA b | 119.6 ± 9.8 | 138.6 ± 14.6 | 135.7 ± 12.1 |
| 4 | 6.56 | 1.69 | 4.12 | 4.87 | 1.74 | 244 | 2.99 | 323 | 368 | 3.63 | 234.34 | 140.8 ± 4.7 | 92.6 ± 4.7 | 81.5 ± 11.9 | 96.9 ± 10.2 | 102.4 ± 9.0 |
| 5 | 6.52 | 1.26 | 3.89 | 5.26 | 1.44 | 238 | 1.40 | 331 | 377 | 4.01 | 236.35 | NA b | – | – | – | – |
| 6 | 6.40 | 1.39 | 3.89 | 5.01 | 1.51 | 248 | 4.06 | 321 | 355 | 3.81 | 218.34 | NA b | 180.0 ± 5.5 | 252.8 ± 22.4 | 196.5 ± 18.8 | 337.5 ± 1.4 |
| 7 | 5.96 | 0.29 | 3.12 | 5.67 | 0.86 | 238 | 1.88 | 304 | 341 | 1.84 | 216.32 | 271.9 ± 12.0 | NA b | 182.6 ± 20.8 | 218.2 ± 20.3 | 189.1 ± 12.0 |
| 8 | 6.58 | 1.80 | 4.19 | 4.78 | 1.84 | 241 | 6.35 | 313 | 353 | 0.84 | 246.31 | NA b | NA b | 109.6 ± 7.7 | 77.5 ± 10.1 | 170.9 ± 11.0 |
| 9 | 6.54 | 1.39 | 3.96 | 5.14 | 1.53 | 241 | 5.59 | 318 | 364 | 2.71 | 234.34 | 218.8 ± 17.1 | NA b | 187.3 ± 30.7 | 169.0 ± 19.6 | 206.5 ± 20.1 |
| 10 | 6.49 | 1.66 | 4.08 | 4.83 | 1.72 | 243 | 3.67 | 320 | 364 | 2.85 | 243.34 | 251.7 ± 23.9 | NA b | 218.6 ± 20.1 | 299.2 ± 34.1 | 228.1 ± 6.6 |
| 11 | 6.07 | 1.46 | 3.76 | 4.61 | 1.54 | 240 | 4.37 | 320 | 356 | 2.60 | 232.32 | 137.7 ± 6.5 | – | – | – | – |
| 12 | 6.50 | 0.37 | 3.43 | 6.13 | 0.96 | 254 | 2.61 | 342 | 389 | 3.80 | 236.4 | 154.5 ± 17.8 | NA b | 158.2 ± 19.0 | 218.3 ± 16.5 | 190.8 ± 12.7 |
| 13 | 6.54 | 1.77 | 4.16 | 4.78 | 1.81 | 252 | 7.48 | 327 | 362 | 2.71 | 234.34 | 127.2 ±9.4 | 266.3 ± 1.3 | 56.8 ± 7.3 | 66.1 ± 9.8 | 69.6 ± 4.3 |
| 14 | 6.21 | 0.57 | 3.39 | 5.64 | 1.02 | 260 | 3.86 | 333 | 376 | 3.58 | 248.37 | 37.4 ± 37.4 | 74.5 ± 4.0 | 69.7 ± 4.8 | 99.9 ± 10.9 | 104.3 ± 5.6 |
| 15 | 5.71 | 2.26 | 3.99 | 3.45 | 2.30 | 290 | 11.67 | 305 | 330 | 3.46 | 228.29 | 136.8 ± 14.1 | NA b | 167.8 ± 9.6 | 156.4 ± 25.4 | 314.1 ± 26.7 |
| 16 | 6.47 | 1.55 | 4.01 | 4.92 | 1.63 | 245 | 3.76 | 350 | 371 | 2.23 | 232.32 | 243.2 ± 13.8 | – | – | – | – |
| 17 | 7.09 | 2.12 | 4.61 | 4.97 | 2.14 | 227 | 4.90 | 298 | 339 | 3.43 | 220.31 | 109.4 ± 0.5 | 156.6 ± 2.7 | 49.0 ± 8.6 | 62.2 ± 12.3 | 64.5 ± 5.0 |
| 18 | 6.51 | 1.80 | 4.15 | 4.71 | 1.83 | 247 | 6.66 | 310 | 340 | 3.51 | 216.32 | NA b | 351.3 ± 5.5 | NA b | NA b | NA b |
| 19 | 6.77 | 1.64 | 4.21 | 5.13 | 1.72 | 256 | 0.71 | 362 | 394 | 3.5 | 248.37 | 32.2 ± 4.0 | NA b | 160.2 ± 16.9 | 174.3 ± 25.0 | 201.3 ± 34.6 |
| 20 | 6.94 | 1.48 | 4.21 | 5.47 | 1.62 | 243 | 6.39 | 330 | 365 | 2.98 | 234.34 | 212.4 ± 13.2 | 80.2 ± 10.2 | 90.9 ± 13.7 | 92.6 ± 29.9 | – |
| 21 | 7.24 | 2.03 | 4.63 | 5.21 | 2.06 | 259 | 4.88 | 332 | 386 | 3.86 | 262.35 | 238.0 ± 13.8 | 236.7 ± 30.9 | 221.8 ± 13.3 | 172.7 ± 29.7 | – |

| Descriptor/s/SLR on Cells | MCF-7 | Ca Ski | PC-3 | HT-29 | HUVEC | ||||||||||||
|---|---|---|---|---|---|---|---|---|---|---|---|---|---|---|---|---|---|
| %R2 | %R2adj | SD | %R2 | %R2adj | SD | %R2 | %R2adj | SD | %R2 | %R2adj | SD | %R2 | %R2adj | SD | |||
| IP | 4 | −4 | 0.40 | 0 | −14 | 0.31 | 8 | 2 | 0.22 | 14 | 8 | 0.22 | 30 | 24 | 0.19 | ||
| EA | 6 | −2 | 0.39 | 6 | −8 | 0.30 | 5 | −2 | 0.23 | 19 | 14 | 0.21 | 3 | −4 | 0.23 | ||
| χ | 5 | −2 | 0.39 | 2 | −11 | 0.31 | 8 | 2 | 0.22 | 23 | 18 | 0.20 | 13 | 7 | 0.21 | ||
| η | 3 | −4 | 0.40 | 11 | −2 | 0.30 | 0 | −6 | 0.23 | 5 | −2 | 0.23 | 2 | −6 | 0.23 | ||
| S | 4 | −4 | 0.40 | 10 | −3 | 0.30 | 0 | −7 | 0.23 | 2 | −5 | 0.23 | 5 | −3 | 0.23 | ||
| ω | 7 | 0 | 0.39 | 4 | −10 | 0.31 | 5 | −1 | 0.23 | 14 | 19 | 0.21 | 3 | −4 | 0.23 | ||
| α | 52 | 48 | 0.28 | 28 | 18 | 0.27 | 2 | −5 | 0.23 | 5 | −1 | 0.23 | 1 | −7 | 0.23 | ||
| DM | 0 | −7 | 0.40 | 9 | −4 | 0.30 | 4 | −3 | 0.23 | 13 | 7 | 0.22 | 0 | −8 | 0.23 | ||
| A | 55 | 51 | 0.27 | 42 | 33 | 0.24 | 2 | −4 | 0.23 | 4 | −2 | 0.23 | 3 | −4 | 0.23 | ||
| V | 53 | 49 | 0.28 | 43 | 34 | 0.24 | 3 | −4 | 0.23 | 5 | −1 | 0.23 | 5 | −2 | 0.22 | ||
| Log P | 40 | 36 | 0.31 | 0 | −14 | 0.31 | −7 | 0 | 0.23 | 0 | −6 | 0.23 | 1 | −7 | 0.23 | ||
| M | 49 | 45 | 0.29 | 36 | 26 | 0.25 | 4 | −3 | 0.23 | 8 | 2 | 0.22 | −1 | 6 | 0.22 | ||
2.1.3. Cytotoxicity against PC-3 Cells and SLR Analysis
2.1.4. Cytotoxicity against HT-29 Cells and SLR Analysis
2.1.5. Cytotoxicity against HUVEC Cells and SLR Analysis
2.2. Multiple Linear Regression (MLR) Analysis
2.2.1. Cytotoxicity against MCF-7 Cells and MLR Analysis
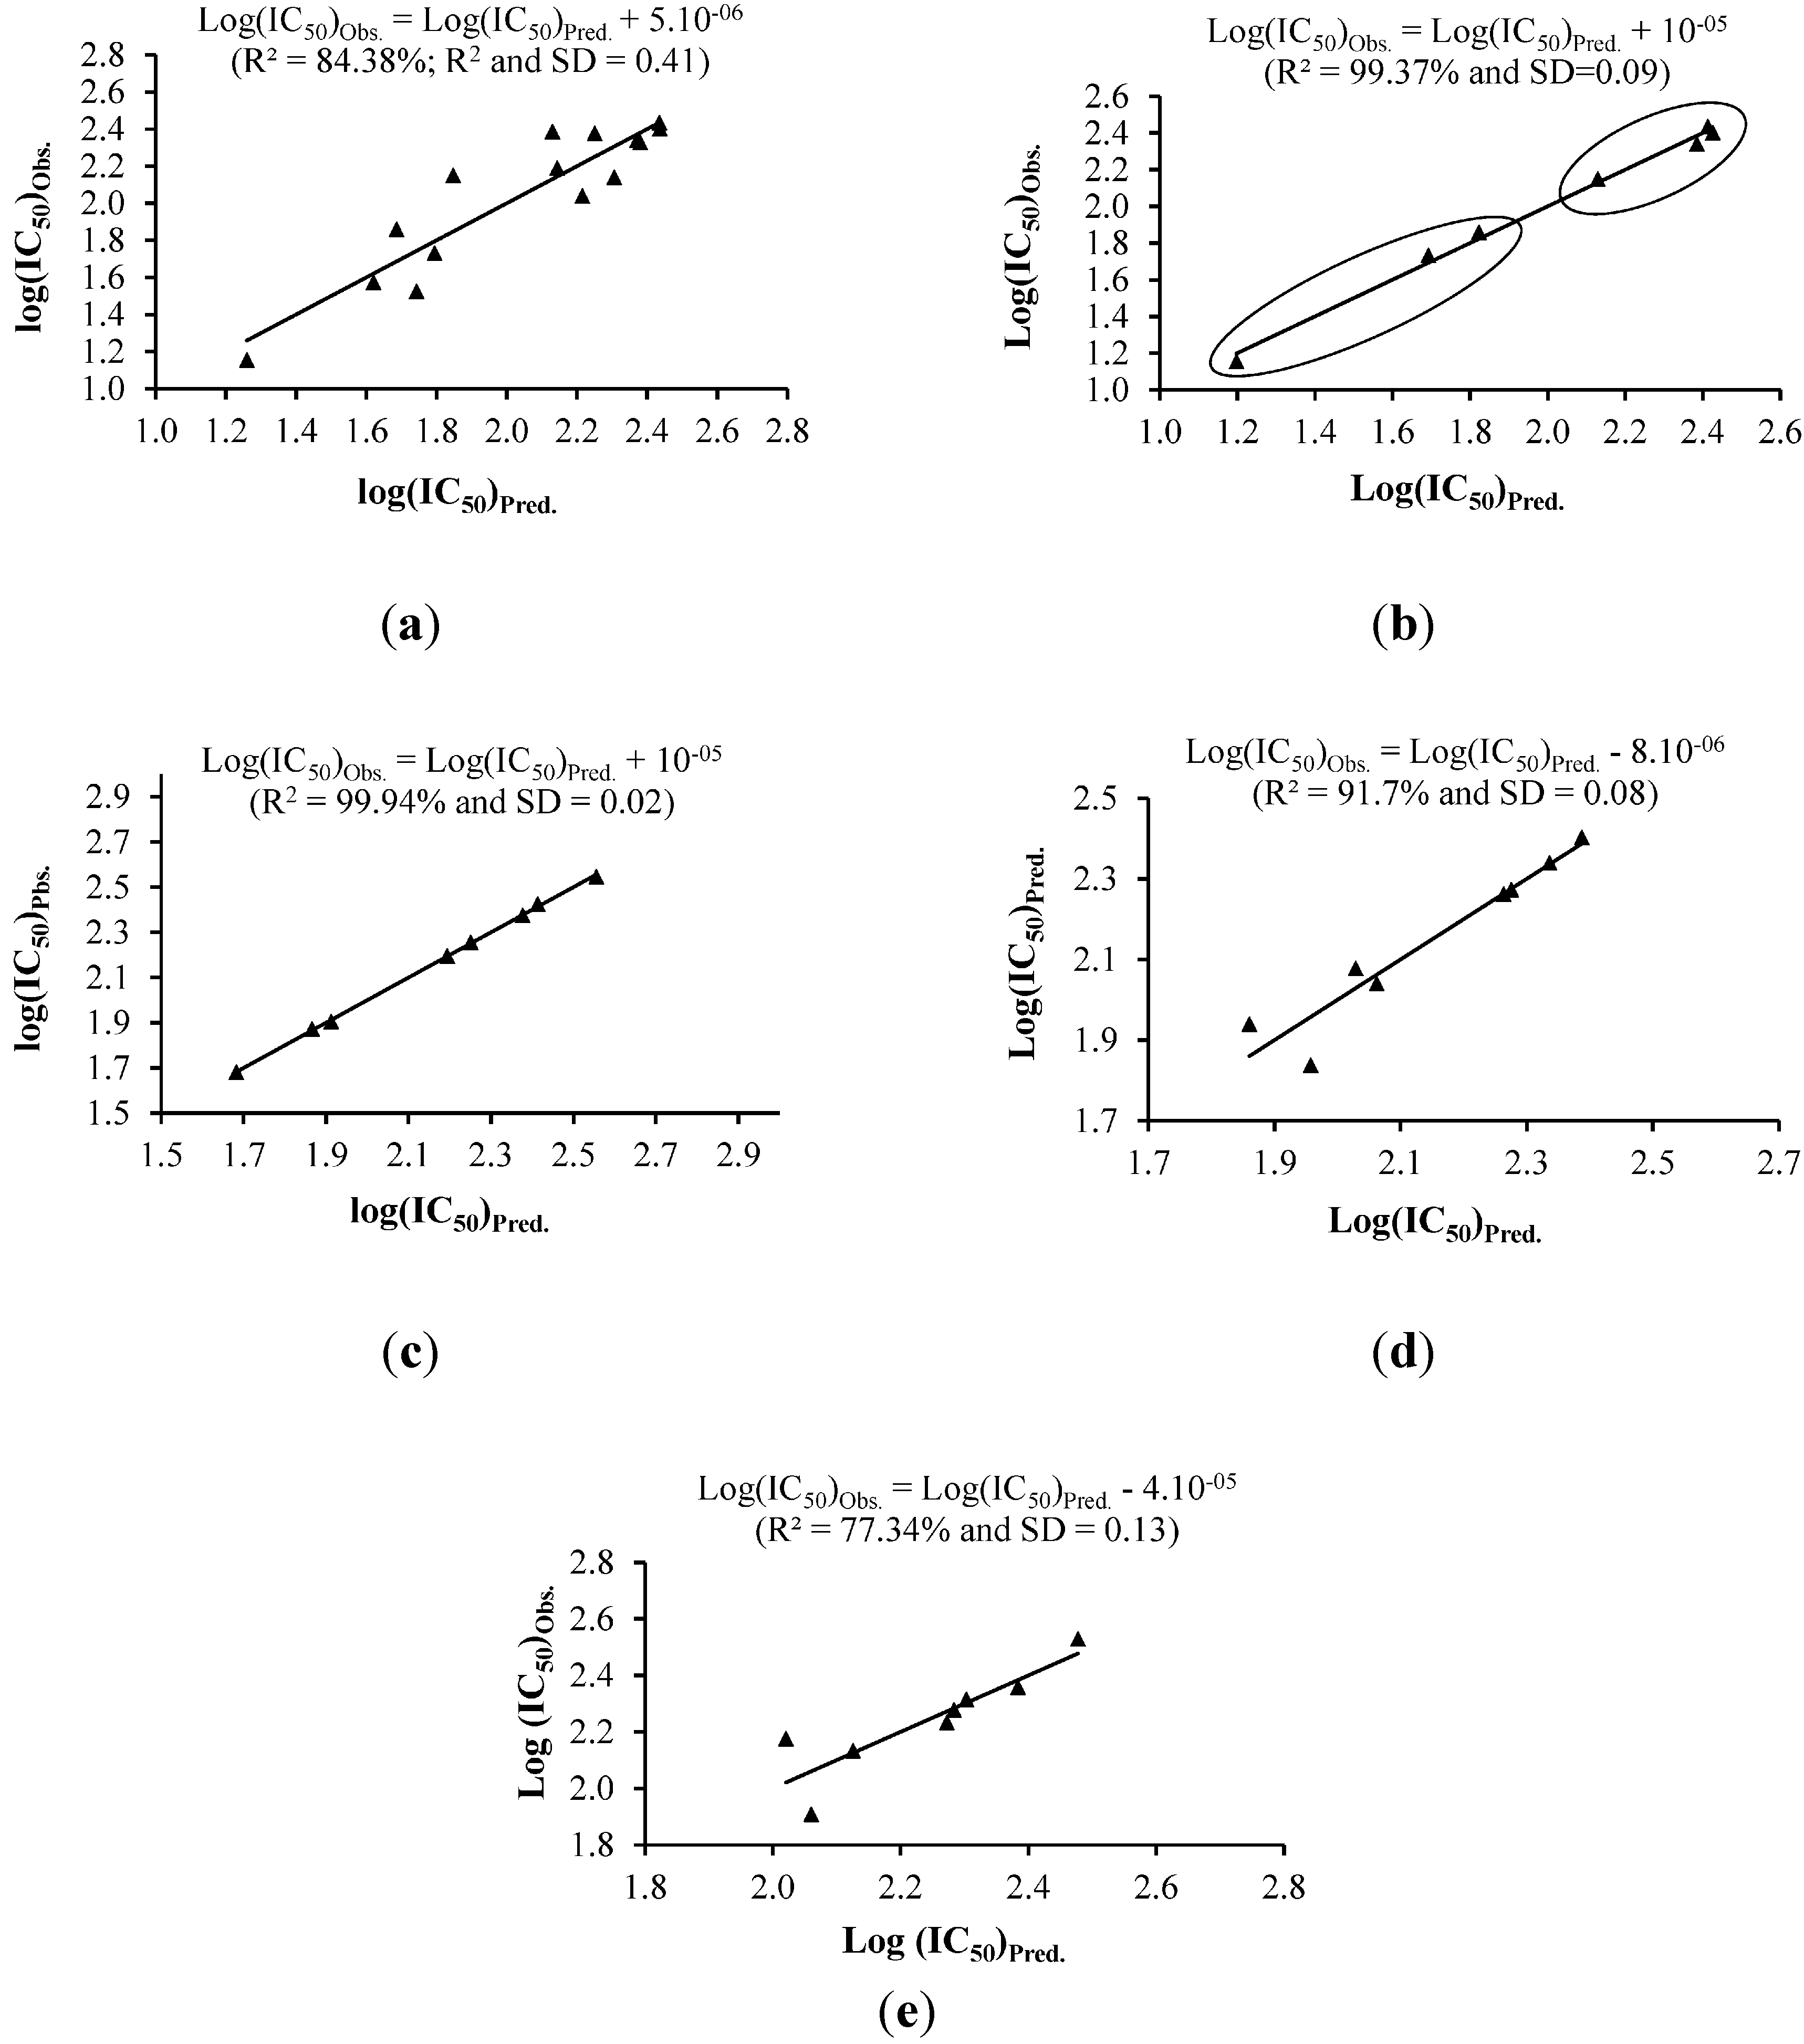
2.2.2. Cytotoxicity against Ca Ski Cells and MLR Analysis
2.2.3. Cytotoxicity against PC-3 Cells and MLR Analysis
| NO. | Equation (1) | Equation (2) | Equation (3) | Equation (5) | Equation (6) | |||||
|---|---|---|---|---|---|---|---|---|---|---|
| log(IC50)Pred. | Resid. | log(IC50)Pred. | Resid. | log(IC50)Pred. | Resid. | log(IC50)Pred. | Resid. | log(IC50)Pred. | Resid. | |
| 1 | 1.79 | 0.06 | 1.73 | 1.69 | 1.68 | 0.00 | 1.86 | −0.08 | 2.02 | 2.18 |
| 2 | 1.69 | −0.17 | 1.86 | 1.82 | – | – | 1.96 | 0.12 | 2.06 | 1.91 |
| 3 | 1.26 | 0.11 | 1.15 | 1.20 | – | – | 2.03 | −0.05 | 2.13 | 2.13 |
| 4 | 1.85 | −0.30 | 2.15 | 2.13 | – | – | 2.39 | −0.02 | – | – |
| 5 | – | – | – | – | – | – | 2.26 | 0.00 | – | – |
| 6 | – | – | – | – | 2.26 | 0.00 | 2.06 | 0.02 | 2.48 | 2.53 |
| 7 | 2.43 | 0.00 | 2.43 | 2.41 | – | – | 2.28 | 0.00 | 2.28 | 2.28 |
| 8 | – | – | – | – | – | – | 2.34 | 0.00 | 2.27 | 2.23 |
| 9 | 2.37 | 0.03 | 2.34 | 2.39 | – | – | – | – | 2.30 | 2.32 |
| 10 | 2.44 | 0.04 | 2.40 | 2.43 | – | – | – | – | 2.38 | 2.36 |
| 11 | 2.31 | 0.17 | – | – | – | – | – | – | – | – |
| 12 | 2.14 | −0.05 | – | – | – | – | – | – | – | – |
| 13 | – | – | – | – | 2.43 | -0.01 | – | – | – | – |
| 14 | 1.62 | 0.05 | – | – | 1.87 | -0.01 | – | – | – | – |
| 15 | – | – | – | – | – | – | – | – | – | – |
| 16 | 2.13 | −0.26 | – | – | – | – | – | – | – | – |
| 17 | 2.22 | 0.18 | – | – | 2.19 | 0.00 | – | – | – | – |
| 18 | – | – | – | – | 2.55 | 0.01 | – | – | – | – |
| 19 | 1.74 | 0.22 | – | – | – | – | – | – | – | – |
| 20 | 2.38 | 0.05 | – | – | 1.90 | 0.01 | – | – | – | – |
| 21 | 2.25 | −0.13 | – | – | 2.37 | 0.00 | – | – | – | – |
2.2.4. Cytotoxicity against HT-29 Cells and MLR Analysis
2.2.5. Cytotoxicity against HUVEC Cells and MLR Analysis
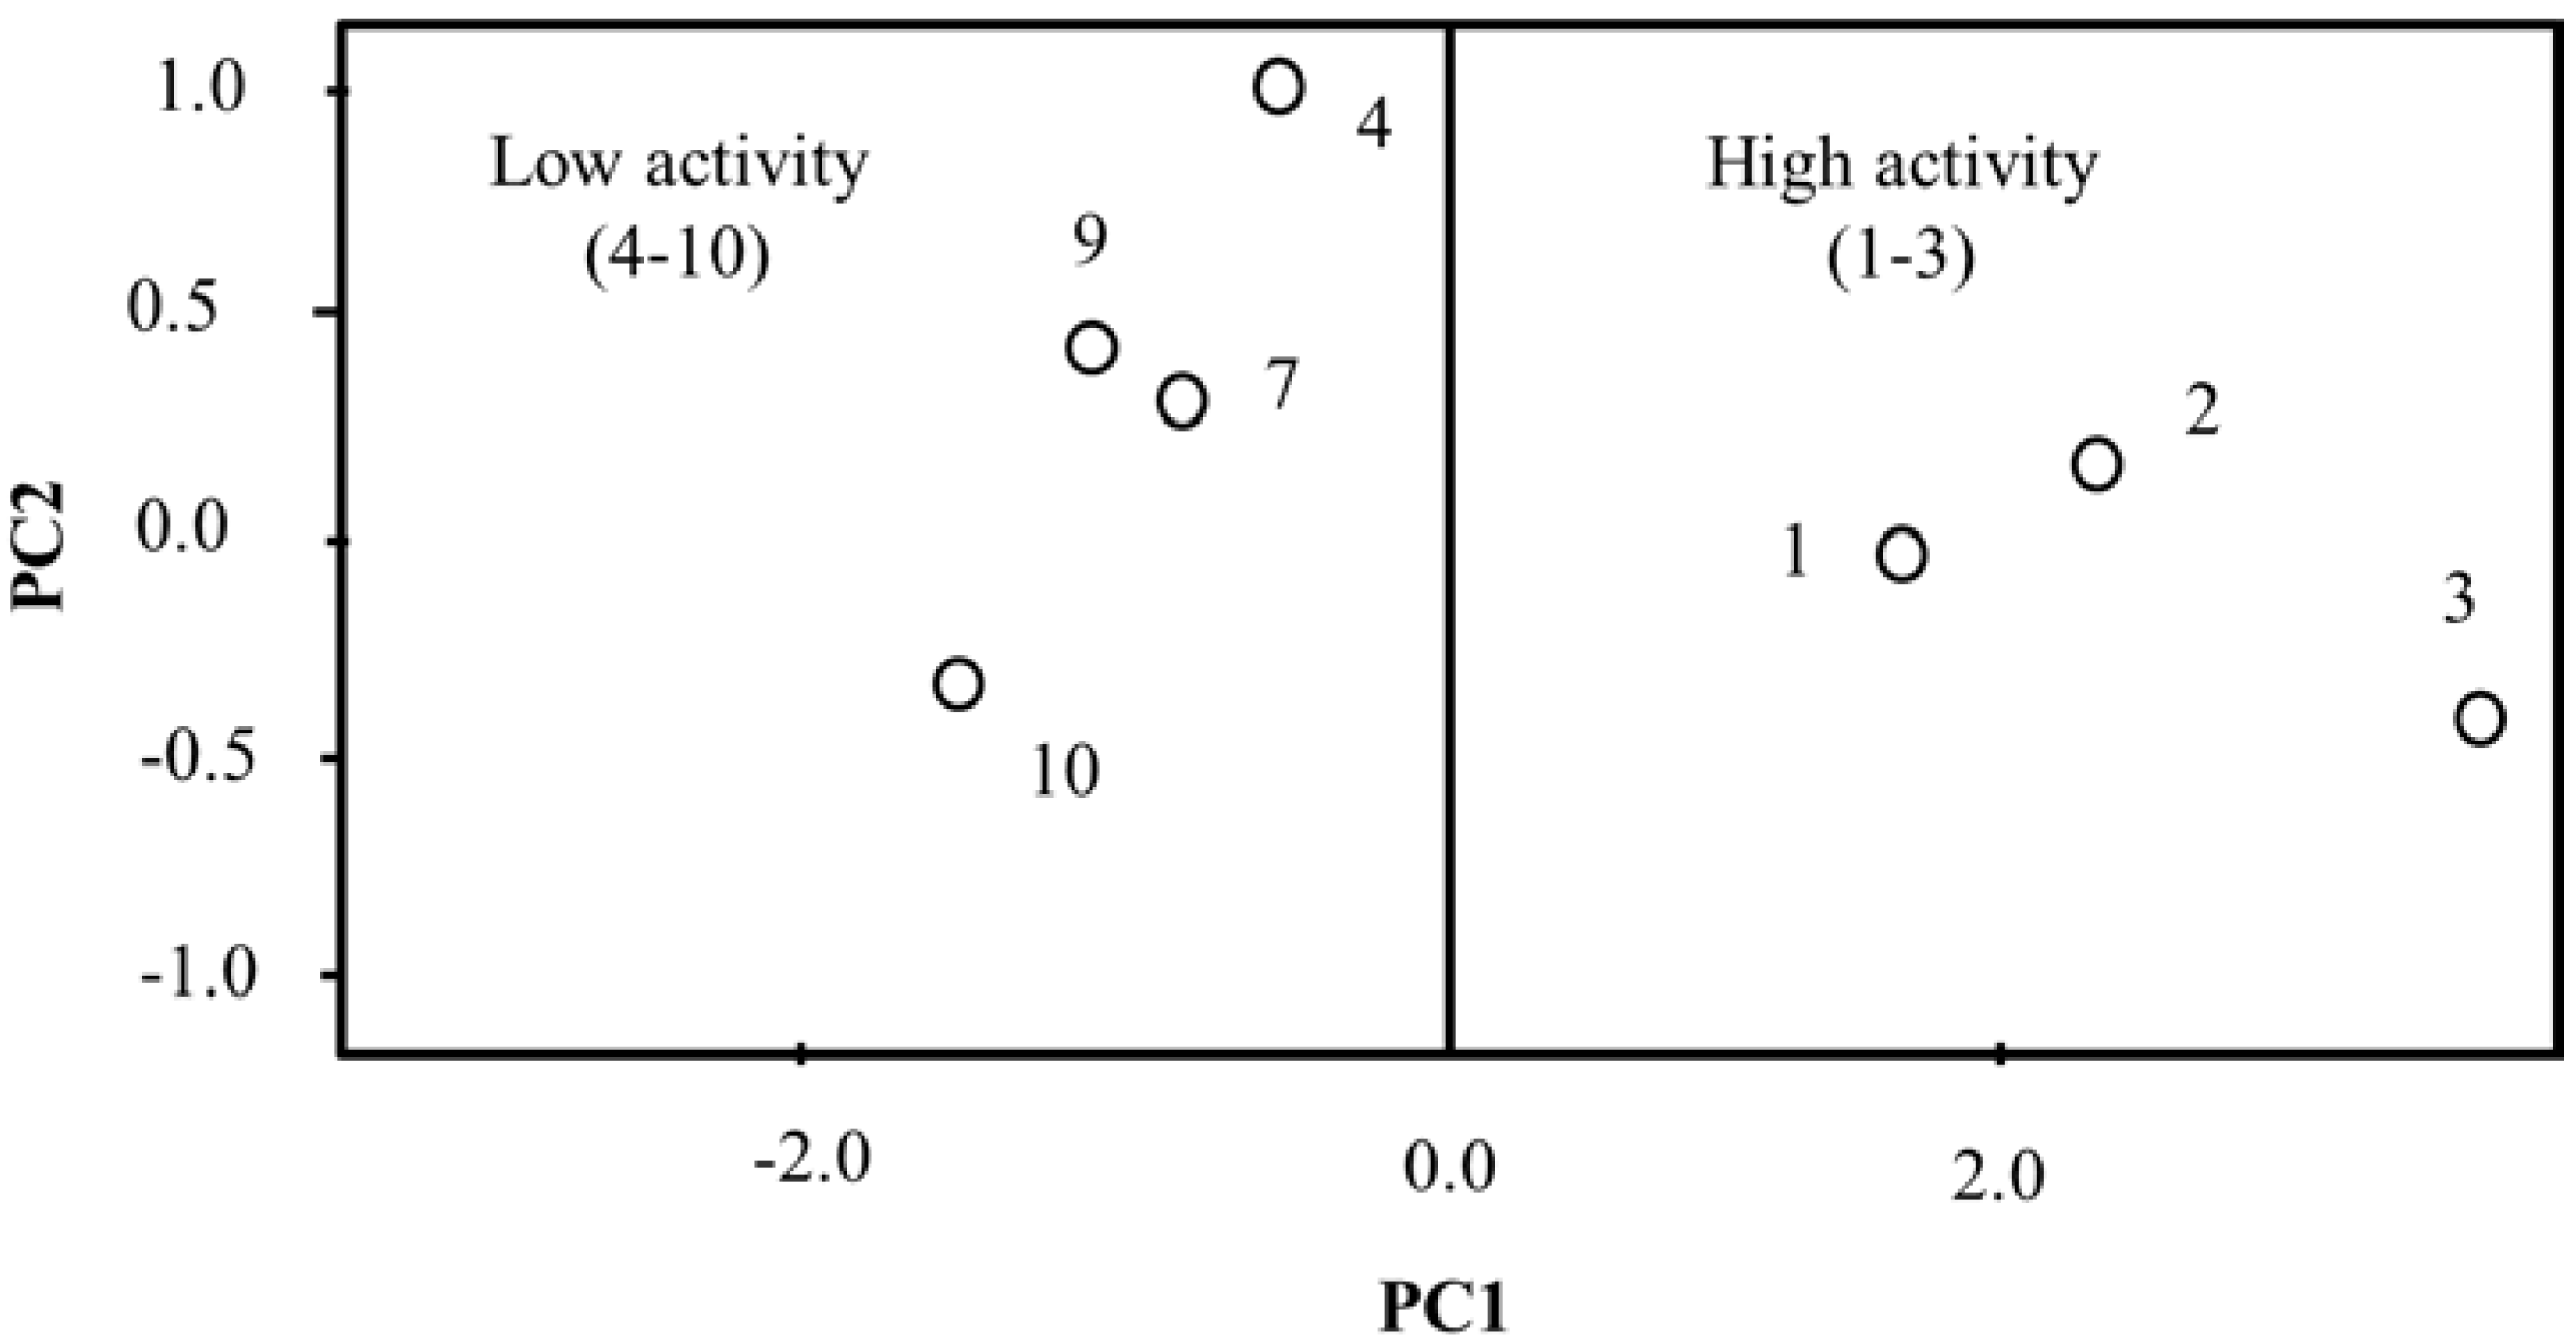
2.3. Principal Component Analysis (PCA)
| Component | Eigenvalue | Variance (%) | Cumulated Variance (%) |
|---|---|---|---|
| PC1 | 4.525 | 90.50 | 90.50 |
| PC2 | 0.3560 | 7.12 | 97.62 |
| PC3 | 0.1134 | 2.27 | 99.89 |
| Variable | PC1 | PC2 | PC3 |
|---|---|---|---|
| IP | 0.43 | 0.61 | 0.66 |
| A | 0.46 | −0.38 | −0.04 |
| V | 0.46 | −0.34 | 0.04 |
| logP | 0.43 | 0.51 | −0.74 |
| M | 0.46 | −0.32 | 0.08 |

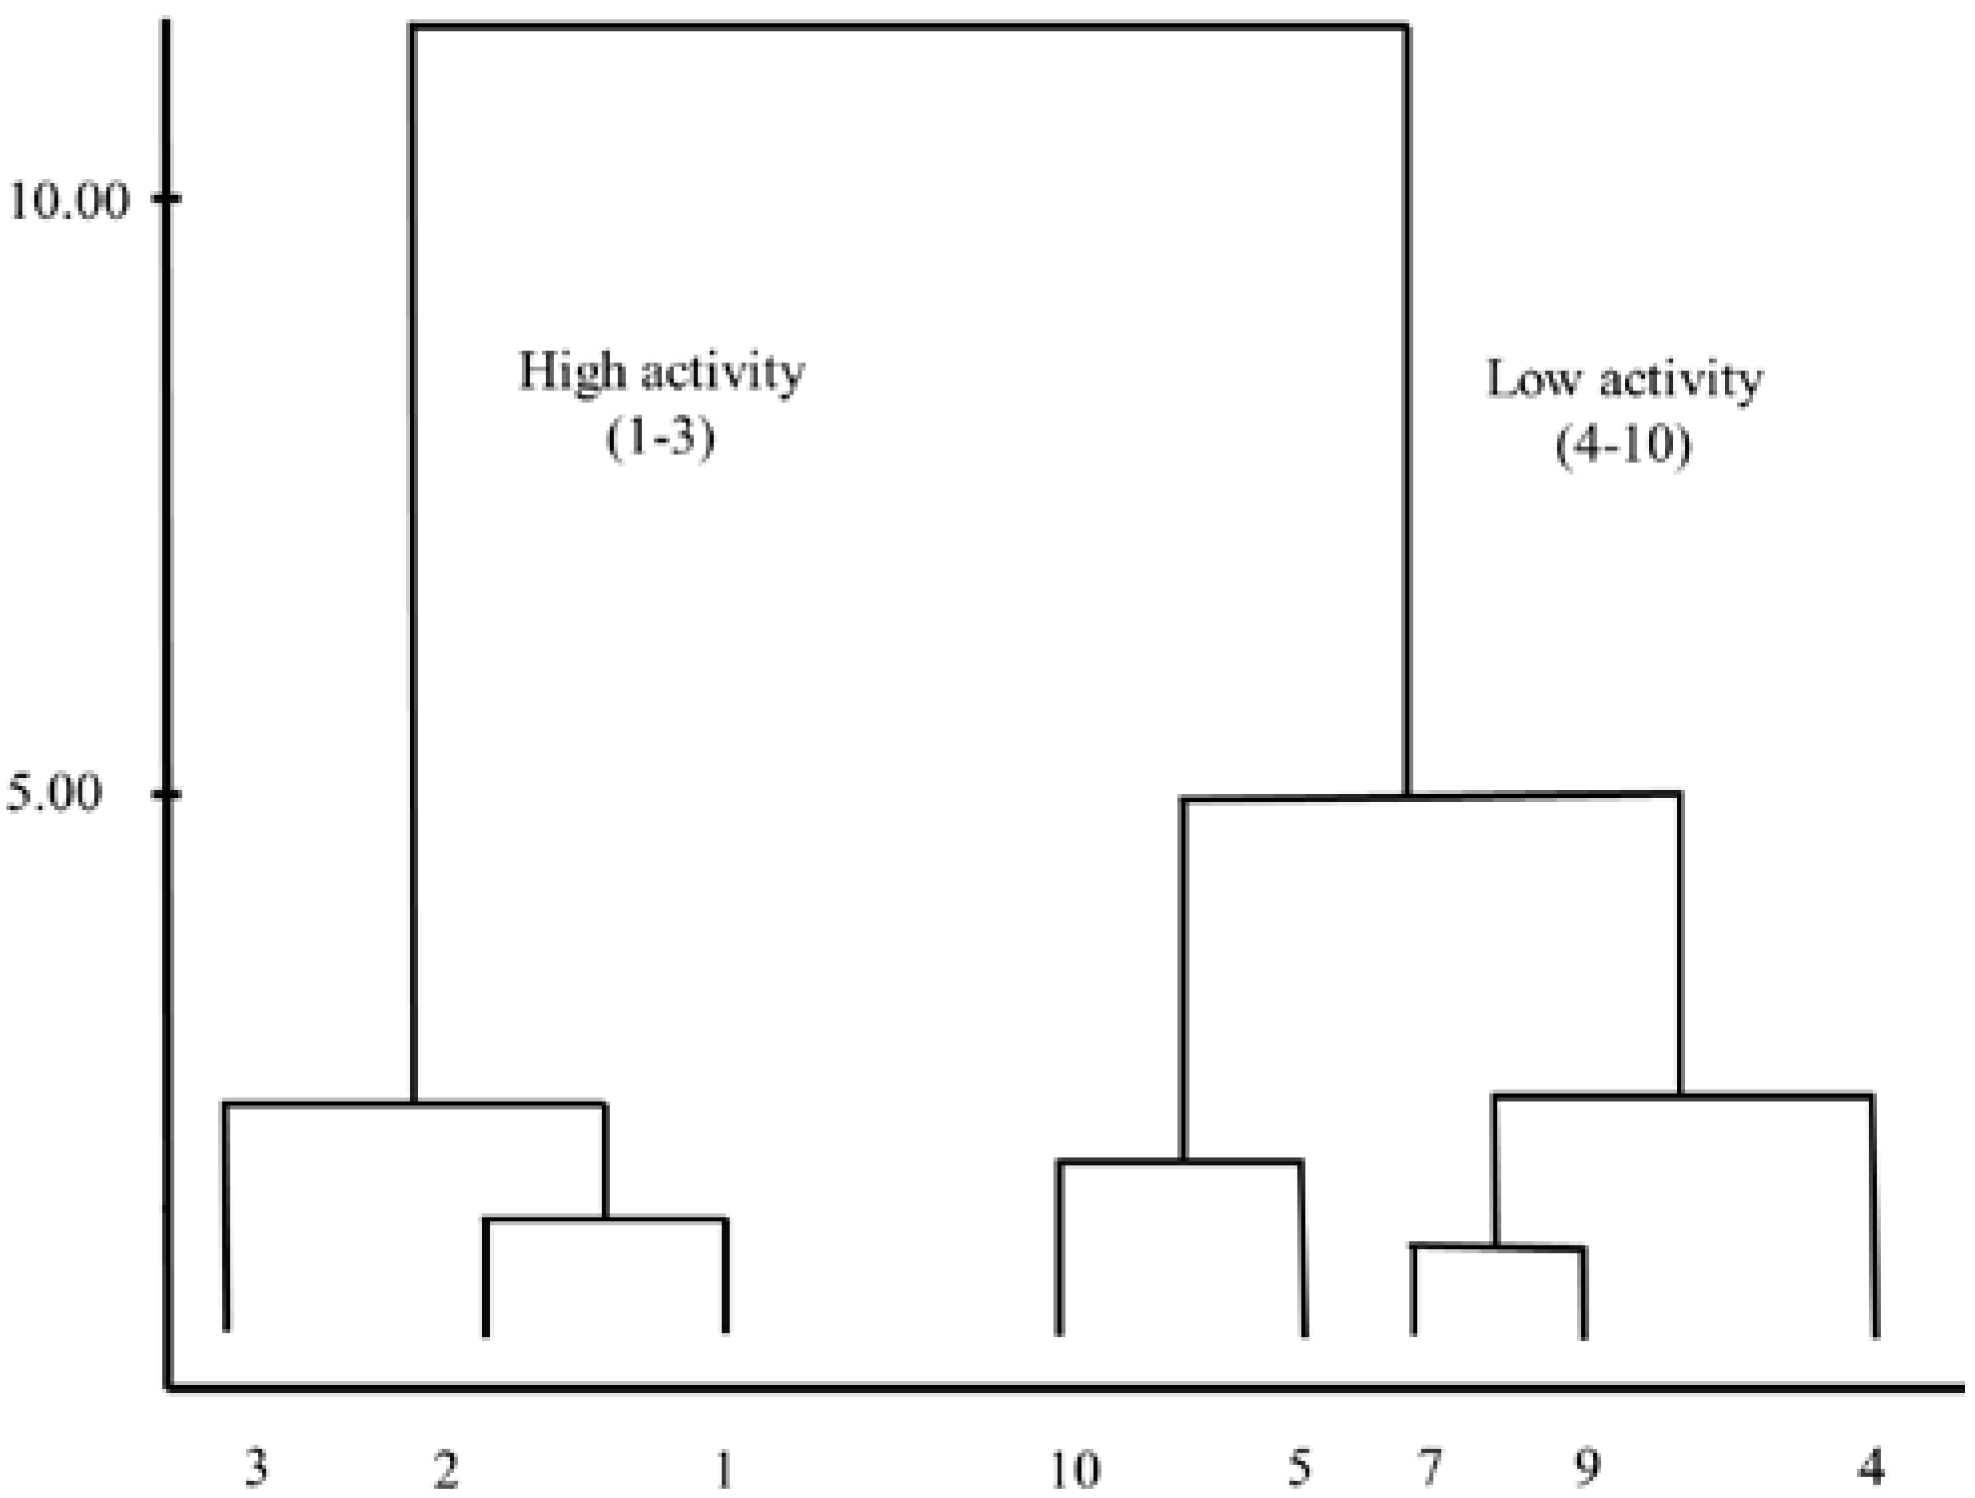
2.4. Hierarchical Cluster Analysis (HCA)
3. Experimental Section
3.1. Extraction and Isolation of Compounds from C. zedoaria
3.2. Theoretical Calculations
4. Conclusions
Acknowledgments
Supplementary Materials
Author Contributions
Conflicts of Interest
References
- Lobo, R.; Prabhu, K.S.; Shirwaikar, A.; Shirwaikar, A. Curcuma zedoaria Rosc. (white turmeric): A review of its chemical, pharmacological and ethnomedicinal properties. J. Pharm. Pharmacol. 2009, 61, 13–21. [Google Scholar]
- Wilson, B.; Abraham, G.; Manju, V.; Mathew, M.; Vimala, B.; Sundaresan, S.; Nambisan, B. Antimicrobial activity of Curcuma zedoaria and Curcuma malabarica tubers. J. Ethnopharmacol. 2005, 99, 147–151. [Google Scholar] [CrossRef] [PubMed]
- Nadkarni, K.M. Indian Materia Medica; Popular Prakashan: Mumbai, India, 1996; Volume 1. [Google Scholar]
- Etoh, H.; Kondoh, T.; Yoshioka, N.; Sugiyama, K.; Ishikawa, H.; Tanaka, H. 9-Oxo-neoprocurcumenol from Curcuma aromatica (Zingiberaceae) as an attachment inhibitor against the blue mussel, Mytilus edulis galloprovincialis. Biosci. Biotechnol. Biochem. 2003, 67, 911–913. [Google Scholar] [CrossRef] [PubMed]
- Yoshioka, T.; Fujii, E.; Endo, M.; Wada, K.; Tokunaga, Y.; Shiba, N.; Hohsho, H.; Shibuya, H.; Muraki, T. Antiinflammatory potency of dehydrocurdione, a zedoary-derived sesquiterpene. Inflamm. Res. 1998, 47, 476–481. [Google Scholar] [CrossRef] [PubMed]
- Larsen, K.; Ibrahim, H.; Khaw, S.; Saw, L. Gingers of Peninsular Malaysia and Singapore; Natural History Publications: Borneo, Malaysia, 1999. [Google Scholar]
- Souza, J., Jr.; de Almeida Santos, R.H.; Ferreira, M.M.C.; Molfetta, F.A.; Camargo, A.J.; Maria Honório, K.; da Silva, A.B.F. A quantum chemical and statistical study of flavonoid compounds (flavones) with anti-HIV activity. Eur. J. Med. Chem. 2003, 38, 929–938. [Google Scholar] [CrossRef] [PubMed]
- Kikuchi, O. Systematic QSAR procedures with quantum chemical descriptors. Quant. Struct. Act. Relatsh. 1987, 6, 179–184. [Google Scholar] [CrossRef]
- Dugas, A.J., Jr.; Castaneda-Acosta, J.; Bonin, G.C.; Price, K.L.; Fischer, N.H.; Winston, G.W. Evaluation of the total peroxyl radical-scavenging capacity of flavonoids: Structure-activity relationships. J. Nat. Prod. 2000, 63, 327–331. [Google Scholar] [CrossRef] [PubMed]
- Camargo, A.; Mercadante, R.; Honório, K.; Alves, C.; Da Silva, A. A structure–activity relationship (SAR) study of synthetic neolignans and related compounds with biological activity against Escherichia coli. Comp. Theor. Chem. 2002, 583, 105–116. [Google Scholar]
- Alves, C.N.; Macedo, L.G.D.; Honório, K.M.; Camargo, A.J.; Santos, L.S.; Jardim, I.N.; Barata, L.E.; Silva, A.B.D. A structure-activity relationship (SAR) study of neolignan compounds with anti-schistosomiasis activity. J. Braz. Chem. Soc. 2002, 13, 300–307. [Google Scholar] [CrossRef]
- Lameira, J.; Medeiros, I.; Reis, M.; Santos, A.; Alves, C. Structure–activity relationship study of flavone compounds with anti-HIV-1 integrase activity: A density functional theory study. Bioorg. Med. Chem. 2006, 14, 7105–7112. [Google Scholar] [CrossRef] [PubMed]
- Yang, H.-L.; Huang, F.-R. Quantum chemical and statistical study of hypocrellin dyes with phototoxicity against tumor cells. Dyes Pigment. 2007, 74, 416–423. [Google Scholar] [CrossRef]
- Ishihara, M.; Wakabayashi, H.; Motohashi, N.; Sakagami, H. Quantitative structure-cytotoxicity relationship of newly synthesized tropolones determined by a semiempirical molecular-orbital method (PM5). Anticancer Res. 2010, 30, 129–133. [Google Scholar] [PubMed]
- Stanchev, S.; Momekov, G.; Jensen, F.; Manolov, I. Synthesis, computational study and cytotoxic activity of new 4-hydroxycoumarin derivatives. Eur. J. Med. Chem. 2008, 43, 694–706. [Google Scholar] [CrossRef] [PubMed]
- Yang, H.L.; Chen, G.H.; Li, Y.Q. A quantum chemical and statistical study of ganoderic acids with cytotoxicity against tumor cell. Eur. J. Med. Chem. 2005, 40, 972–976. [Google Scholar] [CrossRef] [PubMed]
- Ishihara, M.; Yokote, Y.; Sakagami, H. Quantitative structure-cytotoxicity relationship analysis of coumarin and its derivatives by semiempirical molecular orbital method. Anticancer Res. 2006, 26, 2883–2886. [Google Scholar] [PubMed]
- Hamdi, O.A.A.; Syed Abdul Rahman, S.N.; Awang, K.; Abdul Wahab, N.; Looi, C.Y.; Thomas, N.F.; Abd Malek, S.N. Cytotoxic constituents from the rhizomes of Curcuma zedoaria. Sci. World J. 2014, 2014, 1–11. [Google Scholar] [CrossRef]
- Johnson, R.A.; Wichern, D.W. Applied Multivariate Statistical Analysis; Prentice Hall: Upper Saddle River, NJ, USA, 2002; Volume 5. [Google Scholar]
- Kowalski, B.; Bender, C. Pattern recognition. Powerful approach to interpreting chemical data. J. Am. Chem. Soc. 1972, 94, 5632–5639. [Google Scholar] [CrossRef]
- Xu, F.; Nakamura, S.; Qu, Y.; Matsuda, H.; Pongpiriyadacha, Y.; Wu, L.; Yoshikawa, M. Structures of new sesquiterpenes from Curcuma comosa. Chem. Pharm. Bull. 2008, 56, 1710–1716. [Google Scholar] [CrossRef] [PubMed]
- Firman, K.; Kinoshita, T.; Itai, A.; Sankawa, U. Terpenoids from Curcuma heyneana. Phytochemistry 1988, 27, 3887–3891. [Google Scholar] [CrossRef]
- Giang, P.M.; Son, P.T. Isolation of sequiterpenoids from the rhiromes of Vietnames Curcuma aromatica Salisb. Tap. Chi. Hoa. Hoc. 2000, 38, 96–99. [Google Scholar]
- Kuroyanagi, M.; Ueno, A.; Koyama, K.; Natori, S. Structures of sesquiterpenes of Curcuma aromatica Salisb. II. Studies on minor sesquiterpenes. Chem. Pharm. Bull. 1990, 38, 55–58. [Google Scholar] [CrossRef]
- Becke, A.D. A new mixing of Hartree-Fock and local-density-functional theories. J. Chem. Phys. 1993, 98, 1372–1377. [Google Scholar] [CrossRef]
- Mendes, A.P.; Borges, R.S.; Neto, A.M.C.; de Macedo, L.G.; da Silva, A.B. The basic antioxidant structure for flavonoid derivatives. J. Mol. Model. 2012, 18, 4073–4080. [Google Scholar] [CrossRef] [PubMed]
- Sarkar, A.; Middya, T.R.; Jana, A.D. A QSAR study of radical scavenging antioxidant activity of a series of flavonoids using DFT based quantum chemical descriptors—The importance of group frontier electron density. J. Mol. Model. 2012, 18, 2621–2631. [Google Scholar] [CrossRef] [PubMed]
- Anouar, E.H. A quantum chemical and statistical study of phenolic Schiff bases with antioxidant activity against DPPH free radical. Antioxidants 2014, 3, 309–322. [Google Scholar] [CrossRef]
- HyperChem: Release 7.52 for Windows; Hypercube Inc.: Gainesville, FL, USA, 2002.
- Ghose, A.K.; Pritchett, A.; Crippen, G.M. Atomic physicochemical parameters for three dimensional structure directed quantitative structure-activity relationships III: Modeling hydrophobic interactions. J. Comput. Chem. 1988, 9, 80–90. [Google Scholar] [CrossRef]
- Viswanadhan, V.N.; Ghose, A.K.; Revankar, G.R.; Robins, R.K. Atomic physicochemical parameters for three dimensional structure directed quantitative structure-activity relationships. 4. Additional parameters for hydrophobic and dispersive interactions and their application for an automated superposition of certain naturally occurring nucleoside antibiotics. J. Chem. Inf. Comput. Sci. 1989, 29, 163–172. [Google Scholar]
- Koopmans, T. Über die Zuordnung von Wellenfunktionen und Eigenwerten zu den einzelnen Elektronen eines Atoms. Physica 1934, 1, 104–113. [Google Scholar] [CrossRef]
- Parr, R.G.; Yang, W. Density-Functional Theory of Atoms and Molecules; Oxford University Press: New York, NY, USA, 1989; Volume 16. [Google Scholar]
- Neshev, N.; Mineva, T. The role of interelectronic interaction in transition metal oxide catalysts. In Metal-Ligand Interactions; Springer: Dordrecht, The Netherlands, 1996; pp. 361–405. [Google Scholar]
- Grigorov, M.; Weber, J.; Chermette, H.; Tronchet, J.M. Numerical evaluation of the internal orbitally resolved chemical hardness tensor in density functional theory. Int. J. Quantum Chem. 1997, 61, 551–562. [Google Scholar] [CrossRef]
- Mineva, T.; Sicilia, E.; Russo, N. Density-functional approach to hardness evaluation and its use in the study of the maximum hardness principle. J. Am. Chem. Soc. 1998, 120, 9053–9058. [Google Scholar] [CrossRef]
- Janak, J. Proof that∂ E∂ ni = ε in density-functional theory. Phys. Rev. B 1978, 18, 7165–7168. [Google Scholar] [CrossRef]
- De Luca, G.; Sicilia, E.; Russo, N.; Mineva, T. On the hardness evaluation in solvent for neutral and charged systems. J. Am. Chem. Soc. 2002, 124, 1494–1499. [Google Scholar]
- Frisch, M.J.; Trucks, G.W.; Schlegel, H.B.; Scuseria, G.E.; Robb, M.A.; Cheeseman, J.R.; Scalmani, G.; Barone, V.; Mennucci, B.; Petersson, G.A.; et al. Gaussian 09, Revision A.02; Gaussian,Inc.: Wallingford, CT, USA, 2009. [Google Scholar]
- Tomasi, J.; Mennucci, B.; Cammi, R. Quantum mechanical continuum solvation models. Chem. Rev. 2005, 105, 2999–3093. [Google Scholar] [CrossRef] [PubMed]
- Guerra, M.; Amorati, R.; Pedulli, G.F. Water effect on the Oâ’H Dissociation enthalpy of para-substituted phenols: A DFT Study. J. Org. Chem. 2004, 69, 5460–5467. [Google Scholar] [CrossRef] [PubMed]
- Kozlowski, D.; Trouillas, P.; Calliste, C.; Marsal, P.; Lazzaroni, R.; Duroux, J.L. Density functional theory study of the conformational, electronic, and antioxidant properties of natural chalcones. J. Phys. Chem. A 2007, 111, 1138–1145. [Google Scholar] [CrossRef] [PubMed]
- DataLab-Version 2.701. Available online: http://www.lohninger.com/datalab/en_home.html (accessed on 18 November 2013).
© 2015 by the authors; licensee MDPI, Basel, Switzerland. This article is an open access article distributed under the terms and conditions of the Creative Commons Attribution license (http://creativecommons.org/licenses/by/4.0/)
Share and Cite
Hamdi, O.A.A.; Anouar, E.H.; Shilpi, J.A.; Trabolsy, Z.B.K.A.; Zain, S.B.M.; Zakaria, N.S.S.; Zulkefeli, M.; Weber, J.-F.F.; Malek, S.N.A.; Rahman, S.N.S.A.; et al. A Quantum Chemical and Statistical Study of Cytotoxic Activity of Compounds Isolated from Curcuma zedoaria. Int. J. Mol. Sci. 2015, 16, 9450-9468. https://doi.org/10.3390/ijms16059450
Hamdi OAA, Anouar EH, Shilpi JA, Trabolsy ZBKA, Zain SBM, Zakaria NSS, Zulkefeli M, Weber J-FF, Malek SNA, Rahman SNSA, et al. A Quantum Chemical and Statistical Study of Cytotoxic Activity of Compounds Isolated from Curcuma zedoaria. International Journal of Molecular Sciences. 2015; 16(5):9450-9468. https://doi.org/10.3390/ijms16059450
Chicago/Turabian StyleHamdi, Omer Abdalla Ahmed, El Hassane Anouar, Jamil A. Shilpi, Zuhra Bashir Khalifa Al Trabolsy, Sharifuddin Bin Md Zain, Nur Shahidatul Shida Zakaria, Mohd Zulkefeli, Jean-Frédéric F. Weber, Sri Nurestri A. Malek, Syarifah Nur Syed Abdul Rahman, and et al. 2015. "A Quantum Chemical and Statistical Study of Cytotoxic Activity of Compounds Isolated from Curcuma zedoaria" International Journal of Molecular Sciences 16, no. 5: 9450-9468. https://doi.org/10.3390/ijms16059450