
Using a Novel MicroRNA Delivery System to Inhibit Osteoclastogenesis

Abstract
: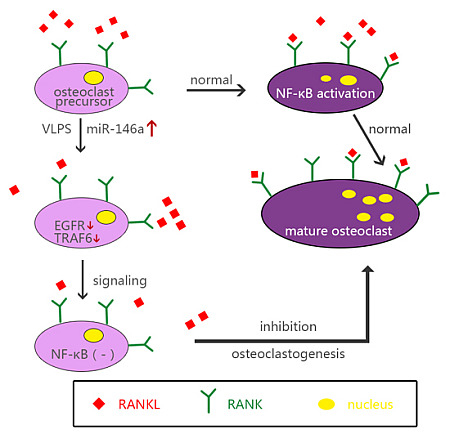
1. Introduction
2. Results
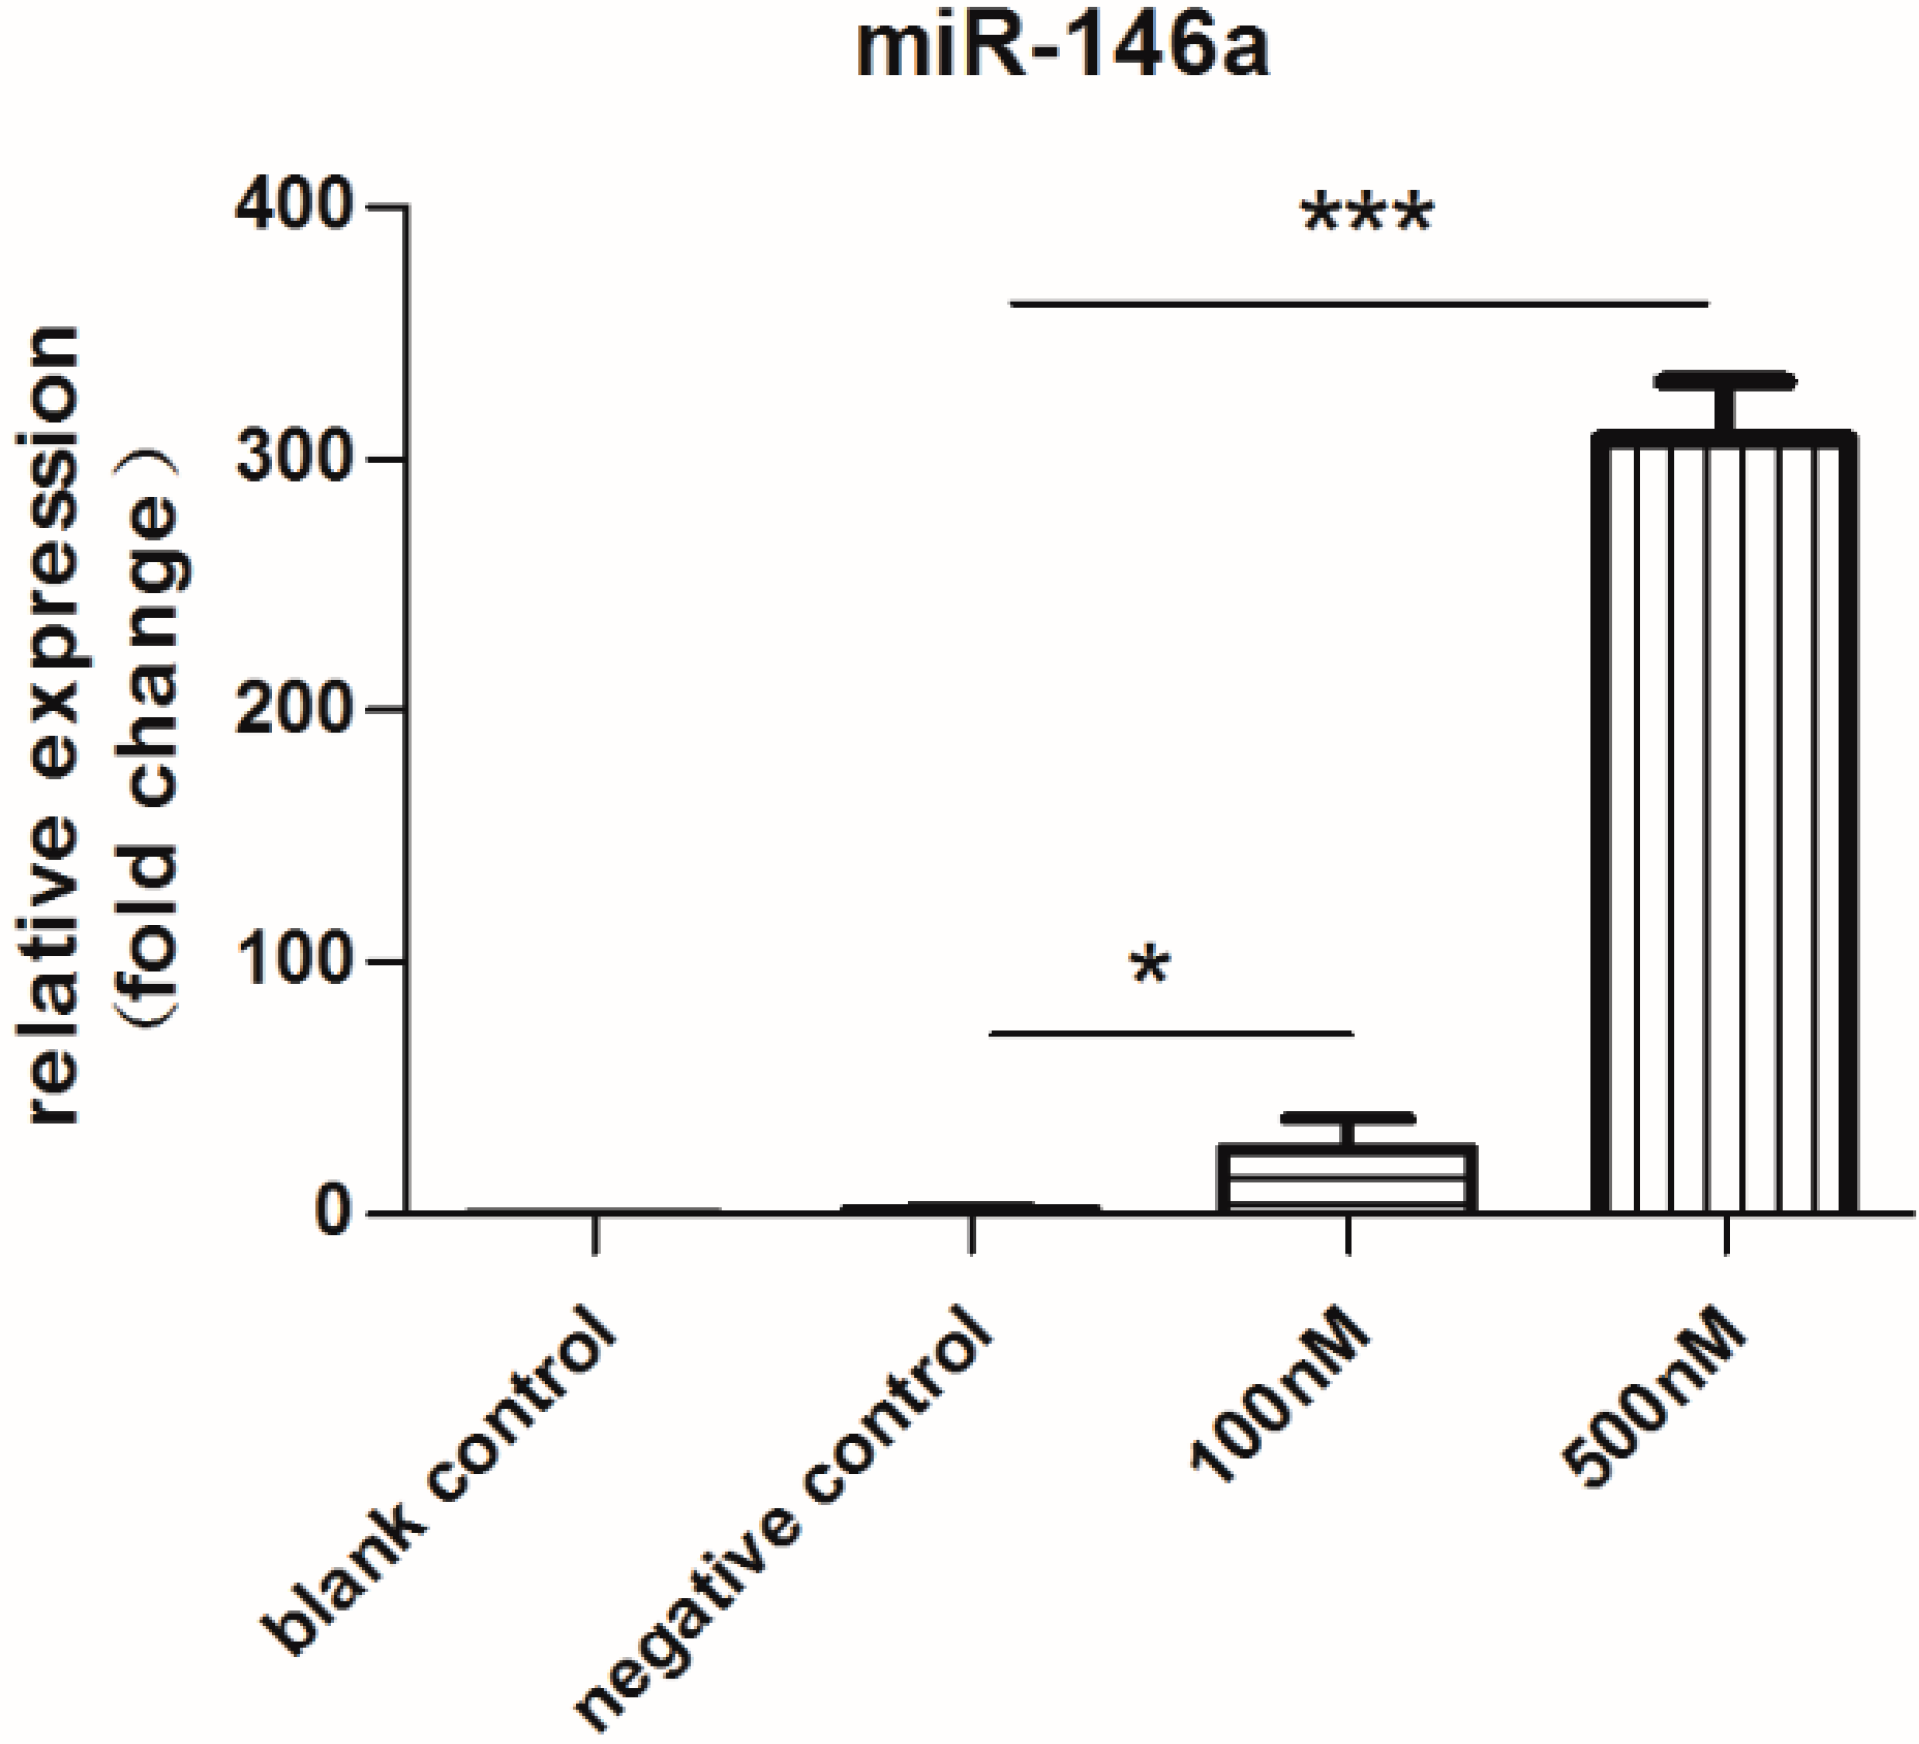
2.1. Expression of miR-146a Increased Dramatically
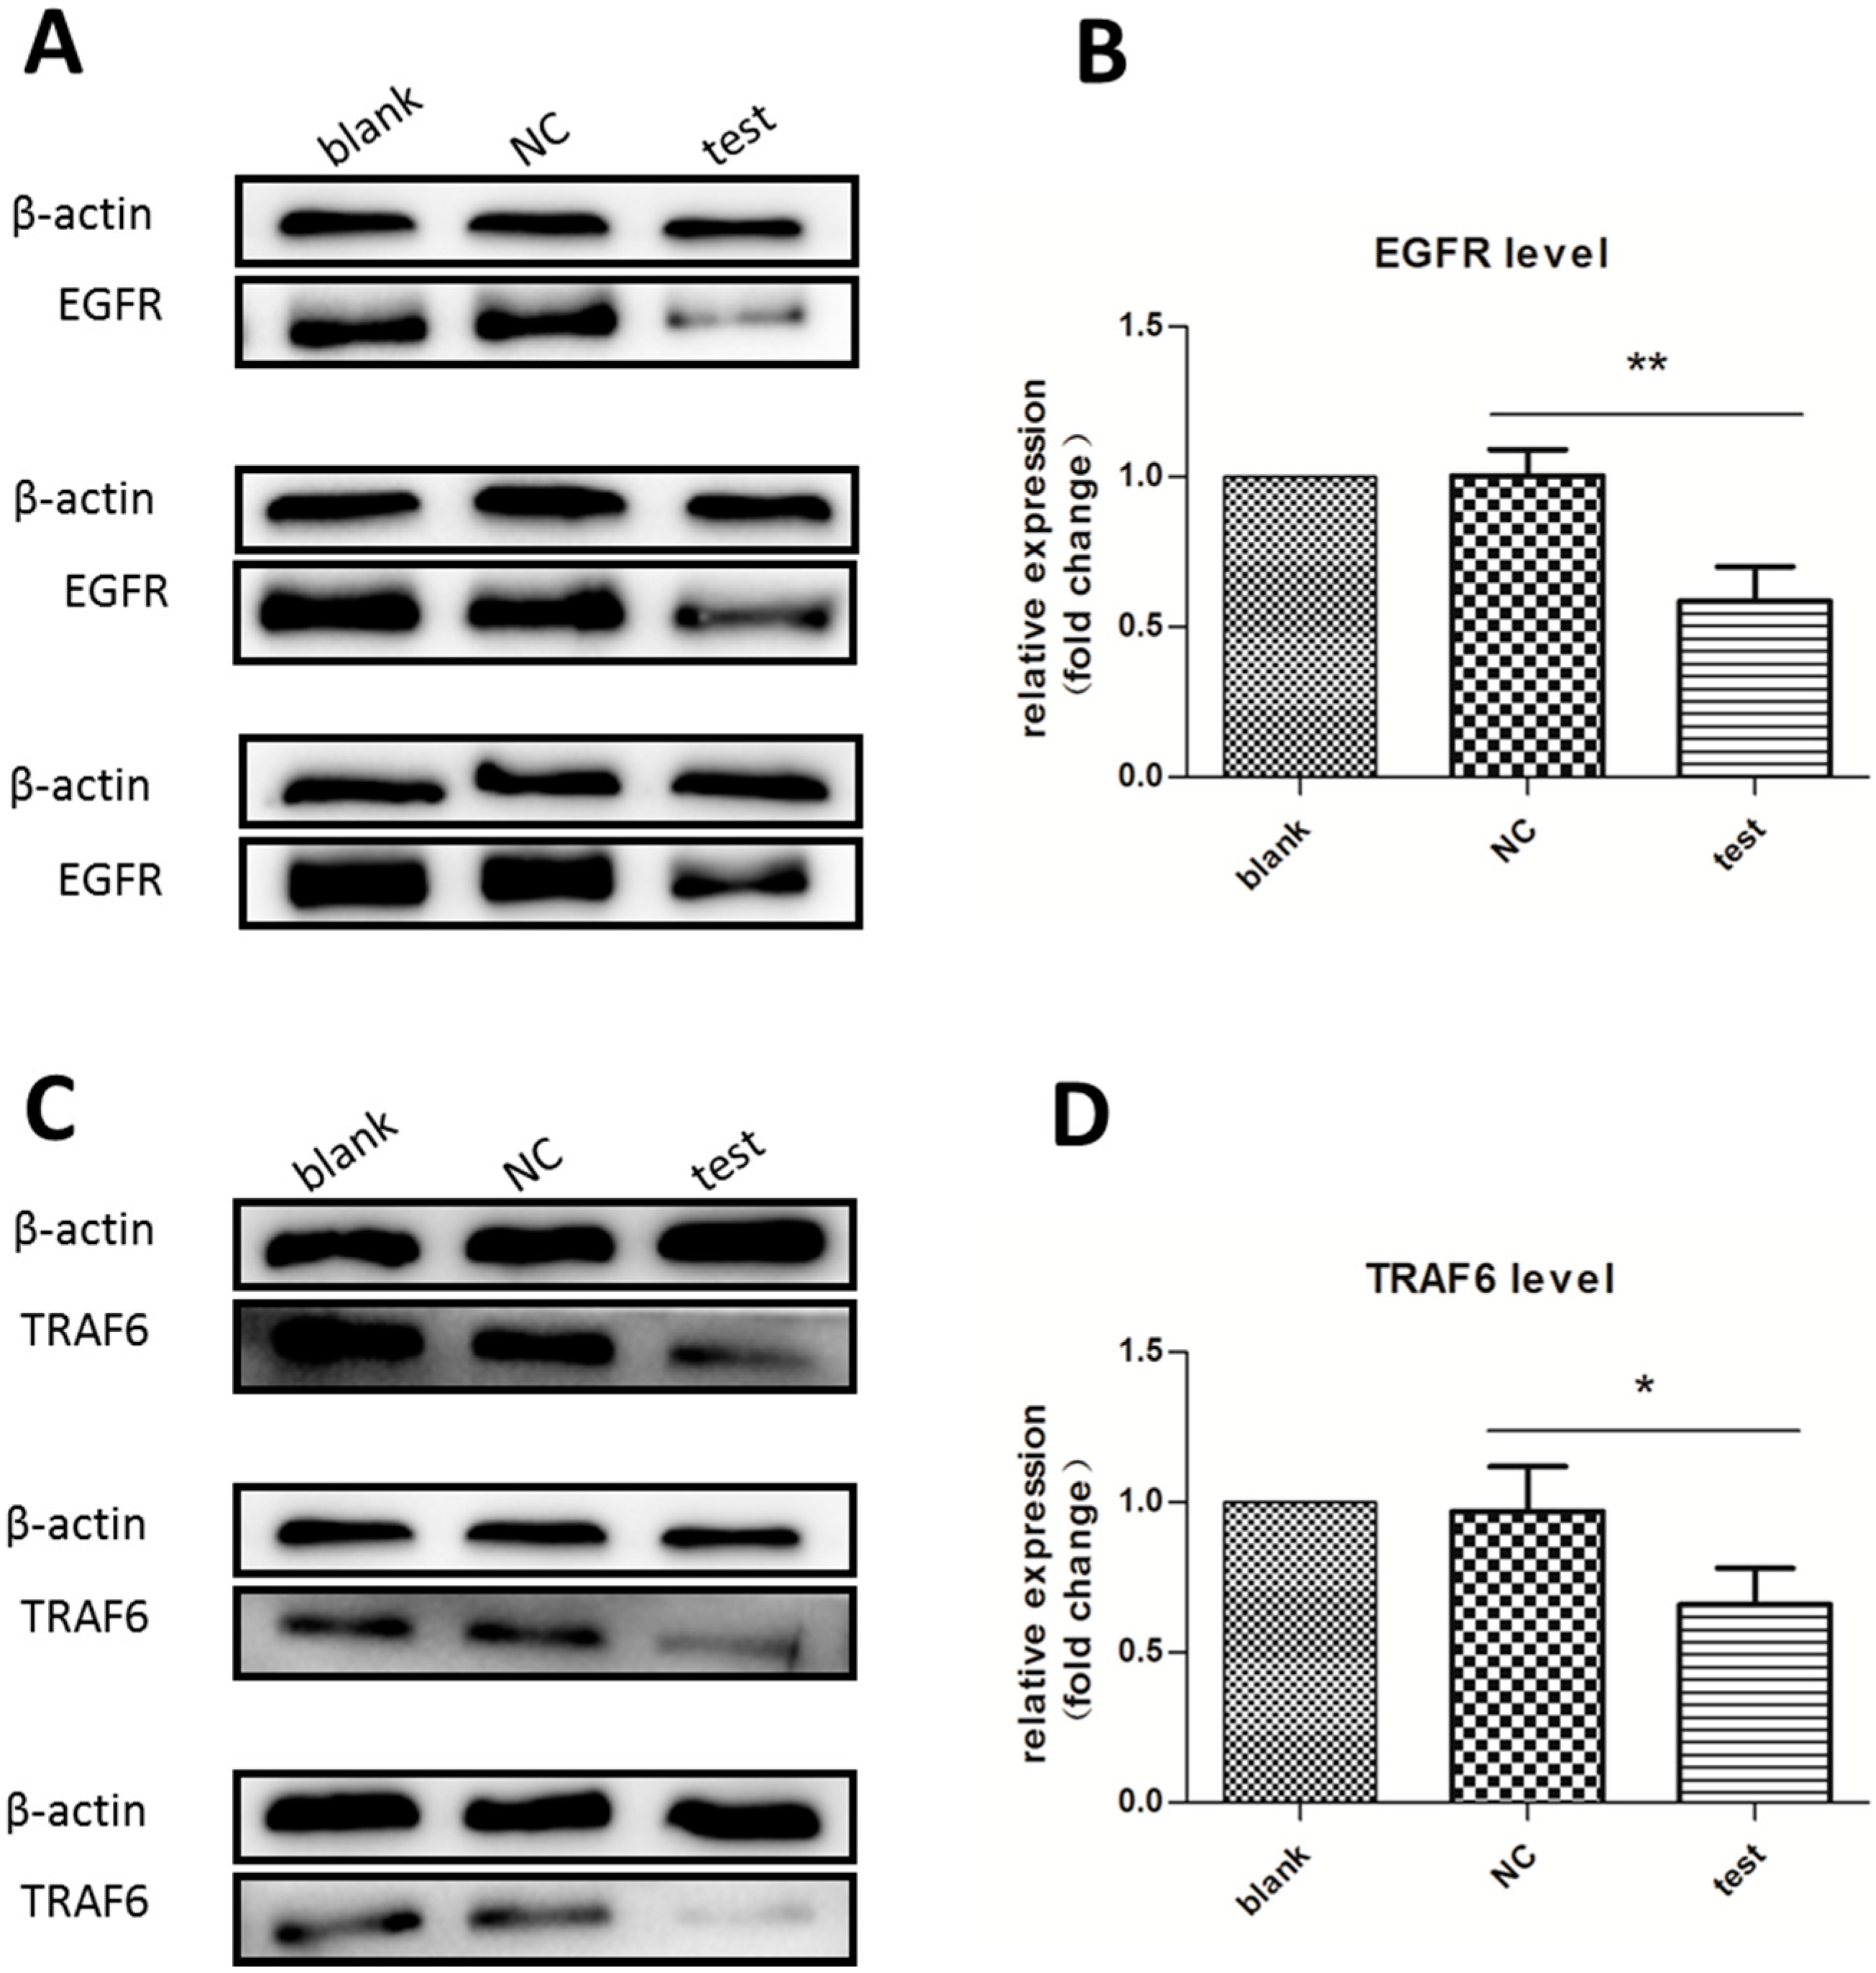
2.2. Expression of Downstream Target Proteins Decreased Dramatically
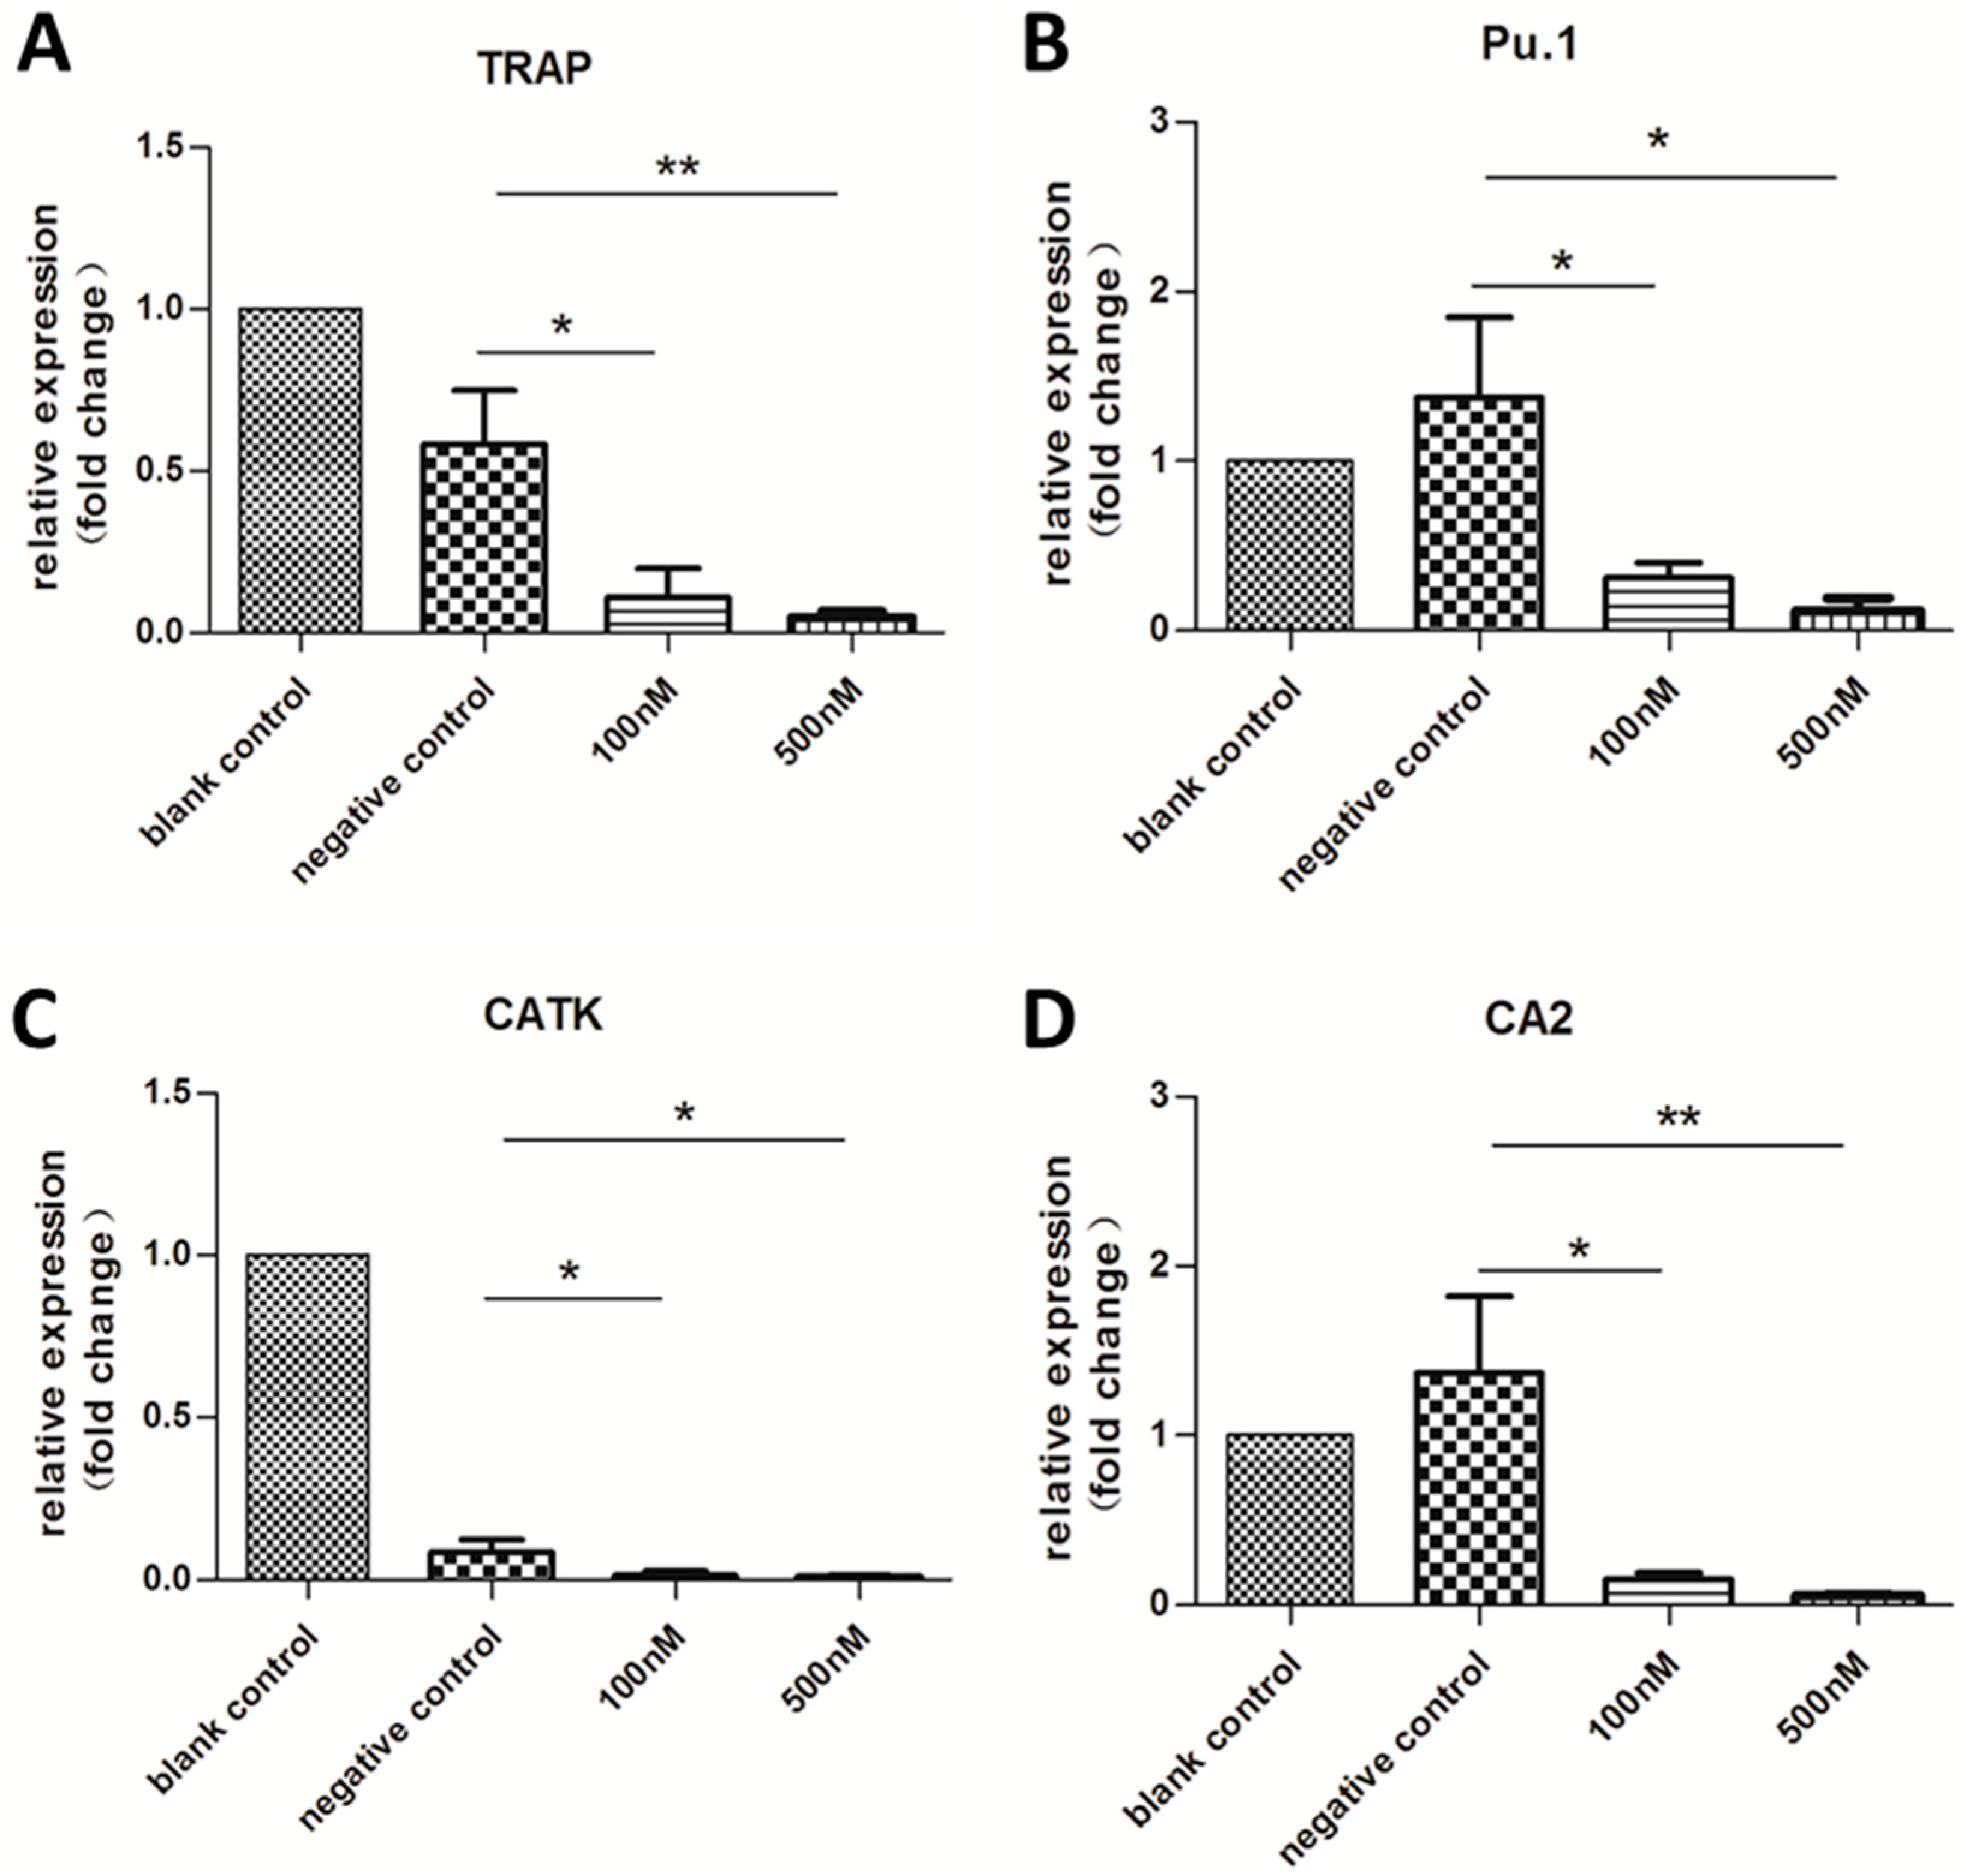
2.3. Expression of OC-Specific Genes Decreased Rapidly over Time
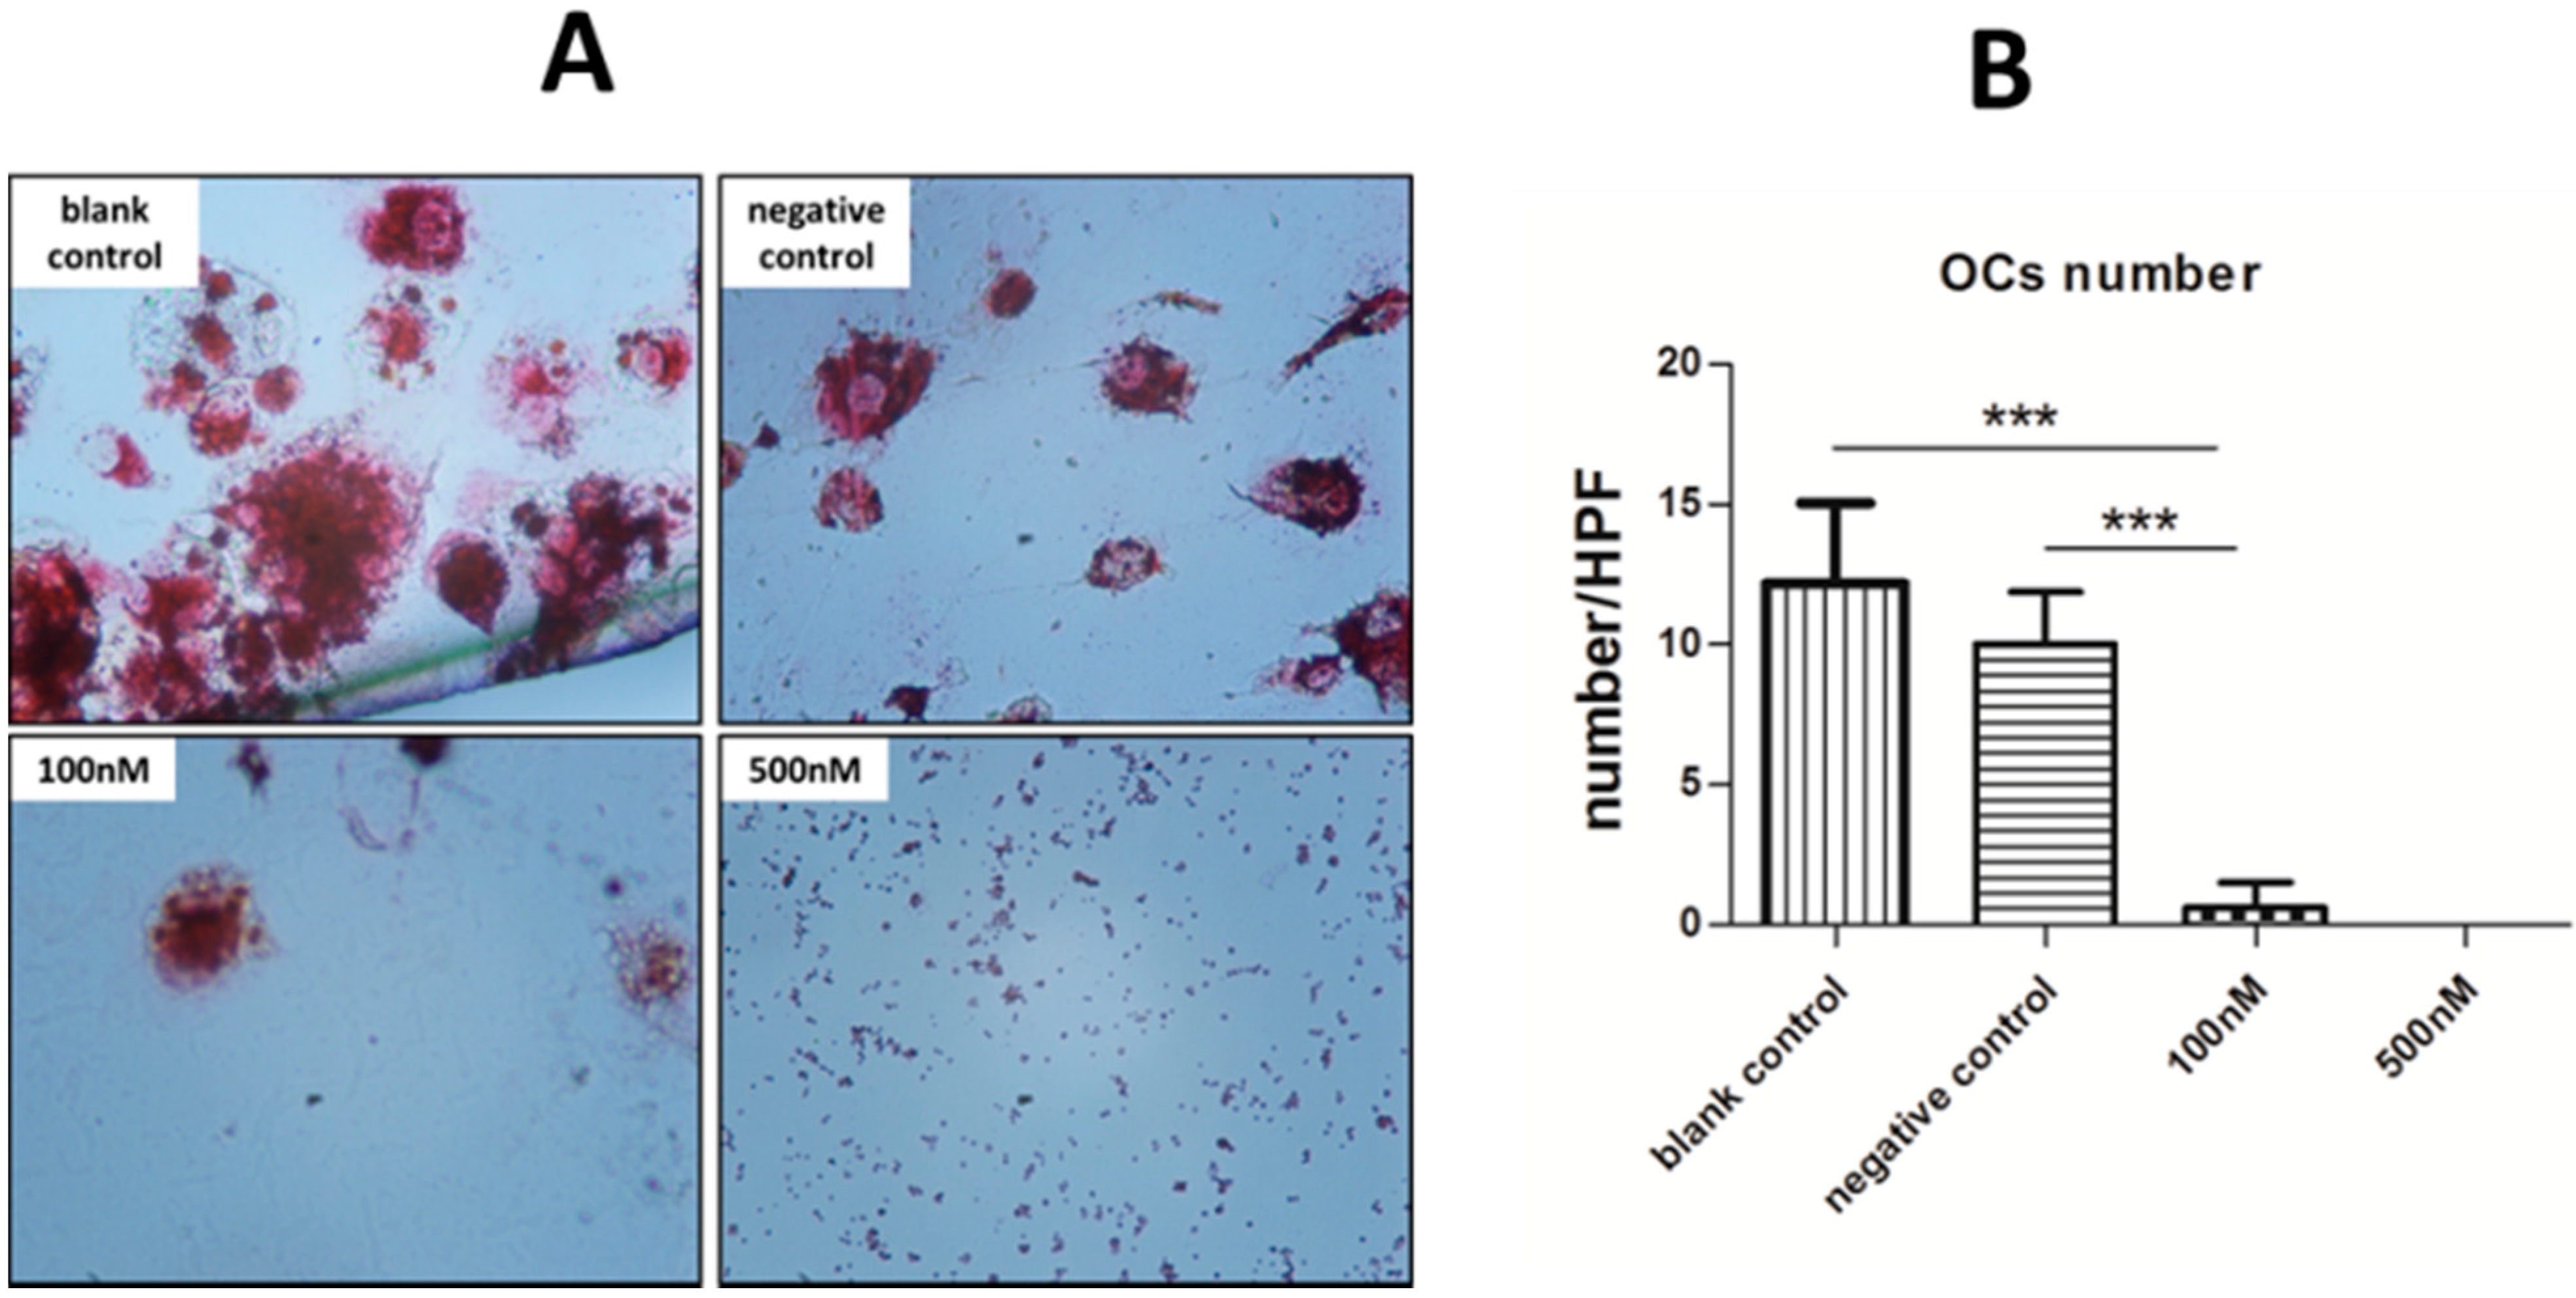
2.4. Cytochemical Staining to Characterize OCs

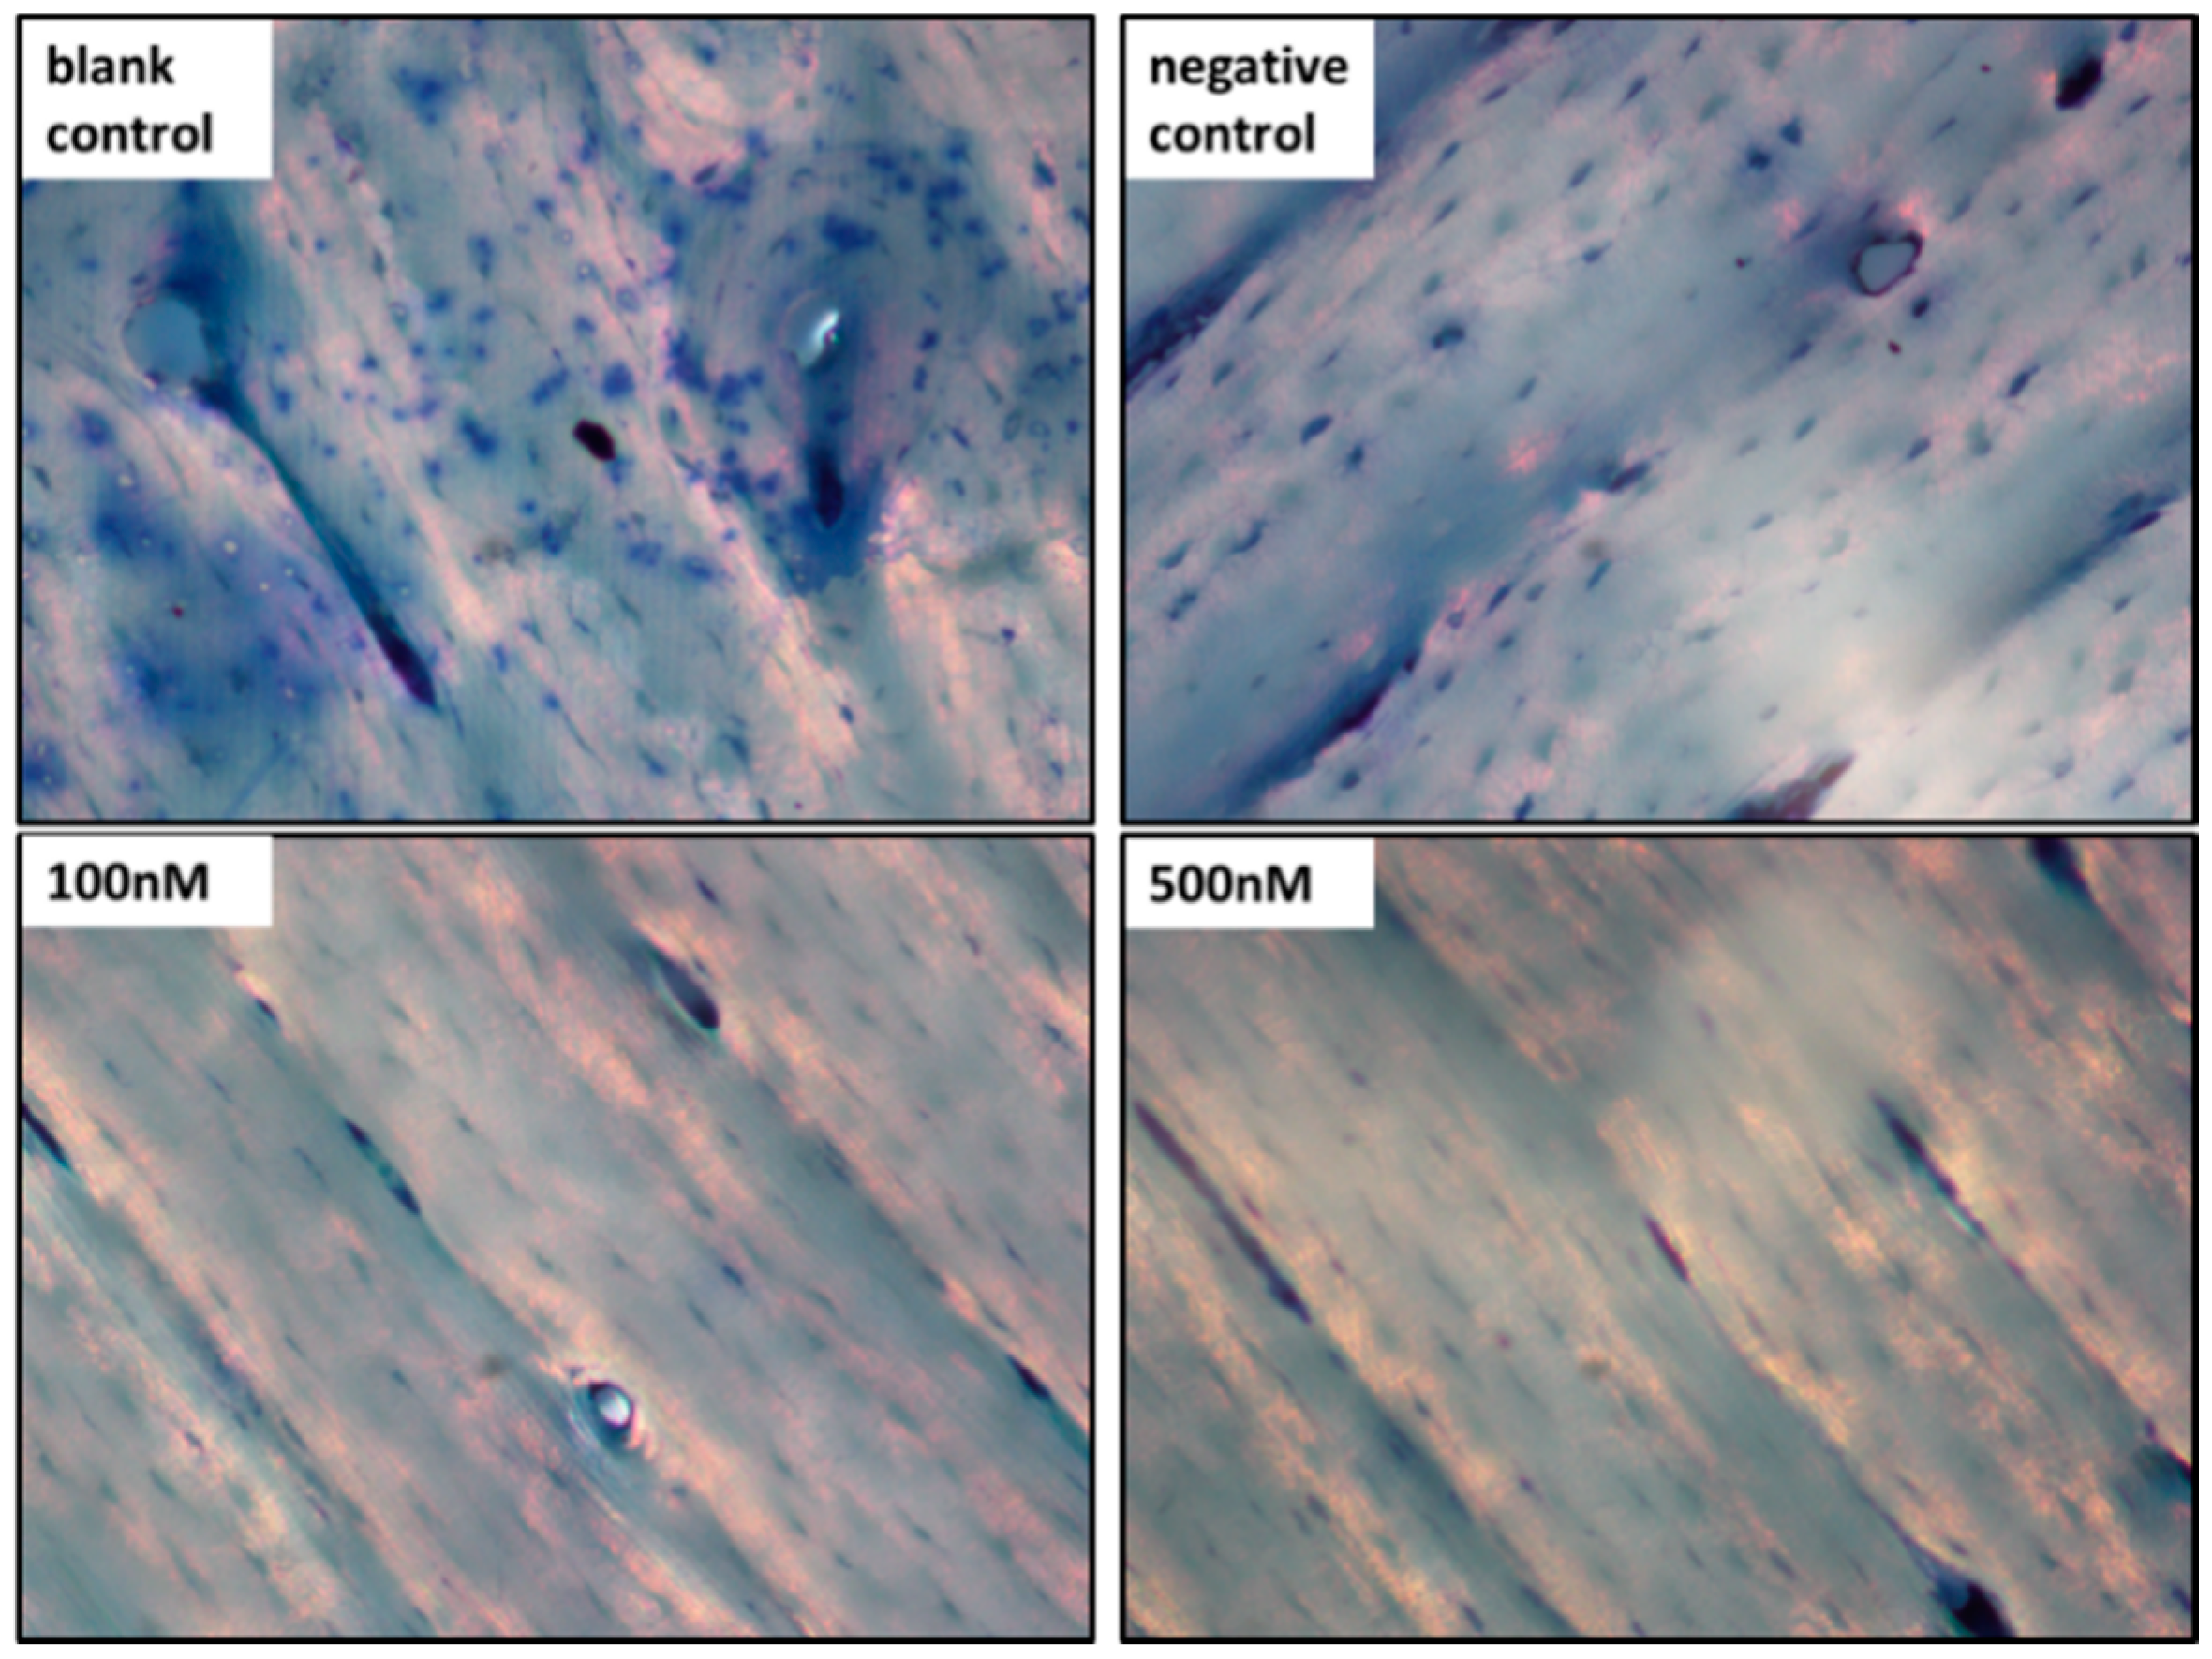
2.5. Pit Formation Assay
3. Discussion

4. Experimental Section
4.1. Preparing of Pre-miRNAs Contained MS2 VLPs
4.2. Isolation of PBMCs
4.3. PBMCs Culture and Transfection with miR-146a or miRNC
4.4. Quantitative Reverse Transcription Polymerase Chain Reaction (qRT-PCR)

| Gene | Forward Primers | Reverse Primers |
|---|---|---|
| miR-146a | 5'-CTAGCTAGCGGCCGCTAGTAACCCATGGAATTCAGTTCTCAG-3' | 5'-TCGACTGAGAACTGAATTCCATGGGTTACTAGCGGCCGCTAG-3' |
| GADPH | 5'-TGACTTCAACAGCGACACCCA-3' | 5'-CACCCTGTTGCTGTAGCCAAA-3' |
| TRAP | 5'-CAACGGCTATCTGCGCTTCCA-3' | 5'-GAGCTGATCTCCACATAGGCAA-3' |
| Pu.1 | 5'-GAAGAAGATCCGCCTGTACCAGT-3' | 5'-GCCTCCTTGTGCTTGGACGA-3' |
| CA2 | 5'-GATTCCATTAAAACAAAGGGCAAG-3' | 5'-TGAGCACAATCCAGGTCACA-3' |
| CATK | 5'-TCCCGCAGTAATGACACC-3' | 5'-CCCACAGAGCTAAAAGCCCAA-3' |
4.5. Western Blot Analysis for Downstream Target Proteins
4.6. Cytochemical Stain Assay
4.7. Pit Formation Assay
4.8. Statistical Analysis
5. Conclusions
Supplementary Materials
Acknowledgments
Author Contributions
Conflicts of Interest
References
- Albers, J.; Keller, J.; Baranowsky, A.; Beil, F.T.; Catala-Lehnen, P.; Schulze, J.; Amling, M.; Schinke, T. Canonical Wnt signaling inhibits osteoclastogenesis independent of osteoprotegerin. J. Cell Biol. 2013, 200, 537–549. [Google Scholar] [CrossRef] [PubMed]
- Nakasa, T.; Miyaki, S.; Okubo, A.; Hashimoto, M.; Nishida, K.; Ochi, M.; Asahara, H. Expression of microRNA-146 in rheumatoid arthritis synovial tissue. Arthritis Rheumatol. 2008, 58, 1284–1292. [Google Scholar] [CrossRef]
- Redlich, K.; Hayer, S.; Ricci, R.; David, J.P.; Tohidast-Akrad, M.; Kollias, G.; Steiner, G.; Smolen, J.S.; Wagner, E.F.; Schett, G. Osteoclasts are essential for TNF-α-mediated joint destruction. J. Clin. Investig. 2002, 110, 1419–1427. [Google Scholar] [CrossRef] [PubMed]
- Hayward, M.; Fiedler-Nagy, C. Mechanisms of bone loss: Rheumatoid arthritis, periodontal disease and osteoporosis. Agents Actions 1987, 22, 251–254. [Google Scholar] [CrossRef] [PubMed]
- Kurihara, N.; Chenu, C.; Miller, M.; Civin, C.; Roodman, G.D. Identification of committed mononuclear precursors for osteoclast-like cells formed in long term human marrow cultures. Endocrinology 1990, 126, 2733–2741. [Google Scholar] [CrossRef] [PubMed]
- Mizoguchi, T.; Muto, A.; Udagawa, N.; Arai, A.; Yamashita, T.; Hosoya, A.; Ninomiya, T.; Nakamura, H.; Yamamoto, Y.; Kinugawa, S.; et al. Identification of cell cycle-arrested quiescent osteoclast precursors in vivo. J. Cell Biol. 2009, 184, 541–554. [Google Scholar]
- Dimitroulas, T.; Nikas, S.N.; Trontzas, P.; Kitas, G.D. Biologic therapies and systemic bone loss in rheumatoid arthritis. Autoimmun. Rev. 2013, 12, 958–966. [Google Scholar] [CrossRef] [PubMed]
- Taganov, K.D.; Boldin, M.P.; Chang, K.J.; Baltimore, D. NF-κB-dependent induction of microRNA miR-146, an inhibitor targeted to signaling proteins of innate immune responses. Proc. Natl. Acad. Sci. USA 2006, 103, 12481–12486. [Google Scholar] [CrossRef] [PubMed]
- Ceppi, M.; Pereira, P.M.; Dunand-Sauthier, I.; Barras, E.; Reith, W.; Santos, M.A.; Pierre, P. MicroRNA-155 modulates the interleukin-1 signaling pathway in activated human monocyte-derived dendritic cells. Proc. Natl. Acad. Sci. USA 2009, 106, 2735–2740. [Google Scholar] [CrossRef] [PubMed]
- Stanczyk, J.; Pedrioli, D.M.; Brentano, F.; Sanchez-Pernaute, O.; Kolling, C.; Gay, R.E.; Detmar, M.; Gay, S.; Kyburz, D. Altered expression of microRNA in synovial fibroblasts and synovial tissue in rheumatoid arthritis. Arthritis Rheumatol. 2008, 58, 1001–1009. [Google Scholar] [CrossRef]
- Krutzfeldt, J.; Rajewsky, N.; Braich, R.; Rajeev, K.G.; Tuschl, T.; Manoharan, M.; Stoffel, M. Silencing of microRNAs in vivo with “antagomirs”. Nature 2005, 438, 685–689. [Google Scholar] [CrossRef] [PubMed]
- Ma, L.; Reinhardt, F.; Pan, E.; Soutschek, J.; Bhat, B.; Marcusson, E.G.; Teruya-Feldstein, J.; Bell, G.W.; Weinberg, R.A. Therapeutic silencing of miR-10b inhibits metastasis in a mouse mammary tumor model. Nat. Biotechnol. 2010, 28, 341–347. [Google Scholar] [CrossRef] [PubMed]
- Tazawa, H.; Tsuchiya, N.; Izumiya, M.; Nakagama, H. Tumor-suppressive miR-34a induces senescence-like growth arrest through modulation of the E2F pathway in human colon cancer cells. Proc. Natl. Acad. Sci.USA 2007, 104, 15472–15477. [Google Scholar] [CrossRef] [PubMed]
- Liu, R.; Liu, C.; Chen, D.; Yang, W.H.; Liu, X.; Liu, C.G.; Dugas, C.M.; Tang, F.; Zheng, P.; Liu, Y.; et al. Foxp3 controls an miR-146/NF-κB negative feedback loop that inhibits apoptosis in breast cancer cells. Cancer Res. 2015, 23. [Google Scholar] [CrossRef]
- Boldin, M.P.; Taganov, K.D.; Rao, D.S.; Yang, L.; Zhao, J.L.; Kalwani, M.; Garcia-Flores, Y.; Luong, M.; Devrekanli, A.; Xu, J.; et al. miR-146a is a significant brake on autoimmunity, myeloproliferation, and cancer in mice. J. Exp. Med. 2011, 208, 1189–1201. [Google Scholar]
- Perry, M.M.; Moschos, S.A.; Williams, A.E.; Shepherd, N.J.; Larner-Svensson, H.M.; Lindsay, M.A. Rapid changes in microRNA-146a expression negatively regulate the IL-1β-induced inflammatory response in human lung alveolar epithelial cells. J. Immunol. (Baltimore, MD, USA, 1950) 2008, 180, 5689–5698. [Google Scholar] [CrossRef]
- Nakasa, T.; Shibuya, H.; Nagata, Y.; Niimoto, T.; Ochi, M. The inhibitory effect of microRNA-146a expression on bone destruction in collagen-induced arthritis. Arthritis Rheumatol. 2011, 63, 1582–1590. [Google Scholar] [CrossRef]
- Yi, T.; Lee, H.L.; Cha, J.H.; Ko, S.I.; Kim, H.J.; Shin, H.I.; Woo, K.M.; Ryoo, H.M.; Kim, G.S.; Baek, J.H. Epidermal growth factor receptor regulates osteoclast differentiation and survival through cross-talking with rank signaling. J. Cell. Physiol. 2008, 217, 409–422. [Google Scholar] [CrossRef] [PubMed]
- Hurst, D.R.; Edmonds, M.D.; Scott, G.K.; Benz, C.C.; Vaidya, K.S.; Welch, D.R. Breast cancer metastasis suppressor 1 up-regulates miR-146, which suppresses breast cancer metastasis. Cancer Res. 2009, 69, 1279–1283. [Google Scholar] [CrossRef] [PubMed]
- Lu, L.F.; Boldin, M.P.; Chaudhry, A.; Lin, L.L.; Taganov, K.D.; Hanada, T.; Yoshimura, A.; Baltimore, D.; Rudensky, A.Y. Function of miR-146a in controlling Treg cell-mediated regulation of Th1 responses. Cell 2010, 142, 914–929. [Google Scholar] [CrossRef] [PubMed]
- Pan, Y.; Zhang, Y.; Jia, T.; Zhang, K.; Li, J.; Wang, L. Development of a microRNA delivery system based on bacteriophage MS2 virus-like particles. FEBS J. 2012, 279, 1198–1208. [Google Scholar] [CrossRef] [PubMed]
- Pan, Y.; Jia, T.; Zhang, Y.; Zhang, K.; Zhang, R.; Li, J.; Wang, L. MS2 VLP-based delivery of microRNA-146a inhibits autoantibody production in lupus-prone mice. Int. J. Nanomed. 2012, 7, 5957–5967. [Google Scholar] [CrossRef]
- Takahashi, N.; Udagawa, N.; Tanaka, S.; Murakami, H.; Owan, I.; Tamura, T.; Suda, T. Postmitotic osteoclast precursors are mononuclear cells which express macrophage-associated phenotypes. Dev. Biol. 1994, 163, 212–221. [Google Scholar] [CrossRef] [PubMed]
- Boyle, W.J.; Simonet, W.S.; Lacey, D.L. Osteoclast differentiation and activation. Nature 2003, 423, 337–342. [Google Scholar] [CrossRef] [PubMed]
- Armstrong, A.P.; Tometsko, M.E.; Glaccum, M.; Sutherland, C.L.; Cosman, D.; Dougall, W.C. A RANK/TRAF6-dependent signal transduction pathway is essential for osteoclast cytoskeletal organization and resorptive function. J. Biol. Chem. 2002, 277, 44347–44356. [Google Scholar] [CrossRef] [PubMed]
- Helfrich, M.H.; Thesingh, C.W.; Mieremet, R.H.; van Iperen-van Gent, A.S. Osteoclast generation from human fetal bone marrow in cocultures with murine fetal long bones. A model for in vitro study of human osteoclast formation and function. Cell Tissue Res. 1987, 249, 125–136. [Google Scholar]
- Reddy, S.V.; Roodman, G.D. Control of osteoclast differentiation. Crit. Rev. Eukaryot. Gene Expr. 1998, 8, 1–17. [Google Scholar] [CrossRef] [PubMed]
- Pang, M.; Martinez, A.F.; Fernandez, I.; Balkan, W.; Troen, B.R. AP-1 stimulates the cathepsin K promoter in RAW 264.7 cells. Gene 2007, 403, 151–158. [Google Scholar]
- Prallet, B.; Male, P.; Neff, L.; Baron, R. Identification of a functional mononuclear precursor of the osteoclast in chicken medullary bone marrow cultures. J. Bone Miner. Res. 1992, 7, 405–414. [Google Scholar] [CrossRef] [PubMed]
- Bundy, B.C.; Franciszkowicz, M.J.; Swartz, J.R. Escherichia coli-based cell-free synthesis of virus-like particles. Biotechnol. Bioeng 2008, 100, 28–37. [Google Scholar] [CrossRef] [PubMed]
- Bluml, S.; Bonelli, M.; Niederreiter, B.; Puchner, A.; Mayr, G.; Hayer, S.; Koenders, M.I.; van den Berg, W.B.; Smolen, J.; Redlich, K. Essential role of microRNA-155 in the pathogenesis of autoimmune arthritis in mice. Arthritis Rheumatol. 2011, 63, 1281–1288. [Google Scholar] [CrossRef]
- Pauley, K.M.; Satoh, M.; Chan, A.L.; Bubb, M.R.; Reeves, W.H.; Chan, E.K. Upregulated miR-146a expression in peripheral blood mononuclear cells from rheumatoid arthritis patients. Arthritis Res. Ther. 2008, 10, R101. [Google Scholar] [CrossRef] [PubMed]
- Li, J.; Wan, Y.; Guo, Q.; Zou, L.; Zhang, J.; Fang, Y.; Zhang, J.; Zhang, J.; Fu, X.; Liu, H.; et al. Altered microRNA expression profile with miR-146a upregulation in CD4+ T cells from patients with rheumatoid arthritis. Arthritis Res. Ther. 2010, 12, R81. [Google Scholar] [Green Version]
- Bazley, L.A.; Gullick, W.J. The epidermal growth factor receptor family. Endocr. Relat. Cancer 2005, 12, S17–S27. [Google Scholar] [CrossRef] [PubMed]
- Wei, B.; Wei, Y.; Zhang, K.; Wang, J.; Xu, R.; Zhan, S.; Lin, G.; Wang, W.; Liu, M.; Wang, L.; et al. Development of an antisense RNA delivery system using conjugates of the MS2 bacteriophage capsids and HIV-1 TAT cell-penetrating peptide. Biomed. Pharmacother. 2009, 63, 313–318. [Google Scholar]
- Quinn, J.M.; Elliott, J.; Gillespie, M.T.; Martin, T.J. A combination of osteoclast differentiation factor and macrophage-colony stimulating factor is sufficient for both human and mouse osteoclast formation in vitro. Endocrinology 1998, 139, 4424–4427. [Google Scholar] [CrossRef] [PubMed]
- Pettit, A.R.; Ji, H.; von Stechow, D.; Muller, R.; Goldring, S.R.; Choi, Y.; Benoist, C.; Gravallese, E.M. TRANCE/RANKL knockout mice are protected from bone erosion in a serum transfer model of arthritis. Am. J. Pathol. 2001, 159, 1689–1699. [Google Scholar] [CrossRef] [PubMed]
- Schmittgen, T.D.; Lee, E.J.; Jiang, J.; Sarkar, A.; Yang, L.; Elton, T.S.; Chen, C. Real-time PCR quantification of precursor and mature microRNA. Methods (San Diego, CA, USA) 2008, 44, 31–38. [Google Scholar] [CrossRef]
- Chen, C.; Ridzon, D.A.; Broomer, A.J.; Zhou, Z.; Lee, D.H.; Nguyen, J.T.; Barbisin, M.; Xu, N.L.; Mahuvakar, V.R.; Andersen, M.R.; et al. Real-time quantification of microRNAs by stem-loop RT-PCR. Nucleic Acids Res. 2005, 33. [Google Scholar] [CrossRef]
- Schmittgen, T.D.; Livak, K.J. Analyzing real-time PCR data by the comparative Ct method. Nat. Protoc. 2008, 3, 1101–1108. [Google Scholar] [CrossRef] [PubMed]
© 2015 by the authors; licensee MDPI, Basel, Switzerland. This article is an open access article distributed under the terms and conditions of the Creative Commons Attribution license (http://creativecommons.org/licenses/by/4.0/).
Share and Cite
Yao, Y.; Jia, T.; Pan, Y.; Gou, H.; Li, Y.; Sun, Y.; Zhang, R.; Zhang, K.; Lin, G.; Xie, J.; et al. Using a Novel MicroRNA Delivery System to Inhibit Osteoclastogenesis. Int. J. Mol. Sci. 2015, 16, 8337-8350. https://doi.org/10.3390/ijms16048337
Yao Y, Jia T, Pan Y, Gou H, Li Y, Sun Y, Zhang R, Zhang K, Lin G, Xie J, et al. Using a Novel MicroRNA Delivery System to Inhibit Osteoclastogenesis. International Journal of Molecular Sciences. 2015; 16(4):8337-8350. https://doi.org/10.3390/ijms16048337
Chicago/Turabian StyleYao, Yanlan, Tingting Jia, Yang Pan, Hongna Gou, Yulong Li, Yu Sun, Rui Zhang, Kuo Zhang, Guigao Lin, Jiehong Xie, and et al. 2015. "Using a Novel MicroRNA Delivery System to Inhibit Osteoclastogenesis" International Journal of Molecular Sciences 16, no. 4: 8337-8350. https://doi.org/10.3390/ijms16048337