2.1. Fruit Quality Evaluation
All fruits used in the present study were harvested at the ready-to-eat stage. As shown in
Table 1, fruit quality indices, such as fresh weight (FW), fruit shape index (FSI), and soluble solids content (SSC), varied significantly among the 17 cultivars tested. The melting peach cultivar SZZS showed the highest FW value (233.94 g), while the nectarine cultivar HY002 showed the lowest value (83.61 g). The FSI values varied from 0.89 (QSBT) to 1.14 (HY002). SSC is an important fruit quality trait, which is closely related to consumer acceptance and satisfaction. In this study, the SSC of the 17 peach cultivars ranged from 8.34 (ANSM) to 15.48 °Brix (YL). Low SSC values were observed for several early maturing cultivars such as ANSM, HY004, and ZX, and similar observation was also found in early maturing cultivars such as UFO-2, UFO-3, and UFO-4 grown in Spain [
20]. Different peach cultivars grown in California [
11] and Italy [
21] also showed significant variations in fruit quality indices, such as SSC and titratable acid.
Table 1.
Cultivars used in the study and their respective quality indices.
Table 1.
Cultivars used in the study and their respective quality indices.
| Number | Cultivars | Abbreviation | Fruit Type | Flesh Colour | FW (g) | FSI | SSC (°Brix) |
|---|
| 1 | Annongshuimi | ANSM | Melting | White | 179.55 ± 18.55 c | 0.97 ± 0.05 d | 8.34 ± 1.06 f |
| 2 | Chunfeng | CF | Melting | White | 122.59 ± 12.30 g | 1.12 ± 0.06 a | 8.75 ± 0.85 e,f |
| 3 | Chiyue | CY | Melting | White | 181.47 ± 8.56 c | 0.97 ± 0.03 d | 11.27 ± 1.34 c,d |
| 4 | Danxia | DX | Melting | White | 181.85 ± 10.92 c | 0.96 ± 0.04 d | 10.92 ± 0.72 c,d |
| 5 | Dayubaifeng | DYBF | Melting | White | 166.63 ± 11.79 d,e | 0.96 ± 0.03 d | 11.75 ± 0.53 c |
| 6 | Hujingmilu | HJML | Melting | White | 200.47 ± 11.95 b | 0.95 ± 0.05 d | 13.92 ± 1.98 b |
| 7 | Jinhuadabaitao | JHDBT | Melting | White | 201.32 ± 26.57 b | 1.02 ± 0.04 c | 8.81 ± 0.92 e,f |
| 8 | Qingshuibaitao | QSBT | Melting | White | 201.55 ± 10.58 b | 0.89 ± 0.02 e | 15.30 ± 2.05 a |
| 9 | Shazizaosheng | SZZS | Melting | White | 233.94 ± 24.01 a | 0.98 ± 0.04 d | 10.61 ± 1.03 d |
| 10 | Wujingzaobaifeng | WJZBF | Melting | Red | 136.66 ± 7.70 f | 0.95 ± 0.03 d | 9.30 ± 1.23 e,f |
| 11 | Xinyu | XY | Melting | White | 209.98 ± 13.64 b | 1.02 ± 0.03 c | 14.10 ± 0.73 b |
| 12 | Yulu | YL | Melting | White | 198.84 ± 17.24 b | 0.95 ± 0.04 d | 15.48 ± 1.03 a |
| 13 | Zhaoxia | ZX | Melting | White | 172.05 ± 18.55 c,d | 0.90 ± 0.05 e | 8.45 ± 1.94 f |
| 14 | Huyou002 | HY002 | Nectarine | White | 83.61 ± 6.22 i | 1.14 ± 0.04 a | 9.45 ± 0.69 e,f |
| 15 | Huyou003 | HY003 | Nectarine | Yellow | 100.57 ± 11.39 h | 0.97 ± 0.03 d | 9.57 ± 0.78 e |
| 16 | Huyou004 | HY004 | Nectarine | Yellow | 135.85 ± 8.07 f | 1.02 ± 0.04 c | 8.42 ± 1.06 f |
| 17 | Huyou018 | HY018 | Nectarine | Yellow | 157.83 ± 13.62 e | 1.06 ± 0.05 b | 9.21 ± 1.12 e,f |
2.2. Identification of Individual Phenolic Compound
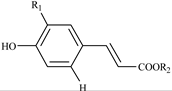
Identification of individual phenolic compounds in peach fruit was carried out by HPLC-DAD and LC-ESI-MS/MS. For the identification of hydroxycinnamates, the fragment ion information from LC-MS/MS was compared with a previous study [
22]. As a result, two hydroxycinnamates were identified in peach fruit (
Table 2). They both showed the same [M − H]
− ion at
m/
z 353.1, the [quinic − H]
− ion at
m/
z 191.1, and the [caffic − H]
− ion at
m/
z 179.0, indicating that these two compounds were isomers with the same molecular weight of 354. Further linkage position of caffic residues on the quinic acid were analyzed according to the rules reported by Clifford
et al. [
22], and together with the confirmation of chemical standards, they were identified as neochlorogenic acid (NCHA) and chlorogenic acid (CHA), respectively.
Table 2.
Identification of phenolic compounds in peach fruits in negative ions with HPLC-DAD and LC-ESI-MS/MS.
Table 2.
Identification of phenolic compounds in peach fruits in negative ions with HPLC-DAD and LC-ESI-MS/MS.
| Phenolic Groups | λmax (nm) | Molecular Weight | MS2 (m/z) | Tentative Identification | R Groups |
|---|
| Hydroxycinnamates | 324.6, 240.4 | 354 | 353.1, 191.1, 179.0 | NCHA | R1 = OH; R2 = 5-quinic acid |
| 327.0, 241.6 | 354 | 353.1, 191.1, 179.0 | CHA | R1 = OH; R2 = 3-quinic acid |
| Flavan-3-ols | 279.4 | 578 | 577.1, 425.1, 407.1, 289.1 | B1 | R1 = H; R2 = OH; R3 = epicatechin |
| 279.4 | 290 | 289.0 | CAT | R1 = H; R2 = OH; R3 = H |
| Anthocyanins | 514.9, 279.4 | 449 | 447.0, 284.9 | C3G | R1 = glucoside |
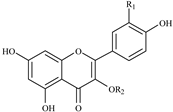
| Flavonols | 355.7, 254.6 | 464 | 463.1, 301.0, 300.0 | Q3GAL | R1 = OH; R2 = galactoside |
| 356.9, 255.7 | 464 | 463.1, 301.0, 300.0 | Q3GLU | R1 = OH; R2 = glucoside |
| 355.7, 255.7 | 610 | 609.2, 301.0, 300.0 | Q3R | R1 = OH; R2 = rutinoside |
| 347.3, 265.2 | 594 | 593.1, 285.0 | K3R | R1 = H; R2 = rutinoside |
For the identification of flavan-3-ols, the fragment ion information from LC-MS/MS was compared with the study of Sanz
et al. [
23]. As a consequence, two flavan-3-ols were identified in peach fruit (
Table 2). The [M − H]
− ion at
m/
z 289.0 indicated a structure of monomeric flavanol. The other one showed [M − H]
− ion at
m/
z 577.1, suggesting the molecular weight of a procyanidin dimer with a B-type interflavanoid linkage. As expected for procyanidins, retro Diels-Alder (RDA) fission of the heterocyclic rings of dimeric procyanidins occurred and resulted in the fragment
m/
z 425.1. The product of the subsequent water elimination (
m/
z 407.1) was also detected in significant amounts. The cleavage of the interflavonoid linkage leading to
m/
z 289.1 [M − H − 288]
− was also observed. Further analyses were conducted according to the rules reported by Sanz
et al. [
23], and together with the confirmation of chemical standards and their typical UV profiles, they were identified as catechin (CAT) and procyanidin B1 (B1), respectively.
For the identification of anthocyanins, the fragment ion information from LC-MS/MS was compared with the study of Tomás-Barberán
et al. [
18]. As a result, one anthocyanin was identified in peach fruit (
Table 2). It showed [M − H]
− ion at
m/
z 447.0, which indicated a molecular weight of 449, and the cleavage of the interflavonoid linkage leading to
m/
z 284.9 [M − H − 162]
− was also observed. This compound was identified as cyanidin-3-
O-glucoside (C3G) and was confirmed with its chemical standard.
For the identification of flavonols, the fragment ion information from LC-MS/MS was compared with a previous study [
24]. Consequently, four flavonols were identified (
Table 2). Among them, three quercetin glucosides showed [M − H]
− ions at
m/
z 463.1 or 609.2, which indicated a molecular weight of 464 or 610, and they all showed a [quercetin − H]
− ion at
m/
z 301.0 and a [quercetin − 2H]
− ion at
m/
z 300.0. One kaempferol glucoside showed [M − H]
− ion at
m/
z 593.1 indicating the molecular weight of 594, and it showed a [kaempferol − H]
− ion at
m/
z 285.0. Further glucosides type and linkage position of glycosides on the quercetin or kaempferol were analyzed according to the rule reported by Hvattum and Ekeberg [
24], and together with the confirmation of chemical standards, four flavonols were identified as quercetin-3-
O-galactoside (Q3GAL), quercetin-3-
O-glucoside (Q3GLU), quercetin-3-
O-rutinoside (Q3R), and kaempferol-3-
O-rutinoside (K3R), respectively.
2.3. Quantification of Phenolic Compounds
Due to the significant correlations observed between the phenolic contents and various bioactivities, numerous studies have been conducted to select new genotypes rich in phenolic compounds and enhanced nutritional properties [
9,
13,
14].
In the present study, nine phenolic compounds, including two hydroxycinnamates (NCHA and CHA), two flavan-3-ols (B1 and CAT), one anthocyanin (C3G) and four flavonols (Q3GAL, Q3GLU, Q3R, K3R), were quantified in the peel and pulp of the 17 peach cultivars (
Table 3 and
Table 4). In general, the peel extracts contained higher amounts of phenolics than the pulp counterparts, and anthocyanin and flavonols primarily accumulated in the peel. CHA and CAT were present at much higher concentrations than other phenolic compounds in both parts of the fruit (
Table 3 and
Table 4).
NCHA and CHA were the primary hydroxycinnamates detected in Chinese peach fruit, and CHA was predominantly observed. The CHA contents varied from 52.20 (ANSM) to 1631.25 mg/kg DW (HY002) in the peel and from 27.50 (ZX) to 568.07 mg/kg DW (CY) in the pulp. The NCHA contents varied from 5.77 (ANSM) to 342.75 (XY) mg/kg DW in the peel and from 15.74 (ZX) to 267.78 (XY) mg/kg DW in the pulp. In the peel, HY002, HY018, DX, QSBT, CY, DYBF, HY004 and XY were rich in CHA (>1000 mg/kg DW). In the pulp, the amount of CHA in CY was nearly 20 times higher than that in ZX. The presence of CHA as the primary phenolic compound has also been observed in previous studies [
15,
18].
B1 and CAT were the major flavan-3-ol compounds detected in the Chinese peach cultivars and CAT was the dominant one. The B1 content varied from undetectable to 539.22 mg/kg DW (XY) in the peel and 403.75 mg/kg DW (XY) in the pulp. The CAT contents ranged from 60.14 (ANSM) to 1030.06 mg/kg DW (HY018) in the peel and from undetectable to 374.43 mg/kg DW (CY) in the pulp, indicating a large variation among different cultivars.
Table 3.
Contents of nine phenolic compounds (mg/kg DW) in the peel of 17 P. persica cultivars.
Table 3.
Contents of nine phenolic compounds (mg/kg DW) in the peel of 17 P. persica cultivars.
| Cultivars | Hydroxycinnamates | Flavan-3-ols | Anthocyanin | Flavonols |
|---|
| NCHA | CHA | B1 | CAT | C3G | Q3GAL | Q3GLU | Q3R | K3R |
|---|
| ANSM | 5.77 ± 0.51 j | 52.20 ± 0.76 k | nd | 60.14 ± 8.39 j | 9.33 ± 0.73 g | 15.52 ± 1.19 j | 16.37 ± 1.53 h–j | 120.16 ± 6.09 e,f | 51.17 ± 4.08 c |
| CF | 138.72 ± 5.89 g | 609.27 ± 25.74 h | 54.76 ± 2.10 h | 474.88 ± 29.90 f,g | 134.66 ± 11.72 e | 62.08 ± 2.56 d,e | 58.64 ± 3.04 e,f | 193.25 ± 5.94 a | 110.86 ± 4.43 a |
| CY | 193.02 ± 3.31 d | 1090.86 ± 19.57 d,e | 496.26 ± 16.13 a,b | 768.15 ± 45.85 c,d | 25.39 ± 1.91 g | 24.09 ± 4.71 h–j | 15.04 ± 0.43 i,j | 78.32 ± 0.79 j | 29.45 ± 0.60 g,h |
| DX | 219.13 ± 4.57 c | 1166.15 ± 15.73 c | 295.16 ± 33.03 e | 514.75 ± 38.27 e,f | 69.27 ± 7.76 f | 17.86 ± 0.26 i,j | 55.44 ± 11.94 e,f | 69.82 ± 1.74 k | 39.51 ± 0.36 e |
| DYBF | 195.74 ± 5.90 d | 1051.63 ± 23.82 d,e | 324.11 ± 9.70 d,e | 576.17 ± 15.80 e | 19.15 ± 2.32 g | 42.02 ± 1.12 f,g | 27.15 ± 0.41 h,i | 85.67 ± 0.26 i | 29.79 ± 0.49 g,h |
| HJML | 130.05 ± 1.57 g | 720.93 ± 10.47 g | 206.17 ± 36.62 f | 428.95 ± 18.97 g | 24.75 ± 1.63 g | 22.98 ± 0.47 h–j | 20.19 ± 1.28 h–j | 74.24 ± 1.17 j,k | 32.50 ± 0.53 f–h |
| JHDBT | 32.04 ± 1.61 i | 162.72 ± 8.64 j | nd | 149.69 ± 25.47 i | 11.65 ± 0.49 g | 23.98 ± 1.13 h–j | 23.08 ± 1.00 h–j | 115.82 ± 2.84 f,g | 33.02 ± 1.27 f,g |
| QSBT | 171.16 ± 6.74 e | 1110.77 ± 46.02 c,d | 452.63 ± 39.33 b | 806.87 ± 36.87 c | nd | 33.53 ± 1.04 g–i | 31.67 ± 1.14 g–i | 126.09 ± 7.63 d,e | 34.83 ± 0.86 f |
| SZZS | 87.61 ± 2.98 h | 329.71 ± 6.93 i | nd | 253.46 ± 18.26 h | 21.00 ± 0.58 g | 52.66 ± 2.36 e,f | 52.29 ± 2.34 e–g | 139.54 ± 3.51 c | 39.62 ± 1.60 e |
| WJZBF | 136.15 ± 4.68 g | 674.38 ± 25.83 g,h | 120.65 ± 16.94 g | 483.52 ± 56.84 f,g | 220.30 ± 11.40 d | 69.38 ± 2.77 d | 67.84 ± 2.86 e | 172.73 ± 6.07 b | 44.87 ± 1.63 d |
| XY | 342.75 ± 16.06 a | 1020.50 ± 51.80 e,f | 539.22 ± 45.95 a | 707.32 ± 82.98 d | 18.57 ± 1.59 g | 20.26 ± 3.89 i,j | 14.00 ± 2.63 i,j | 75.72 ± 4.30 j,k | 34.54 ± 4.43 f |
| YL | 166.62 ± 8.99 e,f | 955.83 ± 49.43 f | 368.75 ± 47.92 c,d | 573.79 ± 25.82 e | nd | 8.45 ± 0.57 j | 2.45 ± 0.21 j | 59.15 ± 0.65 l | 28.81 ± 0.73 h |
| ZX | 10.56 ± 0.43 j | 126.72 ± 6.50 j | nd | 196.62 ± 18.36 h,i | 28.55 ± 5.12 g | 36.61 ± 1.58 g,h | 39.29 ± 0.86 f–h | 90.80 ± 1.37 i | 55.64 ± 1.18 b |
| HY002 | 257.16 ± 9.73 b | 1631.25 ± 71.17 a | 153.71 ± 35.96 g | 748.86 ± 40.54 c,d | 304.78 ± 37.12 c | 396.49 ± 19.96 a | 581.21 ± 18.09 a | 131.76 ± 2.97 d | 29.85 ± 0.84 g,h |
| HY003 | 95.54 ± 1.43 h | 741.79 ± 18.35 g | 203.44 ± 8.24 f | 911.35 ± 21.10 b | 125.52 ± 17.51 e | 267.38 ± 5.19 c | 388.36 ± 8.11 d | 111.01 ± 2.18 g,h | 18.39 ± 0.29 i |
| HY004 | 135.63 ± 7.66 g | 1037.81 ± 62.36 d,e | 108.79 ± 14.09 g | 741.83 ± 54.10 c,d | 398.93 ± 47.39 b | 324.67 ± 17.09 b | 530.32 ± 26.04 c | 109.07 ± 3.17 h | 18.64 ± 0.95 i |
| HY018 | 157.48 ± 12.15 f | 1264.42 ± 99.20 b | 384.59 ± 20.18 c | 1030.06 ± 39.18 a | 670.59 ± 59.63 a | 335.07 ± 22.05 b | 555.83 ± 37.15 b | 106.32 ± 3.54 h | 16.91 ± 1.00 i |
Table 4.
Contents of the nine phenolic compounds (mg/kg DW) detected in the pulp tissues of 17 P. persica cultivars.
Table 4.
Contents of the nine phenolic compounds (mg/kg DW) detected in the pulp tissues of 17 P. persica cultivars.
| Cultivars | Hydroxycinnamates | Flavan-3-ols | Anthocyanin | Flavonols |
|---|
| NCHA | CHA | B1 | CAT | C3G | Q3GAL | Q3GLU | Q3R | K3R |
|---|
| ANSM | 25.77 ± 1.70 j | 41.28 ± 2.50 k | nd | nd | 35.44 ± 4.12 b | nd | nd | nd | nd |
| CF | 262.49 ± 13.09 a,b | 238.78 ± 11.17 e,f | 10.28 ± 3.97 g | 156.19 ± 11.85 e,f | nd | nd | nd | nd | nd |
| CY | 179.01 ± 6.54 d | 568.07 ± 20.91 a | 331.64 ± 19.49 b | 374.30 ± 11.38 a | nd | nd | nd | nd | nd |
| DX | 174.60 ± 7.09 d | 349.04 ± 14.23 c | 89.00 ± 8.89 e | 123.97 ± 5.18 g | 12.86 ± 1.33 c | nd | nd | nd | nd |
| DYBF | 157.44 ± 3.94 e | 354.06 ± 9.07 c | 142.58 ± 8.82 d | 206.65 ± 6.85 c,d | nd | nd | nd | nd | nd |
| HJML | 117.20 ± 7.73 f | 262.55 ± 15.95 e | 62.83 ± 5.18 f | 87.71 ± 8.42 h | 3.83 ± 0.67 d | nd | nd | nd | nd |
| JHDBT | 57.34 ± 5.02 i | 76.99 ± 6.34 j | nd | nd | 10.88 ± 1.00 c,d | 4.90 ± 0.87 a | 2.02 ± 0.38 b | nd | nd |
| QSBT | 112.00 ± 11.70 f | 291.22 ± 29.12 d | 141.27 ± 20.72 d | 174.48 ± 15.84 d–f | nd | nd | nd | nd | nd |
| SZZS | 119.13 ± 5.62 f | 109.42 ± 3.73 i | nd | nd | 18.08 ± 1.03 c | 2.93 ± 0.10 b | 0.71 ± 0.14 b | nd | nd |
| WJZBF | 110.15 ± 3.80 f | 175.89 ± 5.84 h | nd | 70.85 ± 1.34 h | 184.81 ± 10.14 a | 4.90 ± 0.02 a | 21.35 ± 1.10 a | nd | nd |
| XY | 267.78 ± 16.47 a | 189.14 ± 11.16 g,h | 403.75 ± 24.5 a | 293.32 ± 40.38 b | 32.24 ± 5.39 b | nd | nd | nd | nd |
| YL | 251.66 ± 14.99 b | 419.35 ± 26.37 b | 186.20 ± 9.15 c | 190.34 ± 11.65 c,d | 39.19 ± 2.74 b | nd | nd | nd | nd |
| ZX | 15.74 ± 0.53 j | 27.50 ± 0.79 k | nd | nd | nd | nd | nd | nd | nd |
| HY002 | 232.36 ± 7.27 c | 312.14 ± 15.78 d | nd | nd | nd | nd | nd | nd | nd |
| HY003 | 82.86 ± 2.60 g,h | 129.09 ± 11.28 i | 67.89 ± 4.38 e,f | 211.16 ± 17.14 c | 12.68 ± 0.87 c | nd | nd | nd | nd |
| HY004 | 95.92 ± 1.97 g | 201.65 ± 13.11 g | 13.01 ± 1.69 g | 144.36 ± 30.23 f,g | 4.74 ± 1.10 d | nd | nd | nd | nd |
| HY018 | 77.95 ± 5.01 h | 232.56 ± 11.76 f | 68.26 ± 16.09 e,f | 184.60 ± 10.00 c–e | 38.13 ± 6.27 b | nd | nd | nd | nd |
C3G was identified as the main anthocyanin in the peach and is responsible for the red colour in these fruits [
18]. A higher C3G content was detected in the peel compared with the pulp. However, small amounts of pigments were also detected in the pulp in some cultivars, particularly in tissues near the stone. In our study, the peel of HY018 (670.59 mg C3G/kg DW) and the pulp of WJZBF (184.81 mg C3G/kg DW C3G) contained the highest amounts of C3G among the peach cultivars examined. Increasing evidence of the benefit of anthocyanins to human nutrition and health has increased research interests in the red flesh colour in peach breeding [
9,
14].
Q3GAL, Q3GLU, Q3R and K3R were the major flavonols identified in the peach fruit, and Q3GLU was predominantly observed. These flavonols were primarily detected in the peel, and only trace amounts of Q3GAL and Q3GLU were detected in the pulp of some peach cultivars, consistent with previous studies [
17]. The peel of four nectarine cultivars showed relatively high Q3GLU contents, ranging from 388.36 (HY003) to 581.21 mg/kg DW (HY002), while the melting peach cultivars showed a relatively low Q3GLU content, with values below 70 mg/kg DW. Similarly, the peels of four nectarine cultivars showed relatively high Q3GAL contents, ranging from 267.38 (HY003) to 396.49 mg/kg DW (HY002), while the melting peach cultivars showed a relatively low Q3GAL content, with values below 70 mg/kg DW. Q3R and K3R were only detected in the peels of peach fruits, ranging in concentration from 59.15 to 193.25 mg/kg DW for Q3R and from 16.91 to 110.86 mg/kg DW for K3R in the cultivars tested.
2.4. Variation Patterns and Principal Components Analysis (PCA)
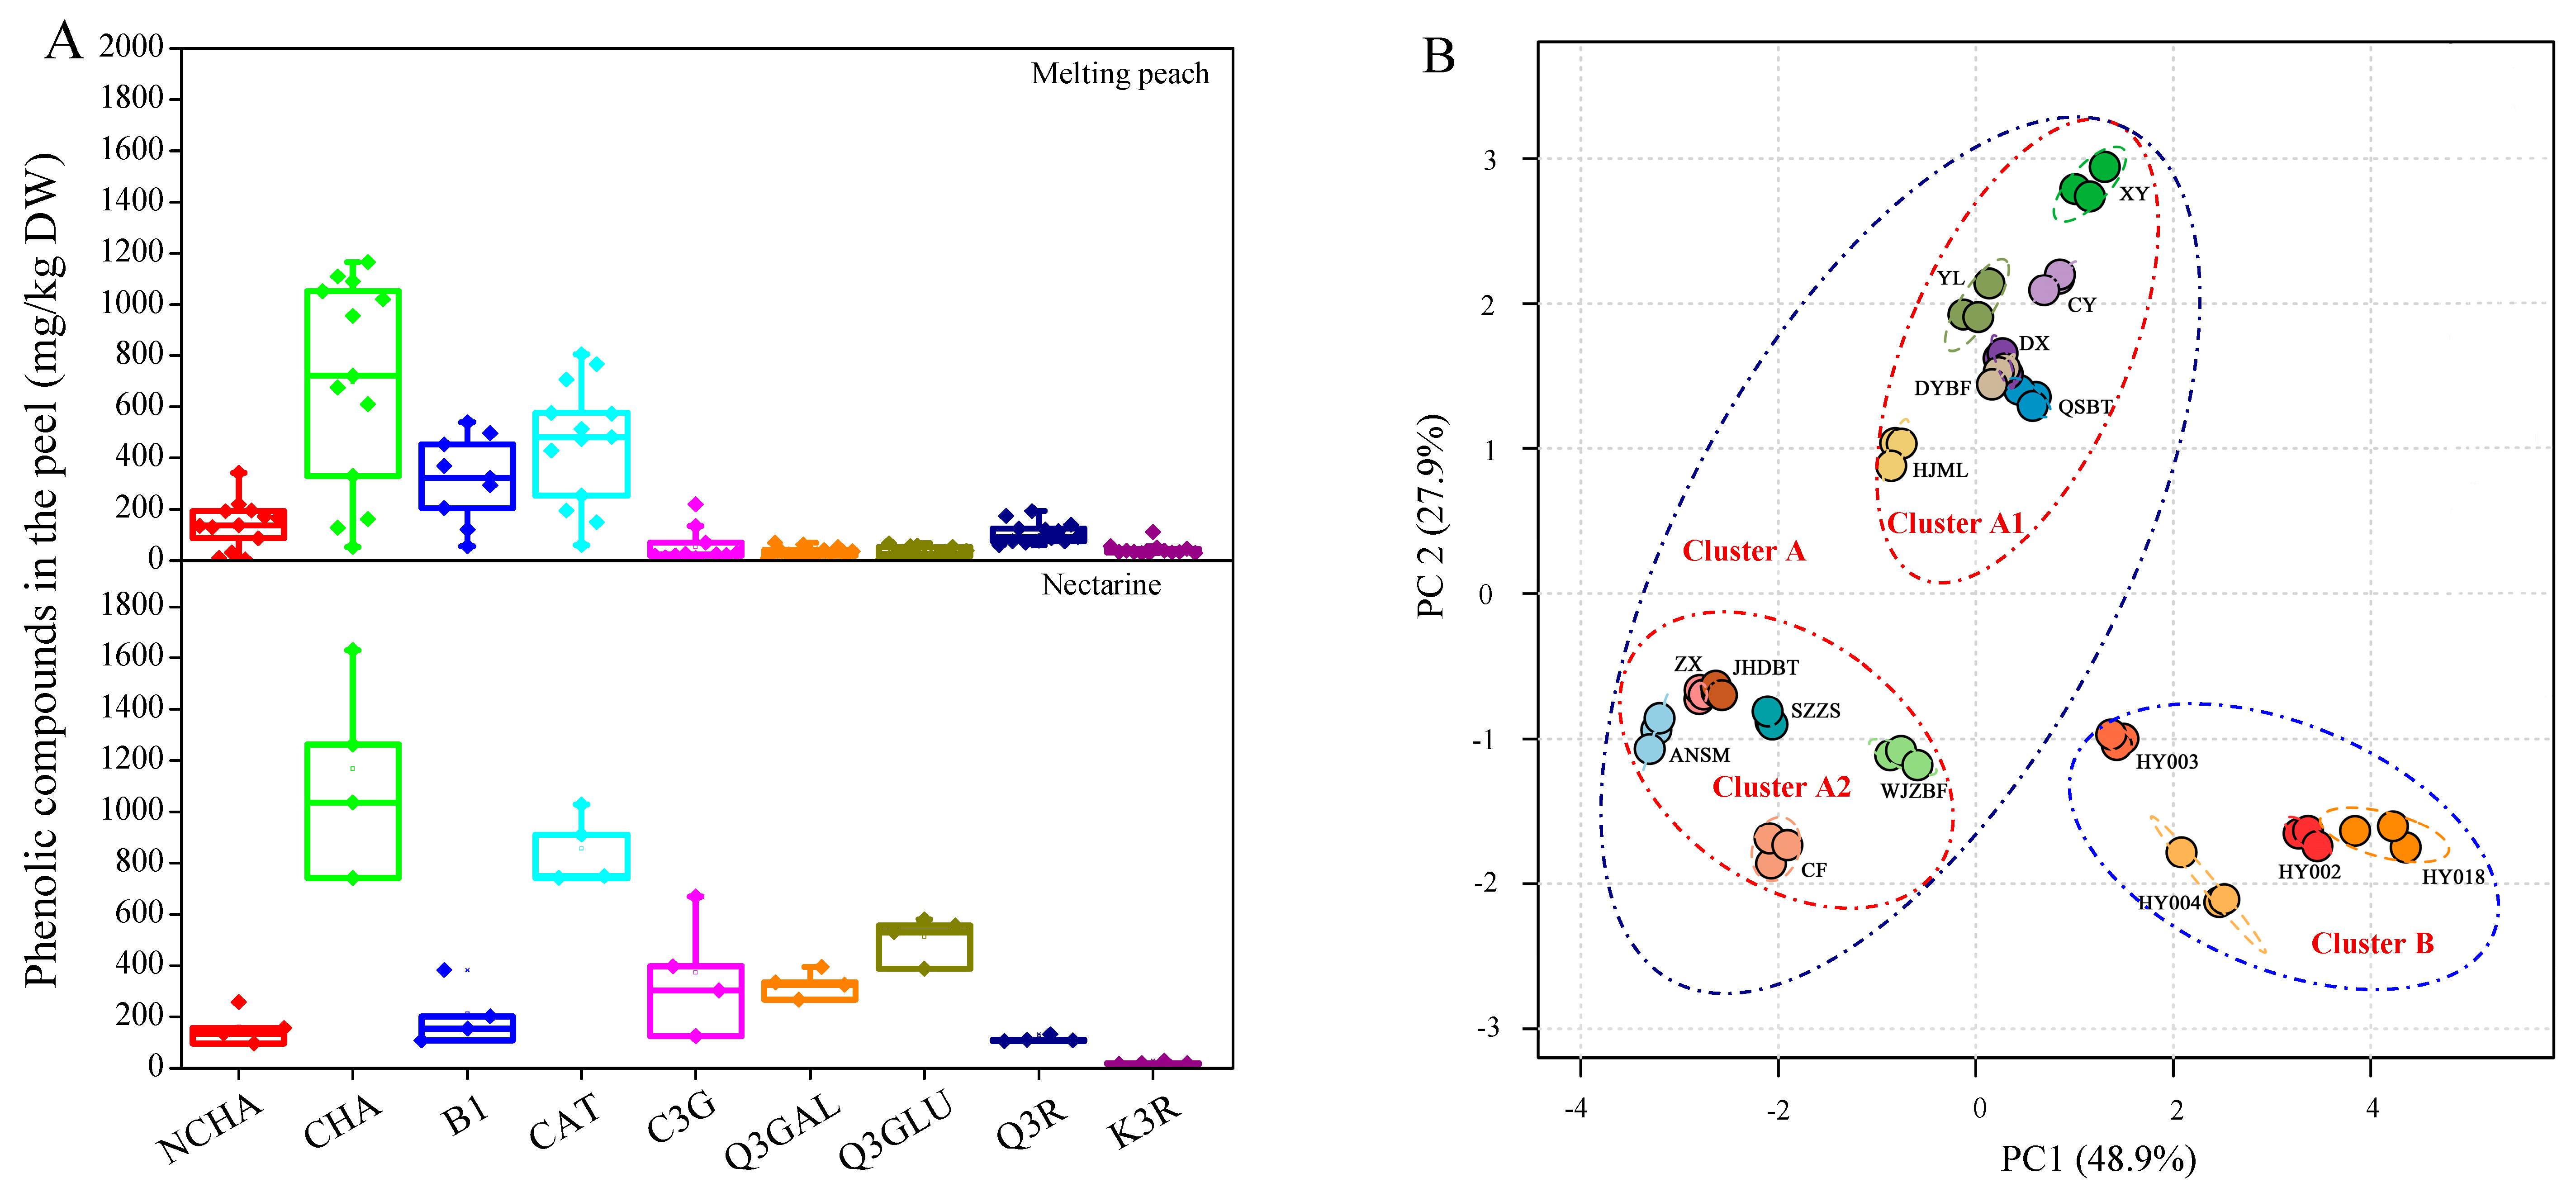
The phenolic profiles in the fruit peel showed variations between melting peaches and nectarines (
Figure 1A,B). Compared with the 13 melting peach cultivars, the four nectarine cultivars contained relatively higher amounts of Q3GAL and Q3GLU (
Figure 1A and
Table 3). Furthermore, PCA also showed a clear distinction between the 13 melting peach cultivars (cluster A) and the four nectarine cultivars (cluster B) (
Figure 1B). The first two PCs explained 48.9% and 27.9% of the variance, respectively. Interestingly, cluster A could be further divided into two subgroups,
i.e., clusters A1 and A2. Cluster A1 included all seven melting peach cultivars grown in the Zhejiang province, which were relatively higher in B1 content, while cluster A2 included all six melting peach cultivars grown in Shanghai, which exhibited relatively higher contents of Q3R and K3R (
Figure 1B).
Figure 1.
Analysis of the phenolic contents in the peel of 17 P. persica cultivars (A) and the classification of different fruit cultivars using principle component analysis (PCA) based on the phenolic profiles in the peach peel (B).
Figure 1.
Analysis of the phenolic contents in the peel of 17 P. persica cultivars (A) and the classification of different fruit cultivars using principle component analysis (PCA) based on the phenolic profiles in the peach peel (B).
2.5. Total Phenolics and Antioxidant Capacities
The total phenolic contents in the peel and pulp extract of 17 peach cultivars were measured, and the antioxidant capacities of these fruits were evaluated using 2,2-diphenyl-1-picrylhydrazyl (DPPH) and ferric reducing antioxidant power (FRAP) methods. Obvious variations in the total phenolic contents, ranging from 4.58 to 12.68 mg gallic acid equivalent (GAE)/g DW in the peel and from 0.82 to 6.52 mg GAE/g DW in the pulp, were observed among the cultivars tested (
Table 5). This variation was consistent with the previous results of Cheng and Crisosto [
25] and Manzoor
et al. [
16]. In the peel, HY002 showed the highest total phenolic content, followed by HY018 and XY, while ANSM showed the lowest total phenolic content. In the pulp, XY showed the highest total phenolic content, followed by YL, while ZX showed the lowest total phenolic content.
The DPPH assay has been widely used to evaluate the free radical scavenging constituents in plants. The DPPH values for the different cultivars analysed varied from 6.35 to 19.84 mg trolox equivalent antioxidant capacity (TEAC)/g DW in the peel and from 1.05 to 15.01 mg TEAC/g DW in the pulp (
Table 5). XY showed the highest DPPH values, while ZX showed the lowest DPPH values in both the peel and pulp tissues. In the peel, DPPH values in all nectarines tested were higher than the average value (14.6 mg TEAC/g DW) obtained for the 17 peach cultivars, consistent with the higher phenolic content in these fruits. In addition, much higher levels of DPPH radical scavenging activity were observed in the peel fraction compared with the pulp fraction, consistent with the previous results of Manzoor
et al. [
16].
The FRAP values of the peach cultivars varied from 3.24 to 13.85 mg TEAC/g DW in the peel and from 0.61 to 6.99 mg TEAC/g DW in the pulp. Both the peel and pulp of XY showed the highest FRAP values among all samples tested (
Table 5). Similarly, the FRAP values in nectarine peels were higher than the average FRAP values (9.1 mg TEAC/g DW) obtained for the 17 peach cultivars. Higher FRAP values were observed for peel extracts compared with pulp extracts, consistent with the results of Guo
et al. [
26].
Since the two methods used above showed different antioxidant capacities for the same cultivar (
Table 5), an overall antioxidant potency composite (APC) index was calculated for each cultivar according to the method of Seeram
et al. [
27]. The APC index showed obvious variations, ranging from 28.29 to 99.57 in the peel and 7.92 to 99.89 in the pulp (
Table 5). XY, a melting peach cultivar, showed the highest APC index in both peel and pulp tissues and is thus an ideal peach cultivar for future breeding.
Table 5.
Total phenolic contents and antioxidant activities in the peel and pulp extracts of 17 P. persica cultivars.
Table 5.
Total phenolic contents and antioxidant activities in the peel and pulp extracts of 17 P. persica cultivars.
| Cultivars | Peel | Pulp |
|---|
| Total Phenolics mg GAE/g DW | DPPH mg TEAC/g DW | FRAP mg TEAC/g DW | APC | Rank | Total Phenolics mg GAE/g DW | DPPH mg TEAC/g DW | FRAP mg TEAC/g DW | APC | Rank |
|---|
| ANSM | 4.58 ± 0.06 j | 6.66 ± 0.27 h | 3.24 ± 0.01 j | 28.36 | 16 | 2.82 ± 0.13 i | 4.42 ± 0.06 e | 1.96 ± 0.08 h | 28.92 | 14 |
| CF | 9.54 ± 0.11 g | 13.83 ± 0.34 d | 7.70 ± 0.21 g | 62.34 | 12 | 4.09 ± 0.12 d,e | 6.56 ± 0.24 c,d | 3.26 ± 0.01 e | 45.47 | 7 |
| CY | 11.19 ± 0.12 d,e | 17.15 ± 1.01 b | 12.41 ± 0.13 b | 87.72 | 4 | 5.89 ± 0.02 c | 9.75 ± 0.62 b | 6.89 ± 0.04 a | 82.02 | 2 |
| DX | 10.12 ± 0.12 f | 15.53 ± 0.10 c | 11.17 ± 0.13 d | 79.16 | 8 | 4.19 ± 0.08 d | 7.17 ± 0.18 c | 4.95 ± 0.13 c | 59.63 | 4 |
| DYBF | 9.60 ± 0.02 g | 15.13 ± 0.26 c | 10.98 ± 0.07 d | 77.47 | 9 | 3.65 ± 0.05 f | 5.96 ± 0.11 d | 4.06 ± 0.07 d | 49.11 | 6 |
| HJML | 9.72 ± 0.34 f,g | 15.03 ± 0.95 c | 8.69 ± 0.21 f | 69.01 | 11 | 3.33 ± 0.08 g | 6.28 ± 0.10 c,d | 3.09 ± 0.05 e | 43.34 | 8 |
| JHDBT | 6.20 ± 0.17 h | 9.45 ± 0.71 f | 4.70 ± 0.04 h | 40.63 | 14 | 2.35 ± 0.07 k | 4.28 ± 0.41 e | 1.97 ± 0.05 h | 28.67 | 15 |
| QSBT | 11.06 ± 0.2 1,e | 19.79 ± 0.88 a | 11.71 ± 0.25 c | 91.73 | 3 | 3.59 ± 0.29 f | 6.46 ± 0.70 c,d | 3.89 ± 0.29 d | 49.75 | 5 |
| SZZS | 6.32 ± 0.23 h | 8.20 ± 0.47 g | 4.19 ± 0.10 i | 35.64 | 15 | 2.13 ± 0.01 l | 3.00 ± 0.12 f | 1.45 ± 0.02 i | 20.55 | 16 |
| WJZBF | 9.82 ± 0.23 f,g | 12.79 ± 0.11 e | 7.59 ± 0.18 g | 59.41 | 13 | 3.93 ± 0.07 e | 5.73 ± 0.19 d | 3.23 ± 0.03 e | 42.43 | 9 |
| XY | 12.25 ± 0.76 a,b | 19.84 ± 0.48 a | 13.85 ± 0.66 a | 99.57 | 1 | 6.52 ± 0.15 a | 15.01 ± 2.36 a | 6.99 ± 0.18 a | 99.89 | 1 |
| YL | 10.78 ± 0.43 e | 16.98 ± 0.12 b | 8.78 ± 0.69 f | 74.22 | 10 | 6.08 ± 0.10 b | 9.58 ± 0.22 b | 5.17 ± 0.16 b | 69.22 | 3 |
| ZX | 5.15 ± 0.04 i | 6.35 ± 0.63 h | 3.44 ± 0.13 j | 28.29 | 17 | 0.82 ± 0.03 m | 1.05 ± 0.07 g | 0.61 ± 0.01 j | 7.92 | 17 |
| HY002 | 12.68 ± 0.14 a | 17.63 ± 0.14 b | 11.72 ± 0.15 c | 86.41 | 5 | 3.03 ± 0.07 h | 4.42 ± 0.15 e | 2.69 ± 0.04 f | 34.19 | 11 |
| HY003 | 11.54 ± 0.06 c,d | 17.43 ± 0.15 b | 10.49 ± 0.07 e | 81.47 | 7 | 2.87 ± 0.03 h,i | 4.26 ± 0.35 e | 2.61 ± 0.03 f | 32.94 | 12 |
| HY004 | 11.94 ± 0.04 b,c | 16.81 ± 0.50 b | 11.25 ± 0.32 c,d | 82.64 | 6 | 2.59 ± 0.02 j | 3.59 ± 0.14 e,f | 2.41 ± 0.04 g | 29.41 | 13 |
| HY018 | 12.61 ± 0.12 a | 19.29 ± 0.58 a | 12.49 ± 0.09 b | 93.32 | 2 | 3.35 ± 0.02 g | 5.59 ± 0.12 d | 3.13 ± 0.03 e | 41.29 | 10 |
2.6. Correlations between Fruit Bioactivity Traits
Correlation analyses were performed to investigate the relationship between the antioxidant capacity and the phenolic content in different peach samples (
Table 6).
Table 6.
Pearson’s correlation coefficients between antioxidant activities and phenolic contents.
Table 6.
Pearson’s correlation coefficients between antioxidant activities and phenolic contents.
| Antioxidant Capacities/Phenolic Contents | Peel | Pulp |
|---|
| DPPH | FRAP | DPPH | FRAP |
|---|
| FRAP | 0.952 ** | 1 | 0.918 ** | 1 |
| Total phenolics | 0.956 ** | 0.936 ** | 0.935 ** | 0.950 ** |
| TIP | 0.863 ** | 0.876 ** | 0.829 ** | 0.953 ** |
| Hydroxycinnamates | 0.881 ** | 0.919 ** | 0.642 ** | 0.802 ** |
| Flavan-3-ols | 0.942 ** | 0.938 ** | 0.827 ** | 0.907 ** |
| Anthocyanin | 0.473 ** | 0.408 ** | 0.062 | 0.071 |
| Flavonols | 0.338 * | 0.329 * | −0.097 | −0.124 |
| NCHA | 0.788 ** | 0.851 ** | 0.698 ** | 0.687 ** |
| CHA | 0.874 ** | 0.905 ** | 0.519 ** | 0.752 ** |
| B1 | 0.675 ** | 0.676 ** | 0.873 ** | 0.925 ** |
| CAT | 0.907 ** | 0.891 ** | 0.550 ** | 0.718 ** |
High correlations between DPPH and FRAP were observed for both the peel (
r = 0.952,
p < 0.01) and the pulp (
r = 0.918,
p < 0.01), thereby validating these two methods for evaluating antioxidant activity. In addition, in both fruit tissues, the total phenolic content was strongly correlated with antioxidant activity,
i.e., extracts with higher total phenolic contents showed higher antioxidant activity, and
vice versa. These data were consistent with the results of previous studies [
11,
16]. In addition, total individual phenolics (TIP,
i.e., the sum of nine individual phenolic compounds identified in this study), hydroxycinnamates, and flavan-3-ols also showed a significant correlation with the antioxidant activities in both tissues of the samples analysed (ranged from 0.642 to 0.942,
p < 0.01). Flavonols and anthocyanins, however, did not show a good correlation with antioxidant activities. Among the nine phenolic compounds, NCHA, CHA, B1, and CAT showed a good correlation with the antioxidant activities of the fruit extracts (
Table 6), which were mainly due to their relatively high concentrations in the fruit and their high intrinsic antioxidant activities (data not shown). Other compounds, such as C3G, were present at low concentrations in peach fruits and did not show a high correlation with the antioxidant activities in the fruit extracts.


