1. Introduction
A protoplast is a naked plant cell bounded only by the cell membrane that is obtained by enzymatic treatment to remove the cell wall. The structural property of protoplasts facilitates the study of transient expression systems. Recently, protoplasts have been reported to retain their tissue- and cell-specific features within the time frame of a transient expression assay [
1,
2]. This property is combined with the advantage of a fluorescence-activated cell sorting (FACS) that sorts protoplasts only having a fluorescent signal [
2,
3] to facilitate molecular biological studies on the expression profiling of local tissues, such as the
Arabidopsis root quiescent center and sperm cells [
4,
5]. Those studies have highlighted the potential of single cell-based FACS using protoplasts. Also, single cell-based flow cytometric analysis (FCA) has been successfully applied to
in vivo analysis of protein-protein interactions [
6,
7], and promoter activity [
8,
9],
etc.
Hagenbeek and Rock (2001) [
9] reported the usefulness of FCA for the promoter analysis system using protoplasts, and described the advantages and disadvantages of FCA, in detail. As a major disadvantage, they showed that the fluorescence intensity of GFP was unusually detected to be as low as the threshold level of background signals, and subsequently, it caused the transfection ratio determined to be as low as 4%, which represented the population size of protoplasts expressing GFP-fluorescent signals on FCA. Since the average transfection efficiency determined on hemocytometer analysis has been reported to be
ca. 40%–60% [
9], a large number of transfected protoplasts might supposedly have been missed on FCA. It could be a bottleneck on application of plant protoplast system to various FCA or FACS. To overcome these limitations of FCA using protoplasts, higher DNA quantities (10–130 μg) were used, but the transfection ratio, (amounting to 6%), was not markedly improved. Thus, the low fluorescence intensity of FCA using plant protoplasts remains a challenging limitation.
As chloroplasts are an isolated space bounded by an envelope membrane and a single plant cell comprises many (tens to hundreds) of chloroplasts [
10], they have been reported to be an excellent reservoir for producing various recombinant proteins [
11]. To localize the fluorescent protein (FP) in the chloroplast, the transit peptide originated from the small subunit of the enzyme ribulose-1,5-bisphosphate carboxylase/oxygenase (RuBisCo) of rice [
12], used to localize various recombinant proteins into chloroplasts, was selected. Chloroplasts have been reported to have a limited set of protein degradation pathways in the stroma compared with that of the cytoplasm; it has been an advantage of chloroplasts that recombinant proteins localized within them could be kept more stable than those expressed in the cytoplasm [
13,
14].
Additionally, a Kozak (Kz) sequence, a defined consensus sequence adjacent to the ATG initiation codon in eukaryotic mRNAs, was considered for the improvement of the translation efficiency, which has been reported to mediate efficient initiation of translation by ribosomes [
15]. The Kz sequences have been identified in various eukaryotes including vertebrates, yeasts, protozoa, and plants [
16,
17,
18].
Based on the above advantages, the chloroplast and Kz sequence in this study were adopted for the localization space of FPs and the expression efficiency, respectively. The useful strategy of FCA using rice protoplasts was developed for increasing the fluorescence intensity of FPs analyzed by flow cytometry.
3. Discussion
The powerful capabilities of flow cytometry, including quantification of fluorescence and cell sorting, have been broadly applied in cell biology, molecular biology, and microbiology in various fluid and unicellular systems involving animals and microbes [
20,
21]. In plant systems, technologies using FCA have also been usefully applied to the comparative promoter analysis and the sorting protoplasts expressing fluorescent proteins [
4,
5,
7]. Recently, technology using FCA has been developed to enable high throughput analysis of more than 10
8 samples per day [
22]. In this study, we developed a useful and powerful strategy of FCA using protoplasts by using efficient translation systems and localization of sGFP into chloroplasts. Chloroplasts have been reported as an excellent reservoir for many kinds of ectopically expressed proteins, in which many kinds of foreign proteins could be kept stable [
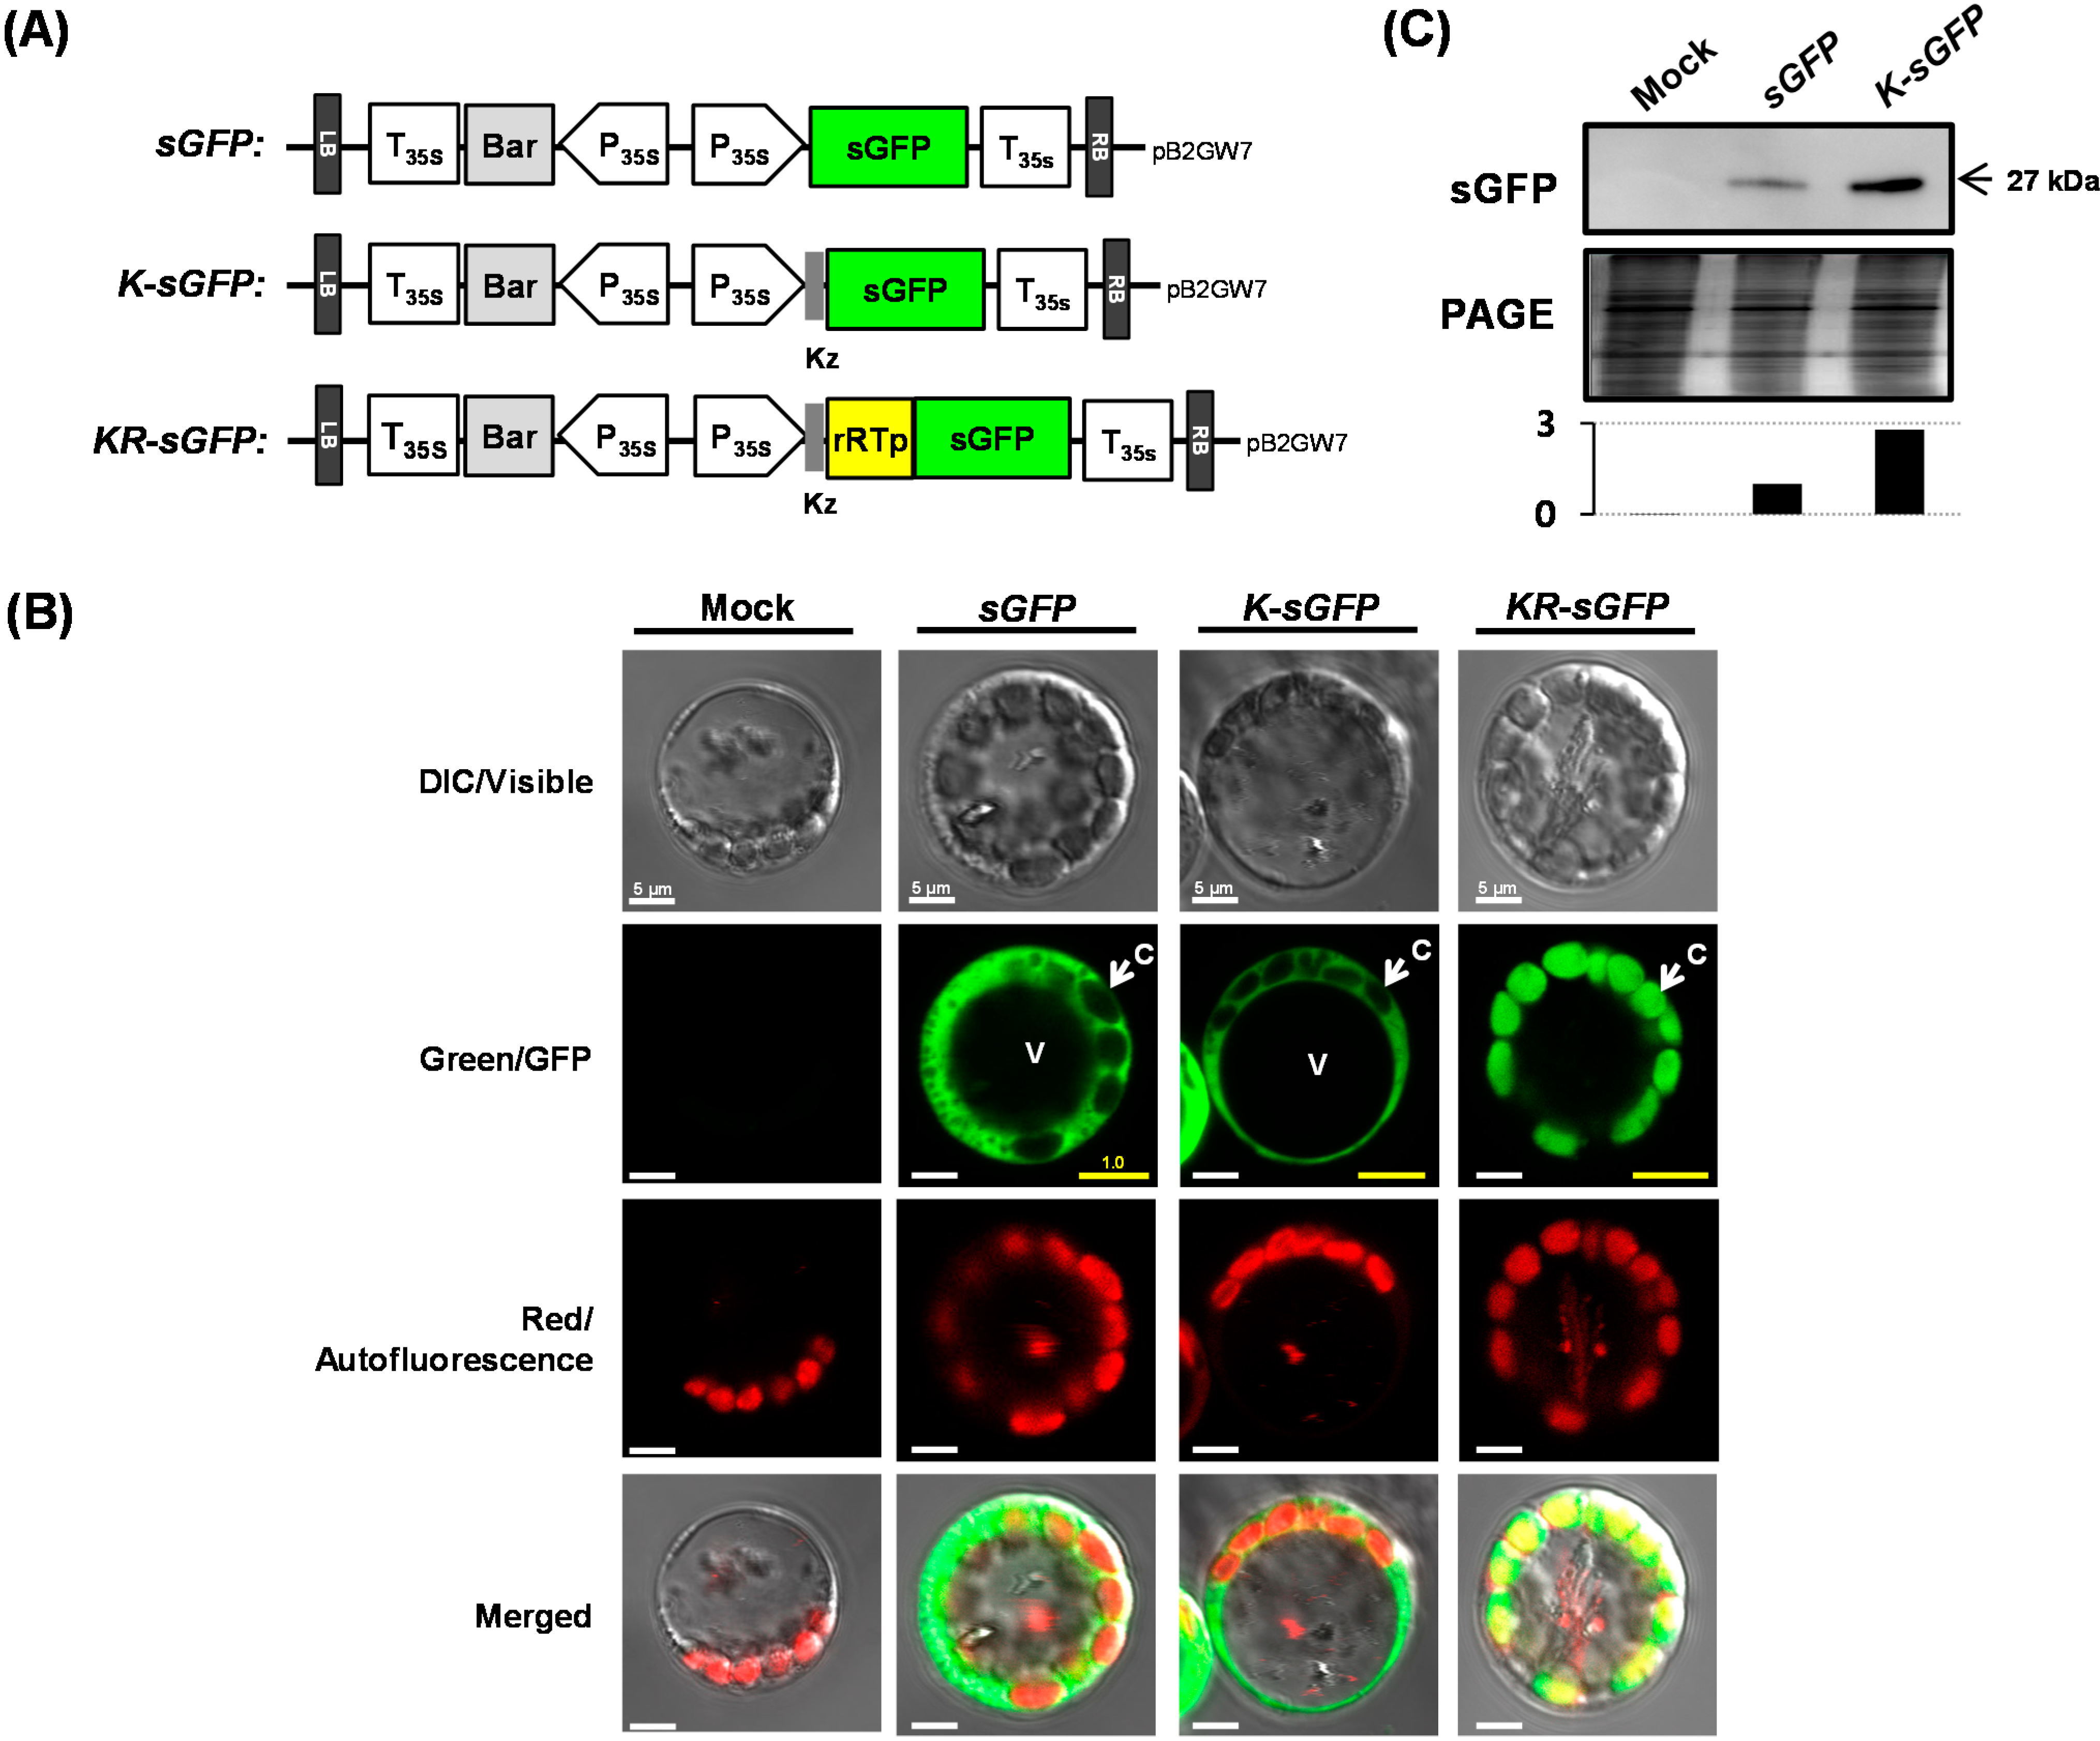
11]; in rice, 20–30 chloroplasts per a rice mesophyll cell have been reported to exist [
23]. Similar numbers of chloroplasts were also shown to be gathered beneath the cell membrane in one protoplast (see
Figure 1B).
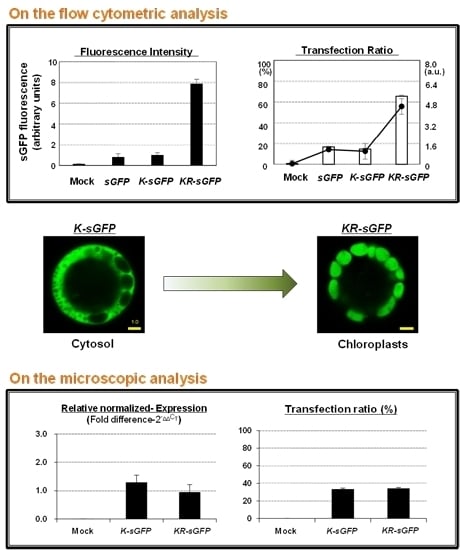
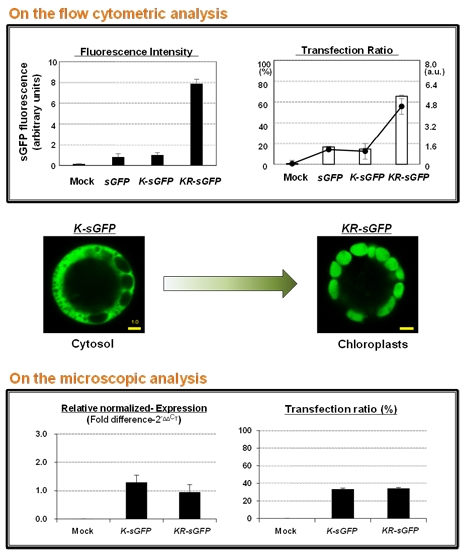
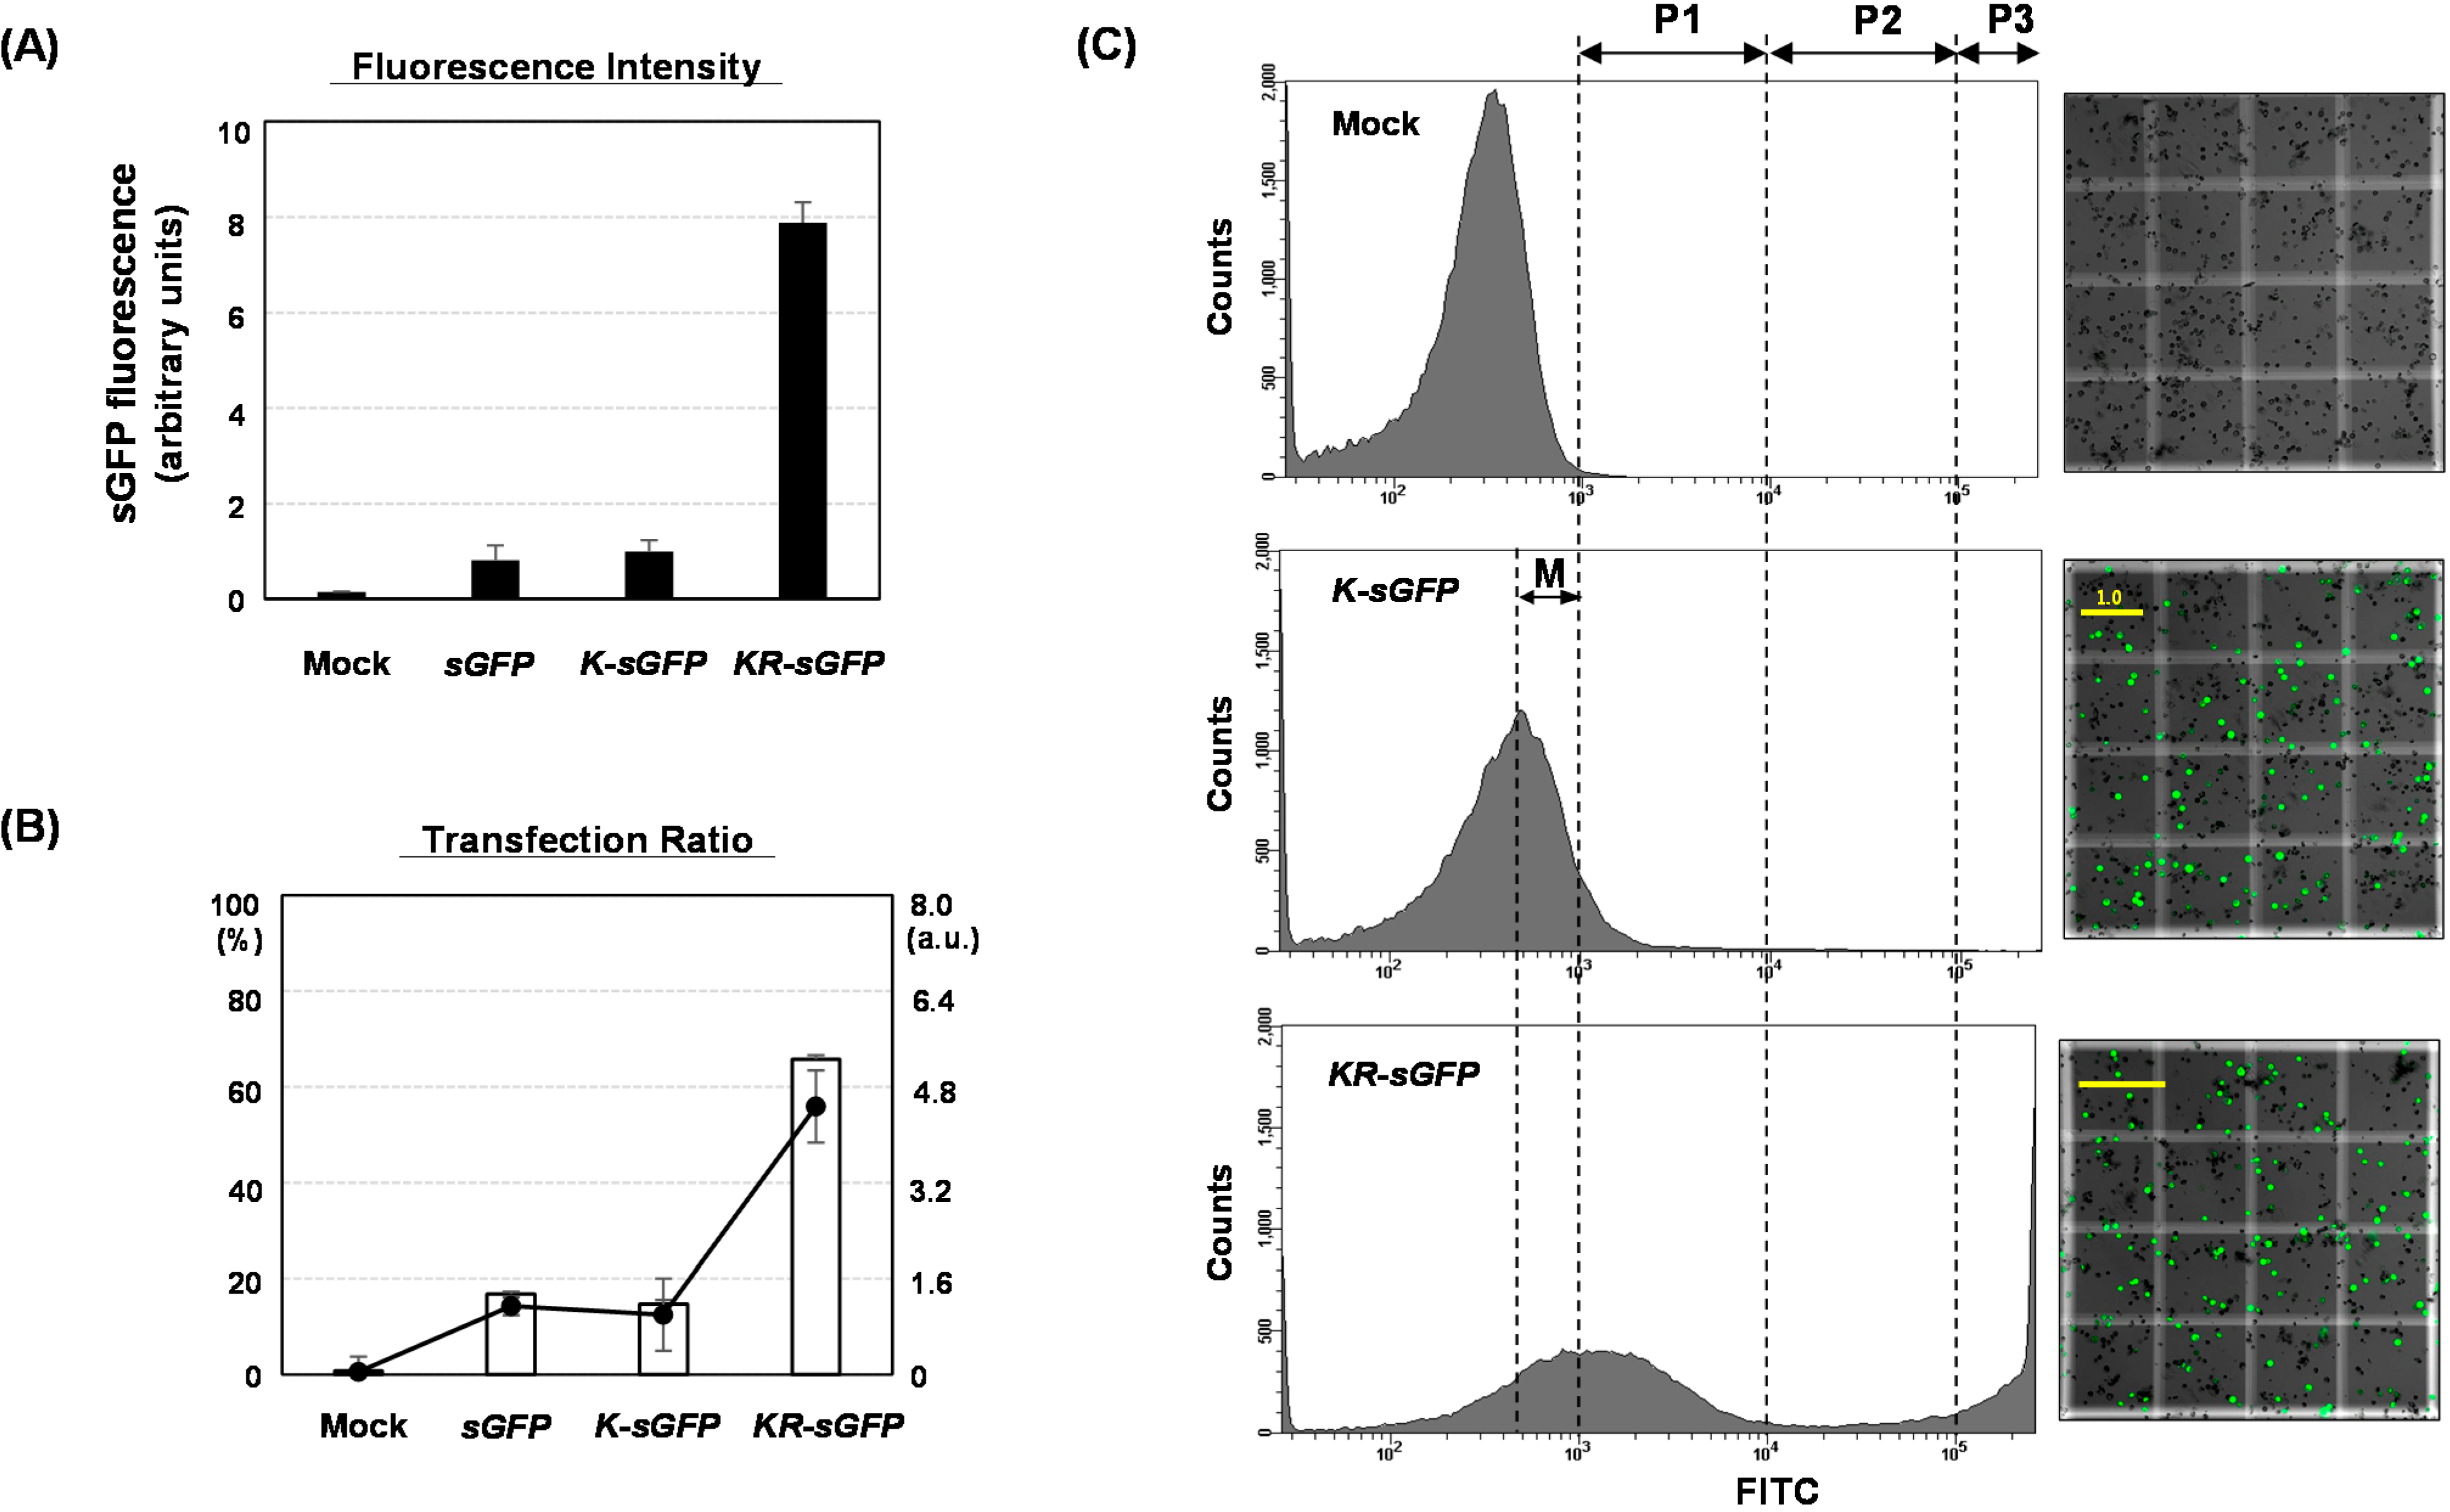
On FCA, the comparison of fluorescence intensities between
sGFP/
K-sGFP (the cytoplasm) and
KR-sGFP (chloroplasts) showed that chloroplast localization of sGFP increased the average of fluorescence intensity (see
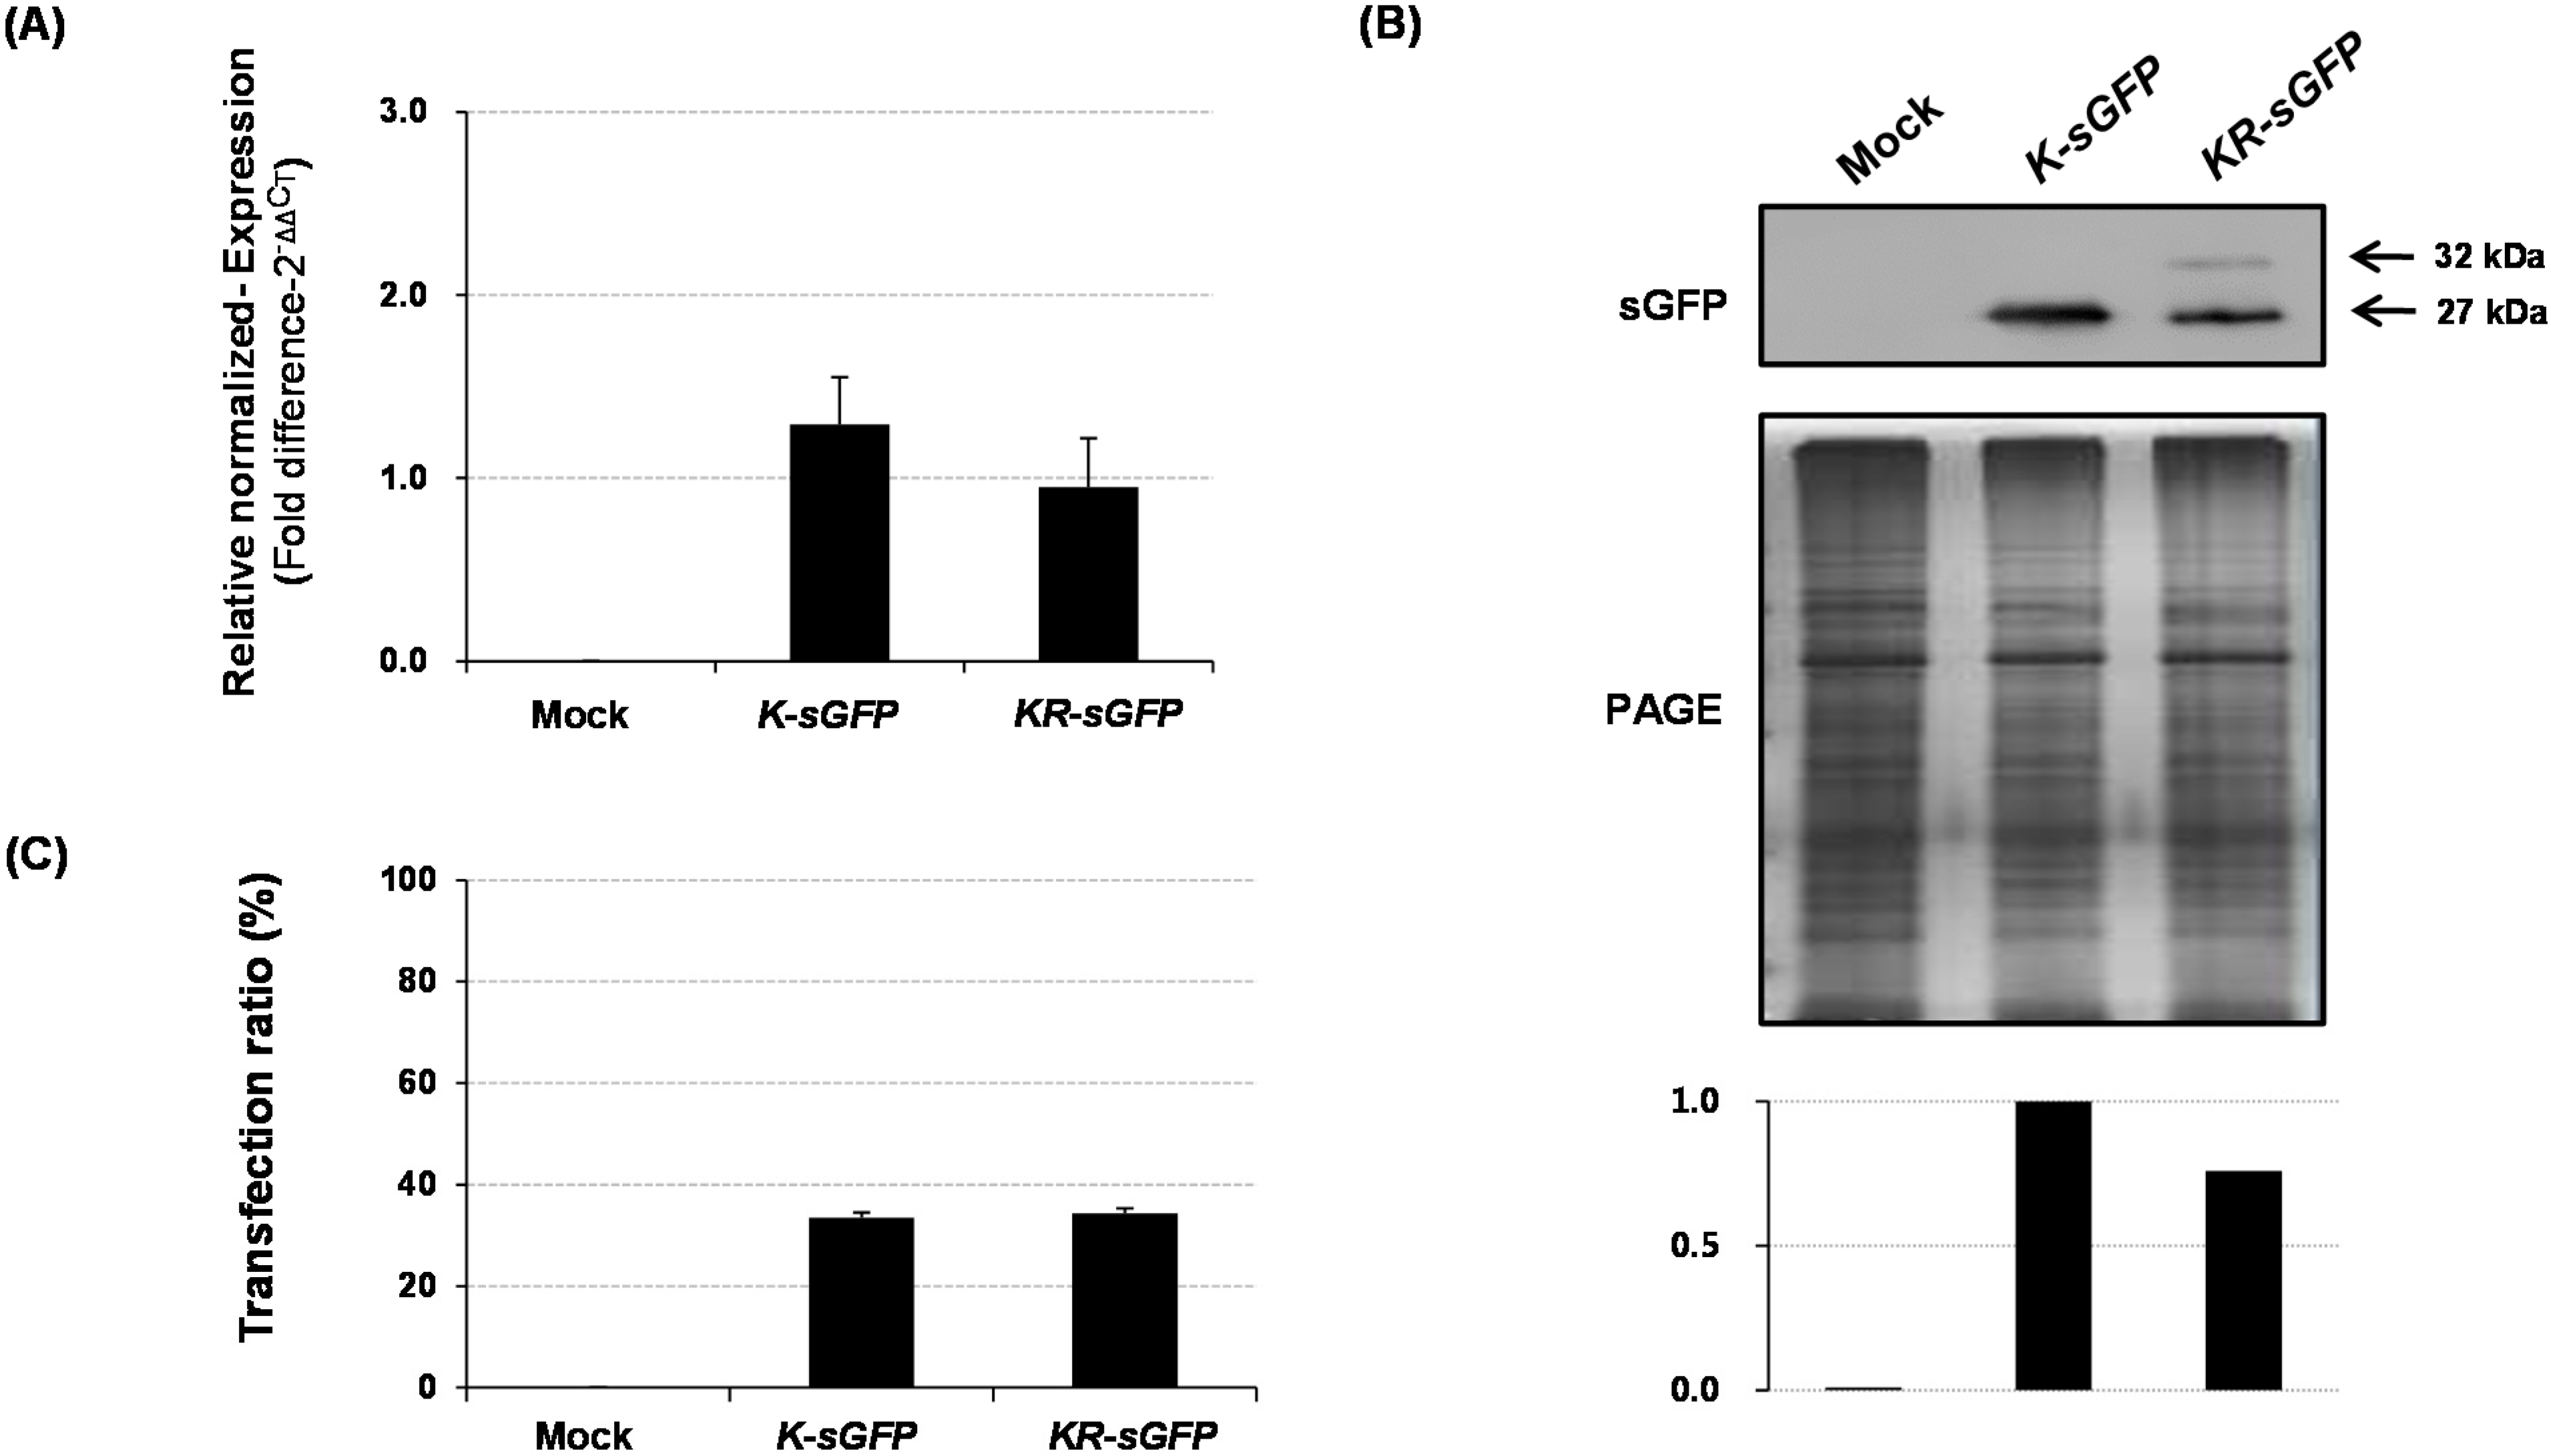
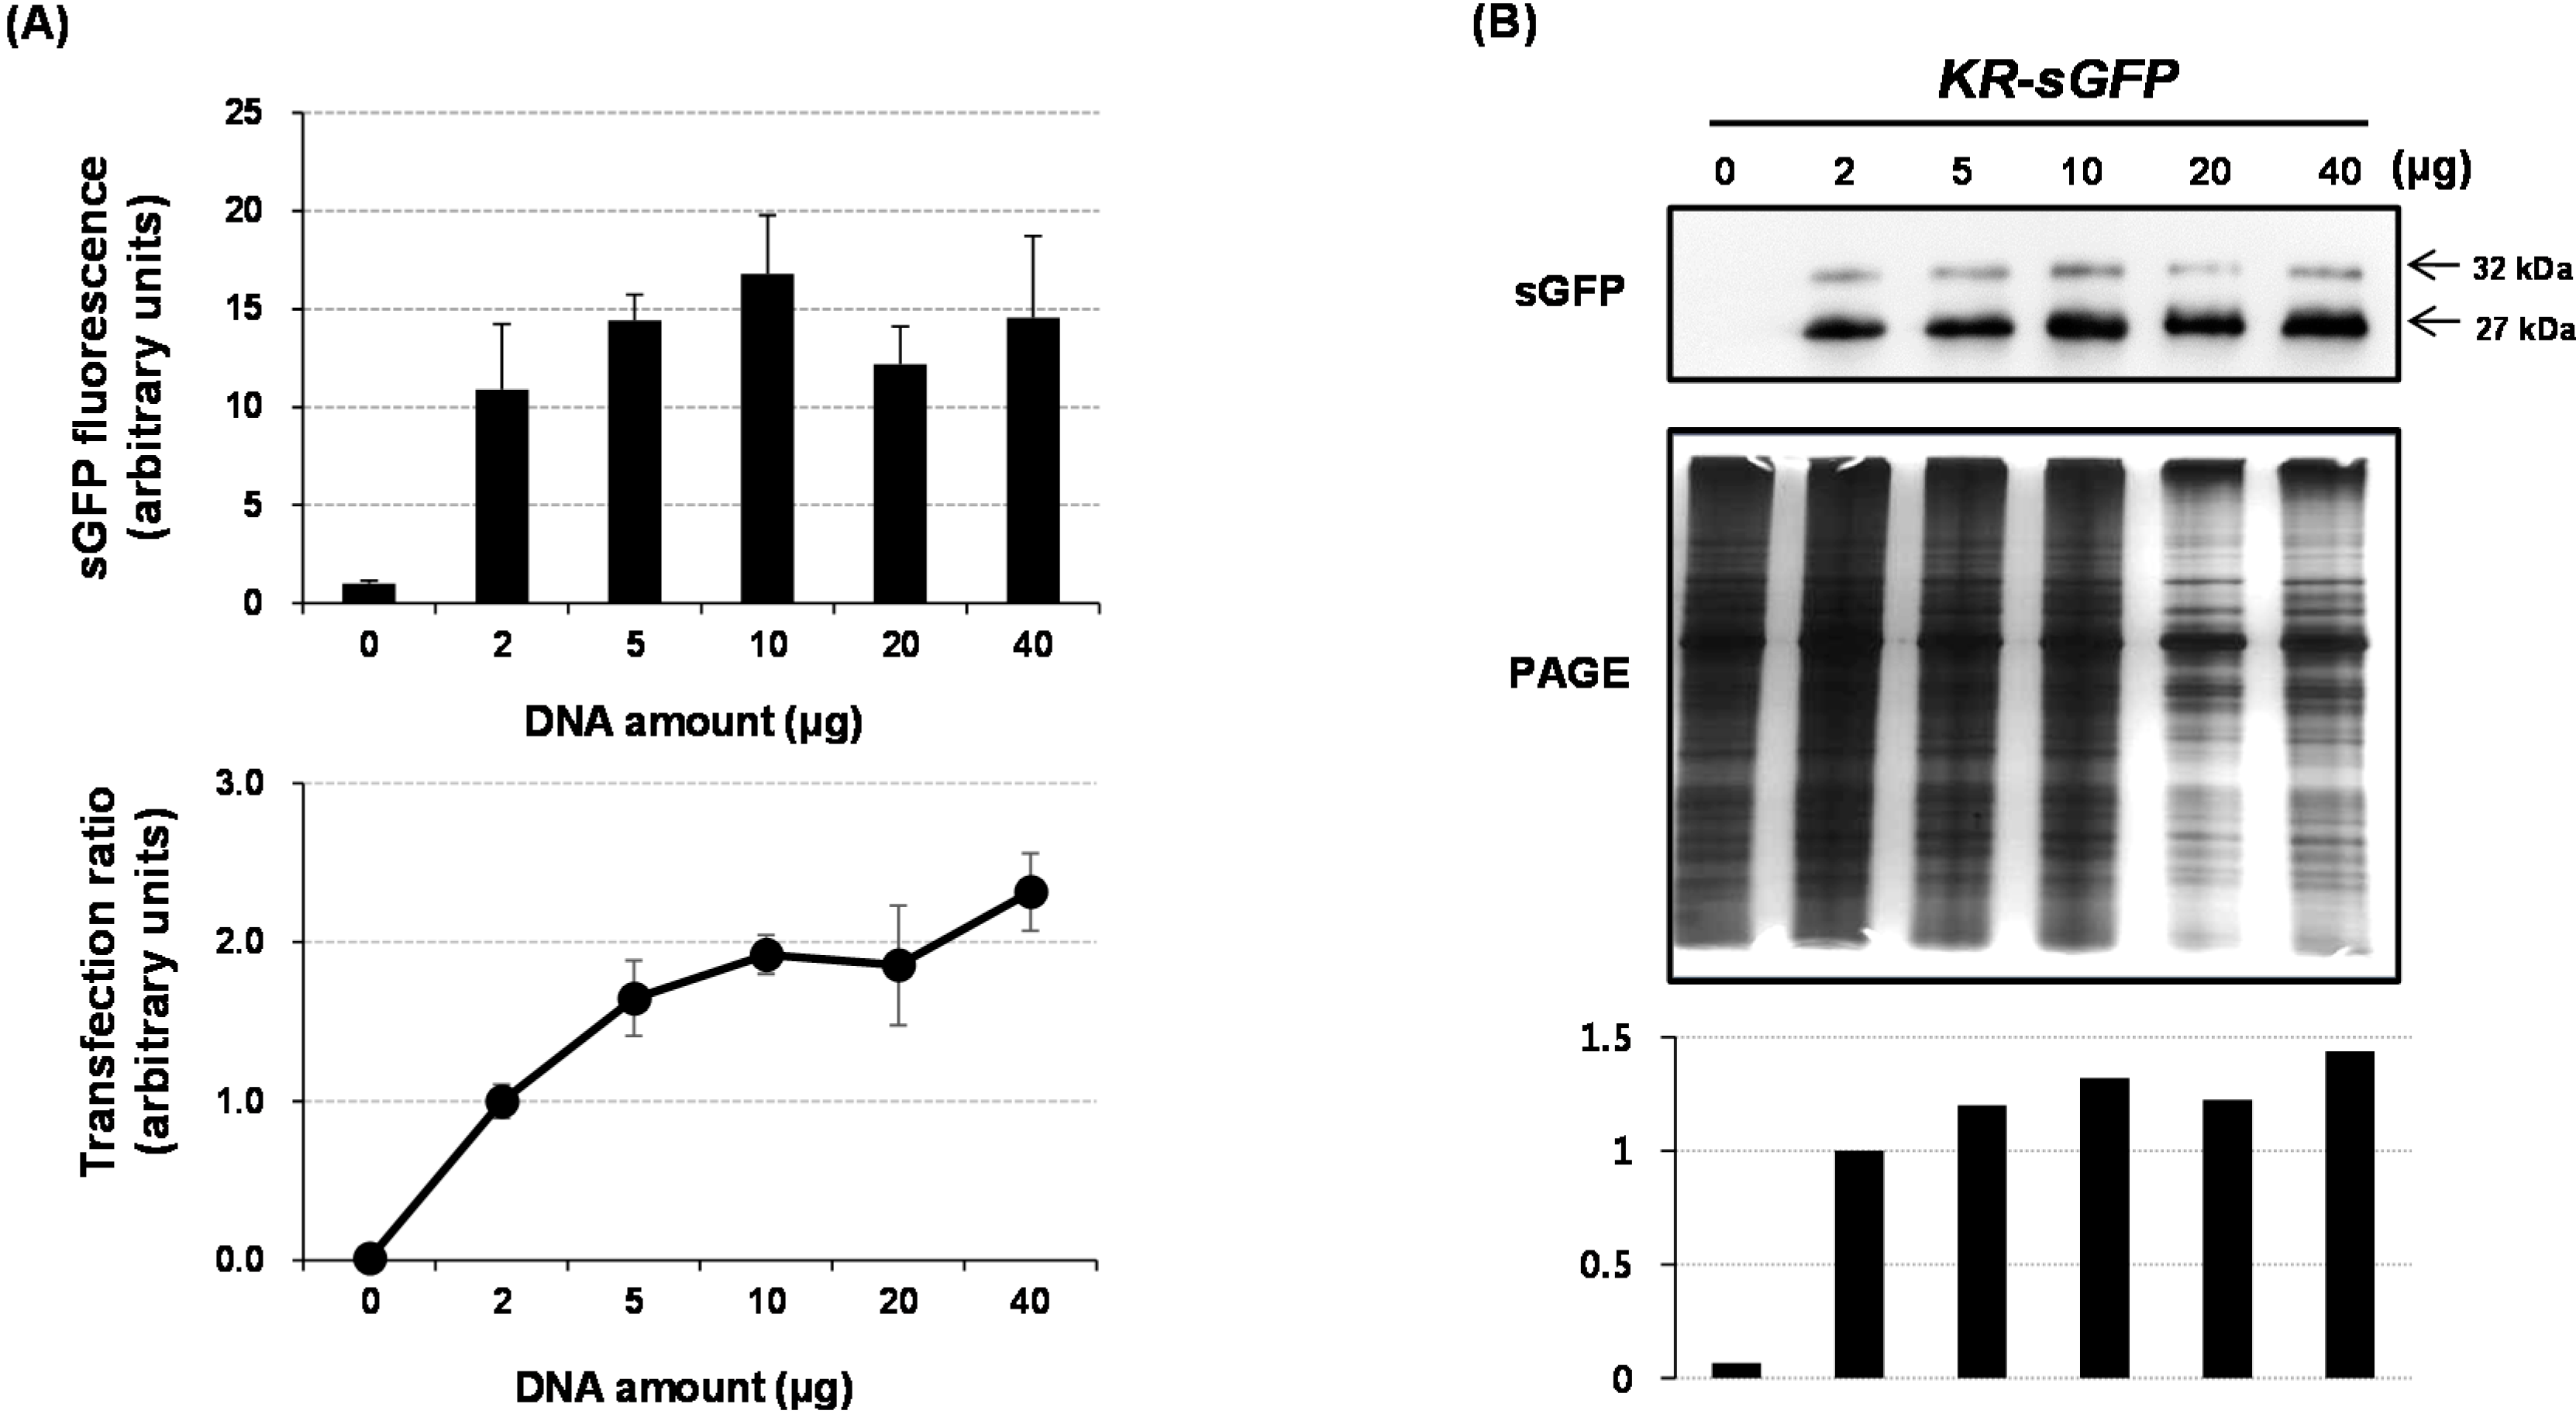
Figure 2A). These results could lead to the assumption that the difference in fluorescence intensity might derive from the expression levels. However, the results of real-time PCR and western blot analysis showed incongruously that their expression levels were rather similar to each other (see
Figure 4). It suggests that the difference in fluorescence intensity is not related to their molecular levels and might be caused by other factors. Typically, the fluorescence emission (e.g., intensity, spectral features, fluorescence lifetime) are mostly limited to a small number of cellular conditions, such as pH, redox potential or refractive index, temperature, prior illumination, and protein concentration [
24] in each protoplast cell, which could affect the emission efficiency of fluorescence from the fluorophore of sGFP. As another important factor that should not be overlooked, we could also consider the self-quenching caused by aggregation of high concentrated fluorophores [
25]. However, microscopic analysis using a hemocytometer showed that the fluorescence emission degrees of
K-sGFP and
KR-sGFP are not considerably different from each other on the image of microscopic analysis using the same exposure time (see
Figure 1B and
Figure 2C), suggesting that the difference of fluorescence intensity as much as 8-fold might stem from not only cellular conditions or self-quenching influencing the efficiency of fluorescence emission, but also from other unknown factors.
Previous study has mentioned that the fluorescence intensity of the GFP on non-imaging detection system (e.g., a fluorometry using cuvets or microtiter plates, or a flow cytometry) tends to be inefficiently measured, compared to it on the imaging detection system of GFPs (e.g., a confocal microscopy or a fluorescence microscopy) [
24]. This report could partly explain our finding that the fluorescence intensity of
K-sGFP on FCA was measured much lower than in microscopic imaging analysis. At this point, it is worth noting that an average of 20–30 chloroplasts in rice protoplasts are mostly positioned underneath cellular membrane layers. Cautiously, we could hypothesize that those characteristics of chloroplasts might help to concentrate stable fluorophores and reduce some effects of refractive index and it might consequentially overcome some problems caused by non-imaging detection methods such as FCA. Since the question of how the chloroplast localization of sGFP causes the increase of fluorescence intensity on FCA remains, it should be further analyzed for improving the fluorescence intensity of GFPs on FCA using plant protoplasts.
The transfection ratio of
KR-sGFP (65.7%) was apparently higher than that of
K-sGFP (14.7%) (see
Figure 2B); however, the hemocytometer measurement showed similar transfection ratio between
K-sGFP and
KR-sGFP (see
Figure 4C). This suggests that the large portion of protoplasts transfected with
K-sGFP (cytoplasm) was from data missed on FCA because of their fluorescence intensity lower than the threshold value regarded as the background signal (see
Figure 2C). An interval of the missed population was presumably determined between the peak of the
K-sGFP plot graph and the threshold point (10
3), called “the missing population (M)” (
Figure 2C). In the interval, the height of the plot graph was shown to be largely reduced in
KR-sGFP compared to
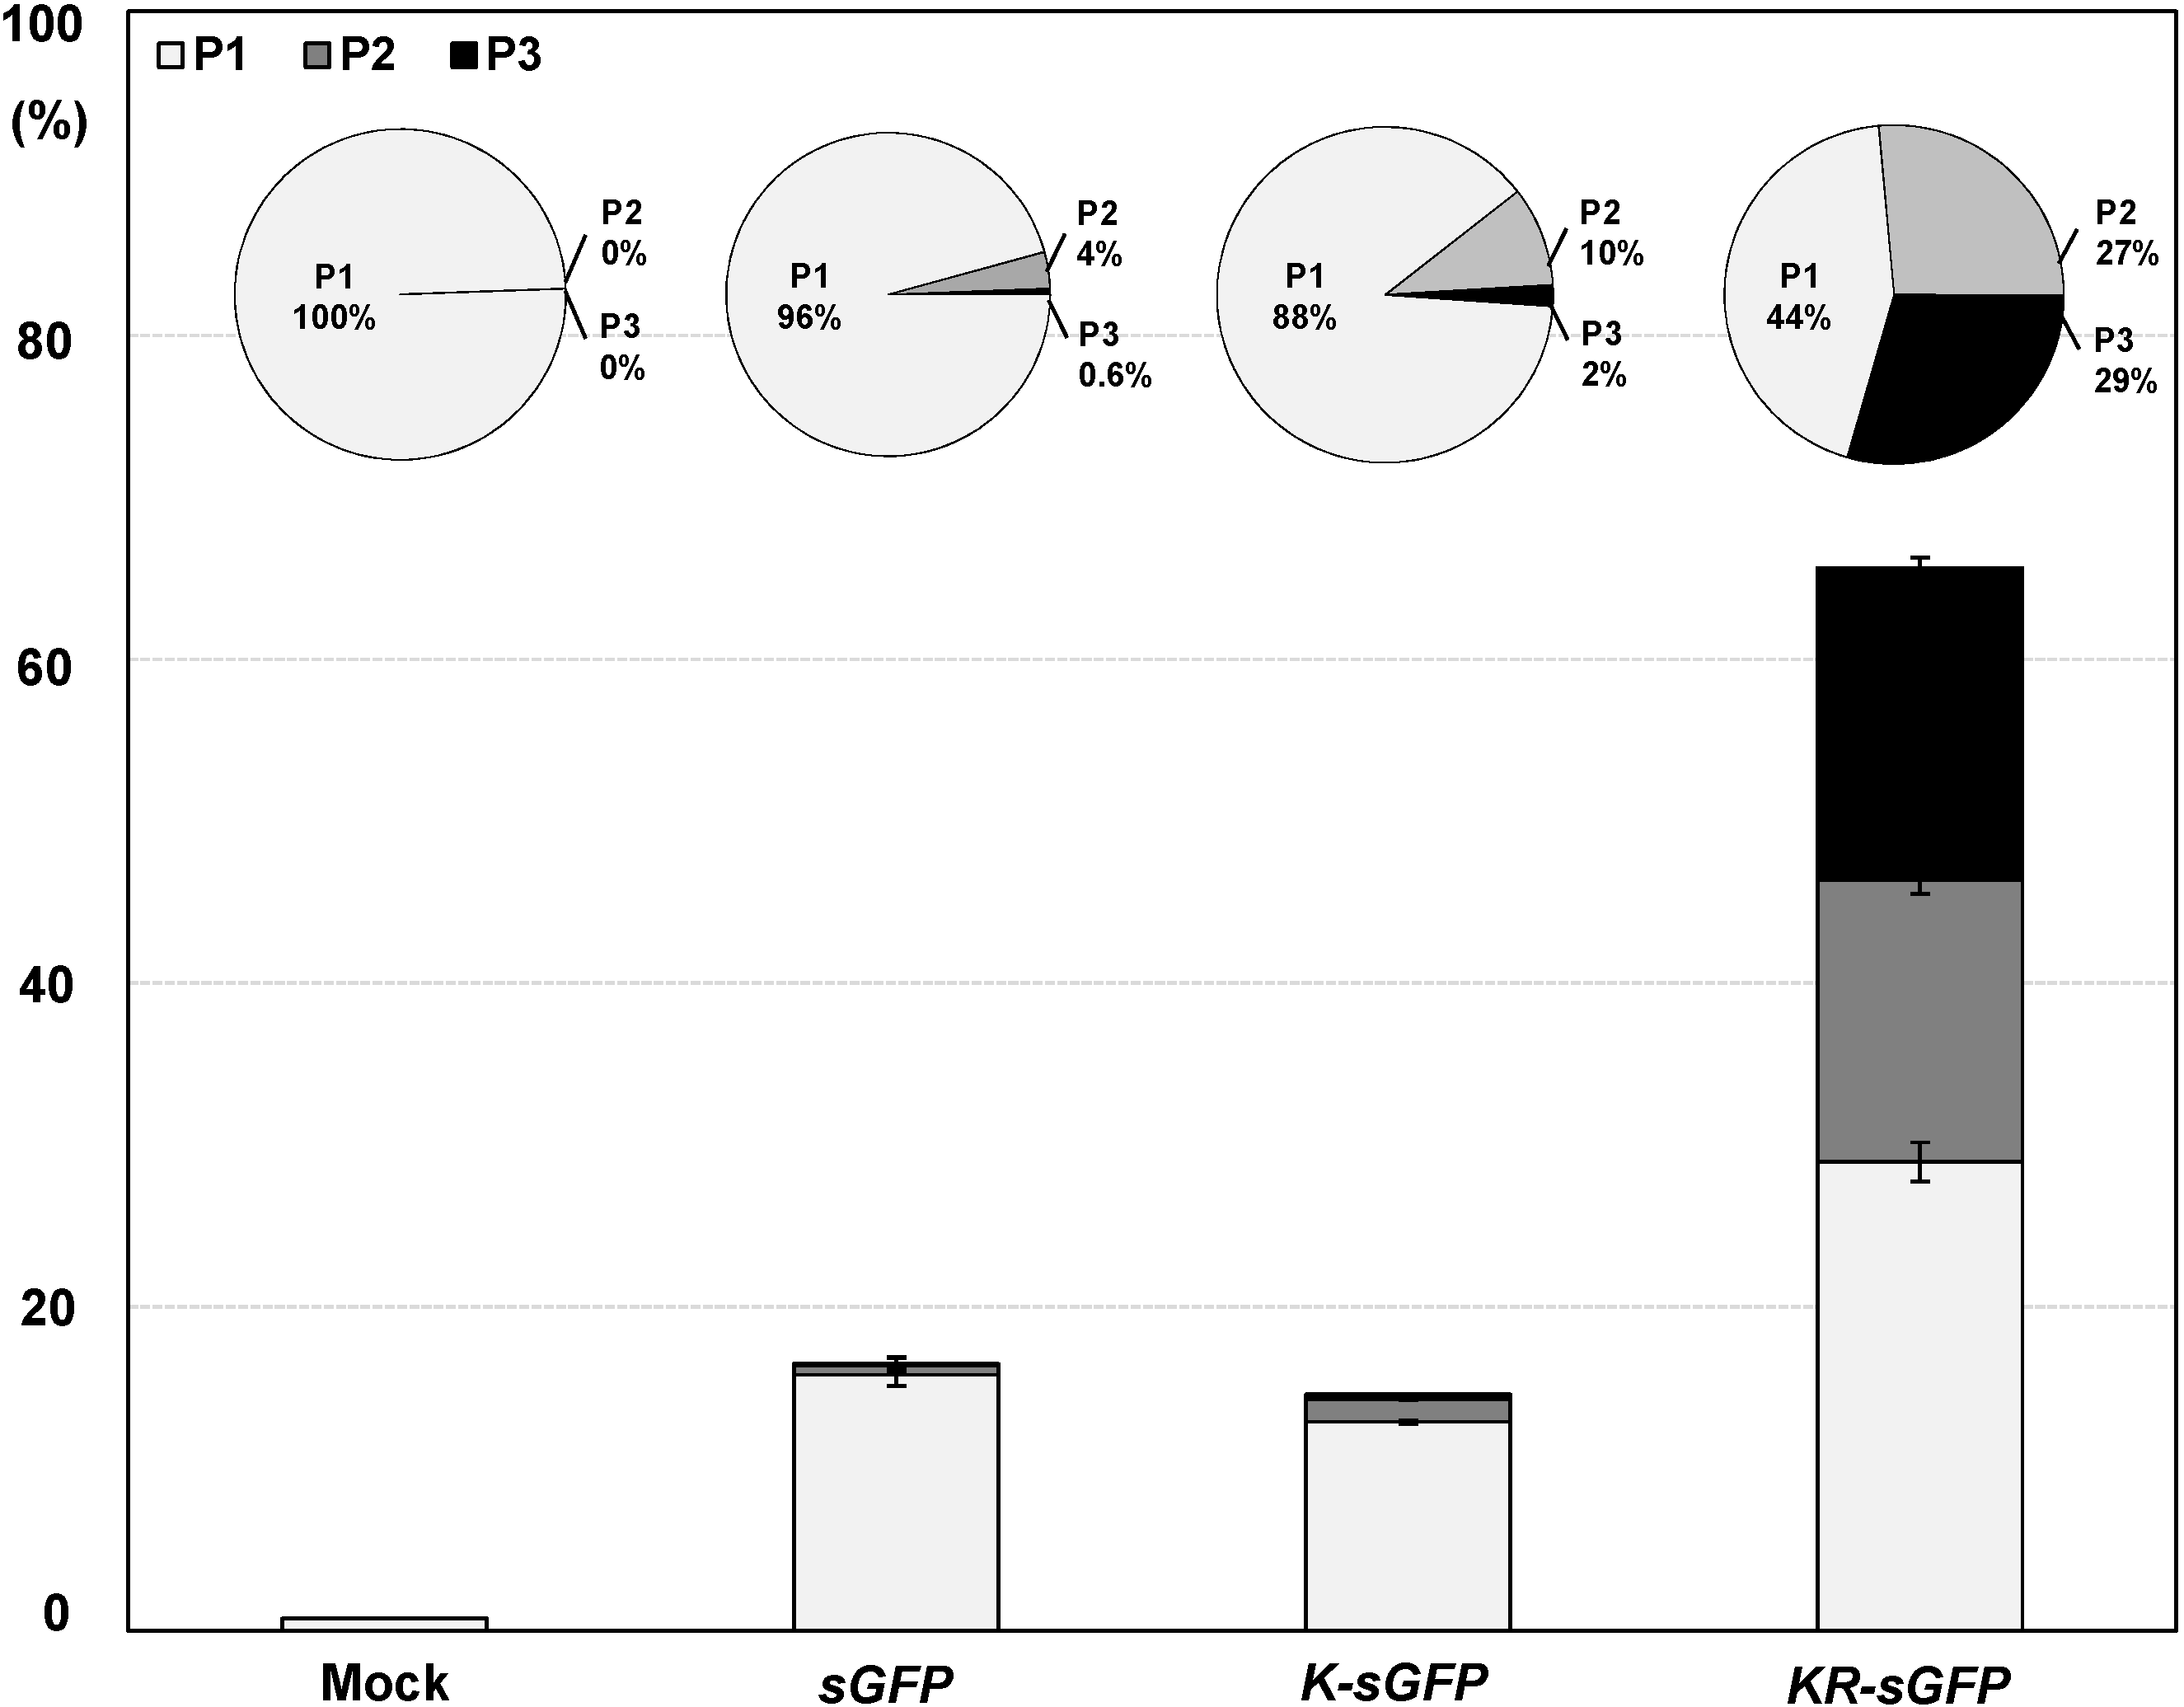
K-sGFP. These results show that the enhanced intensity of fluorescence (8-fold) by targeting into chloroplasts caused the reduction of the missing population and might be the main reason why the transfection ratios of FCA were different. Moreover, among the
K-sGFP-transfected protoplasts (14.7%), most (88.4%) were distributed in the first half of the P1 subpopulation (10
3–10
4) with the low fluorescence intensity; a mere 2% of them had >10
5 intensity (see
Figure 3). By contrast, the population of
KR-sGFP-transfected protoplasts (29.4% of total population) with a high fluorescence intensity (>10
5) was 65.7% of the transfected population (see
Figure 3).
Also, since our strategy of FCA using protoplasts is based on targeting fluorescent proteins into chloroplasts, the autofluorescence derived from chlorophylls of chloroplasts should be also considered. It has been reported that plant derived-autofluorescence causes some difficulties with some analytical processes of fluorescence-based techniques, and that chlorophylls of chloroplasts have been considered as one of the strongest autofluorescence contributors [
26]. However, several previous reports have shown that only if the commonly used fluorescence markers such as eGFP, YFP and mCherry is used for the fluorescence-based techniques, the autofluorescent background from chlorophylls could be almost spectrally filtered out, because the autofluorescence background of chlorophylls is bathochromically shifted with respect to the fluorescent signals of eGFP, YFP, and mCherry proteins [
27,
28,
29]. Since the fluorescent protein used in this study is a sGFP identical to commercially available eGFP (Clontech; TaKaRa Bio, Shiga, Japan), it could be supposed that the autofluorescence background of chlorophylls is not too much trouble with our strategy of chloroplast targeting-based FCA, because it can be almost filtered out, based on the bathochromic shift among them.
Taken together, our results show that the chloroplast targeting of sGFP caused an increase in the population with high fluorescence intensity (>10
4) to result in an increase in the average fluorescence intensity; the increase in the population with the fluorescence intensity above the threshold value increased the transfection ratio of FCA. Our strategy using chloroplast targeting is very useful to utilize the advantage of FCA or FACS using protoplasts of green tissues. Also, while a previous study reported DNA-usage in the range of 20–100 μg for transfection [
9], our results suggest that only 5–10 μg DNA was enough for FCA. This reduction of DNA-usage on FCA using protoplasts will also be useful for saving time and effort. Likewise, the usefulness of our strategy using rRTp-sGFP should further be investigated with regard to other non-green tissues, such as roots without chloroplasts.
4. Materials and Methods
4.1. Vector Constructs
The DNA fragments of both rRTp and sGFP were amplified from a pSB-RTG plasmid [
14]; the sGFP is identical to commercially available eGFP (Clontech, USA). The Kz sequence (AACAATGGC) identified for plants [
16,
17,
18] and the recombination sites (attB1 and attB2) for a gateway cloning system [
30] were introduced as a non-homologous overhang in the designed PCR primers, and the chimeric fragments of
sGFP,
K-sGFP and
KR-sGFP with attB1-B2 sites were prepared by an overlap extension-PCR [
31]. The PCR primers used in this study are listed in the
Table S1. All PCR reactions were performed using Phusion
® High-Fidelity DNA Polymerase (New England Biolabs, Ipswich, MA, USA).
The three chimeric gene fragments (
sGFP,
K-sGFP, and
KR-sGFP) were cloned into the pB2GW7 vector [
32] containing a 35S promoter for constitutive expression using a gateway cloning system. Gateway cloning procedures were performed using Gateway
® BP Clonase
® II Enzyme Mix and Gateway
® LR Clonase
® II Enzyme Mix following the manufacturer’s instructions (Invitrogen, Waltham, MA, USA).
4.2. Plant Materials
The dehulled seeds of rice (Oryza sativa L. Japonica cv. “Ilmi”) were sterilized by treatment once in 70% ethanol for 1 min and twice in 2% sodium hypochlorite for 20 min and then planted on Murashige and Skoog (MS) agar medium after washing five times with distilled water. The rice seedlings were grown in the dark for 10 days, and then illuminated with white light for 20 h prior to protoplast isolation.
The restricted exposure of the plants to light (20 h) was used to reduce the autofluorescence background resulting from the presence of chlorophyll. The formation of RuBisCo and the biosynthesis of chlorophyll in rice leaves have been reported to be the greatest during greening of etiolated leaf tissues [
33,
34]. During this process, photosynthesis-related proteins are detected within 2 h of illumination with white light [
35], the stromal structures of chloroplast are evident following illumination for 16 h [
36], and chlorophyll formation begins subsequently [
33,
36]. In several preliminary experiments, we established that the optimum illumination time was 16–20 h, which resulted in chlorophyll formation but not to a level where autofluorescence was evident in the images using a fluorescein isothiocyanate (FITC) filter (data not shown). Consequently, 20 h of illumination was used for the FCA analysis of protoplasts in this study.
4.3. Protoplast Isolation and Transfection
With minor modifications, protoplasts were isolated as described by Bart [
37]. Strips (0.5 mm) were cut with new razor blades from 0.5 g leaf and stem tissue sections and then immediately immersed in 15 mL of enzyme solution (Cellulase R-10 and Macerozyme R-10; Yakult Honsha, Japan) for the digestion of the cell walls. The plate was put into a vacuum desiccator and the vacuum infiltration for 10 min was applied to increase digestion efficiency. Following the incubation with gentle shaking of 50 rpm at RT in the dark for 4 h, the enzyme reaction was stopped by the addition of 15 mL W5 solution [
37]. Cell debris were filtered twice through 70 μm and 40 μm BD Falcon™ cell strainers (BD, Franklin Lakes, NJ, USA); furthermore, the protoplasts were pelleted and suspended in Mmg buffer solution [
37] at 10
7 protoplasts·mL
−1 for PEG-transfection. The number of protoplasts was analyzed using a Marienfeld hemocytometer counting system (Marienfeld-Superior, Berlin, Germany). For transfection, an equal volume of 40% PEG-3350 (Sigma, St. Louis, MO, USA) solution [
37] in 0.6 M mannitol and 100 mM CaCl
2 was added to 110 µL of the protoplasts (around 10
6 cells) and DNA solution; the mixture was incubated for 15 min. The protoplasts were washed twice with each of the two volumes of W5 and 1 mL of incubation solution and were finally resuspended in 1 mL of incubation solution and incubated at 28 °C in the dark overnight. All plasticware used for protoplasts was coated with 5% calf serum by swirling for 10 s and all buffers were filtered using 0.45 µm syringe filter (Sartorius, Gottingen, Germany).
4.4. Microscopy
For the analysis of the subcellular localization, a 5 μg aliquot of each plasmid DNA was transfected into rice protoplasts using PEG-mediated transfection and GFP signals from transfected protoplasts were observed using a Carl Zeiss LSM700 inverted confocal microscope and the image acquisition software ZEN 2009 Light Edition (Carl Zeiss, Oberkochen, Germany). A sGFP fluorescence was detected with 488 nm excitation and 505–530 nm emission wavelengths; the chlorophyll fluorescence was analyzed with 555 nm excitation and >650 nm emission. The fluorescence intensities of images were analyzed using a Histogram tool of the image acquisition software ZEN 2009 Light Edition (Carl Zeiss) following the manufacturer’s instructions. The mean intensities of images were normalized using a
sGFP construct, and the ratios of the mean intensity were introduced using scale bars in
Figure 1B and
Figure 2C.
4.5. Analysis of sGFP Expression in Protoplasts
For the expression analysis, protoplasts (approximately 1 × 10⁶) were centrifuged, the supernatant was removed, and the pellet was immediately frozen in LN2 and stored at −80 °C until RNA and protein extraction.
Total RNA was extracted from rice protoplasts using the RNeasy® Plant mini kit (Qiagen, Hilden, Germany) and the 1st strand cDNA was synthesized using a mRNA selective PCR kit (AMV) ver. 1.1 (Takara, Shiga, Japan) according to the manufacturer’s instructions. Quantitative real-time PCR was performed using a Thunderbird™ SYBR® qPCR mix (Toyobo, Osaka, Japan); the SYBR-fluorescence signals were detected and quantified using a CFX96™ Real-Time PCR system (Bio-Rad, Foster City, CA, USA). The quantified SYBR-fluorescence of sGFP transcript was analyzed using CFX Manager™ ver. 2.1 (Bio-Rad). A rice ubiquitin gene (AK061988) was used as a reference gene to normalize the expression data for each sGFP transcript.
The protoplast pellet was suspended in 160 μL of phosphate buffered saline (PBS) (Caisson Laboratories, North Logan, UT, USA) and 40 μL of 5× SDS-PAGE loading buffer (Biosesang, Seongnam, Korea) and heated in boiling water for 10 min. The boiled protoplasts were centrifuged at 4 °C; 5 μL of the supernatant was loaded to each of two 12% acrylamide gels for SDS-PAGE. Following the migration, the proteins in one gel were stained with EZ-Silver Staining Kit for Protein (Biosesang) to visualize the loaded amount and quality, while the proteins in the other gel were transferred to PVDF membrane (Whatman, Kent, UK) using Trans-Blot® SD Semi-Dry Electrophoretic Transfer Cell (Bio-Rad). The sGFP chimeric proteins were blotted using rabbit polyclonal antibody of GFP (Abcam, Cambridge, UK) at 1:5000 dilution and secondary anti-rabbit alkaline phosphatase conjugate (Promega, Madison, WI, USA) at 1:5000 dilution. The blots were incubated with Novex® AP Chemiluminescent Substrate (CDP-Star®) (Invitrogen). The developed bands were imaged using a LAS-4000 luminescence detector; the intensity of the bands was quantified using the LAS 4000 software (Fujifilm, Tokyo, Japan).
4.6. Flow Cytometric Analysis
The expression of sGFP was monitored at 24 h following transfection using a FACS Aria II flow cytometry system (BD). Protoplasts were pelleted and resuspended in an appropriate volume of PBS buffer and immediately subjected to flow cytometry. Flow cytometry analysis was performed as described by Hagenbeek and Rock [
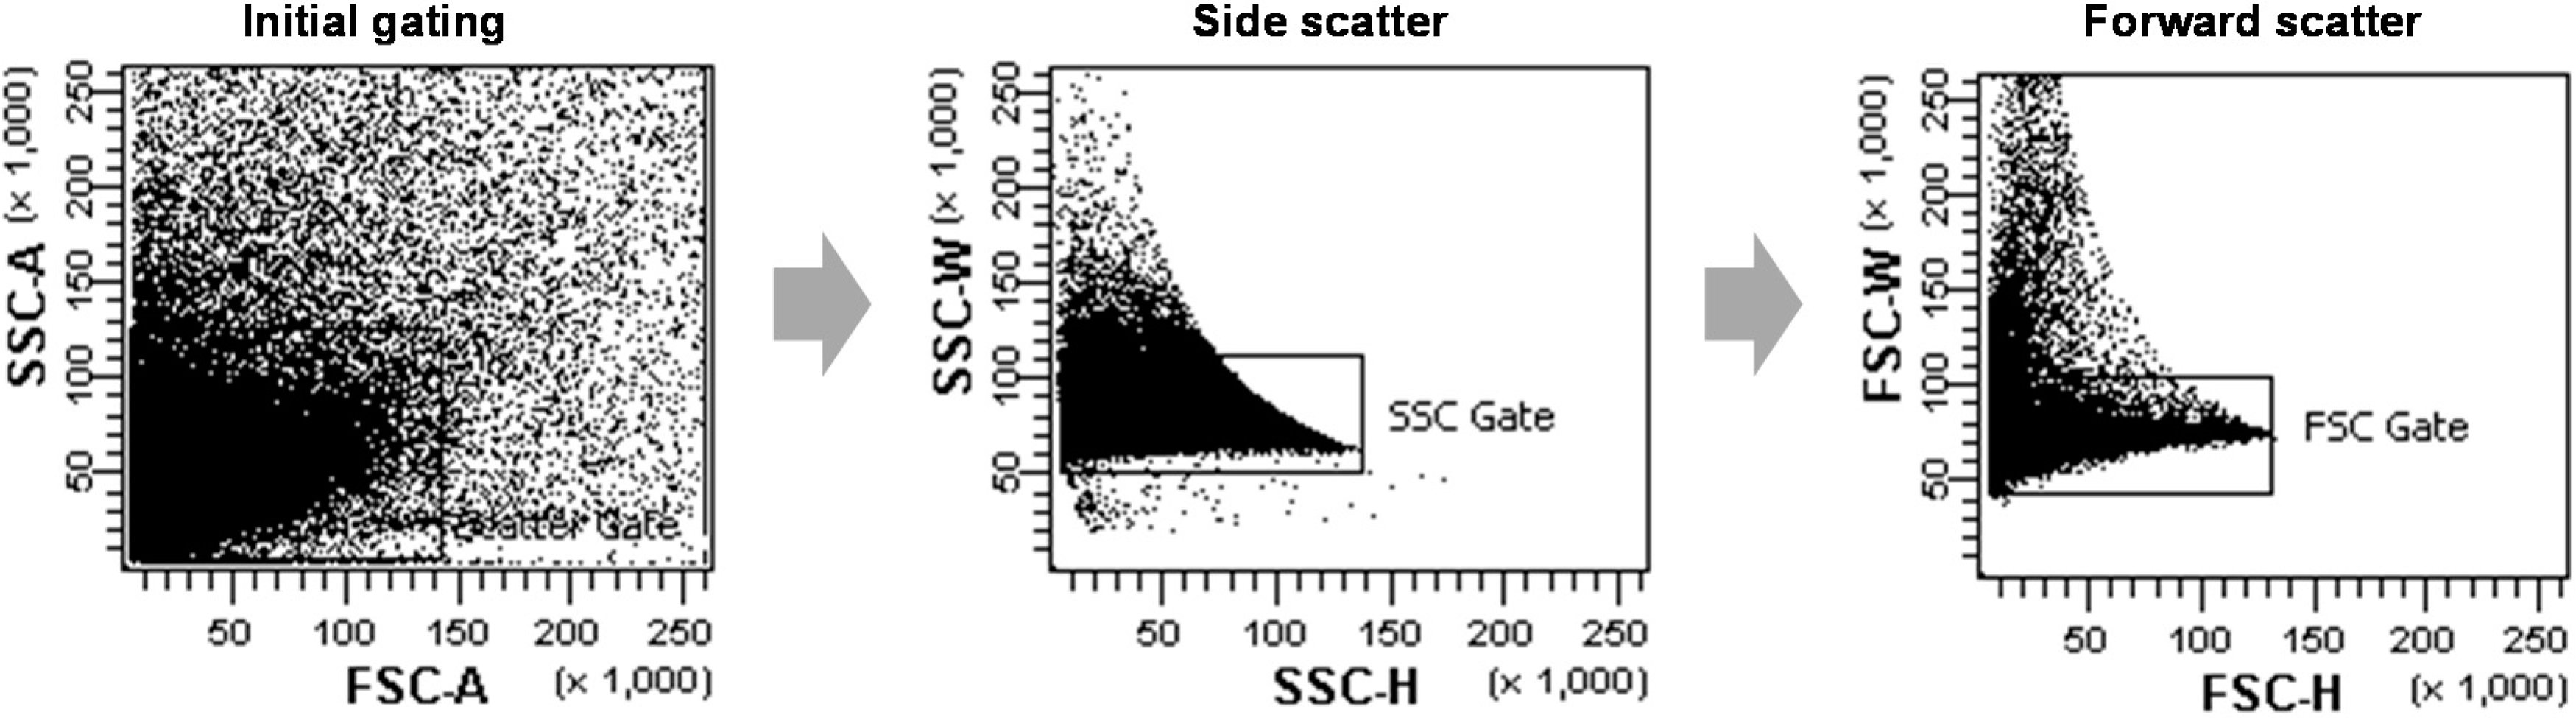
9]. The cell density and sample injection speed was adjusted to the particular experiment for the best possible yield or fastest achievable speed. Live protoplasts were gated using the forward and side scattering fields for data acquisition; irregular shaped protoplasts were regarded as dead or aggregated and were gated out during the data collection. As shown in
Figure 6, non-single cells, such as cell-multiplets or cell debris, were excluded through a large initial gating of a side scattering
vs. a forward scattering (FSC)-A, and two more gating steps of a SSC-height
vs. -width and a FSC-height
vs. -width were used more strictly to exclude non-single cells from the next analysis. The green fluorescence of sGFP was excited by a 488 nm laser and detected using the FITC-A channel. For each analysis, the sGFP fluorescence signals of 10
5 events in the gated population were collected and detected using the FITC-A channel and analyzed using FACS Diva software 6.0 (BD). Control protoplasts were prepared through PEG transfection with no plasmid as a negative control. The fluorescence intensities of the control samples (10
0–10
3), derived from chlorophyll in the chloroplasts, provided the autofluorescence background value for FCA of other protoplasts expressing sGFP proteins.
Figure 6.
The scatter plots of representative data from FCA of rice protoplasts. The protoplast populations were initially gated through a forward scatter (FSC) area versus a side scatter (SSC) area to exclude non-single cells such as cell-multiplets or cell debris. Afterwards, further gates were performed using a SSC-height vs. SSC-width dot plot and a FSC-height vs. FSC-width to more strictly select single protoplast cells.


