Computational Study on Substrate Specificity of a Novel Cysteine Protease 1 Precursor from Zea mays

Abstract
:
1. Introduction
2. Results and Discussion
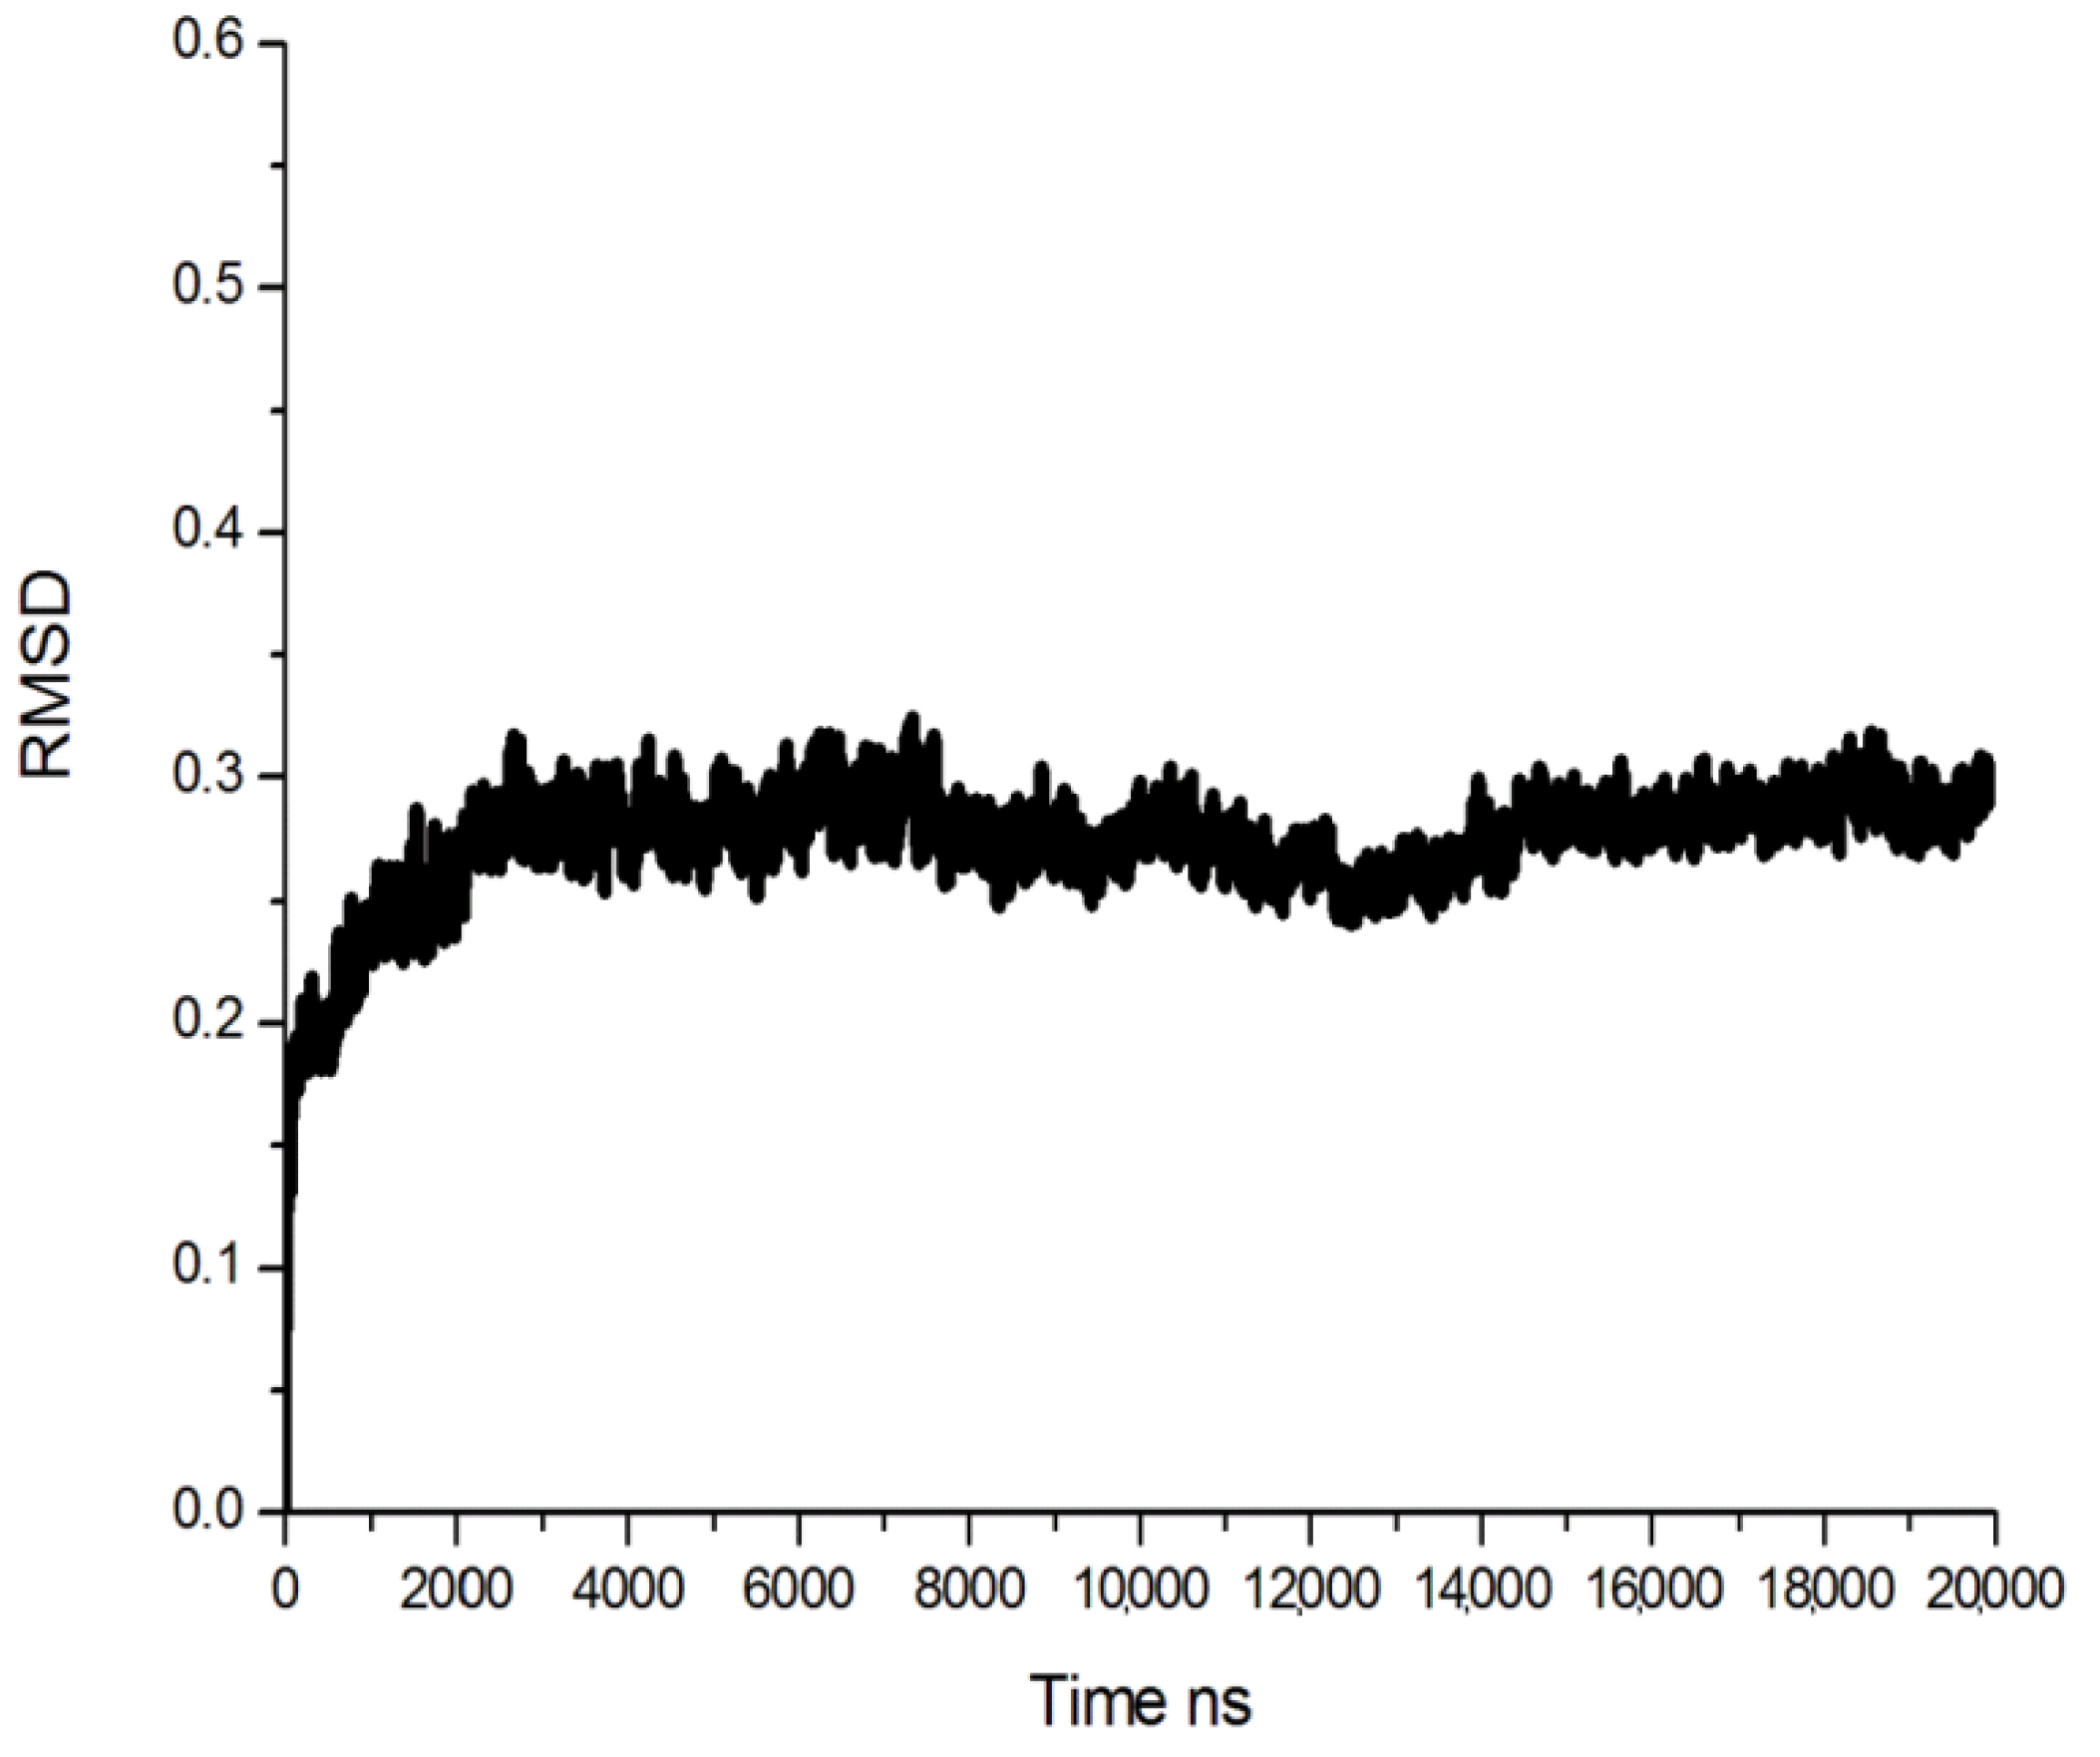
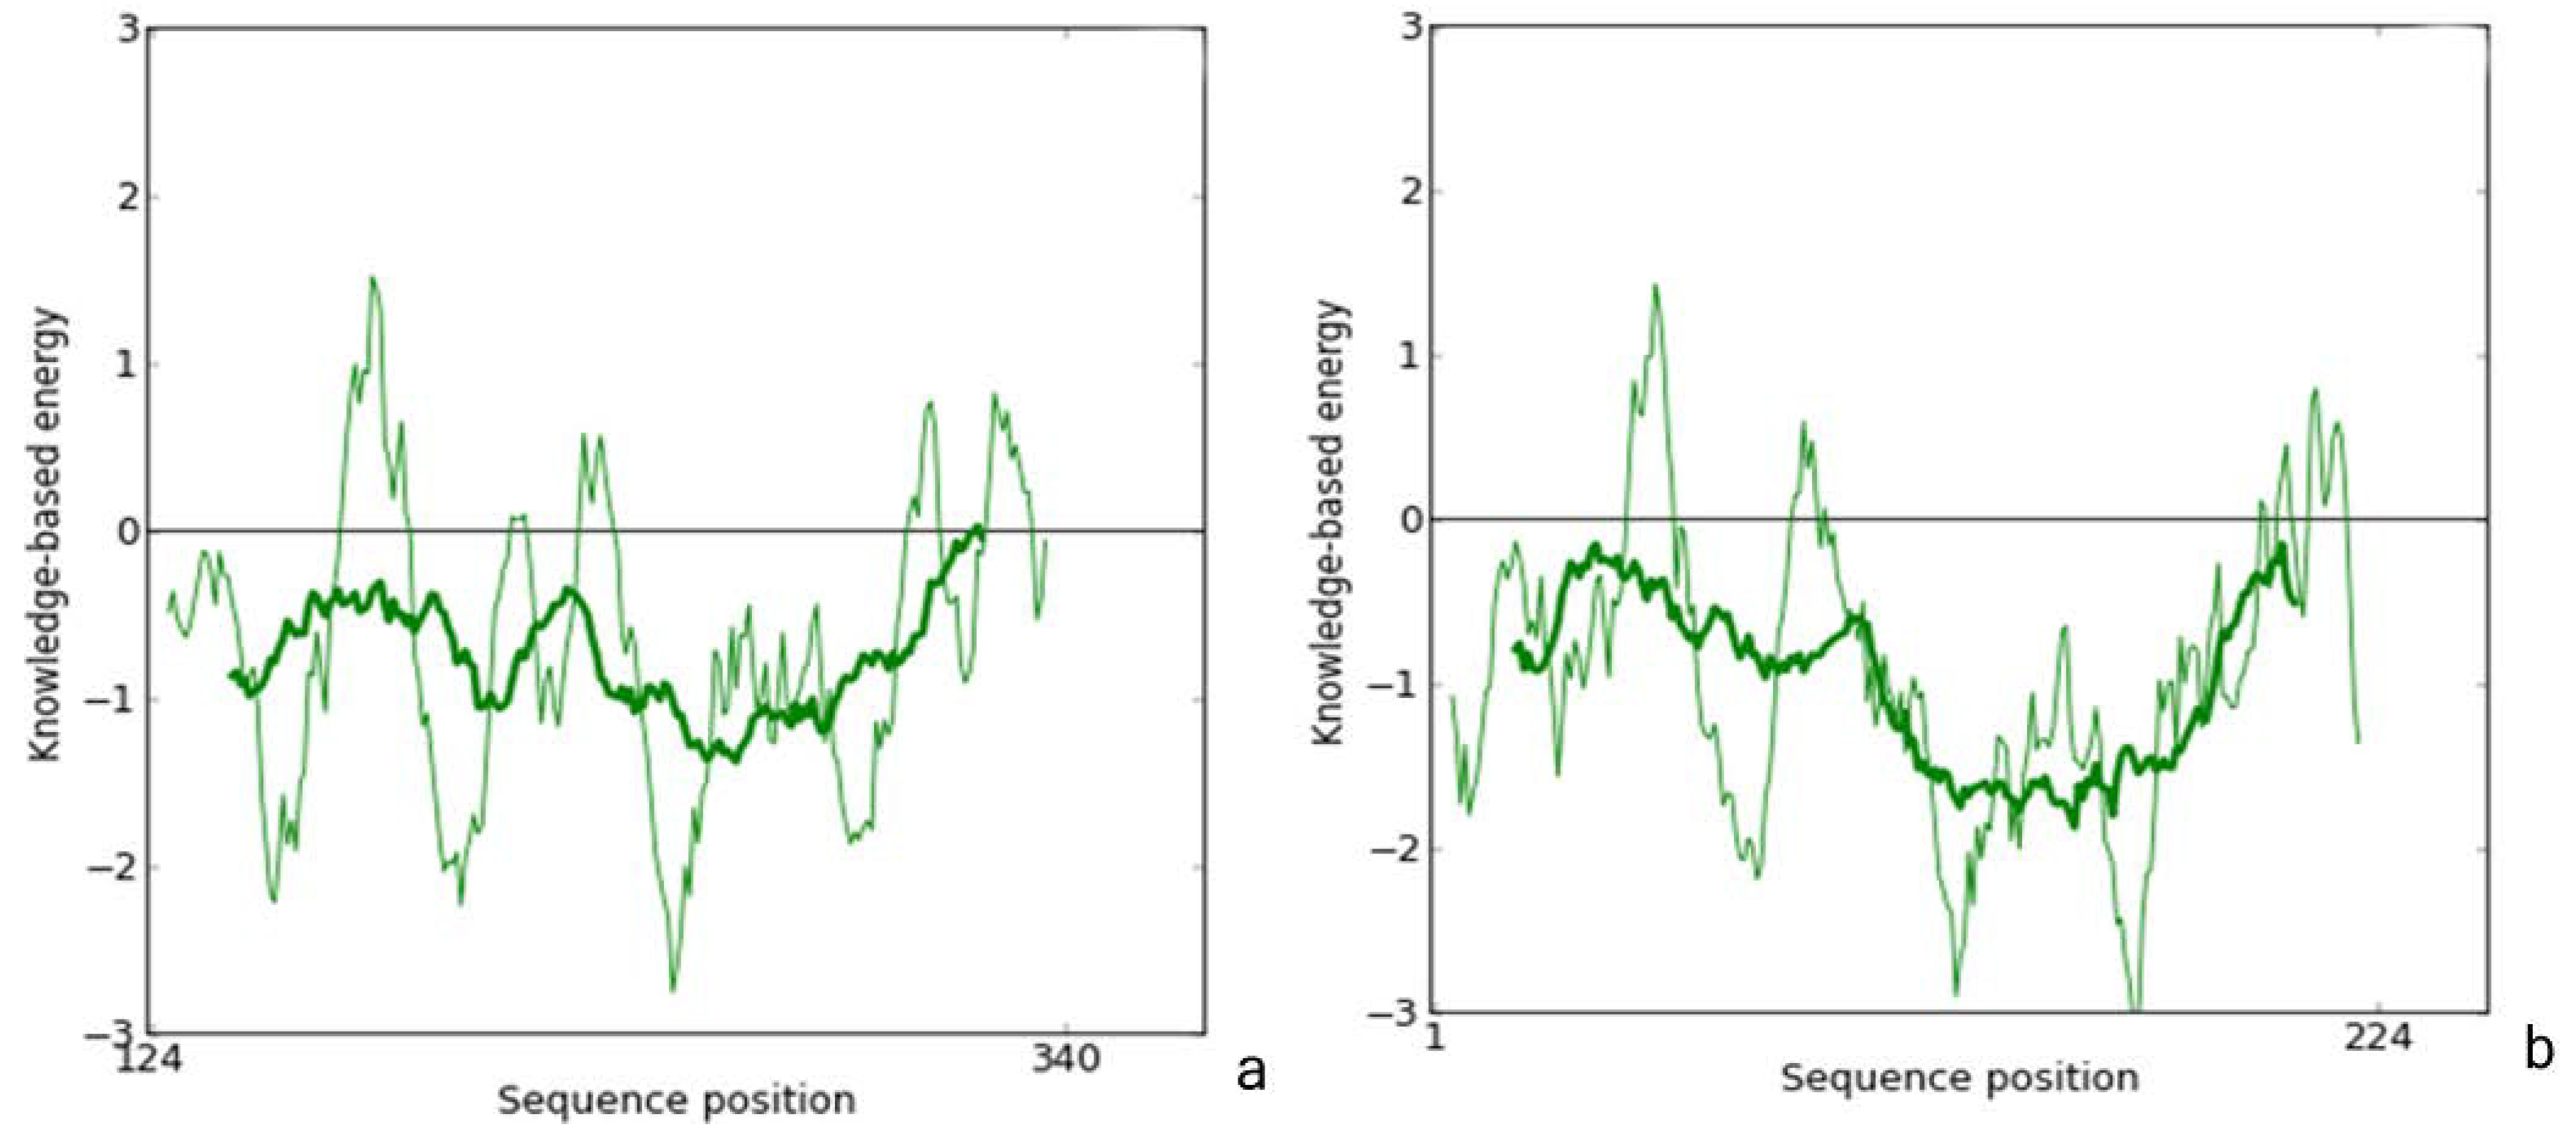
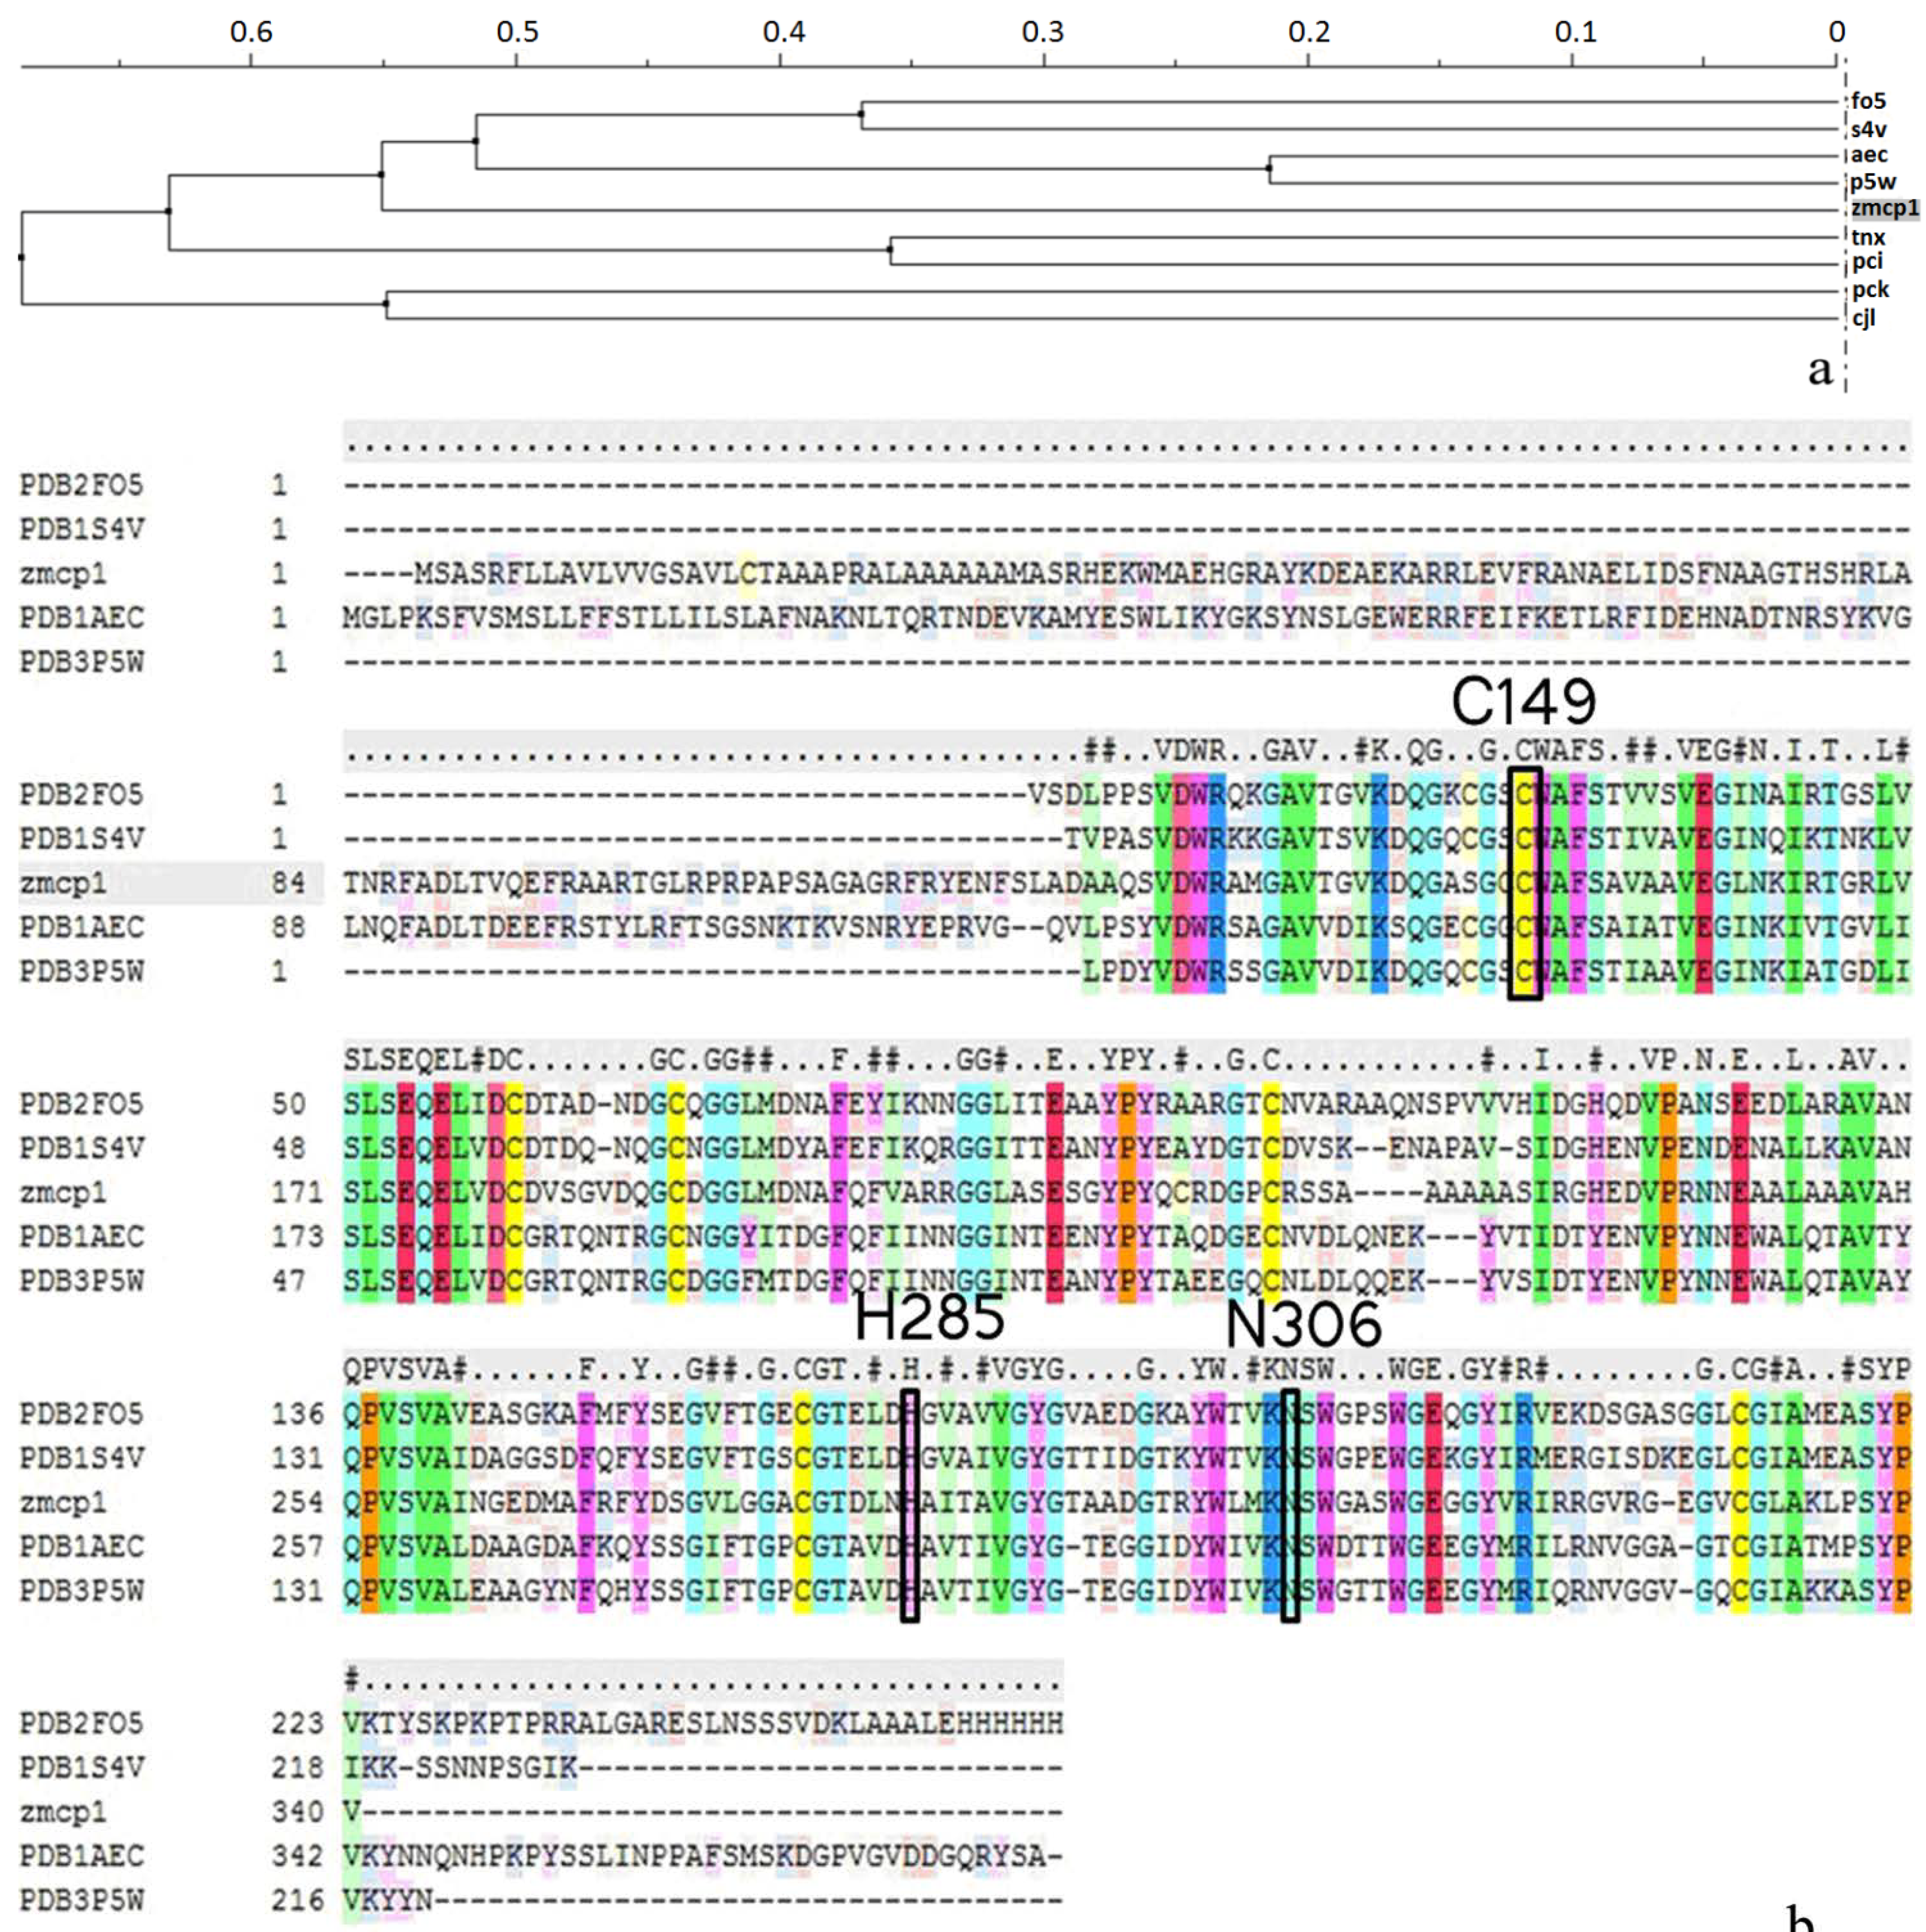
2.1. Homology Modeling

| Template (PDB ID) | Sequence Identity | Resolution | Organism | Query Coverage | QMEAN Z-Score a | Procheck b | Errat c |
|---|---|---|---|---|---|---|---|
| 1S4V A | 59% | 2.00 | Ricinus communis | 0.64 | −1.26 | 83.1% core 15.7% allow 0.6% gener 0.6% disall | 85.2 |
| 2FO5 A | 56% | 2.20 | Hordeum vulgare | 0.64 | −2.01 | 83.1% core 15.7% allow 0.6% gener 6.0% disall | 82.0 |
| 3P5W A | 55% | 1.90 | Actinidia arguta | 0.63 | −1.82 | 82.6% core 15.7% allow 0.6% gener 1.1% disall | 82.5 |
| 1AEC A | 53% | 1.86 | Actinidia chinensis | 0.63 | −2.38 | 83.6% core 15.3% allow 0.0% gener 1.1% disall | 82.8 |
| 1CJL A | 44% | 2.20 | Homo sapiens | 0.79 | −4.32 | 85.1% core 13.2% allow 0.4% gener 1.3% disall | 68.6 |
| 1PCI A | 43% | 3.20 | Carica papaya | 0.90 | −5.55 | 79.3% core 18.8% allow 1.5% gener 0.4% disall | 72.6 |
| 3TNX A | 42% | 2.62 | Carica papaya | 0.88 | −5.17 | 81.5% core 16.2% allow 1.5% gener 0.8% disall | 70.8 |
| 7PCK B | 40% | 3.20 | Homo sapiens | 0.89 | −4.91 | 78.8% core 17.8% allow 1.5% gener 1.9% disall | 63.0 |

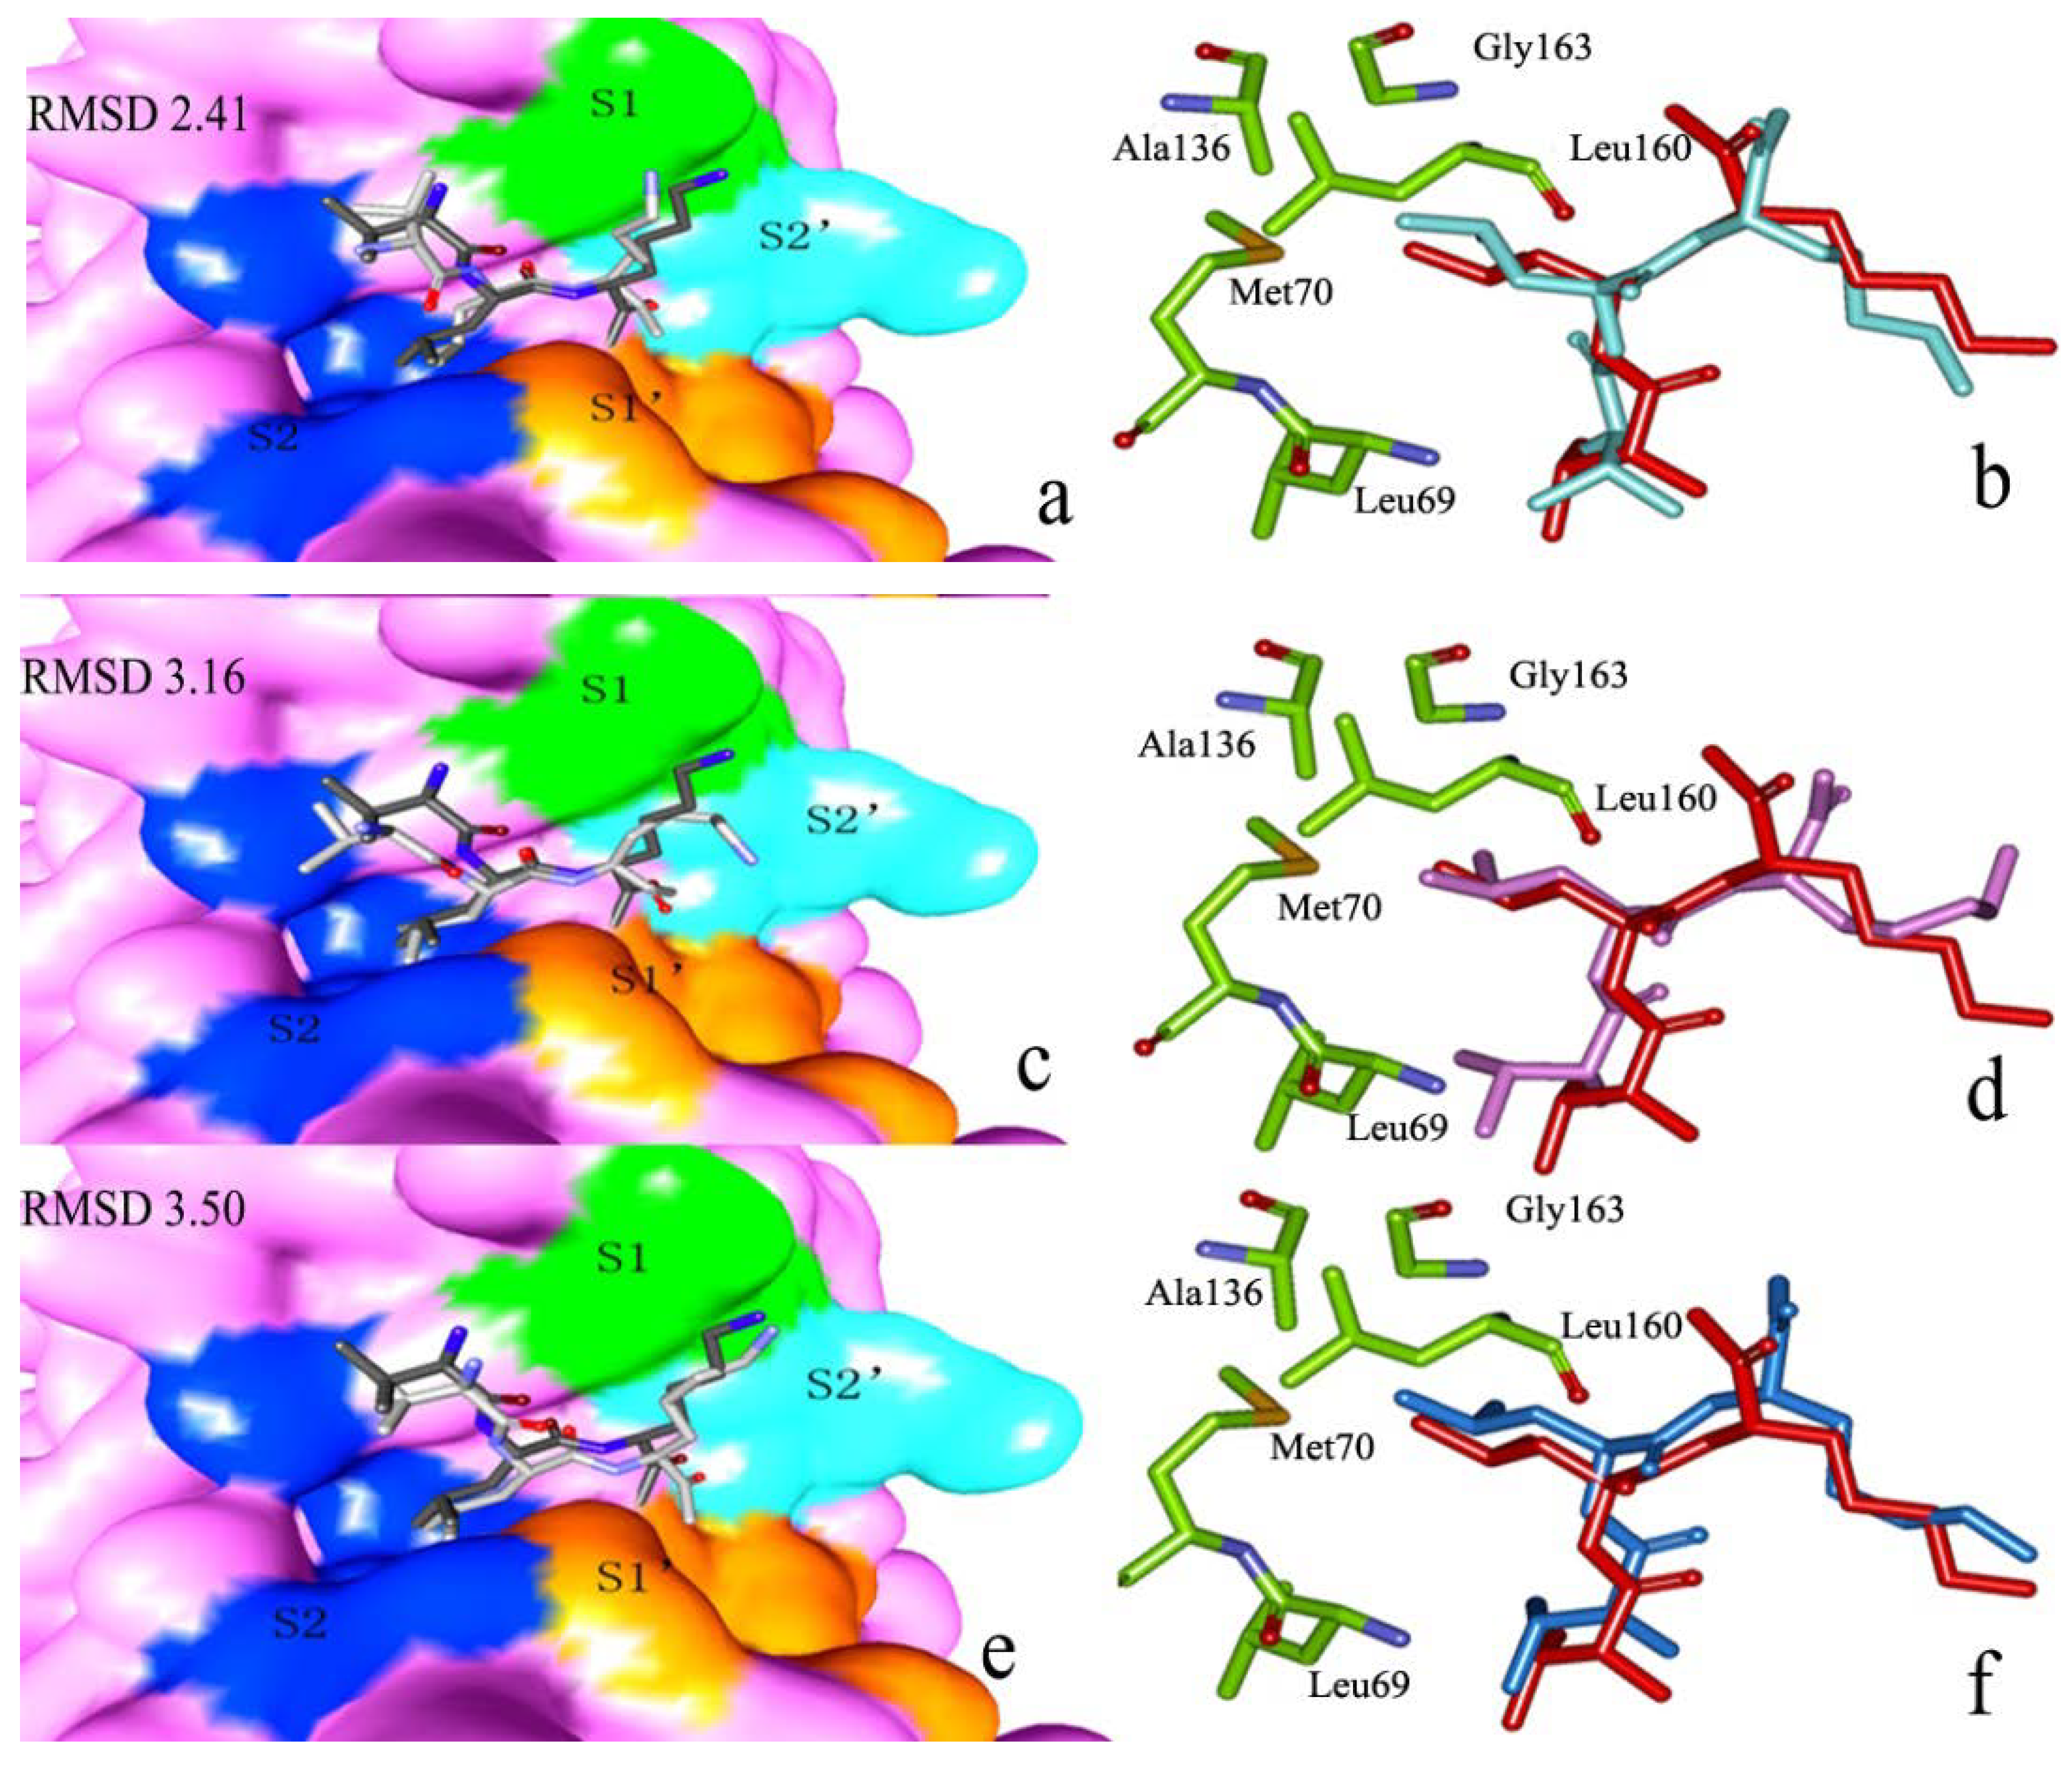
2.2. Docking Study
2.2.1. Docking Validation

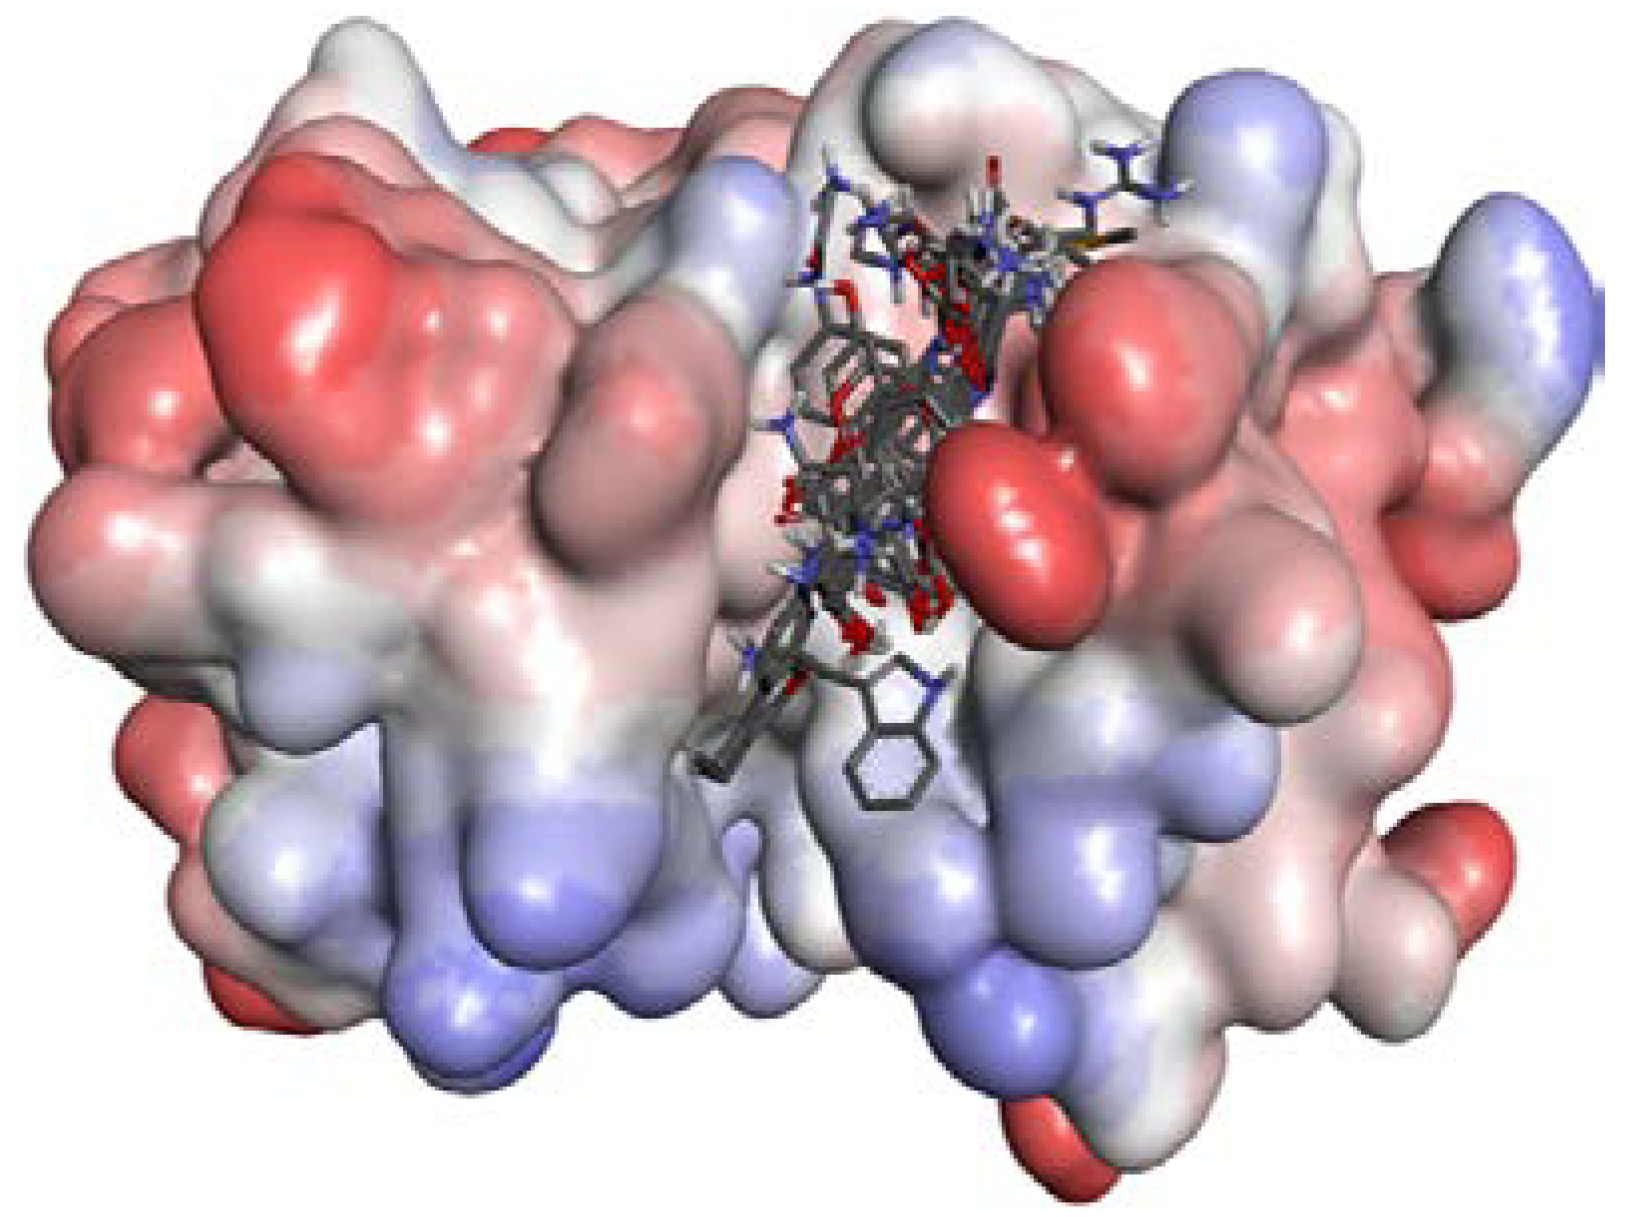
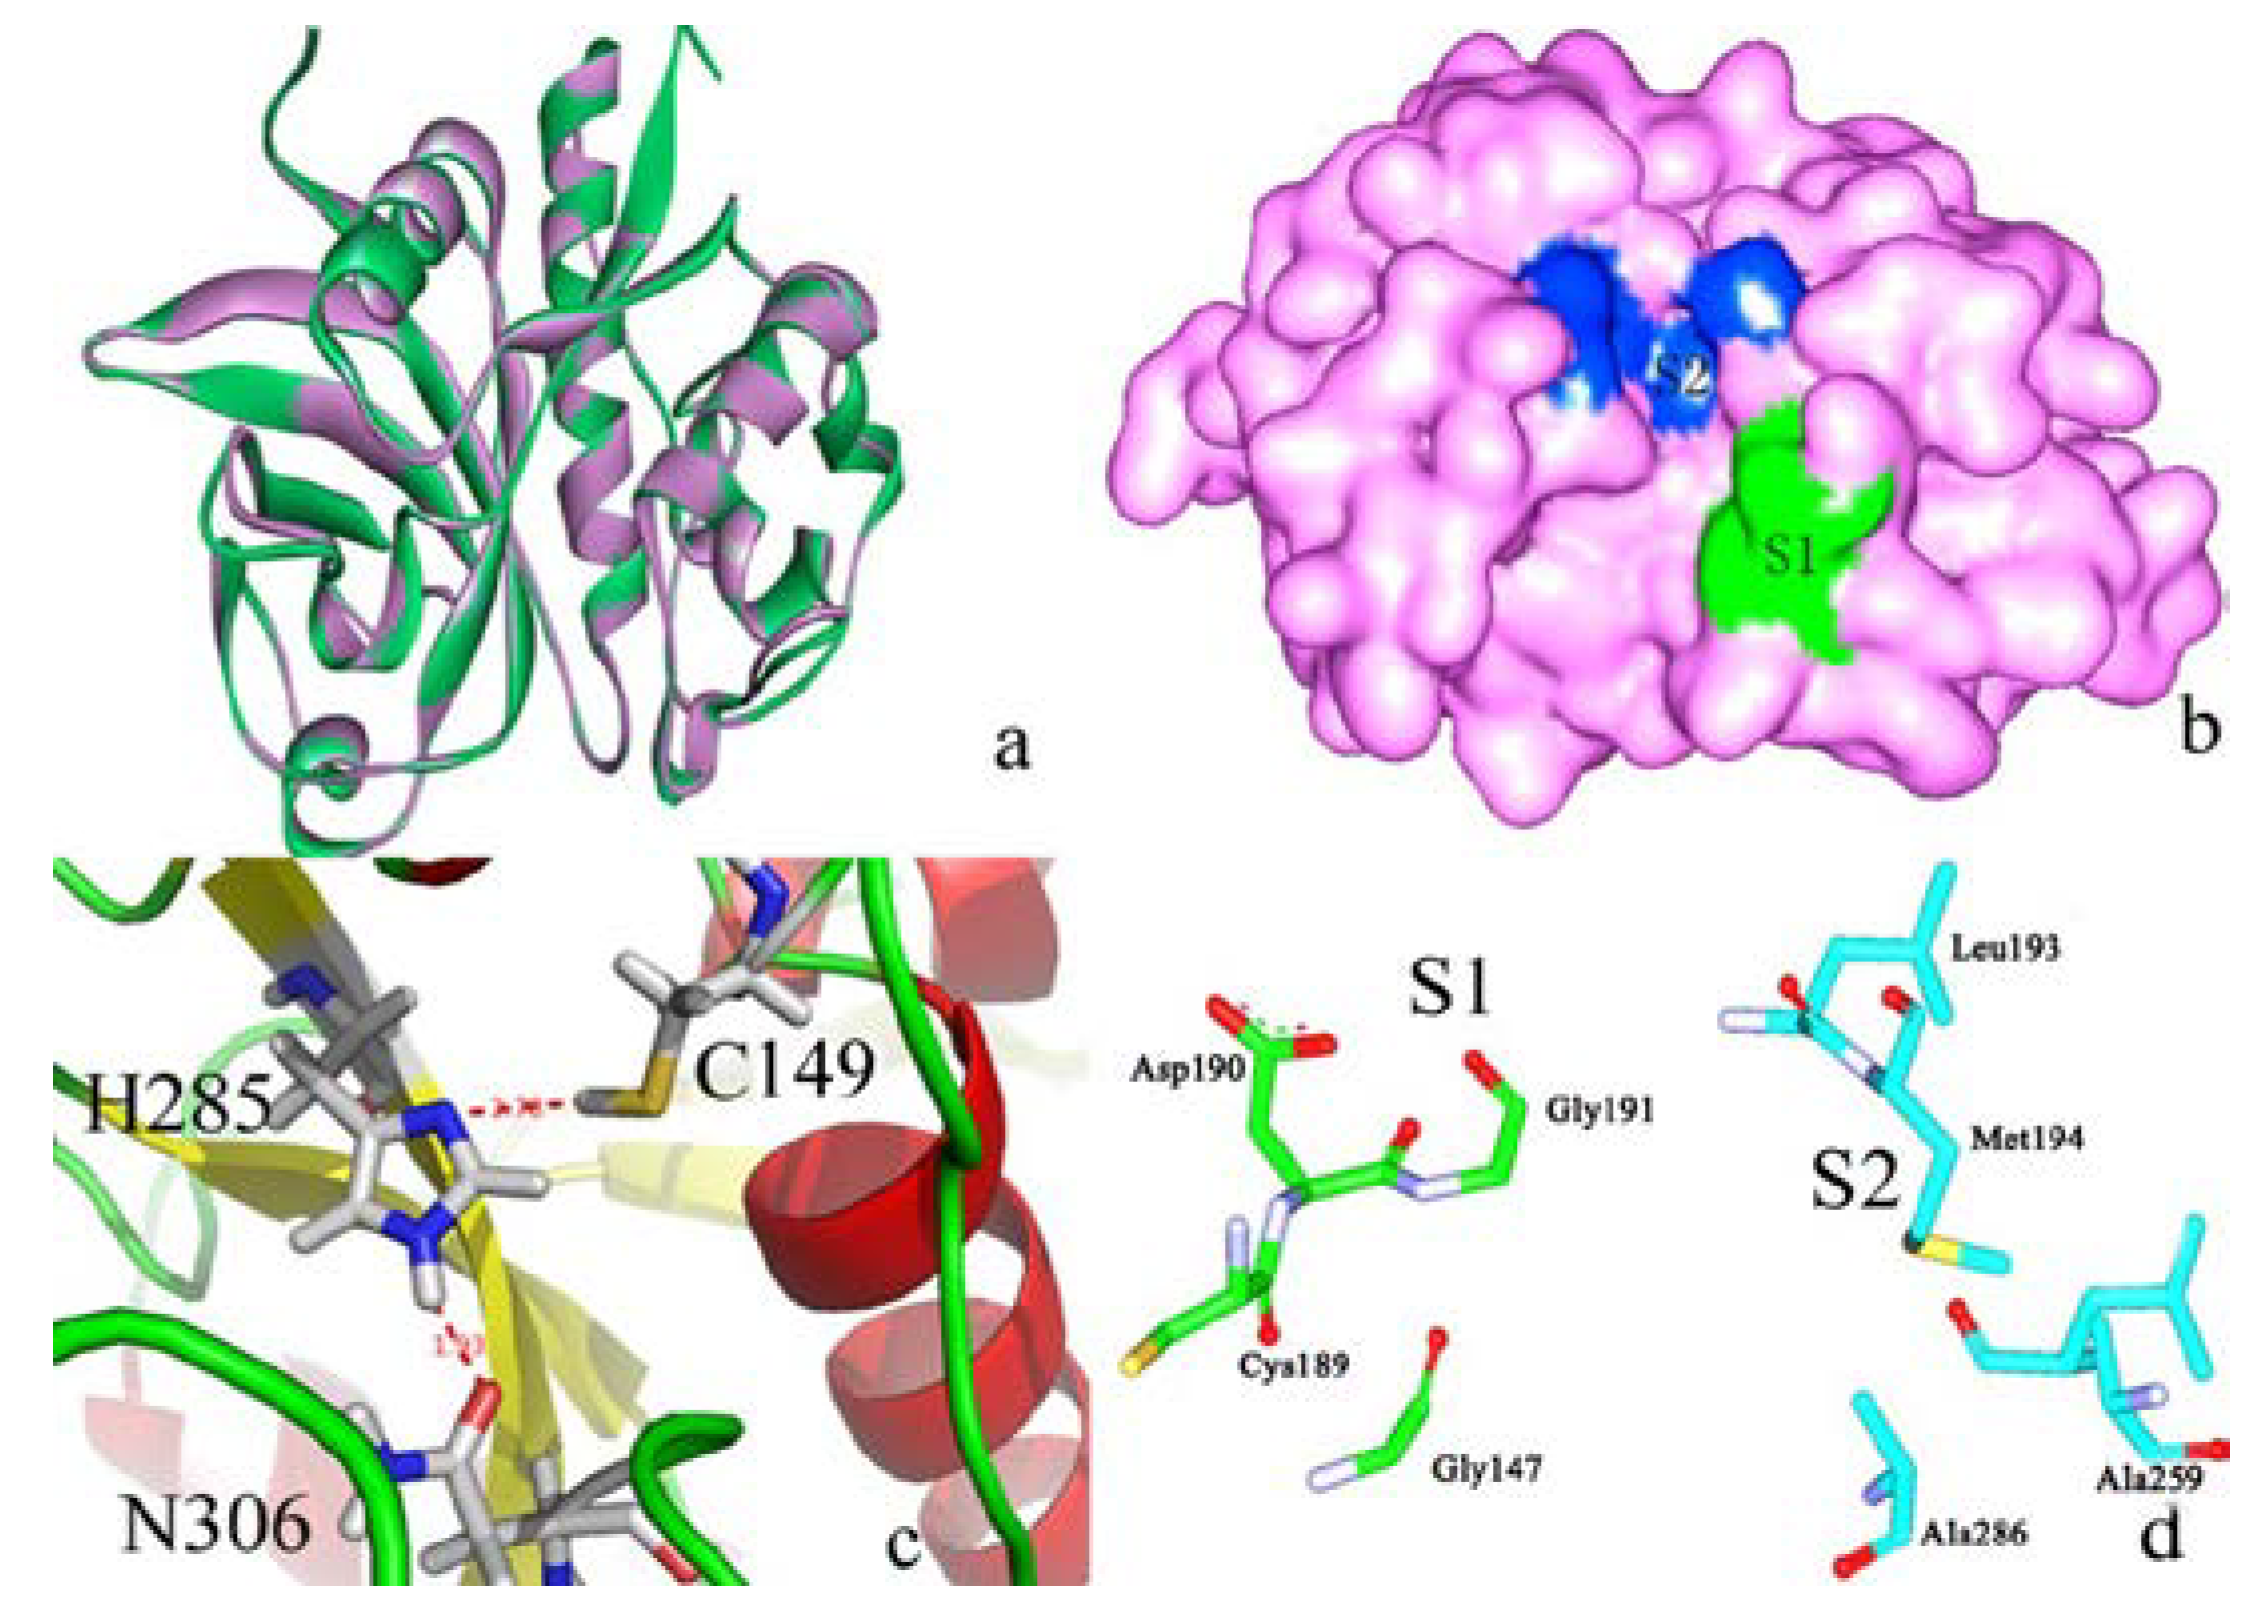
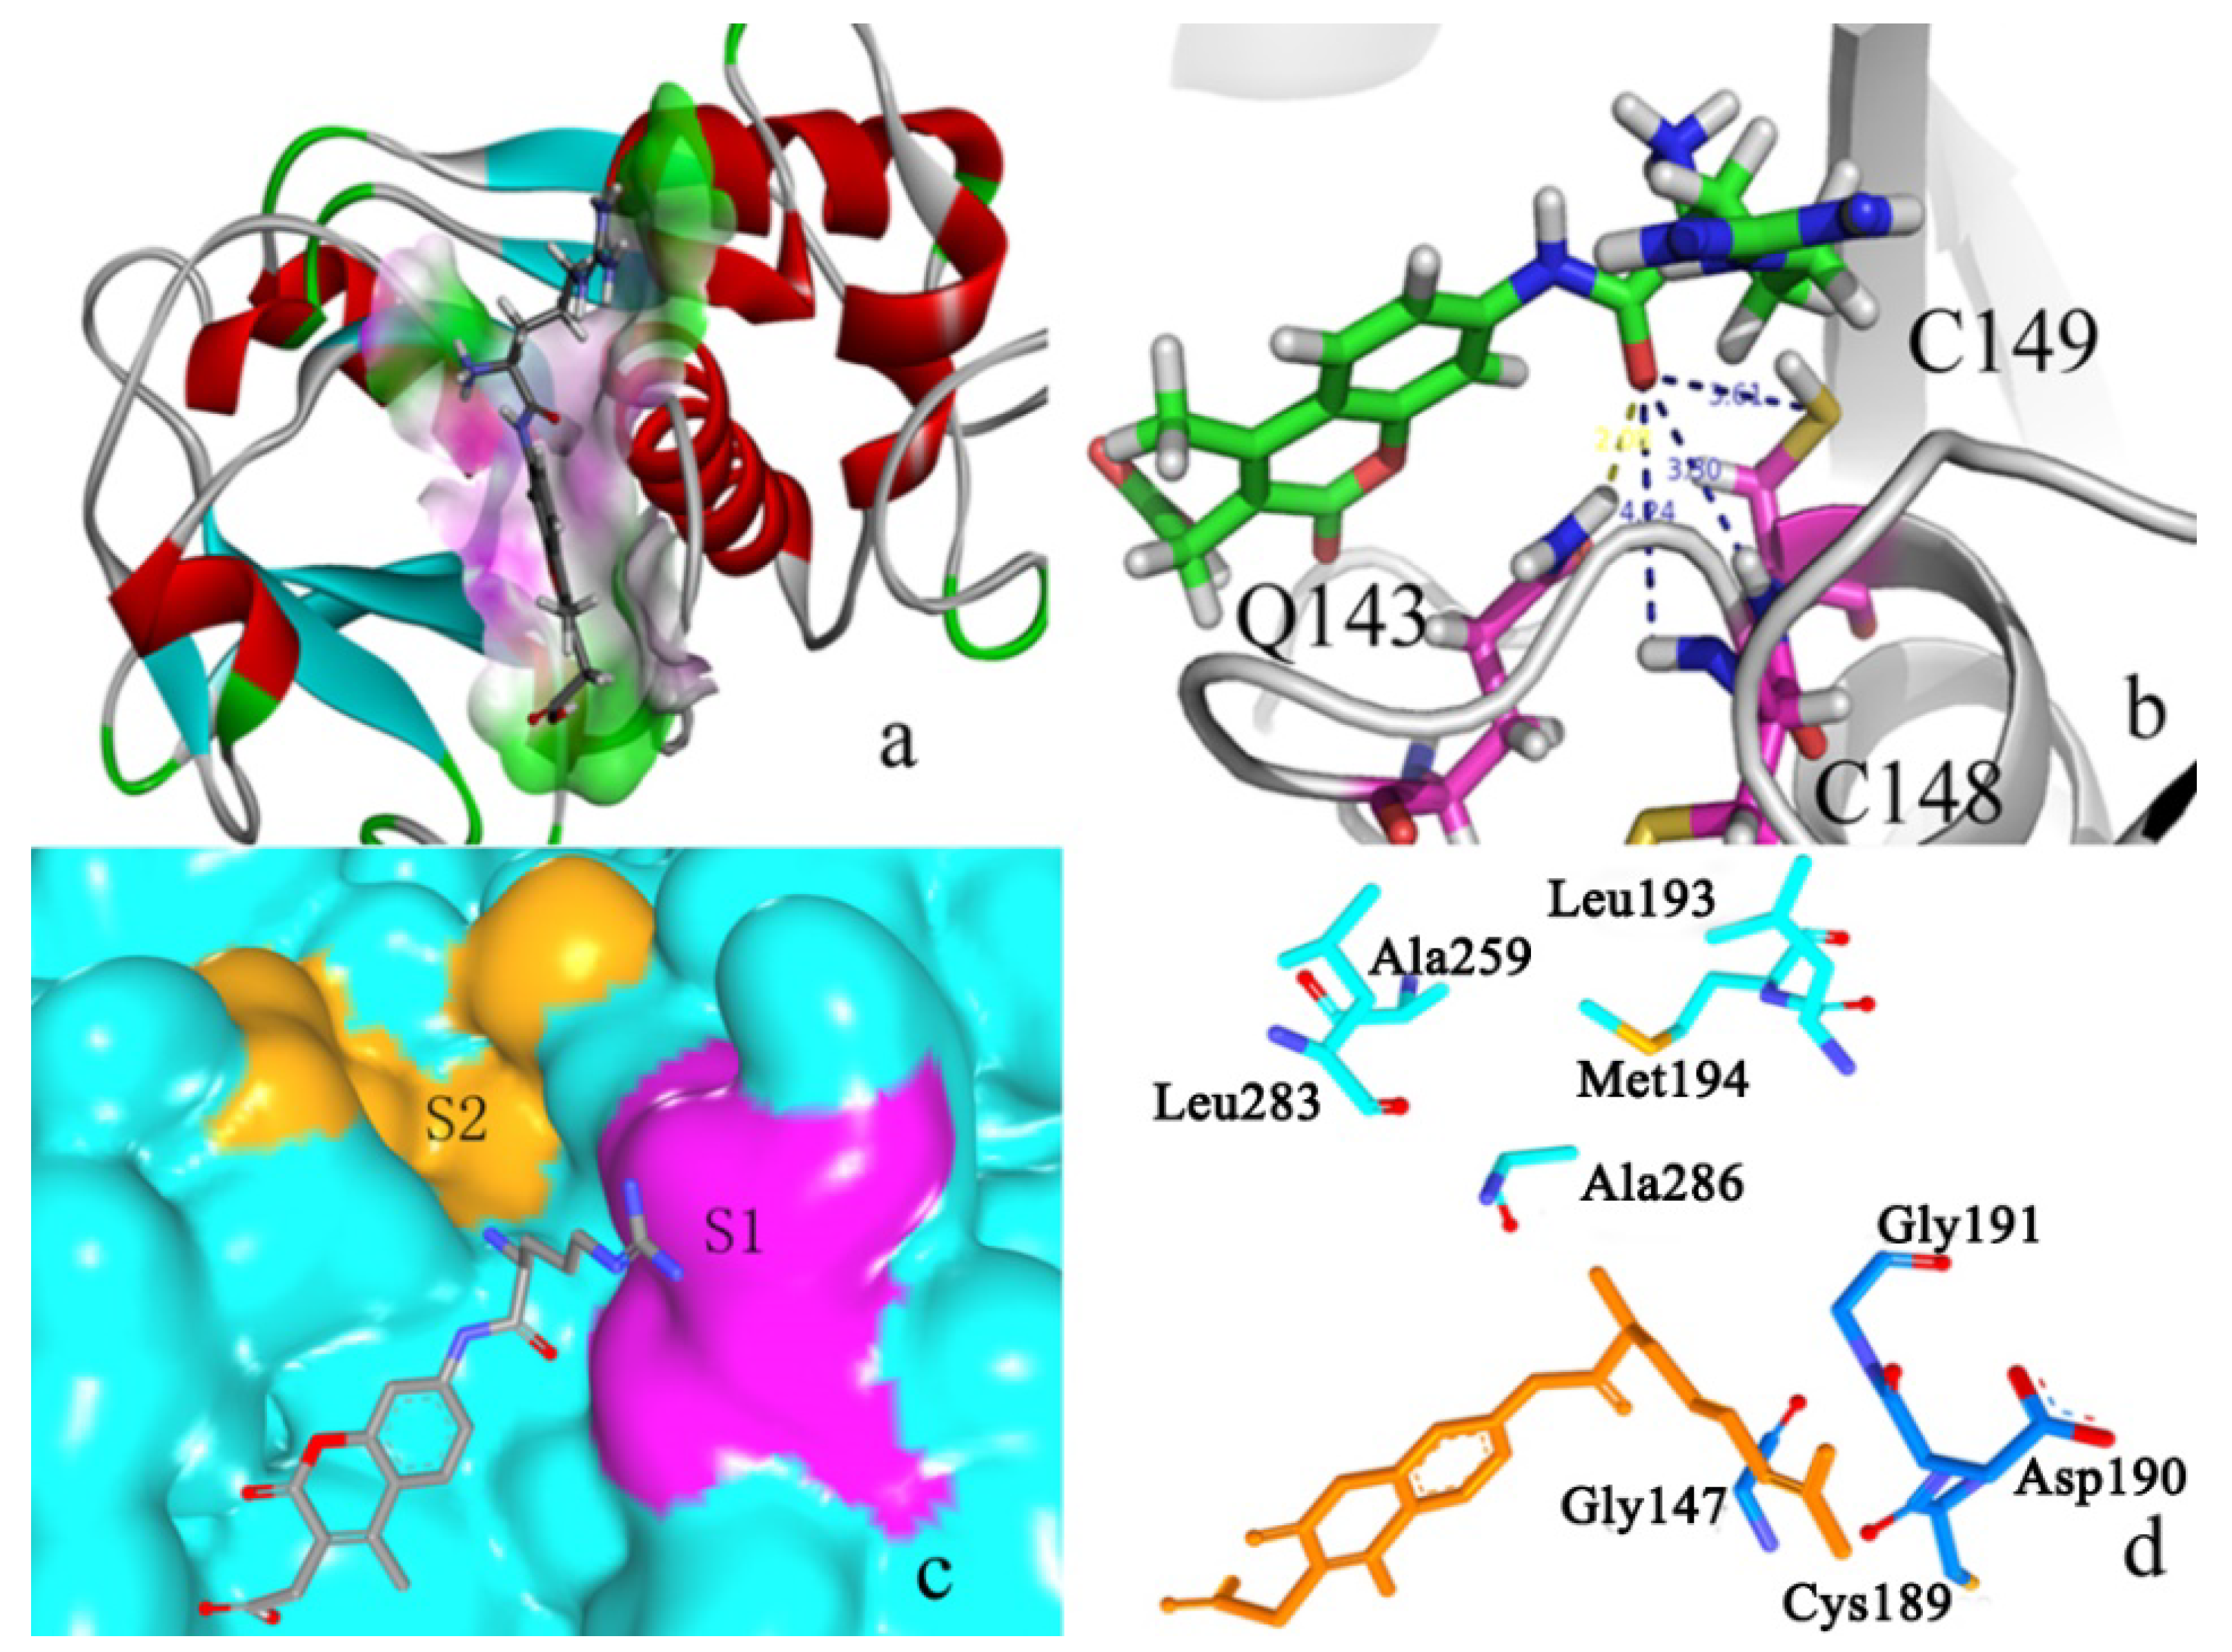
2.2.2. P1–S1 Interactions

| Ligands | Docking Score | Ligands | Docking Score | Ligands | Docking Score |
|---|---|---|---|---|---|
| R-AMC | −10.4 | L-AMC | −6.4 | I-AMC | −6.1 |
| F-AMC | −8.3 | V-AMC | −6.4 | K-AMC | −6.1 |
| Y-AMC | −7.9 | A-AMC | −6.2 | T-AMC | −6.1 |
| W-AMC | −7.5 | Q-AMC | −6.2 | M-AMC | −5.9 |
| N-AMC | −7.2 | E-AMC | −6.2 | S-AMC | −5.9 |
| P-AMC | −6.9 | G-AMC | −6.2 | D-AMC | −5.5 |
| H-AMC | −6.4 | C-AMC | −6.1 | – | – |
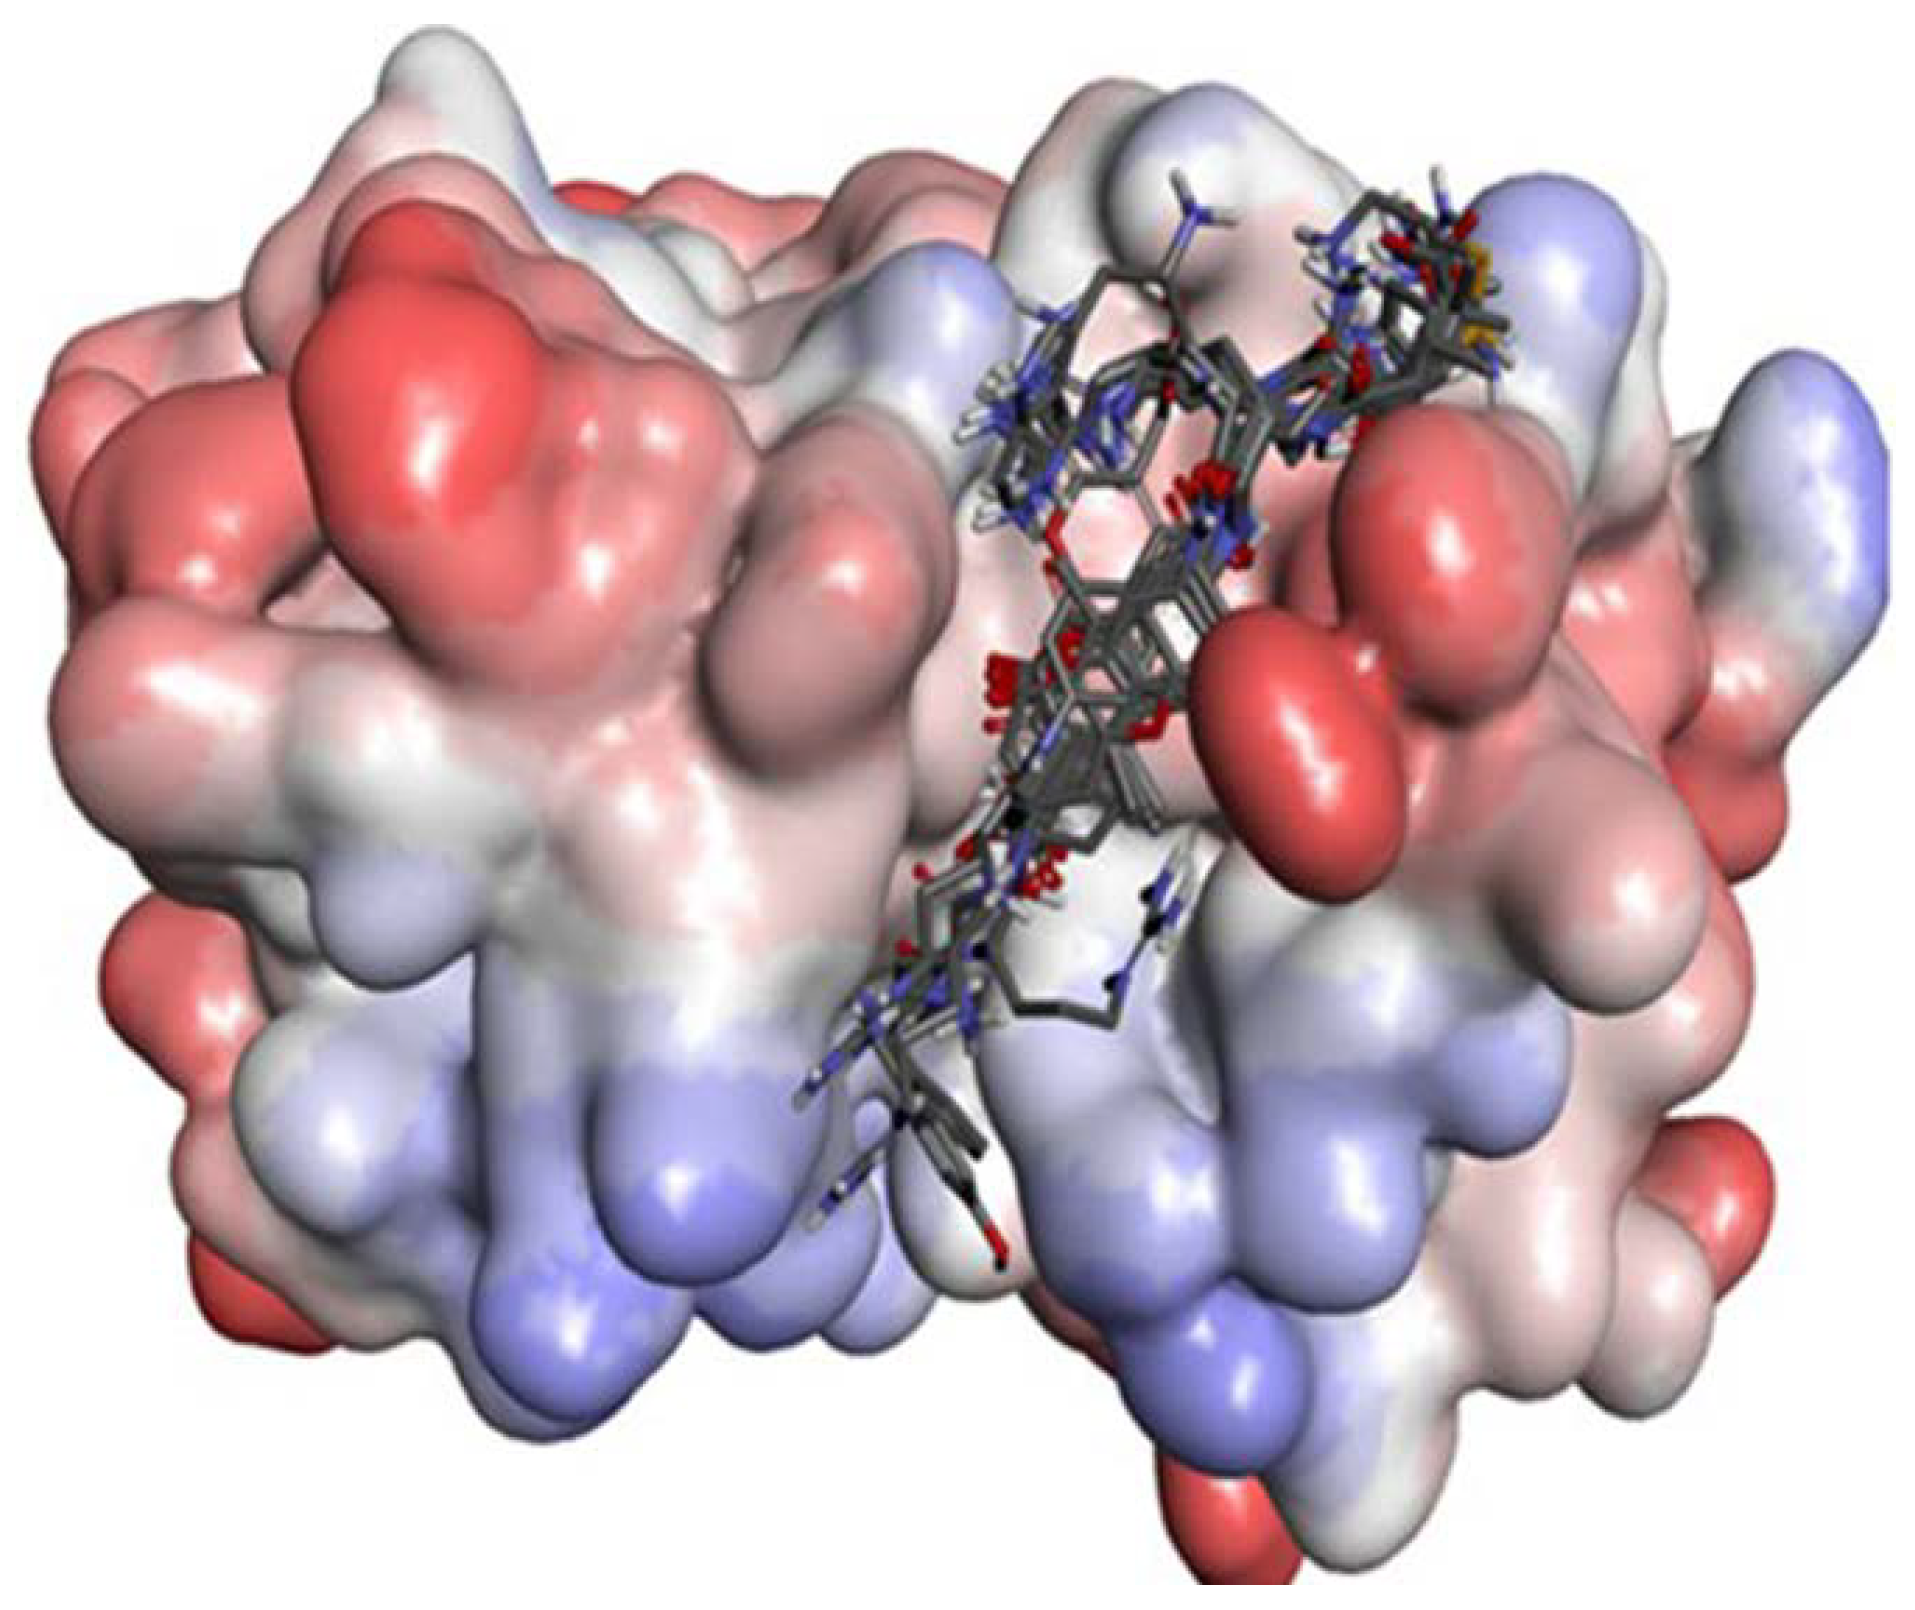
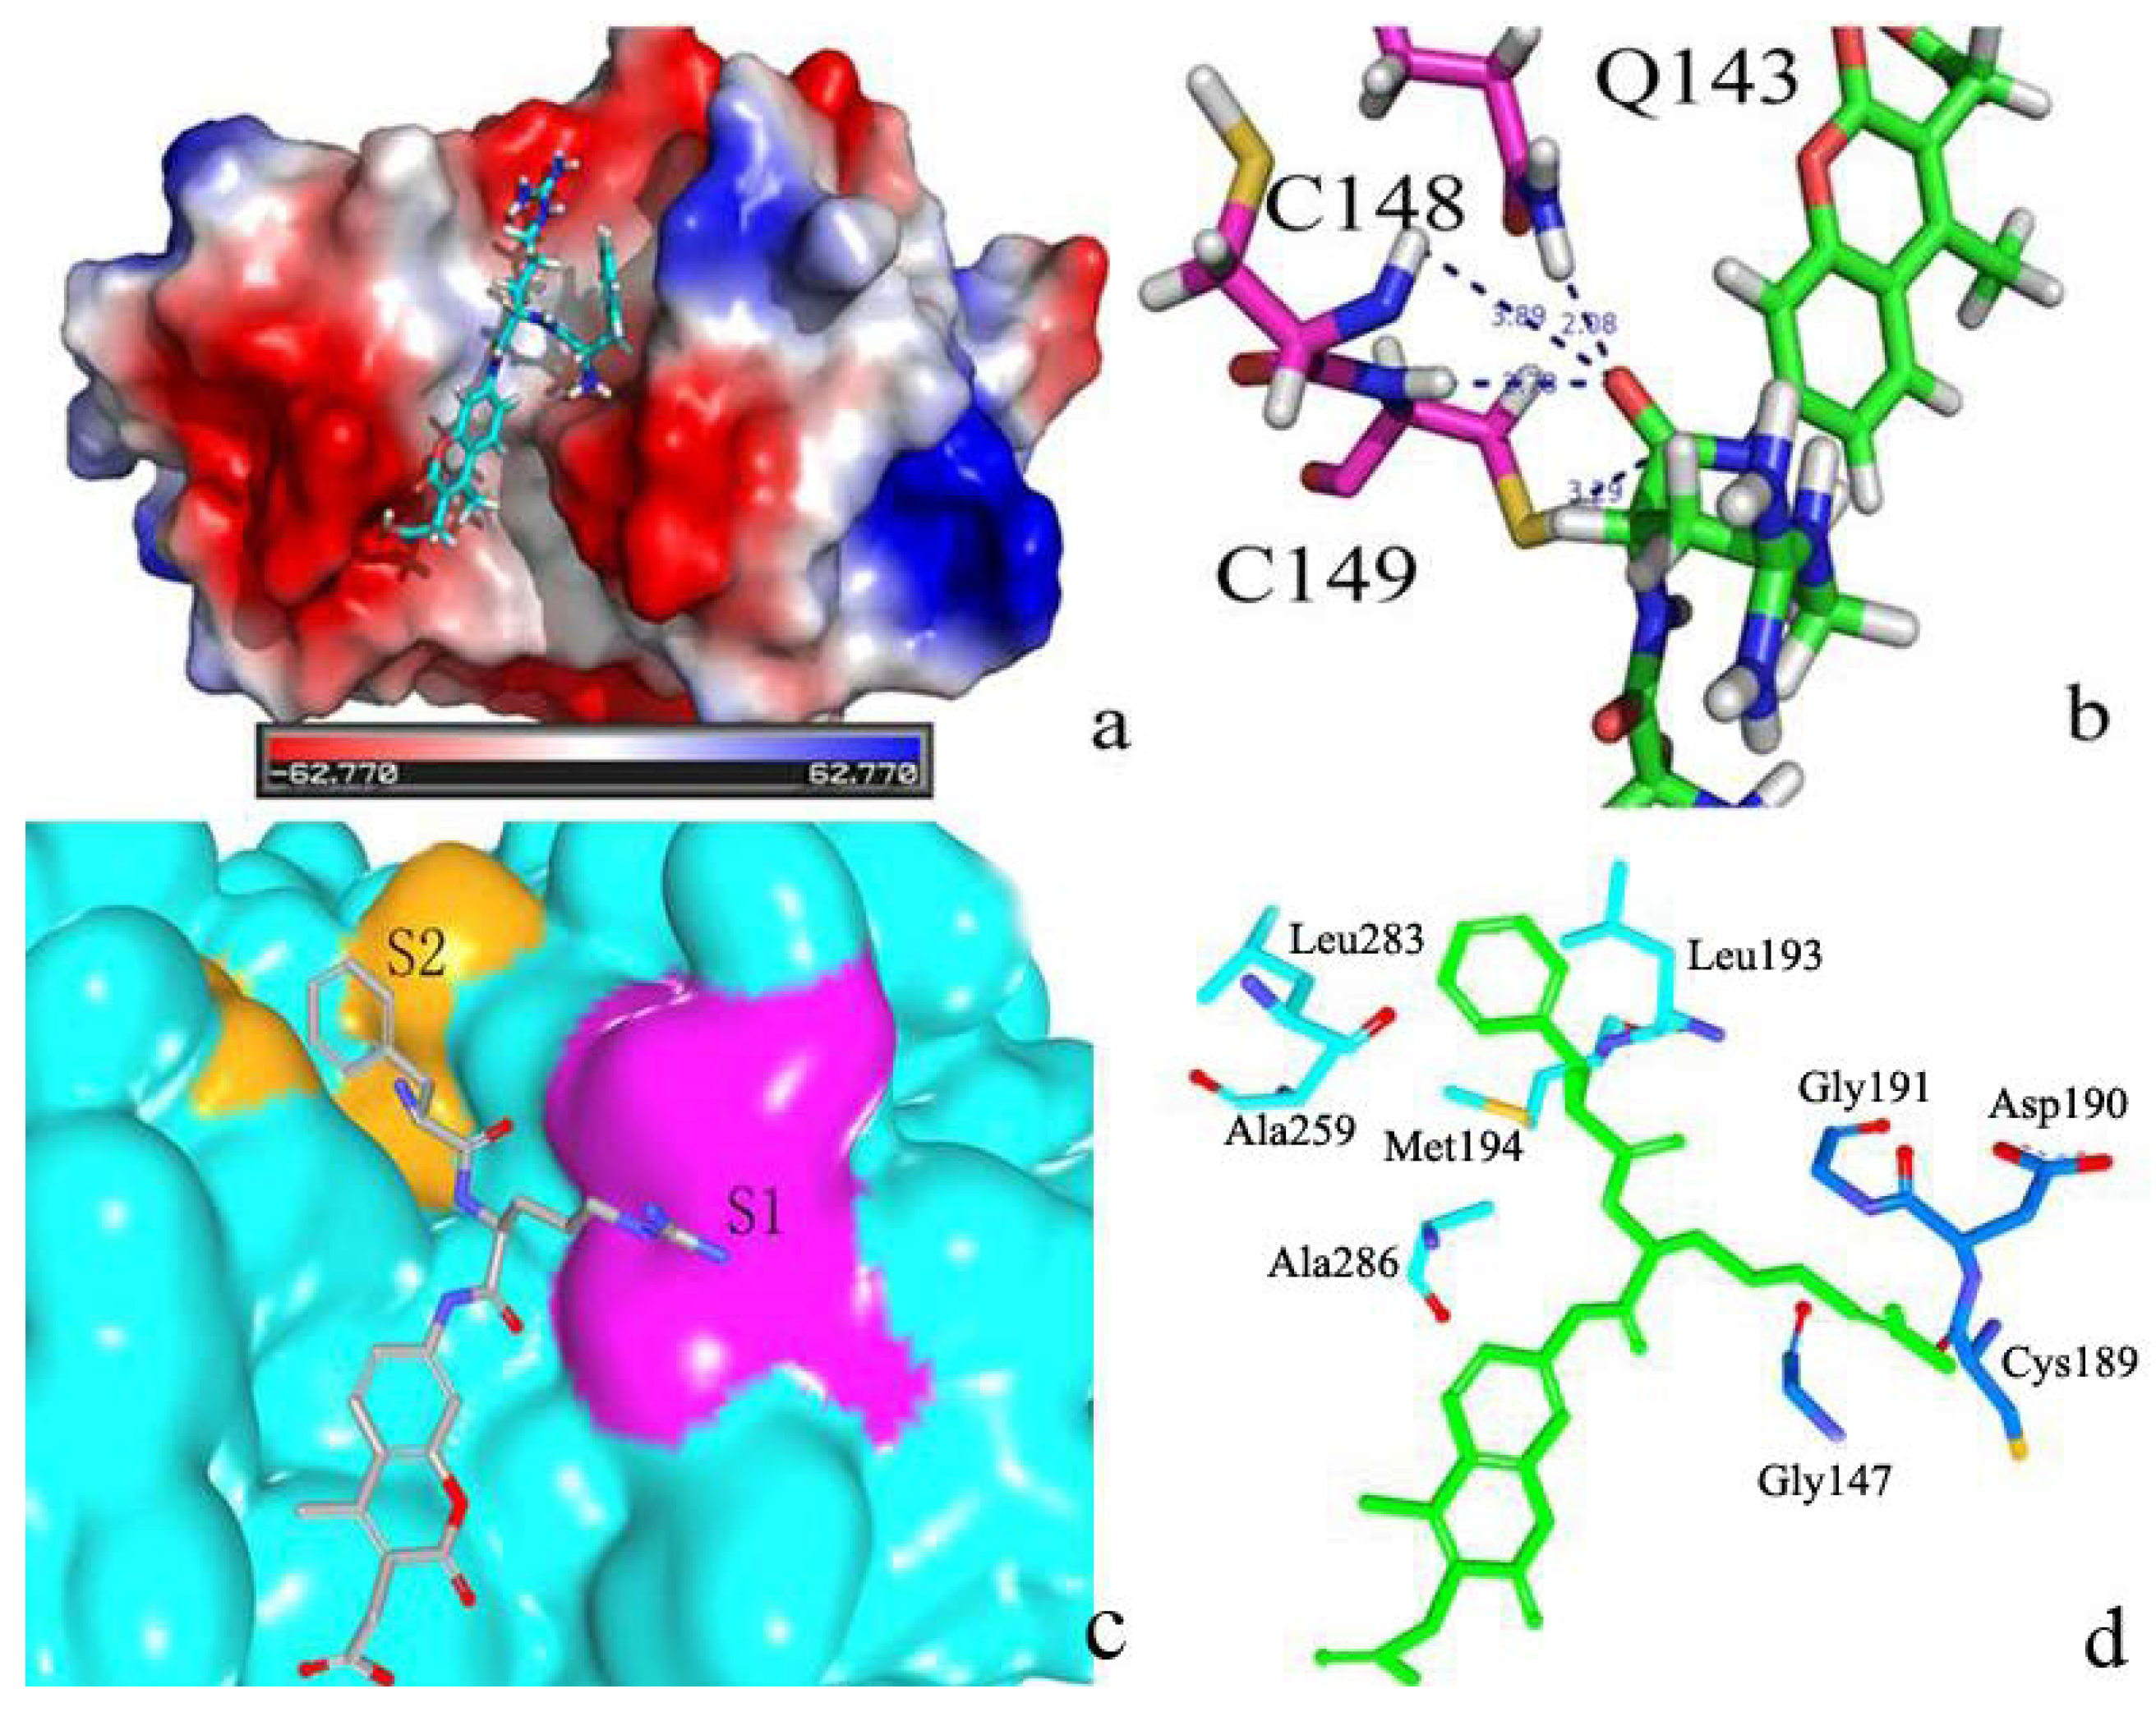
2.2.3. P2–S2 Interactions

| Ligands | Docking Score | Ligands | Docking Score | Ligands | Docking Score |
|---|---|---|---|---|---|
| F-R-AMC | −9.8 | A-R-AMC | −8.3 | E-R-AMC | −8.0 |
| Y-R-AMC | −9.7 | N-R-AMC | −8.3 | T-R-AMC | −8.0 |
| P-R-AMC | −8.9 | I-R-AMC | −8.3 | G-R-AMC | −7.8 |
| H-R-AMC | −8.5 | D-R- AMC | −8.2 | K-R-AMC | −7.6 |
| R-R-AMC | −8.4 | Q-R-AMC | −8.2 | M-R-AMC | −7.6 |
| W-R-AMC | −8.4 | L-R-AMC | −8.1 | S-R-AMC | −7.6 |
| V-R-AMC | −8.4 | C-R-AMC | −8.1 | – | – |

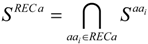
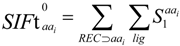
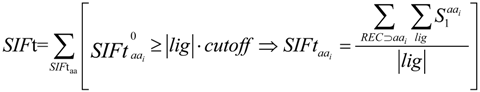
2.3. Structural Interaction Fingerprint Analysis
| Amino Acid | Interactions | ||||||||
|---|---|---|---|---|---|---|---|---|---|
| Any | Back-Bone | Side Chain | Polar | Hydrophobic | H-Bond Acceptor | H-Bond Donor | Aromatic | Charged | |
| Q143 | 1 | 0.1 | 1 | 0.97 | 0 | 0 | 0.71 | 0 | 0 |
| W308 | 1 | 0.68 | 1 | 1 | 0 | 0 | 0.71 | 1 | 0 |
| H285 | 0.97 | 0.65 | 0.97 | 0.97 | 0 | 0 | 0.1 | 0 | 0 |
| M194 | 0.94 | 0 | 0.94 | 0 | 0.94 | 0 | 0 | 0 | 0 |
| L283 | 0.94 | 0.71 | 0.94 | 0.74 | 0.19 | 0 | 0 | 0 | 0 |
| G144 | 0.9 | 0.9 | 0 | 0.35 | 0.55 | 0 | 0 | 0 | 0 |
| R268 | 0.9 | 0.9 | 0.97 | 0.87 | 0.1 | 0.19 | 0 | 0 | 0.71 |
| A286 | 0.86 | 0.86 | 0.86 | 0.23 | 0 | 0 | 0 | 0 | 0 |
| L193 | 0.74 | 0.71 | 0.74 | 0.23 | 0.52 | 0 | 0 | 0 | 0 |
| G147 | 0.72 | 0.72 | 0 | 0.59 | 0.13 | 0 | 0 | 0 | 0 |
| S311 | 0.68 | 0.55 | 0.68 | 0.55 | 0.19 | 0.1 | 0 | 0 | 0 |
| D190 | 0.56 | 0.56 | 0.16 | 0.46 | 0.1 | 0.16 | 0 | 0 | 0 |
| C189 | 0.56 | 0.56 | 0 | 0.1 | 0.46 | 0 | 0 | 0 | 0 |
| G191 | 0.56 | 0.56 | 0 | 0.53 | 0 | 0 | 0 | 0 | 0 |
| A286 | 0.56 | 0.56 | 0 | 0.56 | 0 | 0 | 0 | 0 | 0 |
| C149 | 0.52 | 0.29 | 0.9 | 0.39 | 0.52 | 0 | 0.13 | 0 | 0 |
| N284 | 0.45 | 0.45 | 0.19 | 0.42 | 0 | 0.1 | 0 | 0 | 0 |
| D142 | 0.32 | 0 | 0.32 | 0.32 | 0 | 0.1 | 0 | 0 | 0 |
| Y270 | 0.29 | 0.29 | 0 | 0.26 | 0 | 0.13 | 0 | 0 | 0 |
| W150 | 0.26 | 0.26 | 0.26 | 0.19 | 0 | 0 | 0 | 0 | 0 |
| G262 | 0.26 | 0.26 | 0 | 0.1 | 0.16 | 0 | 0 | 0 | 0 |
| D271 | 0.23 | 0.23 | 0.23 | 0.1 | 0.16 | 0 | 0 | 0 | 0 |
2.4. Calculation of the Free Energy of Binding with Molecular Mechanics-Poisson–Boltzmann Surface Area (MM-PBSA) Method

| Energy Components (kcal·mol−1) | R-AMC–zmCP1 | D-AMC–zmCP1 |
|---|---|---|
| ∆Eele | −172.62 | −106.88 |
| ∆EvdW | −33.5 | −31.4 |
| ∆GPB | 170.65 | 129.89 |
| ∆Gnp | −5.44 | −5.46 |
| Non-polar | −38.94 | −36.86 |
| Polar | −1.97 | 23.01 |
| ∆Gbind | −40.91 | −13.85 |
3. Experimental Section
3.1. Homology Protein Modeling
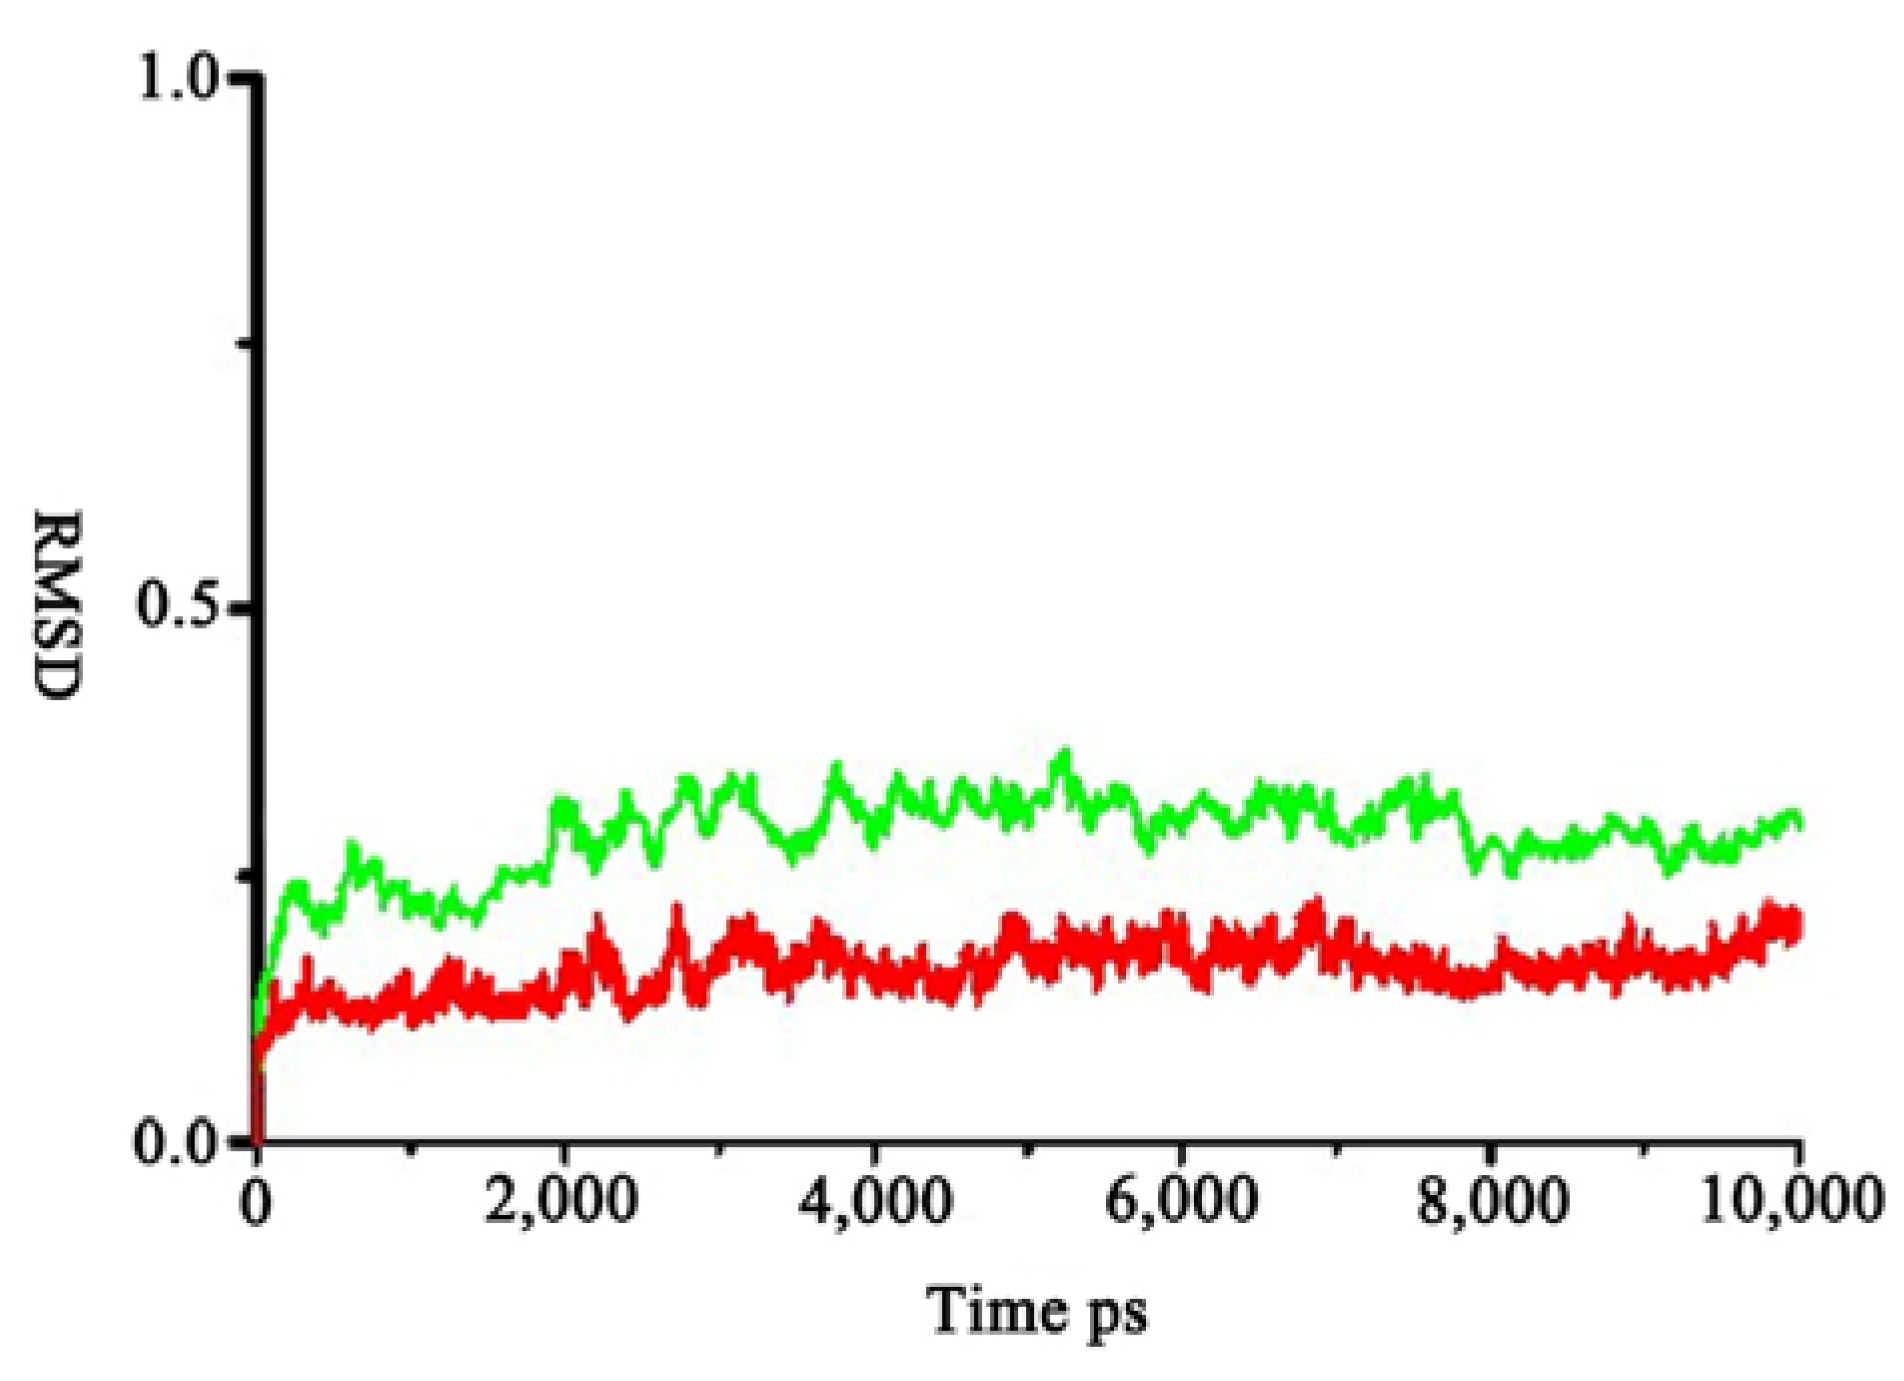
3.2. Molecular Dynamics (MD) Simulation
3.3. Docking Study
3.4. Structural Interaction Fingerprint Analysis
3.5. MM-PBSA Calculations
4. Conclusions
Supplementary Files
Acknowledgments
Conflicts of Interest
References
- Lv, J.; Nie, Z.K.; Zhang, J.L.; Liu, F.Y.; Wang, Z.Z.; Ma, Z.L.; He, H. Corn peptides protect against thioacetamide-induced hepatic fibrosis in rats. J. Med. Food 2013, 16, 912–919. [Google Scholar] [CrossRef]
- Ma, Z.L.; Zhang, W.J.; Yu, G.C.; He, H.; Zhang, Y. The primary structure identification of a corn peptide facilitating alcohol metabolism by HPLC-MS/MS. Peptides 2012, 37, 138–143. [Google Scholar]
- Yang, Y.; Tao, G.; Liu, P.; Liu, J. Peptide with angiotensin I-converting enzyme inhibitory activity from hydrolyzed corn gluten meal. J. Agric. Food Chem. 2007, 55, 7891–7895. [Google Scholar]
- Rawlings, N.D.; Barrett, A.J. Families of cysteine peptidases. Methods Enzymol. 1994, 244, 461–486. [Google Scholar] [CrossRef]
- Rawlings, N.D.; Barrett, A.J. Evolutionary families of peptidases. Biochem. J. 1993, 290, 205–218. [Google Scholar]
- Sebti, S.M.; DeLeon, J.C.; Lazo, J.S. Purification, characterization, and amino acid composition of rabbit pulmonary bleomycin hydrolase. Biochemistry 1987, 26, 4213–4219. [Google Scholar] [CrossRef]
- MEROPS: the Database of Proteolytic Enzymes, Their Substrates and Inhibitors. Available online: http://merops.sanger.ac.uk (accessed on 13 January 2013).
- Rawlings, N.D.; Tolle, D.P.; Barrett, A.J. Evolutionary families of peptidase inhibitors. Biochem. J. 2004, 378, 705–716. [Google Scholar] [CrossRef]
- Janowski, R.; Kozak, M.; Jankowska, E.; Grzonka, Z.; Jaskolski, M. Two polymorphs of a covalent complex between papain and a diazomethylketone inhibitor. J. Pept. Res. 2004, 64, 141–150. [Google Scholar] [CrossRef]
- Ghosh, R.; Chakraborty, S.; Chakrabarti, C.; Dattagupta, J.K.; Biswas, S. Structural insights into the substrate specificity and activity of ervatamins, the papain-like cysteine proteases from a tropical plant, Ervatamia coronaria. FEBS J. 2008, 275, 421–434. [Google Scholar] [CrossRef]
- Zhang, M.; Wei, Z.; Chang, S.; Teng, M.; Gong, W. Crystal structure of a papain-fold protein without the catalytic residue: A novel member in the cysteine proteinase family. J. Mol. Biol. 2006, 358, 97–105. [Google Scholar]
- Alexandrov, N.N.; Brover, V.V.; Freidin, S.; Troukhan, M.E.; Tatarinova, T.V.; Zhang, H.; Swaller, T.J.; Lu, Y.P.; Bouck, J.; Flavell, R.B.; et al. Insights into corn genes derived from large-scale cDNA sequencing. Plant Mol. Biol. 2009, 69, 179–194. [Google Scholar] [CrossRef]
- Than, M.E.; Helm, M.; Simpson, D.J.; Lottspeich, F.; Huber, R.; Gietl, C. The 2.0 Å crystal structure and substrate specificity of the KDEL-tailed cysteine endopeptidase functioning in programmed cell death of Ricinus communis endosperm. J. Mol. Biol. 2004, 336, 1103–1116. [Google Scholar]
- Kiefer, F.; Arnold, K.; Kunzli, M.; Bordoli, L.; Schwede, T. The SWISS-MODEL repository and associated resources. Nucleic Acids Res. 2009, 37, D387–D392. [Google Scholar] [CrossRef]
- Benkert, P.; Biasini, M.; Schwede, T. Toward the estimation of the absolute quality of individual protein structure models. Bioinformatics 2011, 27, 343–350. [Google Scholar] [CrossRef]
- PROCHECK and PROCHECK-NMR. Available online: http://nihserver.mbi.ucla.edu/SAVS (accessed on 15 April 2013).
- Laskowski, R.A.; Macarthur, M.W.; Moss, D.S.; Thornton, J.M. PROCHECK: A program to check the stereochemical quality of protein structures. J. Appl. Cryst. 1993, 26, 283–291. [Google Scholar] [CrossRef]
- Colovos, C.; Yeates, T.O. Verification of protein structures: patterns of nonbonded atomic interactions. Protein Sci. 1993, 2, 1511–1519. [Google Scholar] [CrossRef]
- Wiederstein, M.; Sippl, M.J. ProSA-web: Interactive web service for the recognition of errors in three-dimensional structures of proteins. Nucleic Acids Res. 2007, 35, W407–W410. [Google Scholar] [CrossRef]
- Choe, Y.; Leonetti, F.; Greenbaum, D.C.; Lecaille, F.; Bogyo, M.; Bromme, D.; Ellman, J.A.; Craik, C.S. Substrate profiling of cysteine proteases using a combinatorial peptide library identifies functionally unique specificities. J. Biol. Chem. 2006, 281, 12824–12832. [Google Scholar] [CrossRef]
- Del, N.E.; Alves, L.C.; Melo, R.L.; Cesari, M.H.; Juliano, L.; Juliano, M.A. Specificity of cathepsin B to fluorescent substrates containing benzyl side-chain-substituted amino acids at P1 subsite. J. Protein Chem. 2000, 19, 33–38. [Google Scholar] [CrossRef]
- Brozell, S.R.; Mukherjee, S.; Balius, T.E.; Roe, D.R.; Case, D.A.; Rizzo, R.C. Evaluation of DOCK 6 as a pose generation and database enrichment tool. J. Comput. Aided Mol. Des. 2012, 26, 749–773. [Google Scholar] [CrossRef]
- Mukherjee, S.; Balius, T.E.; Rizzo, R.C. Docking validation resources: Protein family and ligand flexibility experiments. J. Chem. Inf. Model. 2010, 50, 1986–2000. [Google Scholar] [CrossRef]
- Huang, N.; Shoichet, B.K.; Irwin, J.J. Benchmarking sets for molecular docking. J. Med. Chem. 2006, 49, 6789–6801. [Google Scholar] [CrossRef]
- Bethune, M.T.; Strop, P.; Tang, Y.; Sollid, L.M.; Khosla, C. Heterologous expression, purification, refolding, and structural-functional characterization of EP-B2, a self-activating barley cysteine endoprotease. Chem. Biol. 2006, 13, 637–647. [Google Scholar] [CrossRef]
- Varughese, K.I.; Su, Y.; Cromwell, D.; Hasnain, S.; Xuong, N.H. Crystal structure of an actinidin–E-64 complex. Biochemistry 1992, 31, 5172–5176. [Google Scholar] [CrossRef]
- Biswas, S.; Chakrabarti, C.; Kundu, S.; Jagannadham, M.V.; Dattagupta, J.K. Proposed amino acid sequence and the 1.63 A X-ray crystal structure of a plant cysteine protease, ervatamin B: Some insights into the structural basis of its stability and substrate specificity. Proteins 2003, 51, 489–497. [Google Scholar] [CrossRef]
- Schröder, E.; Phillips, C.; Garman, E.; Harlos, K.; Crawford, C. X-ray crystallographic structure of a papain-leupeptin complex. Febs. Lett. 1993, 315, 38–42. [Google Scholar] [CrossRef]
- Nagler, D.K.; Tam, W.; Storer, A.C.; Krupa, J.C.; Mort, J.S.; Menard, R. Interdependency of sequence and positional specificities for cysteine proteases of the papain family. Biochemistry 1999, 38, 4868–4874. [Google Scholar]
- Khouri, H.E.; Vernet, T.; Menard, R.; Parlati, F.; Laflamme, P.; Tessier, D.C.; Gour-Salin, B.; Thomas, D.Y.; Storer, A.C. Engineering of papain: Selective alteration of substrate specificity by site-directed mutagenesis. Biochemistry 1991, 30, 8929–8936. [Google Scholar] [CrossRef]
- Fu, G.; Liu, H.; Doerksen, R.J. Molecular modeling to provide insight into the substrate binding and catalytic mechanism of human biliverdin-IXα reductase. J. Phys. Chem. B 2012, 116, 9580–9594. [Google Scholar] [CrossRef]
- Kuhn, B.; Kollman, P.A. Binding of a diverse set of ligands to avidin and streptavidin: An accurate quantitative prediction of their relative affinities by a combination of molecular mechanics and continuum solvent models. J. Med. Chem. 2000, 43, 3786–3791. [Google Scholar] [CrossRef]
- Villa, J.; Strajbl, M.; Glennon, T.M.; Sham, Y.Y.; Chu, Z.T.; Warshel, A. How important are entropic contributions to enzyme catalysis? Proc. Natl. Acad. Sci. USA 2000, 97, 11899–11904. [Google Scholar] [CrossRef]
- Arnold, K.; Bordoli, L.; Kopp, J.; Schwede, T. The SWISS-MODEL workspace: A web-based environment for protein structure homology modelling. Bioinformatics 2006, 22, 195–201. [Google Scholar] [CrossRef]
- Assisted Model Building with Energy Refinement (AMBER), version 10; University of California: San Francisco, CA, USA, 2008.
- Langevin, P. Sur la théorie du mouvement brownien. CR Acad. Sci. Paris 1908, 146, 530–533. [Google Scholar]
- Berendsen, H.J.; Postma, J.P.M.; van Gunsteren, W.F.; DiNola, A.; Haak, J.R. Molecular dynamics with coupling to an external bath. J. Chem. Phys. 1984, 81, 3684–3690. [Google Scholar] [CrossRef]
- Darden, T.; York, D.; Pedersen, L. Particle mesh Ewald: An W log (N) method for Ewald sums in large systems. J. Chem. Phys. 1993, 98, 10089–10092. [Google Scholar] [CrossRef]
- Tiwari, A.; Saxena, S.; Pant, A.B.; Srivastava, P. Protein–ligand interaction studies of retinol-binding protein 3 with herbal molecules using AutoDock for the management of Eales’ disease. J. Ocul. Biol. Dis. Inform. 2012, 5, 40–43. [Google Scholar] [CrossRef]
- Norgan, A.; Coffman, P.; Kocher, J.; Katzmann, D.; Sosa, C. Multilevel parallelization of AutoDock 4.2. J. Cheminform. 2011, 3, 1–9. [Google Scholar] [CrossRef]
- Si, Y.X.; Yin, S.J.; Oh, S.; Wang, Z.J.; Ye, S.; Yan, L.; Yang, J.M.; Park, Y.D.; Lee, J.; Qian, G.Y. An integrated study of tyrosinase inhibition by rutin: Progress using a computational simulation. J. Biomol. Struct. Dyn. 2012, 29, 999–1012. [Google Scholar] [CrossRef]
- Hou, X.; Du, J; Zhang, J.; Du, L; Fang, H.; Li, M. How to improve docking accuracy of AutoDock4.2: A case study using different electrostatic potentials. J. Chem. Inf. Model. 2013, 53, 188–200. [Google Scholar] [CrossRef]
- Stigliani, J.L.; Bernardes-Genisson, V.; Bernadou, J.; Pratviel, G. Cross-docking study on InhA inhibitors: A combination of Autodock Vina and PM6-DH2 simulations to retrieve bio-active conformations. Org. Biomol. Chem. 2012, 10, 6341–6349. [Google Scholar] [CrossRef]
- Trott, O.; Olson, A.J. AutoDock Vina: Improving the speed and accuracy of docking with a new scoring function, efficient optimization, and multithreading. J. Comput. Chem. 2010, 31, 455–461. [Google Scholar]
- Seeliger, D.; de Groot, B.L. Ligand docking and binding site analysis with PyMOL and Autodock/Vina. J. Comput. Aided Mol. Des. 2010, 24, 417–422. [Google Scholar] [CrossRef]
- Grimsley, J.K.; Calamini, B.; Wild, J.R.; Mesecar, A.D. Structural and mutational studies of organophosphorus hydrolase reveal a cryptic and functional allosteric-binding site. Arch. Biochem. Biophys. 2005, 442, 169–179. [Google Scholar] [CrossRef]
© 2014 by the authors; licensee MDPI, Basel, Switzerland. This article is an open access article distributed under the terms and conditions of the Creative Commons Attribution license (http://creativecommons.org/licenses/by/3.0/).
Share and Cite
Liu, H.; Chen, L.; Li, Q.; Zheng, M.; Liu, J. Computational Study on Substrate Specificity of a Novel Cysteine Protease 1 Precursor from Zea mays. Int. J. Mol. Sci. 2014, 15, 10459-10478. https://doi.org/10.3390/ijms150610459
Liu H, Chen L, Li Q, Zheng M, Liu J. Computational Study on Substrate Specificity of a Novel Cysteine Protease 1 Precursor from Zea mays. International Journal of Molecular Sciences. 2014; 15(6):10459-10478. https://doi.org/10.3390/ijms150610459
Chicago/Turabian StyleLiu, Huimin, Liangcheng Chen, Quan Li, Mingzhu Zheng, and Jingsheng Liu. 2014. "Computational Study on Substrate Specificity of a Novel Cysteine Protease 1 Precursor from Zea mays" International Journal of Molecular Sciences 15, no. 6: 10459-10478. https://doi.org/10.3390/ijms150610459