Biological Evaluation and 3D-QSAR Studies of Curcumin Analogues as Aldehyde Dehydrogenase 1 Inhibitors

Abstract
:1. Introduction
2. Results and Discussion
2.1. Activity Assay
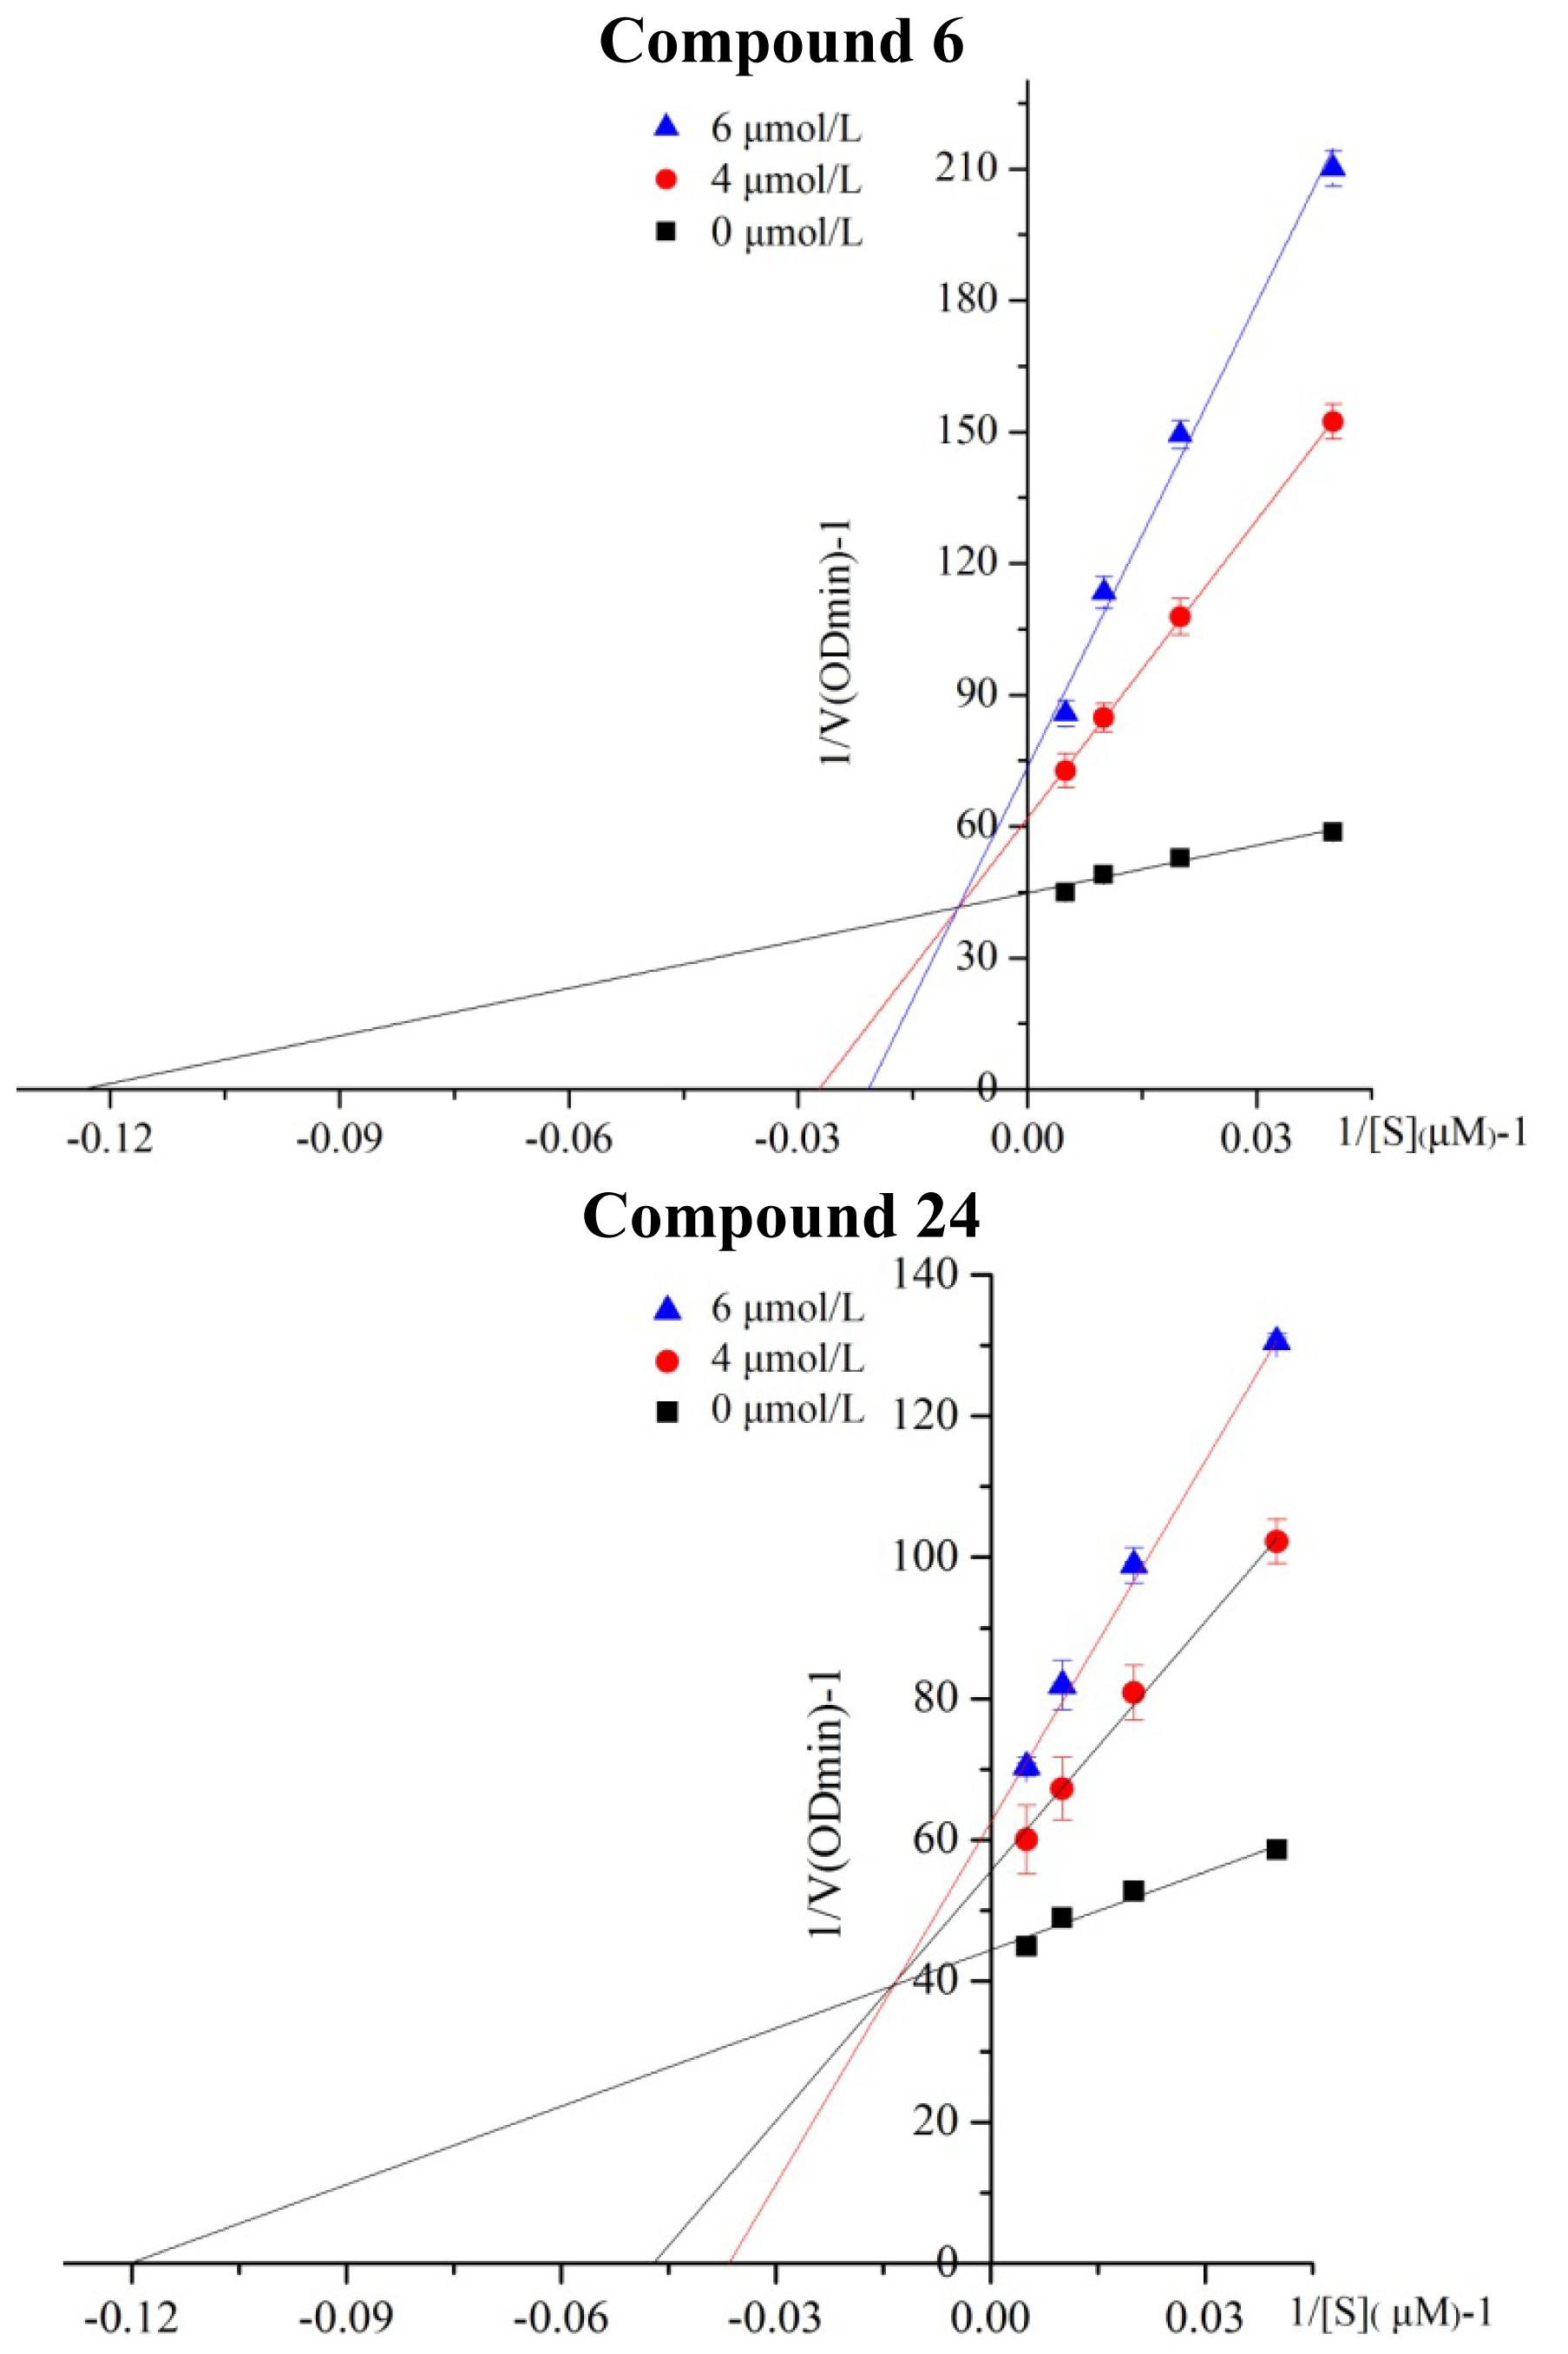
2.2. Kinetic Analysis of Selected Compounds on ALDH1
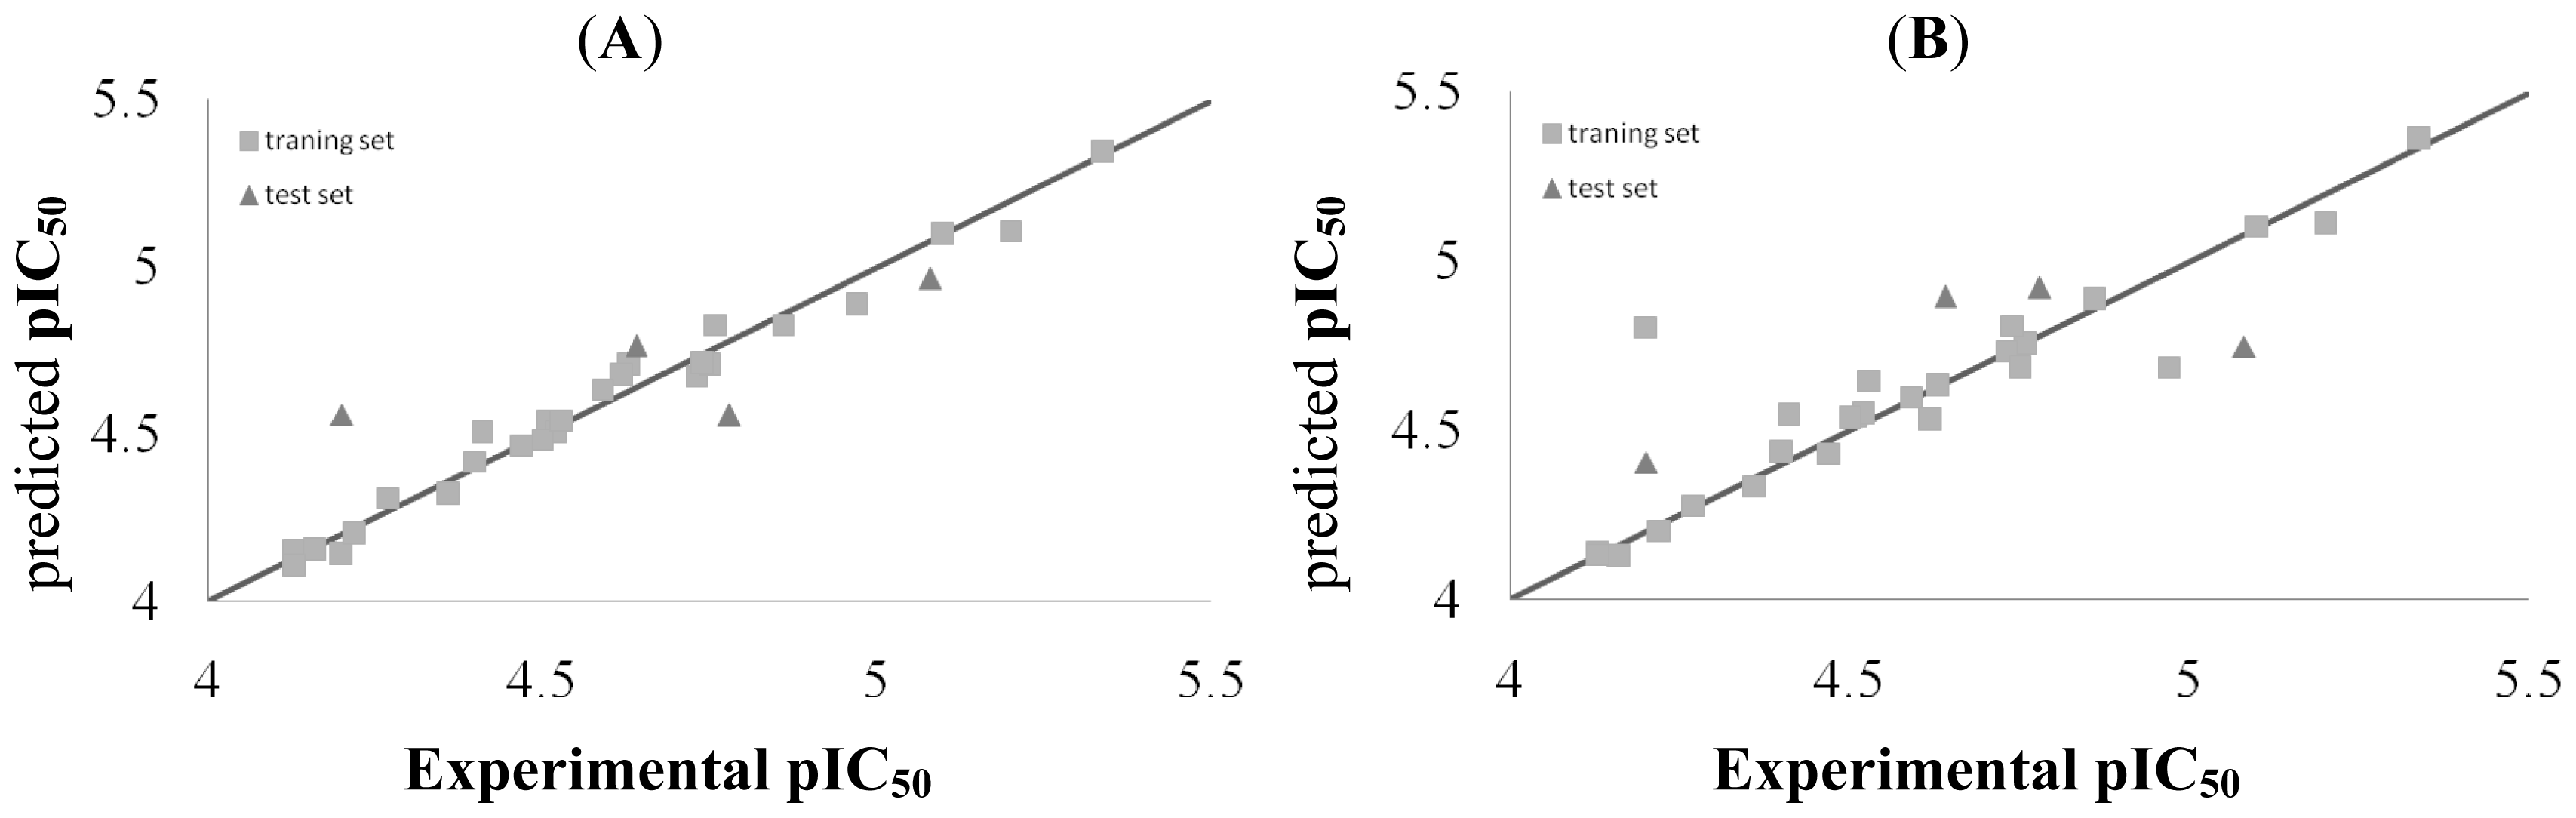
2.3. CoMFA and CoSIA Statistical Results
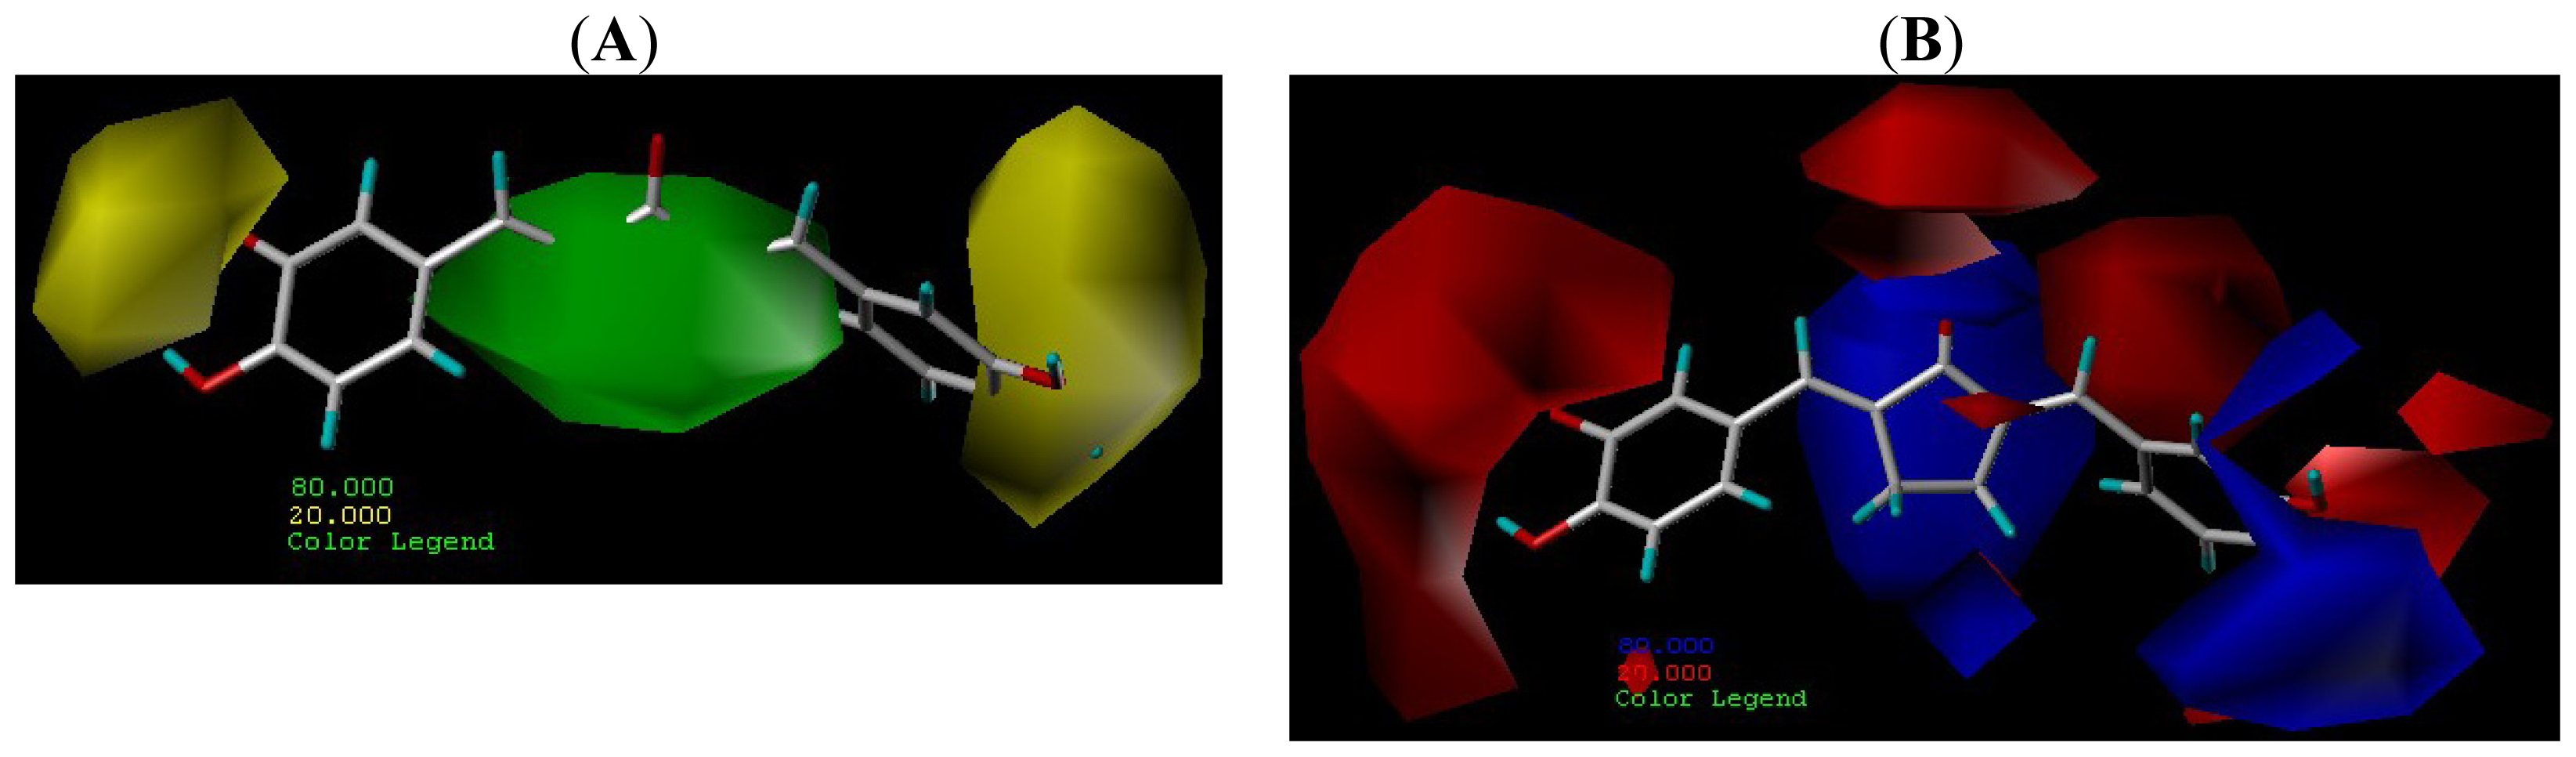
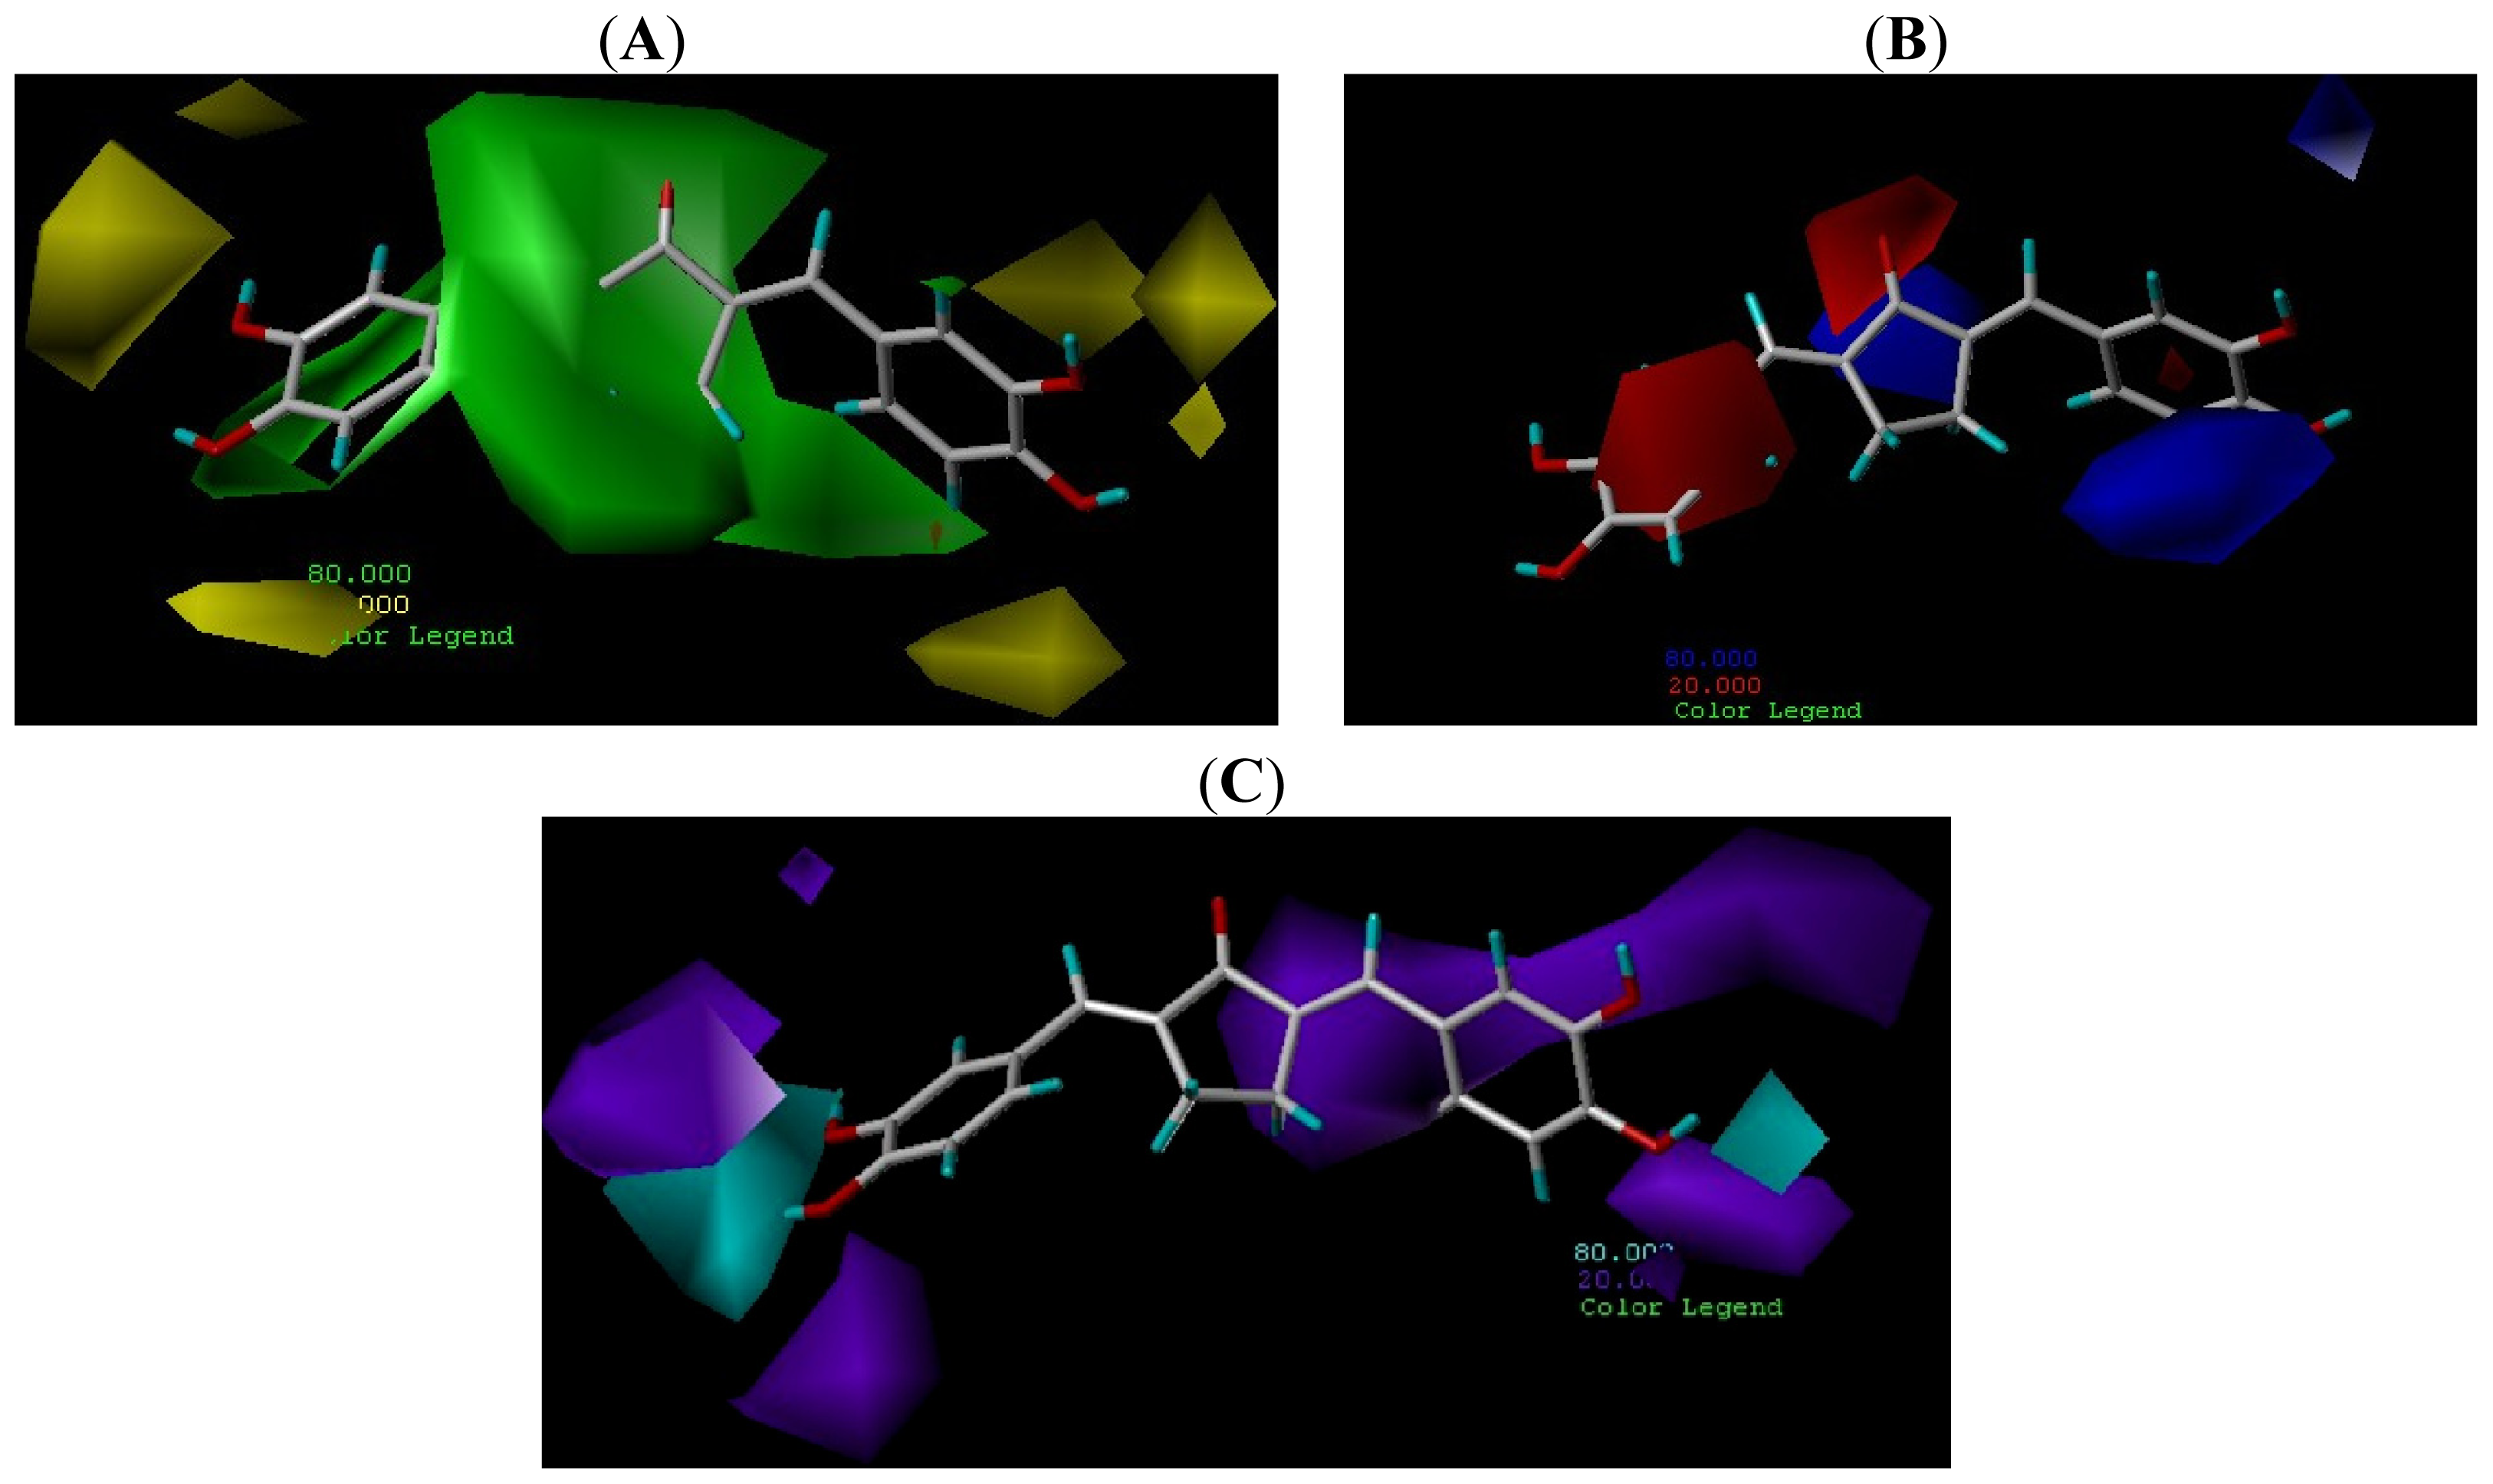
2.4. Contour Maps Analysis
2.4.1. CoMFA Contour Maps
2.4.2. CoMSIA Contour Map
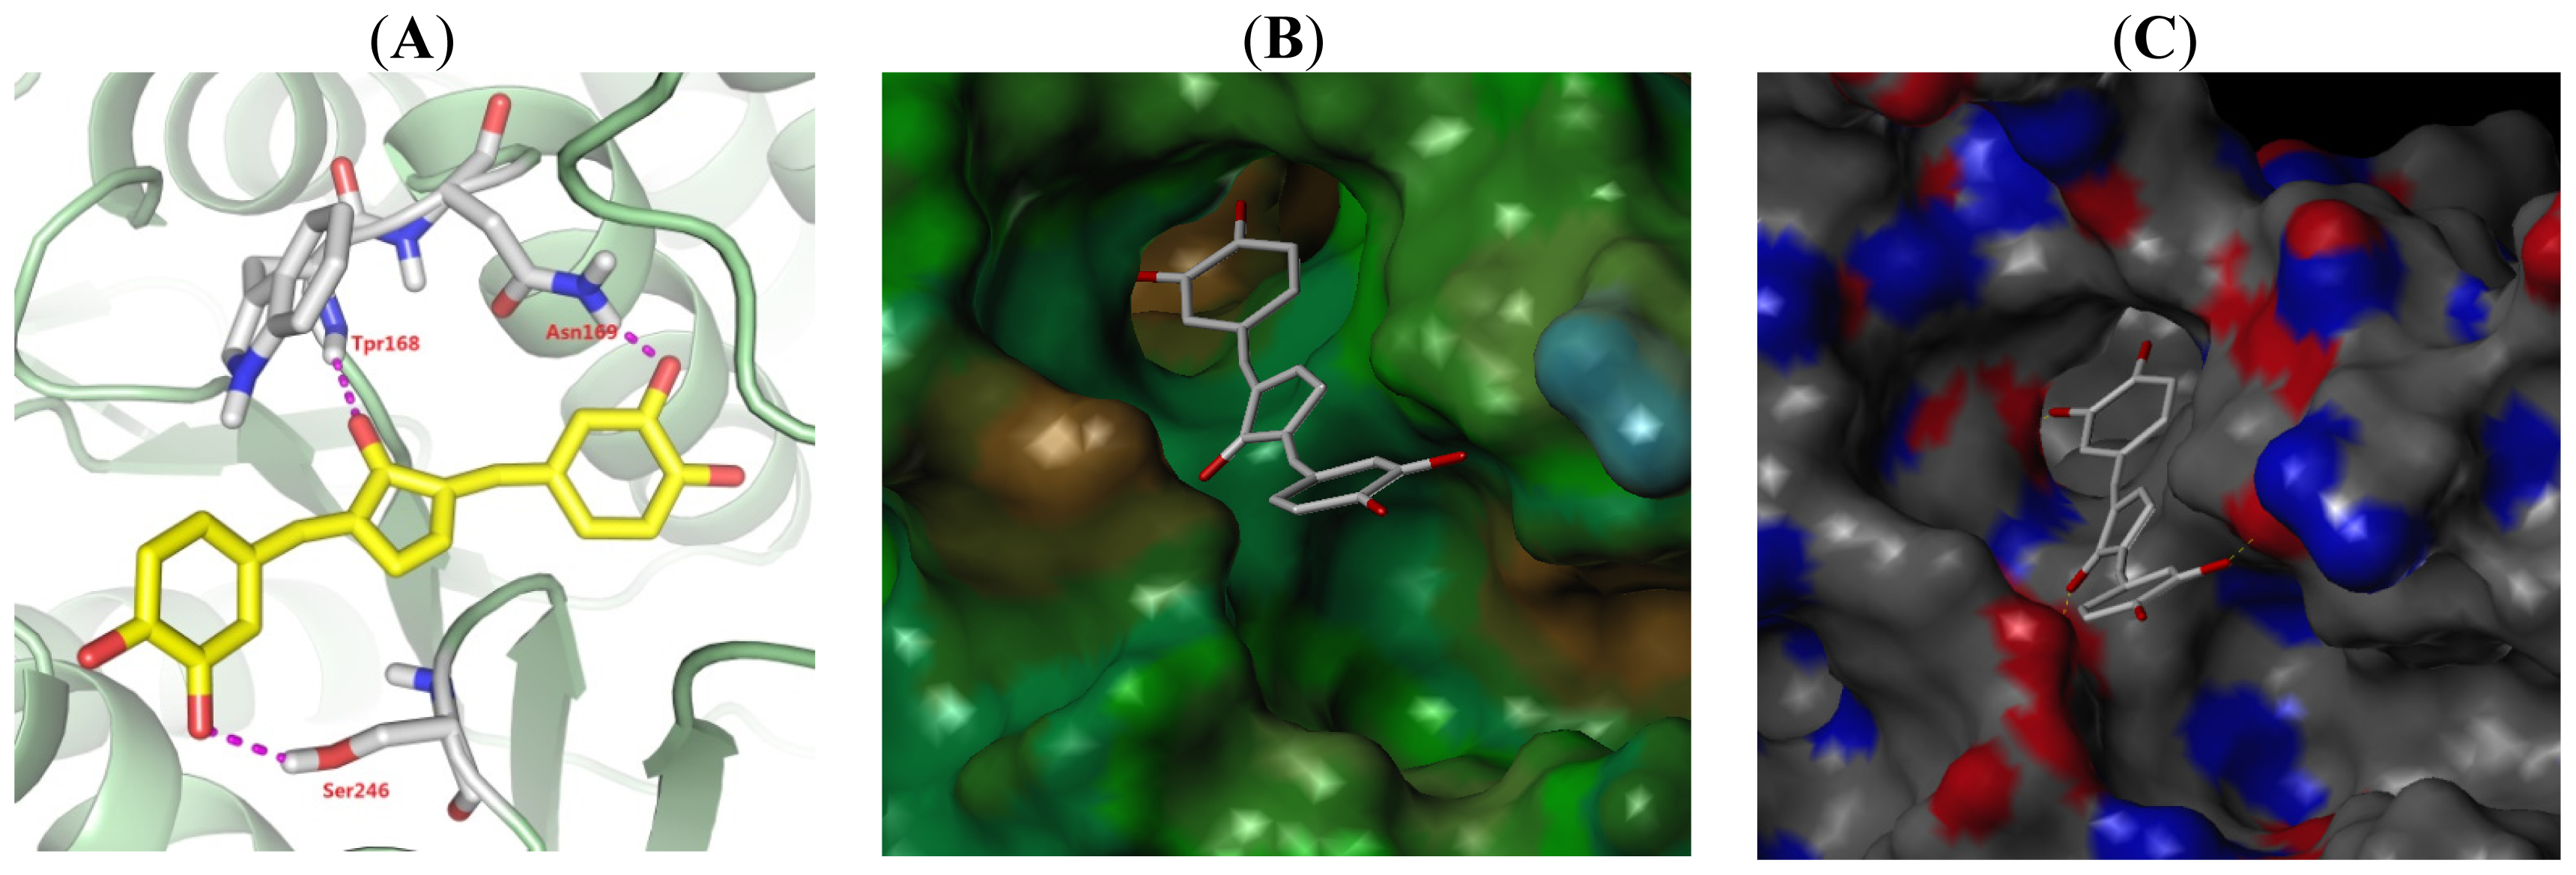
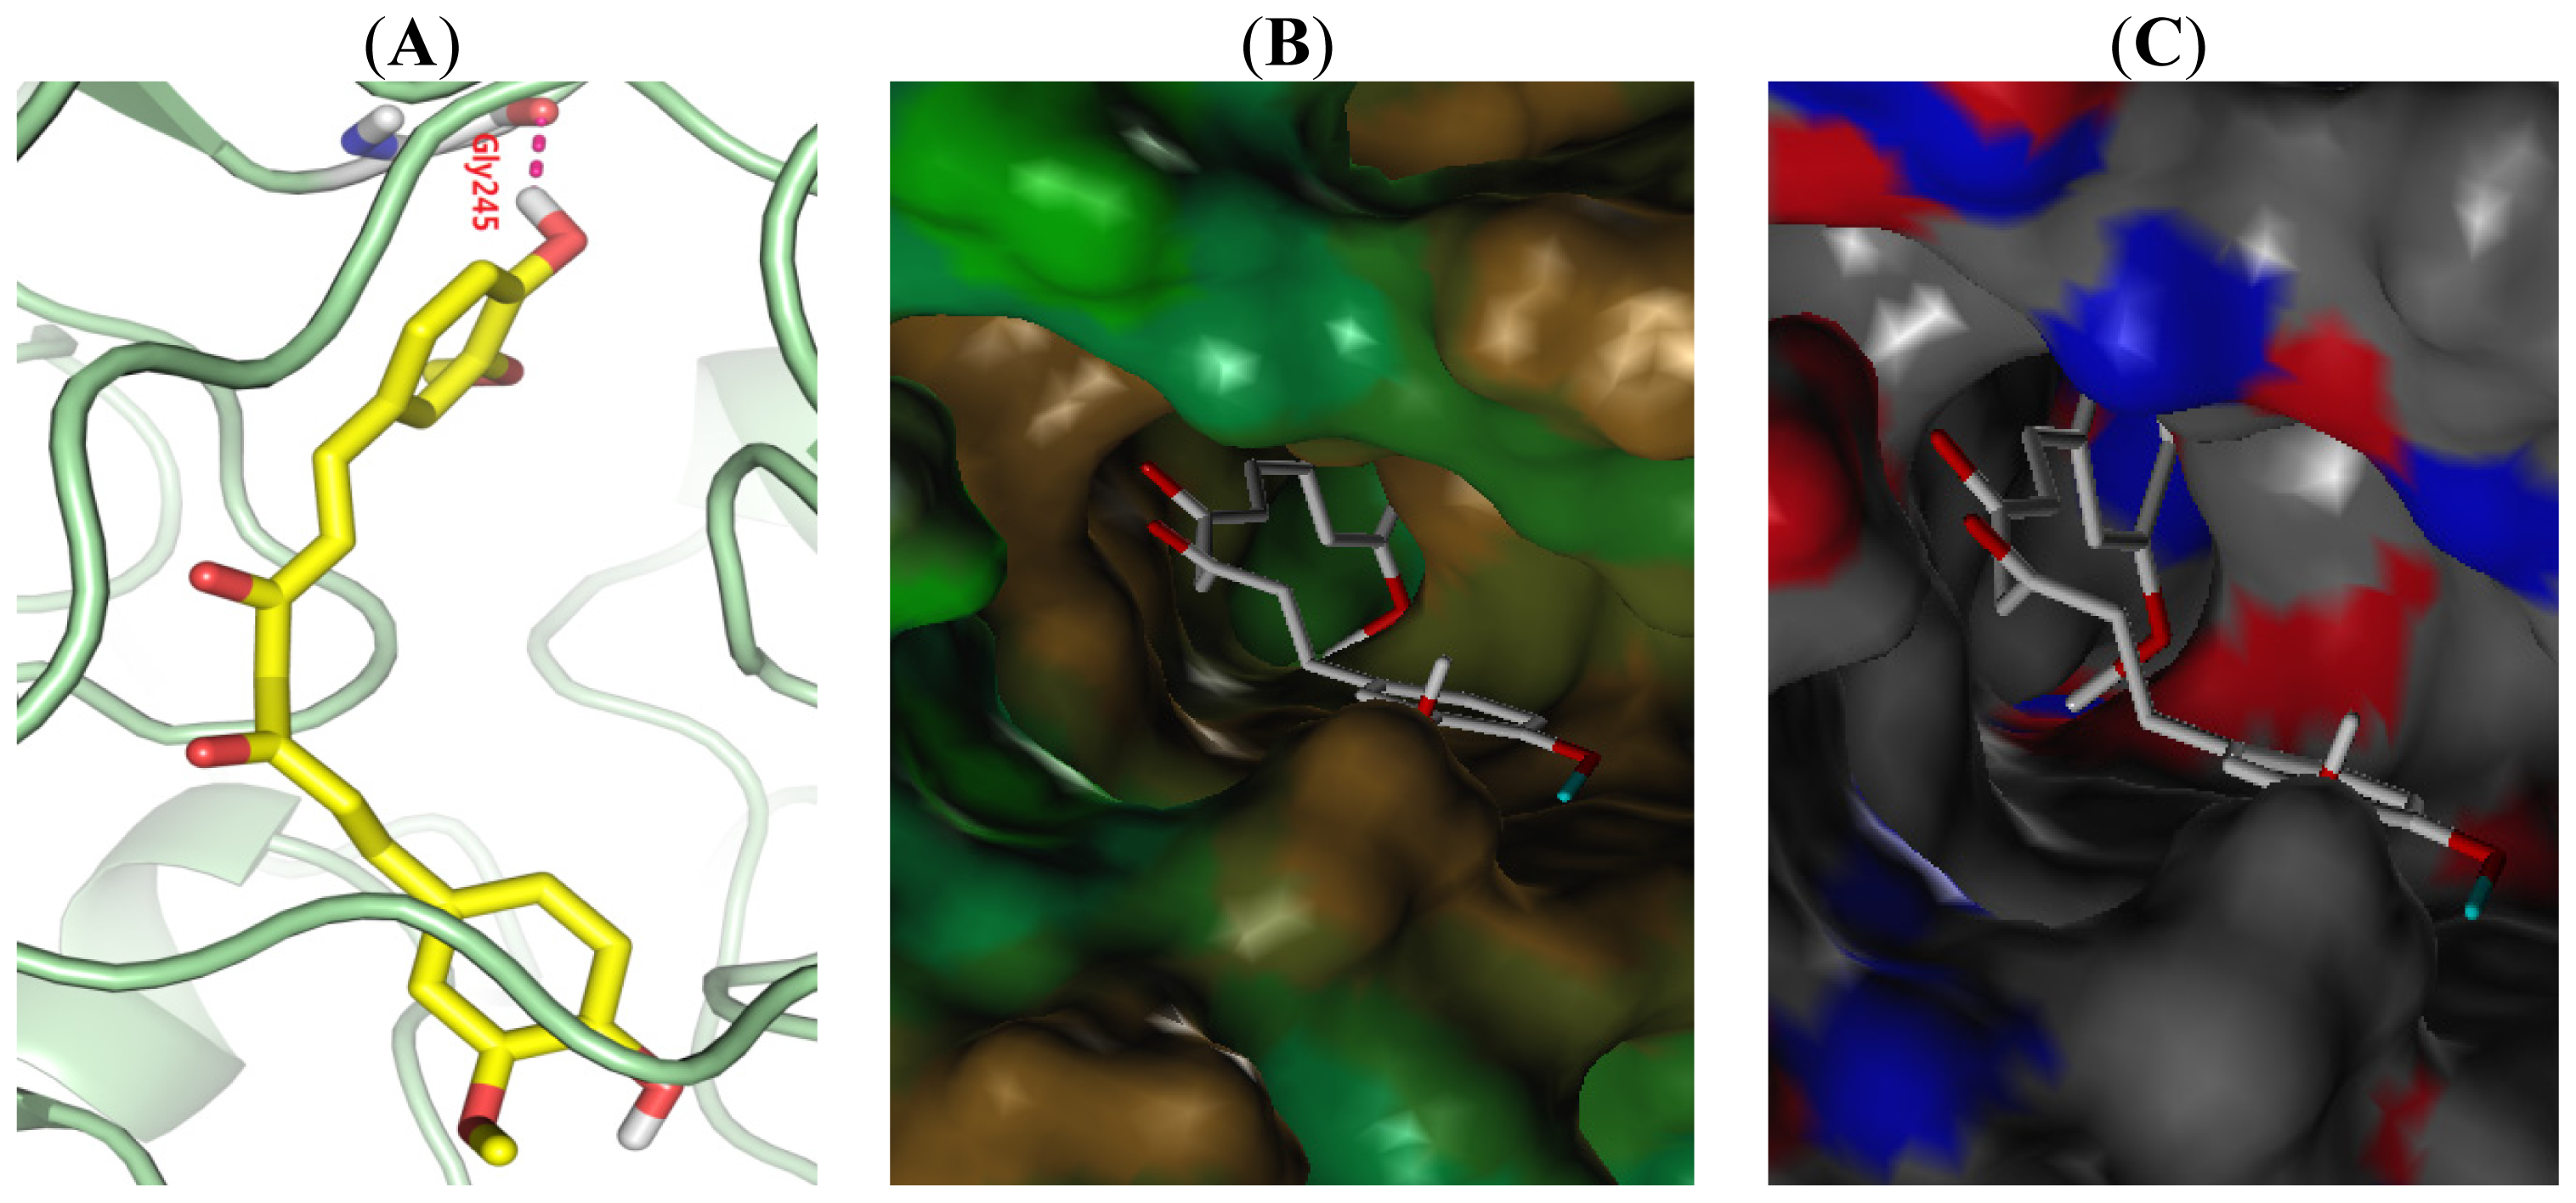
2.5. Binding Model Analysis
3. Materials and Methods
3.1. Materials
3.2. Measurement of ALDH1 Activity and Data Set
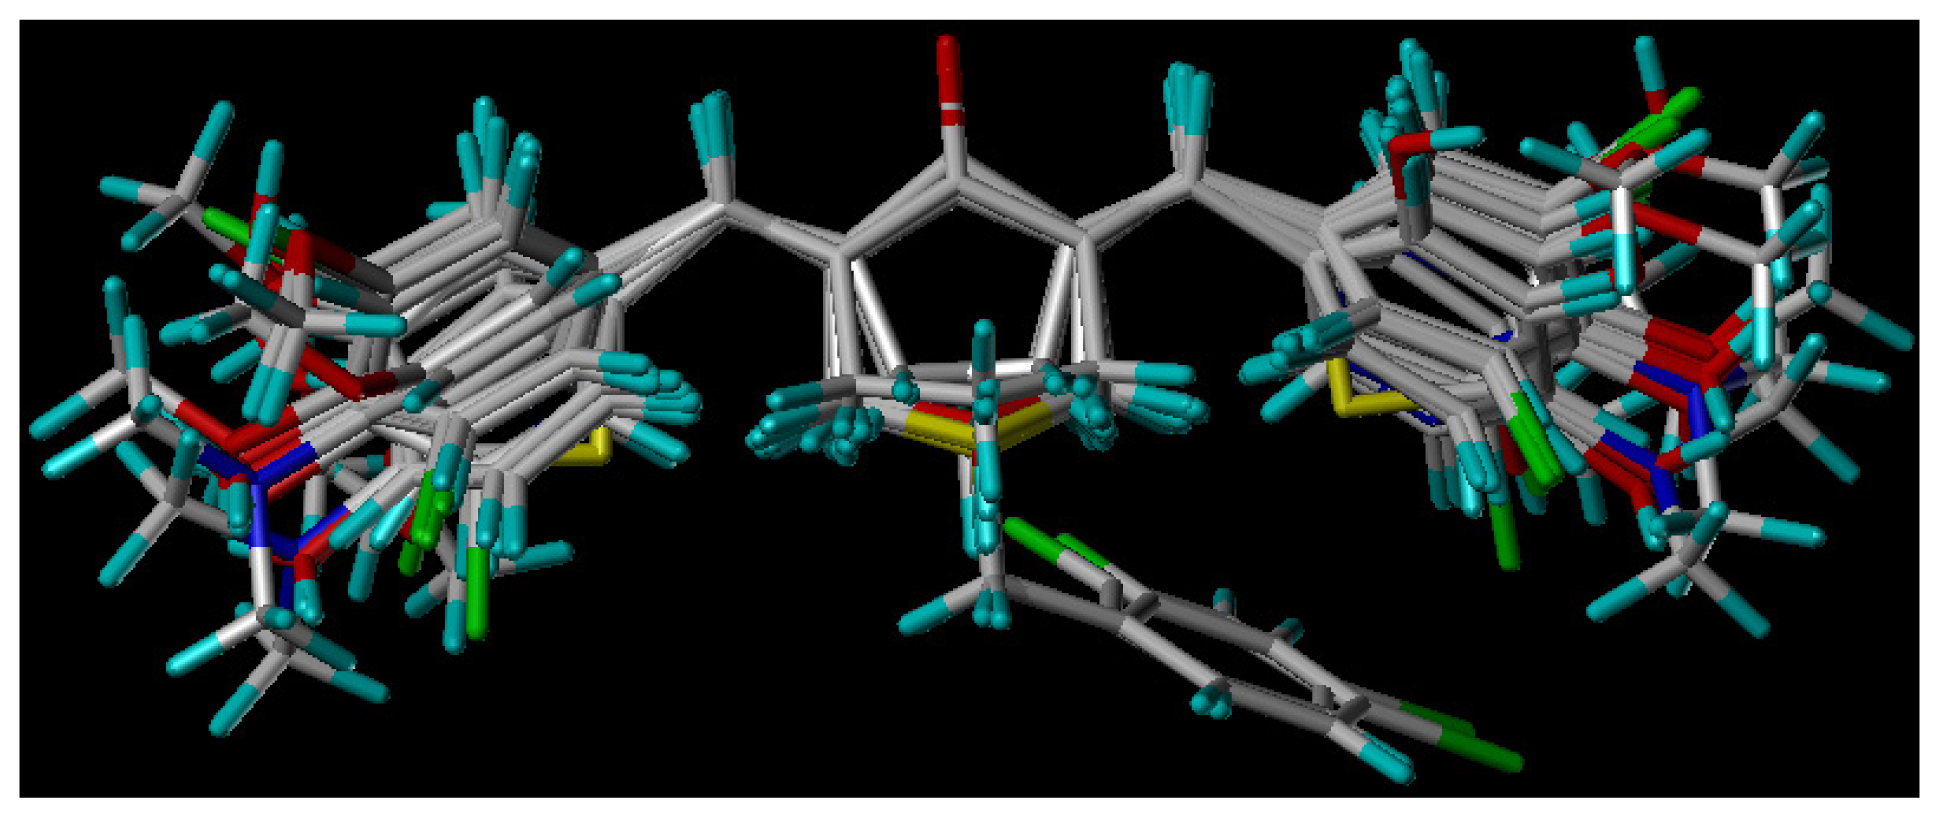
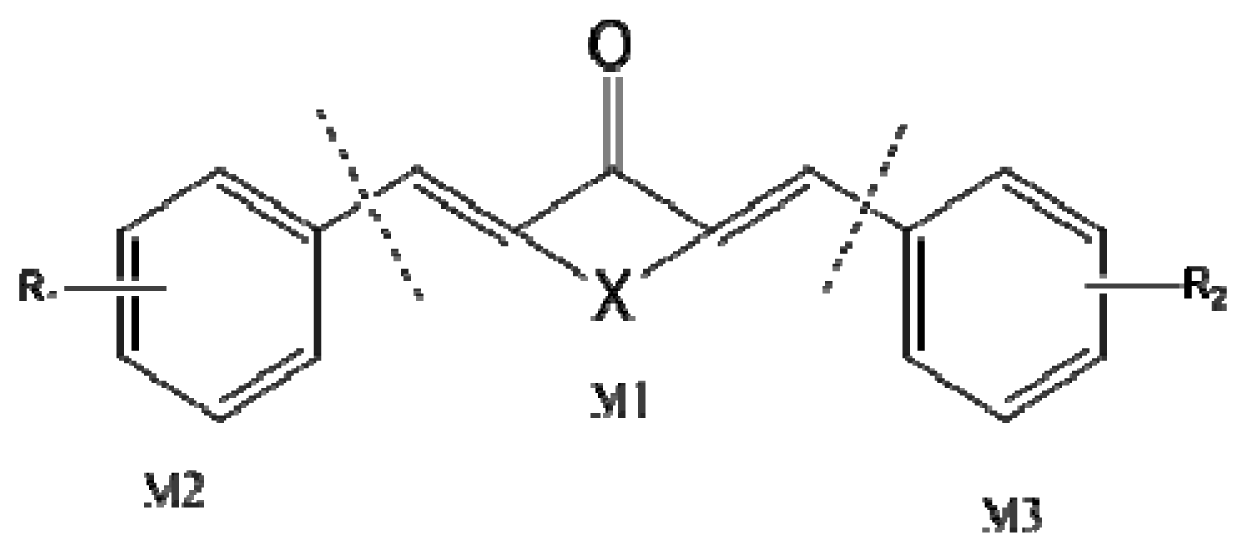
3.3. Molecular Modeling and Alignment
3.4. 3D-QSAR Models
3.5. Molecular Docking
4. Conclusions
Acknowledgments
Conflicts of Interest
- Author ContributionsZhiyun Du and Xi Zheng got the idea; Hui Wang, Yan He and Qiuyan Zhang did the experiment; Hui Wang, Changyuan Zhang and Zhikai Zhang analyzed the data; Hui Wang, Zhiyun Du and Jun Zhao wrote the paper.
References
- Kelson, T.L.; Secor McVoy, J.R.; Rizzo, W.B. Human liver fatty aldehyde dehydrogenase: Microsomal localization, purification, and biochemical characterization. Biochim. Biophys. Acta 1997, 1335, 99–110. [Google Scholar]
- Jester, J.V.; Moller-Pedersen, T.; Huang, J.; Sax, C.M.; Kays, W.T.; Cavangh, H.D.; Petroll, W.M.; Piatigorsky, J. The cellular basis of corneal transparency: Evidence for “corneal crystallins”. J. Cell Sci 1999, 112, 613–622. [Google Scholar]
- Hilton, J. Role of aldehyde dehydrogenase in cyclophosphamide-resistant L1210 leukemia. Cancer Res 1984, 44, 5156–5160. [Google Scholar]
- Russo, J.E.; Hilton, J. Characterization of cytosolic aldehyde dehydrogenase from cyclophosphamide resistant L1210 cells. Cancer Res 1988, 48, 2963–2968. [Google Scholar]
- Moreb, J.S.; Maccow, C.; Schweder, M.; Hecomovich, J. Expression of antisense RNA to aldehyde dehydrogenase class-1 sensitizes tumor cells to 4-hydroperoxycyclophosphamide in vitro. J. Pharmacol. Exp. Ther. 2000, 293, 390–396. [Google Scholar]
- Moreb, J.S.; Gabr, A.; Vartikar, G.R.; Gowda, S.; Zucali, J.R.; Mohuczy, D. Retinoic acid down-regulates aldehyde dehydrogenase and increases cytotoxicity of 4-hydroperoxycyclophosphamide and acetaldehyde. J. Pharmacol. Exp. Ther 2005, 312, 339–345. [Google Scholar]
- Mu, X.; Isaac, C.; Greco, N.; Huard, J.; Weiss, K. Notch Signaling is associated with ALDH activity and an aggressive metastatic phenotype in murine osteosarcoma cells. Front. Oncol 2013, 3, 143. [Google Scholar]
- Mu, X.; Isaac, C.; Greco, N.; Huard, J.; Weiss, K. Rapamycin inhibits ALDH activity, resistance to oxidative stress, and metastatic potential in murine osteosarcoma cells. Sarcoma 2013, 2013, 480713. [Google Scholar]
- Quash, G.; Fournet, G.; Chantepie, J.; Gore, J.; Ardiet, C.; Ardail, D.; Michal, Y.; Reichert, U. Novel competitive irreversible inhibitors of aldehyde dehydrogenase (ALDH1): Restoration of chemosensitivity of L1210 cells overexpressing ALDH1 and induction of apoptosis in BAF(3) cells overexpressing bcl(2). Biochem. Pharmacol 2002, 64, 1279–1292. [Google Scholar]
- Quash, G.; Fournet, G.; Courvoisier, C.; Martinez, R.M.; Chantepie, J.; Paret, M.J.; Pharaboz, J.; Joly-Pharaboz, M.O.; Goré, J.; André, J.; et al. Aldehyde dehydrogenase inhibitors: Alpha, beta-acetylenic N-substituted aminothiolesters are reversible growth inhibitors of normal epithelial but irreversible apoptogens for cancer epithelial cells from human prostate in culture. Eur. J. Med. Chem 2008, 43, 906–916. [Google Scholar]
- Fournet, G.; Martin, G.; Quash, G. α,β-Acetylenic amino thiolester inhibitors of aldehyde dehydrogenases 1&3: Suppressors of apoptogenic aldehyde oxidation and activators of apoptosis. Curr. Med. Chem 2013, 20, 527–533. [Google Scholar]
- Noorafshan, A.; Ashkani-Esfahani, S. A review of therapeutic effects of curcumin. Curr. Pharm. Des 2013, 19, 2032–2046. [Google Scholar]
- Du, Z.Y.; Liu, R.R.; Shao, W.Y.; Mao, X.P.; Ma, L.; Gu, L.Q.; Huang, Z.S.; Chan, A.S. Alpha-glucosidase inhibition of natural curcuminoids and curcumin analogs. Eur. J. Med. Chem 2006, 41, 213–218. [Google Scholar]
- Wei, X.; Du, Z.Y.; Zheng, X.; Cui, X.X.; Conney, A.H.; Zhang, K. Synthesis and evaluation of curcumin-related compounds for anticancer activity. Eur. J. Med. Chem 2012, 53, 235–245. [Google Scholar]
- Zhang, K.; Du, Z.Y.; Conney, A.H.; Zheng, X.; Wei, X.C.; Mo, R.Q.; Fang, Y.X.; Lu, Y.J.; Huang, B.H.; Tang, Z.K.; et al. The synthesis and application of 1,5-diphenylpenta-1,4-dien-ketone derivative CN 102180849A, 14 September 2011.
- Quemener, V.; Quash, G.; Moulinoux, J.P.; Penlap, V.; Ripoll, H.; Havouis, R.; Doutheau, A.; Goré, J. In vivo antitumor activity of 4-amino 4-methyl 2-pentyne 1-al, an inhibitor of aldehyde dehydrogenase. In Vivo 1989, 3, 325–330. [Google Scholar]
- Ji, Y.; Shu, M. Combined 3D-QSAR modeling and molecular docking study on azacycles CCR5 antagonists. J. Mol. Struct 2013, 1045, 35–41. [Google Scholar]
- Xu, G.; Chu, Y.; Jiang, N.; Yang, J.; Li, F. The three dimensional quantitative structure activity relationships (3d-qsar) and docking studies of curcumin derivatives as androgen receptor antagonists. Int. J. Mol. Sci 2012, 13, 6138–6155. [Google Scholar]
- Lowe, E.D.; Gao, G.Y.; Johnson, L.N.; Keung, W.M. Structure of daidzin, a naturally occurring anti-alcohol-addiction agent, in complex with human mitochondrial aldehyde dehydrogenase. J. Med. Chem 2008, 51, 4482–4487. [Google Scholar]
- Du, Z.Y.; Tang, Z.K.; Lu, Y.J.; Tu, Z.Q. Study and application of docking on curcumin analogues and tyrosinase. Comput. Appl. Chem 2011, 28, 531–534. [Google Scholar]
- Moore, S.A.; Baker, H.M.; Blythe, T.J.; Kitson, K.E.; Kitson, T.M.; Baker, E.N. Sheep liver cytosolic aldehyde dehydrogenase: The structure reveals the basis for the retinal specificity of class 1 aldehyde dehydrogenases. Structure 1998, 6, 1541–1551. [Google Scholar]


 | ||||||
|---|---|---|---|---|---|---|
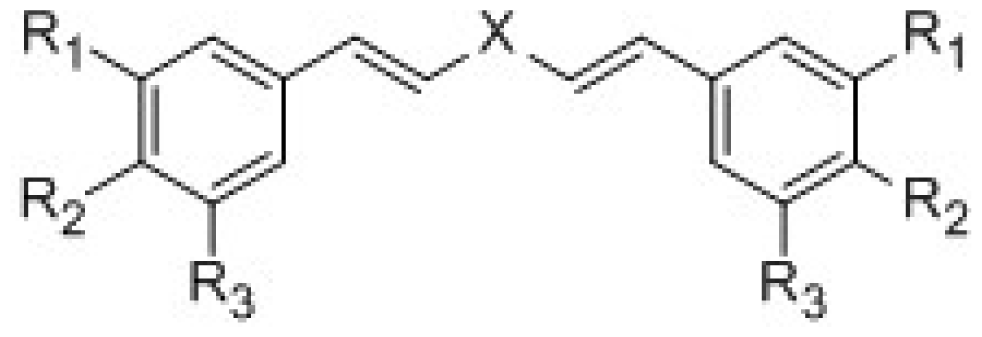
| Compounds | X | R1 | R2 | R3 | IC50 μmol/L | pIC50 |
| 1 | 1-(4-Br-2-F)4-piperidinone | OCH3 | OH | OCH3 | 31.2 | 4.51 |
| 2 | 1-(4-Br-2-F)4-piperidinone | OH | OH | H | 33.5 | 4.47 |
| 3 | 4-piperidinone | OCH3 | OH | OCH3 | 30.0 | 4.52 |
| 4 | 4-piperidinone | OH | OH | H | 39.4 | 4.40 |
| 5 | Acetone | OH | OH | H | 23.6 | 4.63 |
| 6 | cyclopentanone | OH | OH | H | 3.41 | 5.46 |
| 7 | cyclohexanone | OH | OH | H | 6.5 | 5.20 |
| 8 | tetrahydropyran-4-ones | OH | OH | H | 7.9 | 5.10 |
| 9 | tetrahydrothiopyran-4-one | OH | OH | H | 22.7 | 4.64 |
| 10 | cyclopentanone | H | OH | H | 54.2 | 4.20 |
| 11 | tetrahydropyran-4-ones | H | OH | H | 39.7 | 4.41 |
| 12 | cyclopentanone | OH | H | OH | 43.2 | 4.36 |
| 13 | cyclopentanone | OCH3 | OH | H | 24.2 | 4.62 |
| 14 | tetrahydrothiopyran-4-one | OCH3 | OH | H | 31.3 | 4.50 |
| 15 | tetrahydropyran-4-ones | OCH3 | OH | OCH3 | 16.6 | 4.78 |
| 16 | tetrahydropyran-4-ones | OCH3 | OH | F | 53.2 | 4.27 |
| 17 | Acetone | Br | OH | Br | 25.8 | 4.59 |
| 18 | cyclohexanone | Br | OH | Br | 17.5 | 4.76 |
| 19 | tetrahydropyran-4-ones | Br | OH | Br | 18.7 | 4.73 |
| 20 | tetrahydrothiopyran-4-one | Br | OH | Br | 17.7 | 4.75 |
| 21 | tetrahydrothiopyran-4-one | OCH3 | OCH3 | OCH3 | 63.1 | 4.20 |
| 22 | cyclohexanone | H | N(CH3)2 | H | 73.5 | 4.13 |
| 23 | tetrahydrothiopyran-4-one | H | N(CH3)2 | H | 69.4 | 4.16 |
| 24 | cyclohexanone | H | Br | H | 8.20 | 5.08 |
 | ||||||
| Compounds | X | R | IC50 μmol/L | pIC50 | ||
| 25 | Cyclopentanone | 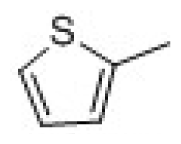 | 30.1 | 4.53 | ||
| 26 | tetrahydrothiopyran-4-one | 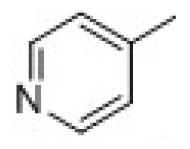 | 10.6 | 4.97 | ||
| 27 | cyclohexanone | | 63.2 | 4.22 | ||
| 28 | Cyclohexanone | | 73.4 | 4.13 | ||
| 29 | Cyclopentanone | 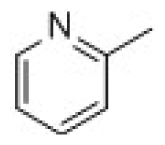 | 13.7. | 4.86 | ||
| 30 | Cyclohexanone | | 18.4 | 4.74 | ||
| Curcumin | 36.9 | 4.43 | ||||
| Disufiram | 2.91 | 5.54 | ||||
| Statistical | q2 | N | r2 | SEE | F | Field Contribution | ||||
|---|---|---|---|---|---|---|---|---|---|---|
| S | E | H | D | A | ||||||
| CoMFA | 0.606 | 9 | 0.999 | 0.011 | 2577.847 | 0.552 | 0.448 | |||
| CoMFA | 0.597 | 8 | 0.998 | 0.018 | 990.030 | 0.554 | 0.446 | |||
| SE | 0.608 | 9 | 0.999 | 0.082 | 1924.926 | 0.386 | 0.614 | |||
| SHE | 0.434 | 6 | 0.945 | 0.045 | 93.12 | 0.294 | 0.420 | 0.287 | ||
| SED | 0.56 | 6 | 0.987 | 0.031 | 210.105 | 0.287 | 0.3785 | 0.338 | ||
| SEA | 0.443 | 3 | 0.848 | 0.134 | 40.891 | 0.27 | 0.388 | 0.342 | ||
| SEHD | 0.477 | 3 | 0.902 | 0.107 | 67.688 | 0.219 | 0.305 | 0.182 | 0.293 | |
| SEDA | 0.484 | 5 | 0.968 | 0.064 | 121.317 | 0.207 | 0.295 | 0.301 | 0.197 | |
| SEHA | 0.383 | 3 | 0.862 | 0.128 | 45.79 | 0.207 | 0.319 | 0.196 | 0.278 | |
| SEHDA | 0.421 | 4 | 0.945 | 0.083 | 89.839 | 0.166 | 0.269 | 0.139 | 0.247 | 0.179 |
| Compounds | Actual | CoMFA | CoMSIA | ||
|---|---|---|---|---|---|
| Predicted | Residues | Predicted | Residues | ||
| 1 | 4.51 | 4.533 | −0.023 | 4.540 | −0.030 |
| 2 | 4.47 | 4.466 | 0.004 | 4.431 | 0.039 |
| 3 | 4.52 | 4.503 | 0.017 | 4.546 | −0.026 |
| 4 | 4.40 | 4.418 | −0.018 | 4.433 | −0.033 |
| 5 | 4.63 | 4.704 | −0.074 | 4.630 | 0.000 |
| 6 | 5.34 | 5.341 | −0.001 | 5.360 | −0.020 |
| 7 | 5.20 | 5.107 | 0.093 | 5.109 | 0.091 |
| 8 | 5.10 | 5.095 | 0.005 | 5.102 | −0.002 |
| 9* | 4.64 | 4.763 | −0.123 | 4.894 | −0.254 |
| 10* | 4.20 | 4.557 | −0.357 | 4.404 | −0.204 |
| 11 | 4.41 | 4.503 | −0.093 | 4.542 | −0.132 |
| 12 | 4.36 | 4.318 | 0.042 | 4.333 | 0.027 |
| 13 | 4.62 | 4.674 | −0.054 | 4.528 | 0.092 |
| 14 | 4.50 | 4.483 | 0.017 | 4.533 | −0.033 |
| 15* | 4.78 | 4.556 | 0.224 | 4.919 | −0.139 |
| 16 | 4.27 | 4.307 | −0.037 | 4.277 | −0.007 |
| 17 | 4.59 | 4.632 | −0.042 | 4.598 | −0.008 |
| 18 | 4.76 | 4.825 | −0.065 | 4.754 | 0.006 |
| 19 | 4.73 | 4.672 | 0.058 | 4.733 | −0.003 |
| 20 | 4.75 | 4.705 | 0.045 | 4.683 | 0.067 |
| 21 | 4.20 | 4.138 | 0.062 | 4.804 | −0.604 |
| 22 | 4.13 | 4.154 | −0.024 | 4.133 | −0.003 |
| 23 | 4.16 | 4.152 | 0.008 | 4.124 | 0.036 |
| 24* | 5.08 | 4.965 | 0.115 | 4.746 | 0.334 |
| 25 | 4.53 | 4.540 | −0.01 | 4.646 | −0.116 |
| 26 | 4.97 | 4.885 | 0.085 | 4.685 | 0.285 |
| 27 | 4.22 | 4.199 | 0.021 | 4.202 | 0.018 |
| 28 | 4.13 | 4.103 | 0.027 | 4.131 | −0.001 |
| 29 | 4.86 | 4.825 | 0.035 | 4.885 | −0.025 |
| 30 | 4.74 | 4.709 | 0.031 | 4.808 | −0.068 |
| (a) | (b) | (c) | |||||||
|---|---|---|---|---|---|---|---|---|---|
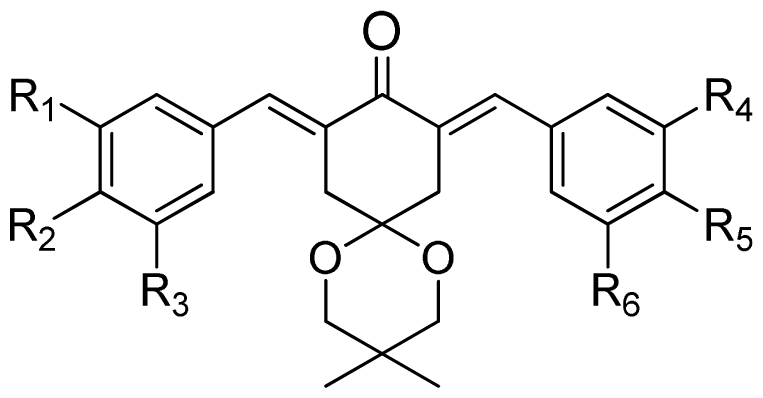 | 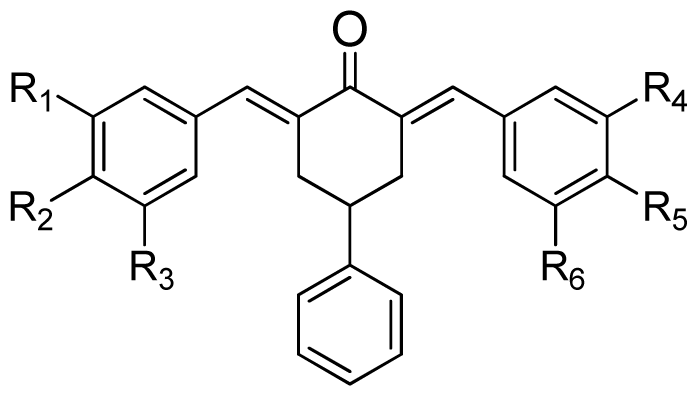 | 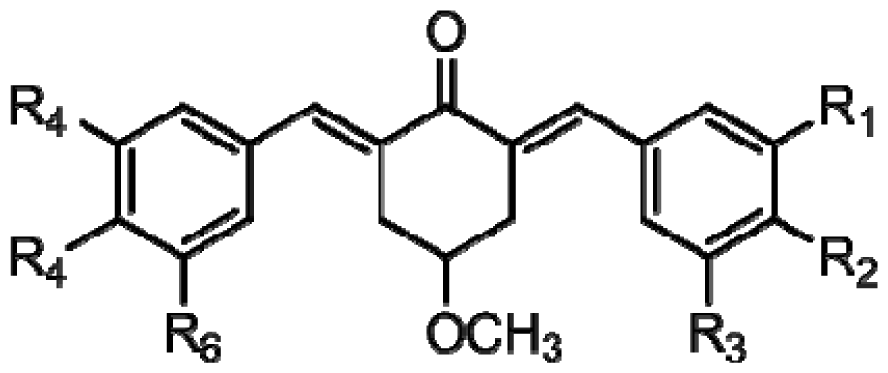 | |||||||
| Compound | Tail | R1 | R2 | R3 | R4 | R5 | R6 | Predict pIC50 | |
| CoMFA | CoMSIA | ||||||||
| 1 | a | H | OH | H | H | OCH3 | H | 5.016 | 4.858 |
| 2 | a | H | OH | H | H | OCH3 | OCH3 | 5.868 | 6.124 |
| 3 | a | H | OH | H | OCH3 | OCH3 | OCH3 | 5.997 | 6.077 |
| 4 | a | OH | OH | H | H | OCH3 | H | 6.173 | 5.766 |
| 5 | a | OH | OH | H | OCH3 | OCH3 | H | 5.815 | 6.096 |
| 6 | a | OH | OH | H | OCH3 | OCH3 | OCH3 | 5.689 | 5.966 |
| 7 | a | H | Br | H | H | OCH3 | H | 5.542 | 6.079 |
| 8 | a | H | Br | H | OCH3 | OCH3 | H | 5.689 | 5.993 |
| 9 | a | H | Br | H | OCH3 | OCH3 | OCH3 | 5.257 | 5.857 |
| 10 | b | H | OH | H | H | OCH3 | H | 5.687 | 6.100 |
| 11 | b | H | OH | H | H | OCH3 | OCH3 | 5.974 | 6.240 |
| 12 | b | H | OH | H | OCH3 | OCH3 | OCH3 | 5.370 | 5.725 |
| 13 | b | OH | OH | H | H | OCH3 | H | 6.062 | 6.127 |
| 14 | b | OH | OH | H | OCH3 | OCH3 | H | 6.034 | 6.332 |
| 15 | b | OH | OH | H | OCH3 | OCH3 | OCH3 | 5.141 | 5.739 |
| 16 | b | H | Br | H | H | OCH3 | H | 6.116 | 6.031 |
| 17 | b | H | Br | H | OCH3 | OCH3 | H | 6.061 | 5.991 |
| 18 | b | H | Br | H | OCH3 | OCH3 | OCH3 | 5.089 | 5.859 |
| 19 | c | H | OH | H | H | OCH3 | H | 4.800 | 4.785 |
| 20 | c | H | OH | H | H | OCH3 | OCH3 | 6.109 | 6.199 |
| 21 | c | H | OH | H | OCH3 | OCH3 | OCH3 | 5.961 | 5.926 |
| 22 | c | OH | OH | H | H | OCH3 | H | 6.097 | 6.077 |
| 23 | c | OH | OH | H | OCH3 | OCH3 | H | 6.062 | 5.914 |
| 24 | c | OH | OH | H | OCH3 | OCH3 | OCH3 | 5.753 | 5.914 |
| 25 | c | H | Br | H | H | OCH3 | H | 6.168 | 6.128 |
| 26 | c | H | Br | H | OCH3 | OCH3 | H | 6.104 | 6.253 |
| 27 | c | H | Br | H | OCH3 | OCH3 | OCH3 | 6.028 | 5.842 |
© 2014 by the authors; licensee MDPI, Basel, Switzerland This article is an open access article distributed under the terms and conditions of the Creative Commons Attribution license (http://creativecommons.org/licenses/by/3.0/).
Share and Cite
Wang, H.; Du, Z.; Zhang, C.; Tang, Z.; He, Y.; Zhang, Q.; Zhao, J.; Zheng, X. Biological Evaluation and 3D-QSAR Studies of Curcumin Analogues as Aldehyde Dehydrogenase 1 Inhibitors. Int. J. Mol. Sci. 2014, 15, 8795-8807. https://doi.org/10.3390/ijms15058795
Wang H, Du Z, Zhang C, Tang Z, He Y, Zhang Q, Zhao J, Zheng X. Biological Evaluation and 3D-QSAR Studies of Curcumin Analogues as Aldehyde Dehydrogenase 1 Inhibitors. International Journal of Molecular Sciences. 2014; 15(5):8795-8807. https://doi.org/10.3390/ijms15058795
Chicago/Turabian StyleWang, Hui, Zhiyun Du, Changyuan Zhang, Zhikai Tang, Yan He, Qiuyan Zhang, Jun Zhao, and Xi Zheng. 2014. "Biological Evaluation and 3D-QSAR Studies of Curcumin Analogues as Aldehyde Dehydrogenase 1 Inhibitors" International Journal of Molecular Sciences 15, no. 5: 8795-8807. https://doi.org/10.3390/ijms15058795