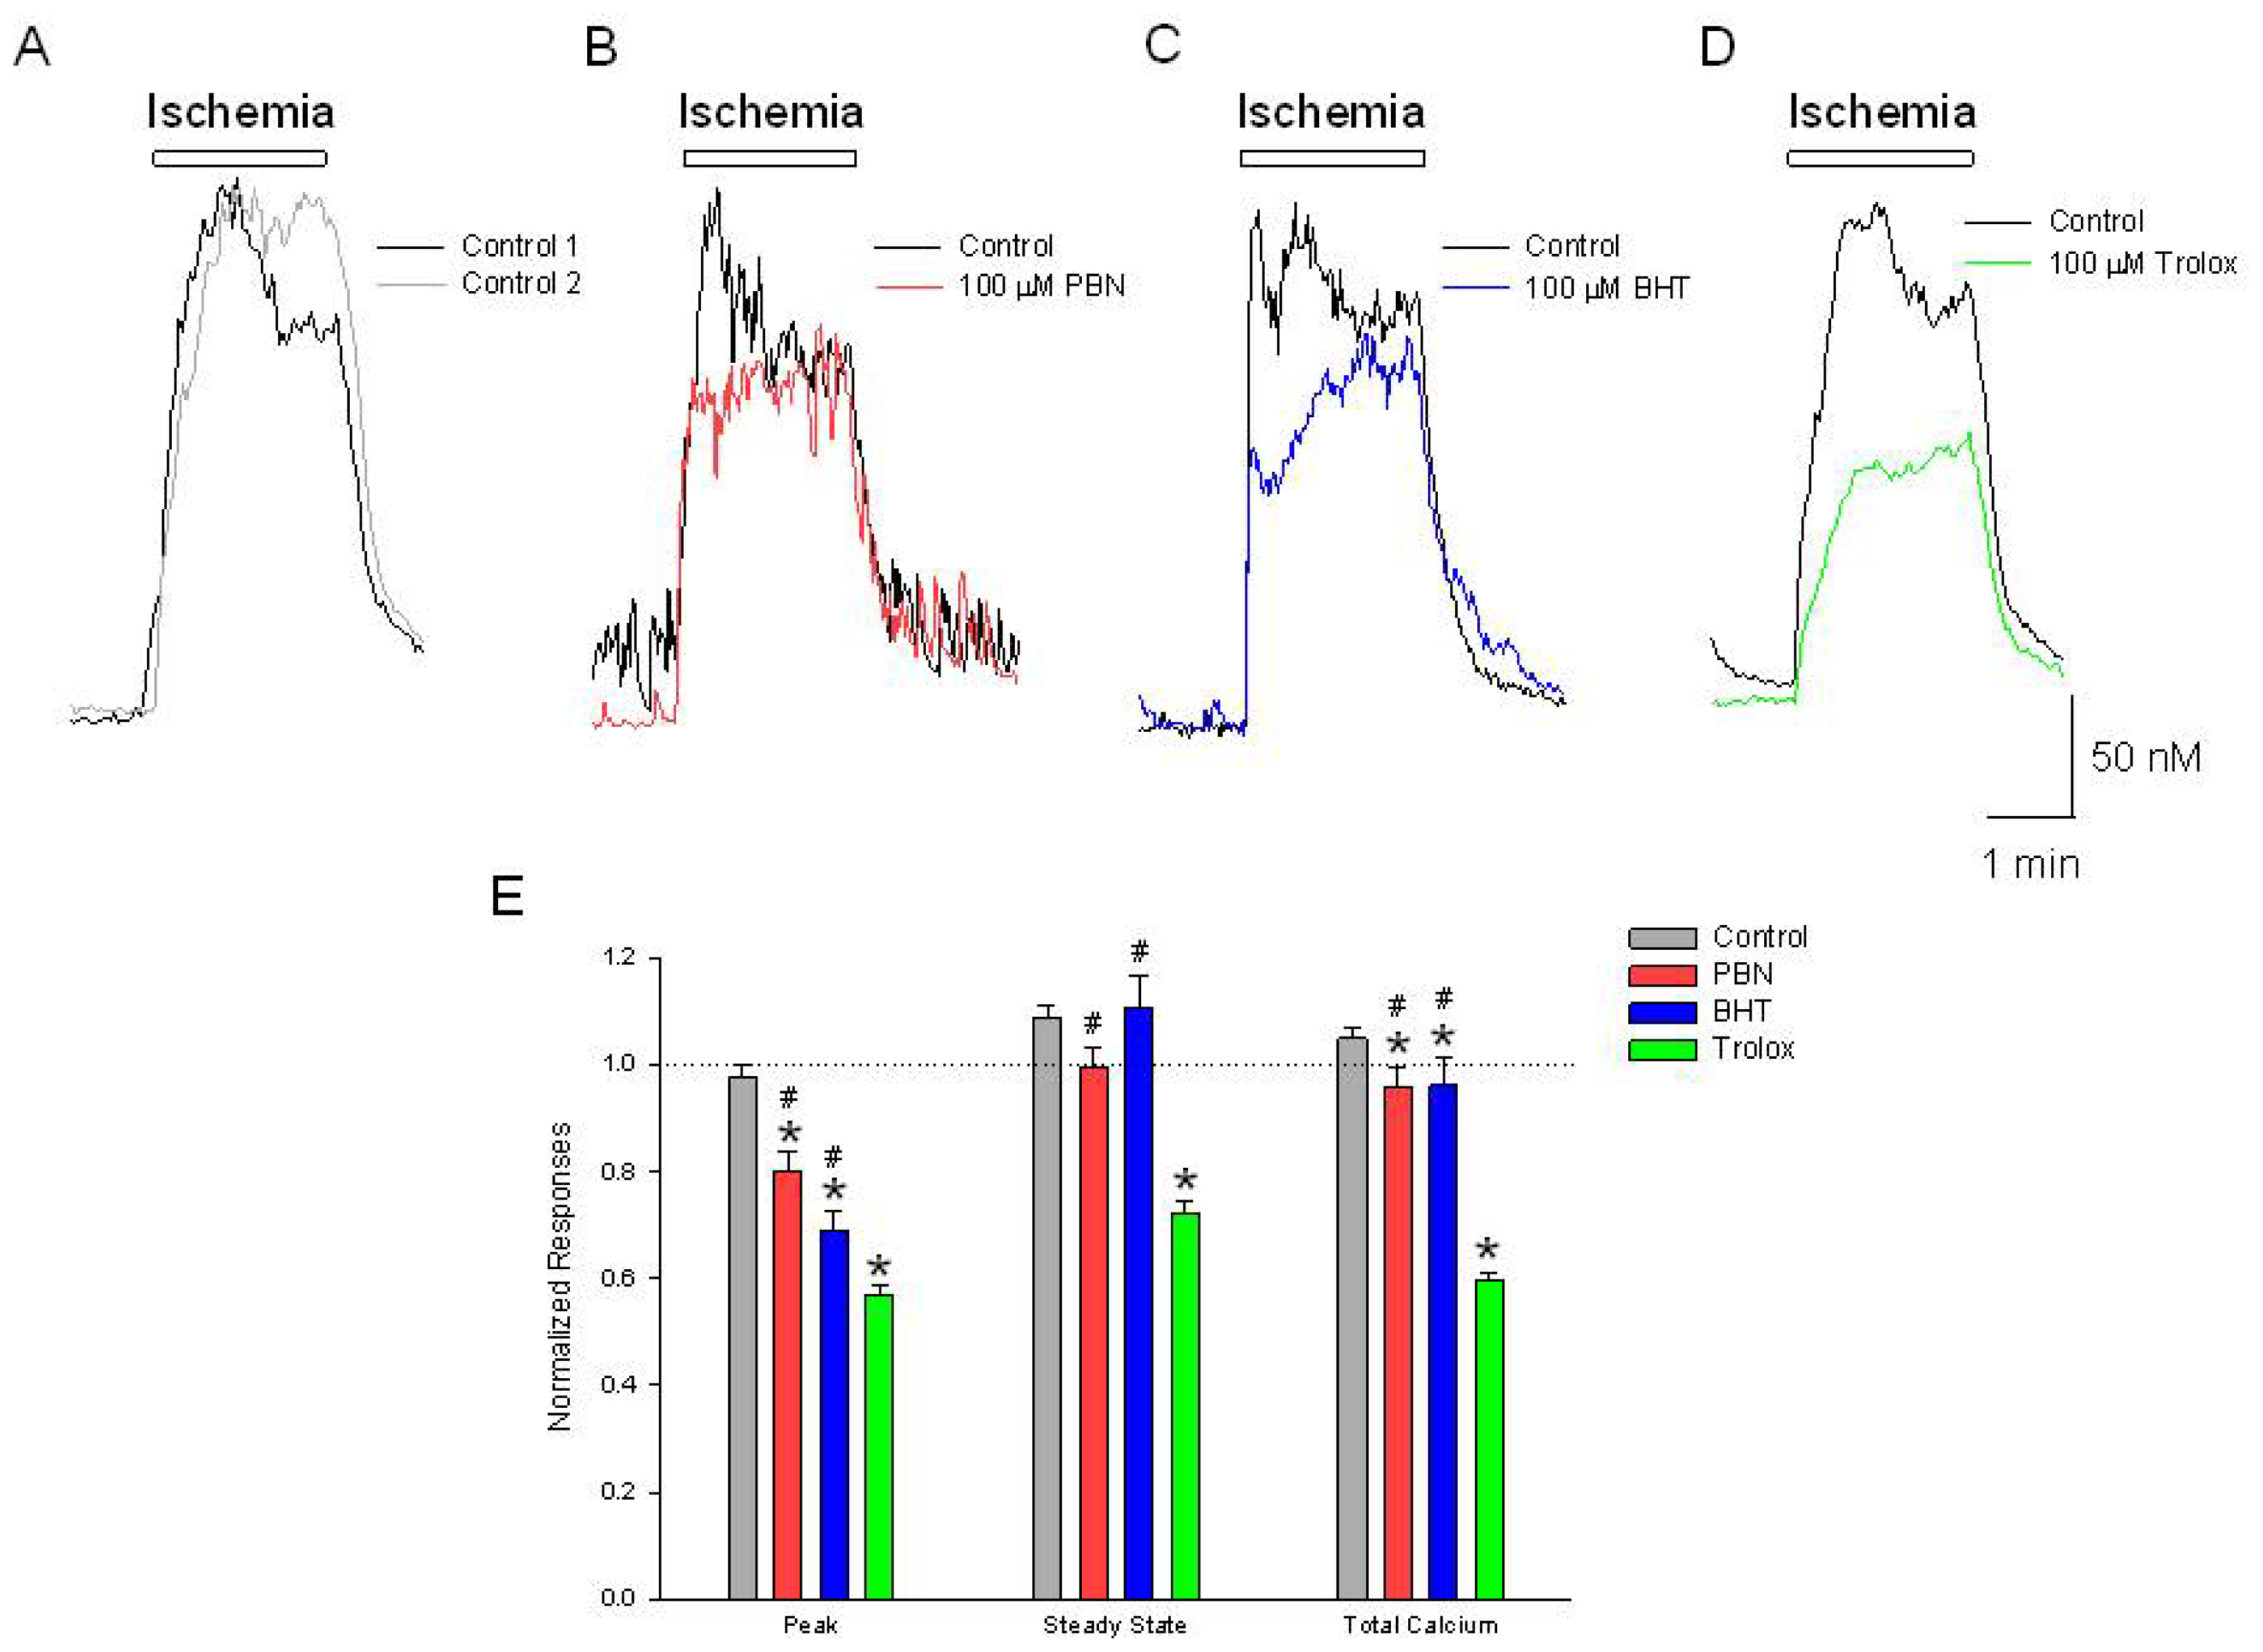
Figure 1.
Ischemia produces increases in [Ca2+]i, are differentially inhibited by Phenyl-N-tert-butylnitrone (PBN), butylated hydroxytoluene (BHT) and trolox. Representative traces of [Ca2+]i, as a function of time during a (A) 2 min application of NaN3 in the absence of glucose. The initial ischemia induced elevation in [Ca2+]i (black trace) was reproducible following a 20 min washout period (gray trace); In separate experiments, following the control ischemic responses (black traces), a 20 min incubation in (B) 100 μM PBN or (C) 100 μM BHT inhibits the initial ischemia-induced increase in [Ca2+]i, (red and blue traces) while (D) 100 μM trolox inhibits the initial as well as the steady state increases in [Ca2+]i (green trace); (E) Summarizing experiments identical to (A–D), second responses recorded in the absence and presence of the three antioxidants were normalized to initial control responses and expressed as means ± S.E.M. Peak, initial [Ca2+]i increase relative to baseline; Steady State, [Ca2+]i measured at end of ischemic episode, relative to baseline; Total Calcium, integration of [Ca2+]i increases from beginning of ischemic event to end of record. One way ANOVA comparison was performed on ratios of test responses/control responses. * p < 0.5 compared to control, and # p < 0.5 compared to trolox. Number of cells measured; Control, n = 225; PBN, n = 93; BHT, n = 131; Trolox, n = 107.
![Ijms 15 03596f1]()
Figure 2.
Initial [Ca2+]i, increases in response to acidosis are inhibited by PBN and BHT but not trolox. Representative traces of [Ca2+]i, as a function of time during a (A) 2 min change in external pH from 7.4 to 6.0 (black trace). Following a 20 min washout, a second acidosis insult (grey trace) induces an approximately 20% reduced elevation in [Ca2+]i. In separate experiments, following the control acidosis application (black traces), a 20 min incubation in (B) 100 μM PBN (red trace) or (C) 100 μM BHT (blue trace) produced decreases in the initial acidosis-induced increases in [Ca2+]i, greater than observed under control conditions; (D) 100 μM trolox failed to significantly decrease the initial increase in [Ca2+]i compared to control but did produce an elevated steady state level (green trace); (E) Summarizing experiments identical to (A–D), second responses recorded in the absence and presence of the three antioxidants were normalized to initial control responses and expressed as means ± S.E.M. Peak, initial [Ca2+]i increase relative to baseline; Steady State, [Ca2+]i measured at end of acidic episode, relative to baseline; Total Calcium, integration of [Ca2+]i increases from beginning of acidic event to end of record. One way ANOVA comparison was performed on ratios of test responses/control responses. * p < 0.5 compared to control, # p < 0.5 compared to trolox, † p < 0.5 compared to BHT. Number of cells measured; Control, n = 280; PBN, n = 107; BHT, n = 138; Trolox, n = 234.
![Ijms 15 03596f2]()
Figure 3.
Initial [Ca2+]i, increases in response to acidic ischemia are inhibited by PBN and BHT. Representative traces of [Ca2+]i, as a function of time during a (A) 2 min application of glucose-free PSS pH 6.0 with 4 mM NaN3 (black trace). Following a 20 min washout, a second application of acidic ischemia induces an approximately equal [Ca2+]i response except for a 20% reduction of the initial peak elevation (grey trace). In separate experiments, following the control acidic ischemia application (black traces), cells were incubated for 20 min in (B) 100 μM PBN or (C) 100 μM BHT prior to a second acidic ischemia insult which produced decreases in the initial elevations in [Ca2+]i and in the rebound peaks following washout, but increased the steady state levels, measured immediately prior to washout, compared to control conditions (red and blue traces, respectively). Incubation in 100 μM trolox (D) failed to significantly decrease the initial increase in [Ca2+]i compared to control but did produce a decrease in the rebound peak (green trace); (E) Summarizing experiments identical to (A–D), second responses recorded in the absence and presence of the three antioxidants were normalized to initial control responses and expressed as means ± S.E.M. Peak, initial [Ca2+]i increase relative to baseline; Steady State, [Ca2+]i measured at end of acidic ischemia episode, relative to baseline; Rebound, [Ca2+]i increase observed after acidic ischemia event measured from baseline (pre-acidic ischemia); Rbd-SS, [Ca2+]i increase observed after acidic ischemia event measured from steady state level (end of acidic ischemia); Total Calcium, integration of [Ca2+]i increases from beginning of acidic ischemia event to end of record. One way ANOVA comparison was performed on ratios of test responses/control responses. * p < 0.5 compared to control, # p < 0.5 compared to trolox, † p < 0.5 compared to BHT. Number of cells measured; Control, n = 271; PBN, n = 107; BHT, n = 176; Trolox, n = 128.
![Ijms 15 03596f3]()
Figure 4.
The rate of [Ca2+]i, increases in response to acidic ischemia are potentiated by PBN and BHT. Expanded, representative traces of the second phase of [Ca2+]i, increases as a function of time during a (A) 2 min application of glucose-free PSS pH 6.0 with 4 mM NaN3 (black trace). Following a 20 min washout, a second application of acidic ischemia induces an approximately equal rate of [Ca2+]i increase (grey trace); Straight lines are linear fits to the data. In separate experiments, following the control acidic ischemia application (black traces), cells were incubated for 20 min in (B) 100 μM PBN or (C) 100 μM BHT prior to a second acidic ischemia insult which produced rates of increase in [Ca2+]i greater than control values (red and blue traces, respectively). Incubation in 100 μM trolox (D) had no effect on the rate of increase in [Ca2+]i compared to control (green trace); (E) Summary of measurements of the slopes of [Ca2+]i increases from experiments identical to (A–D) expressed as means ± S.E.M.. Black bars represent slopes measured from initial control responses and color bars represent slopes from subsequent responses in the absence (gray) and presence of the antioxidants. ** p < 0.001, compared to control by student t-test; (F) Slopes measured from second responses to acidic ischemia recorded in the absence and presence of the three antioxidants were normalized to slopes measured from initial control responses and expressed as means ± S.E.M. One way ANOVA comparison was performed on ratios of test responses/control responses. * p < 0.5 compared to control, # p < 0.5 compared to trolox, † p < 0.5 compared to BHT. Number of cells measured; Control, n = 272; PBN, n = 106; BHT, n = 178; Trolox, n = 131.
![Ijms 15 03596f4]()
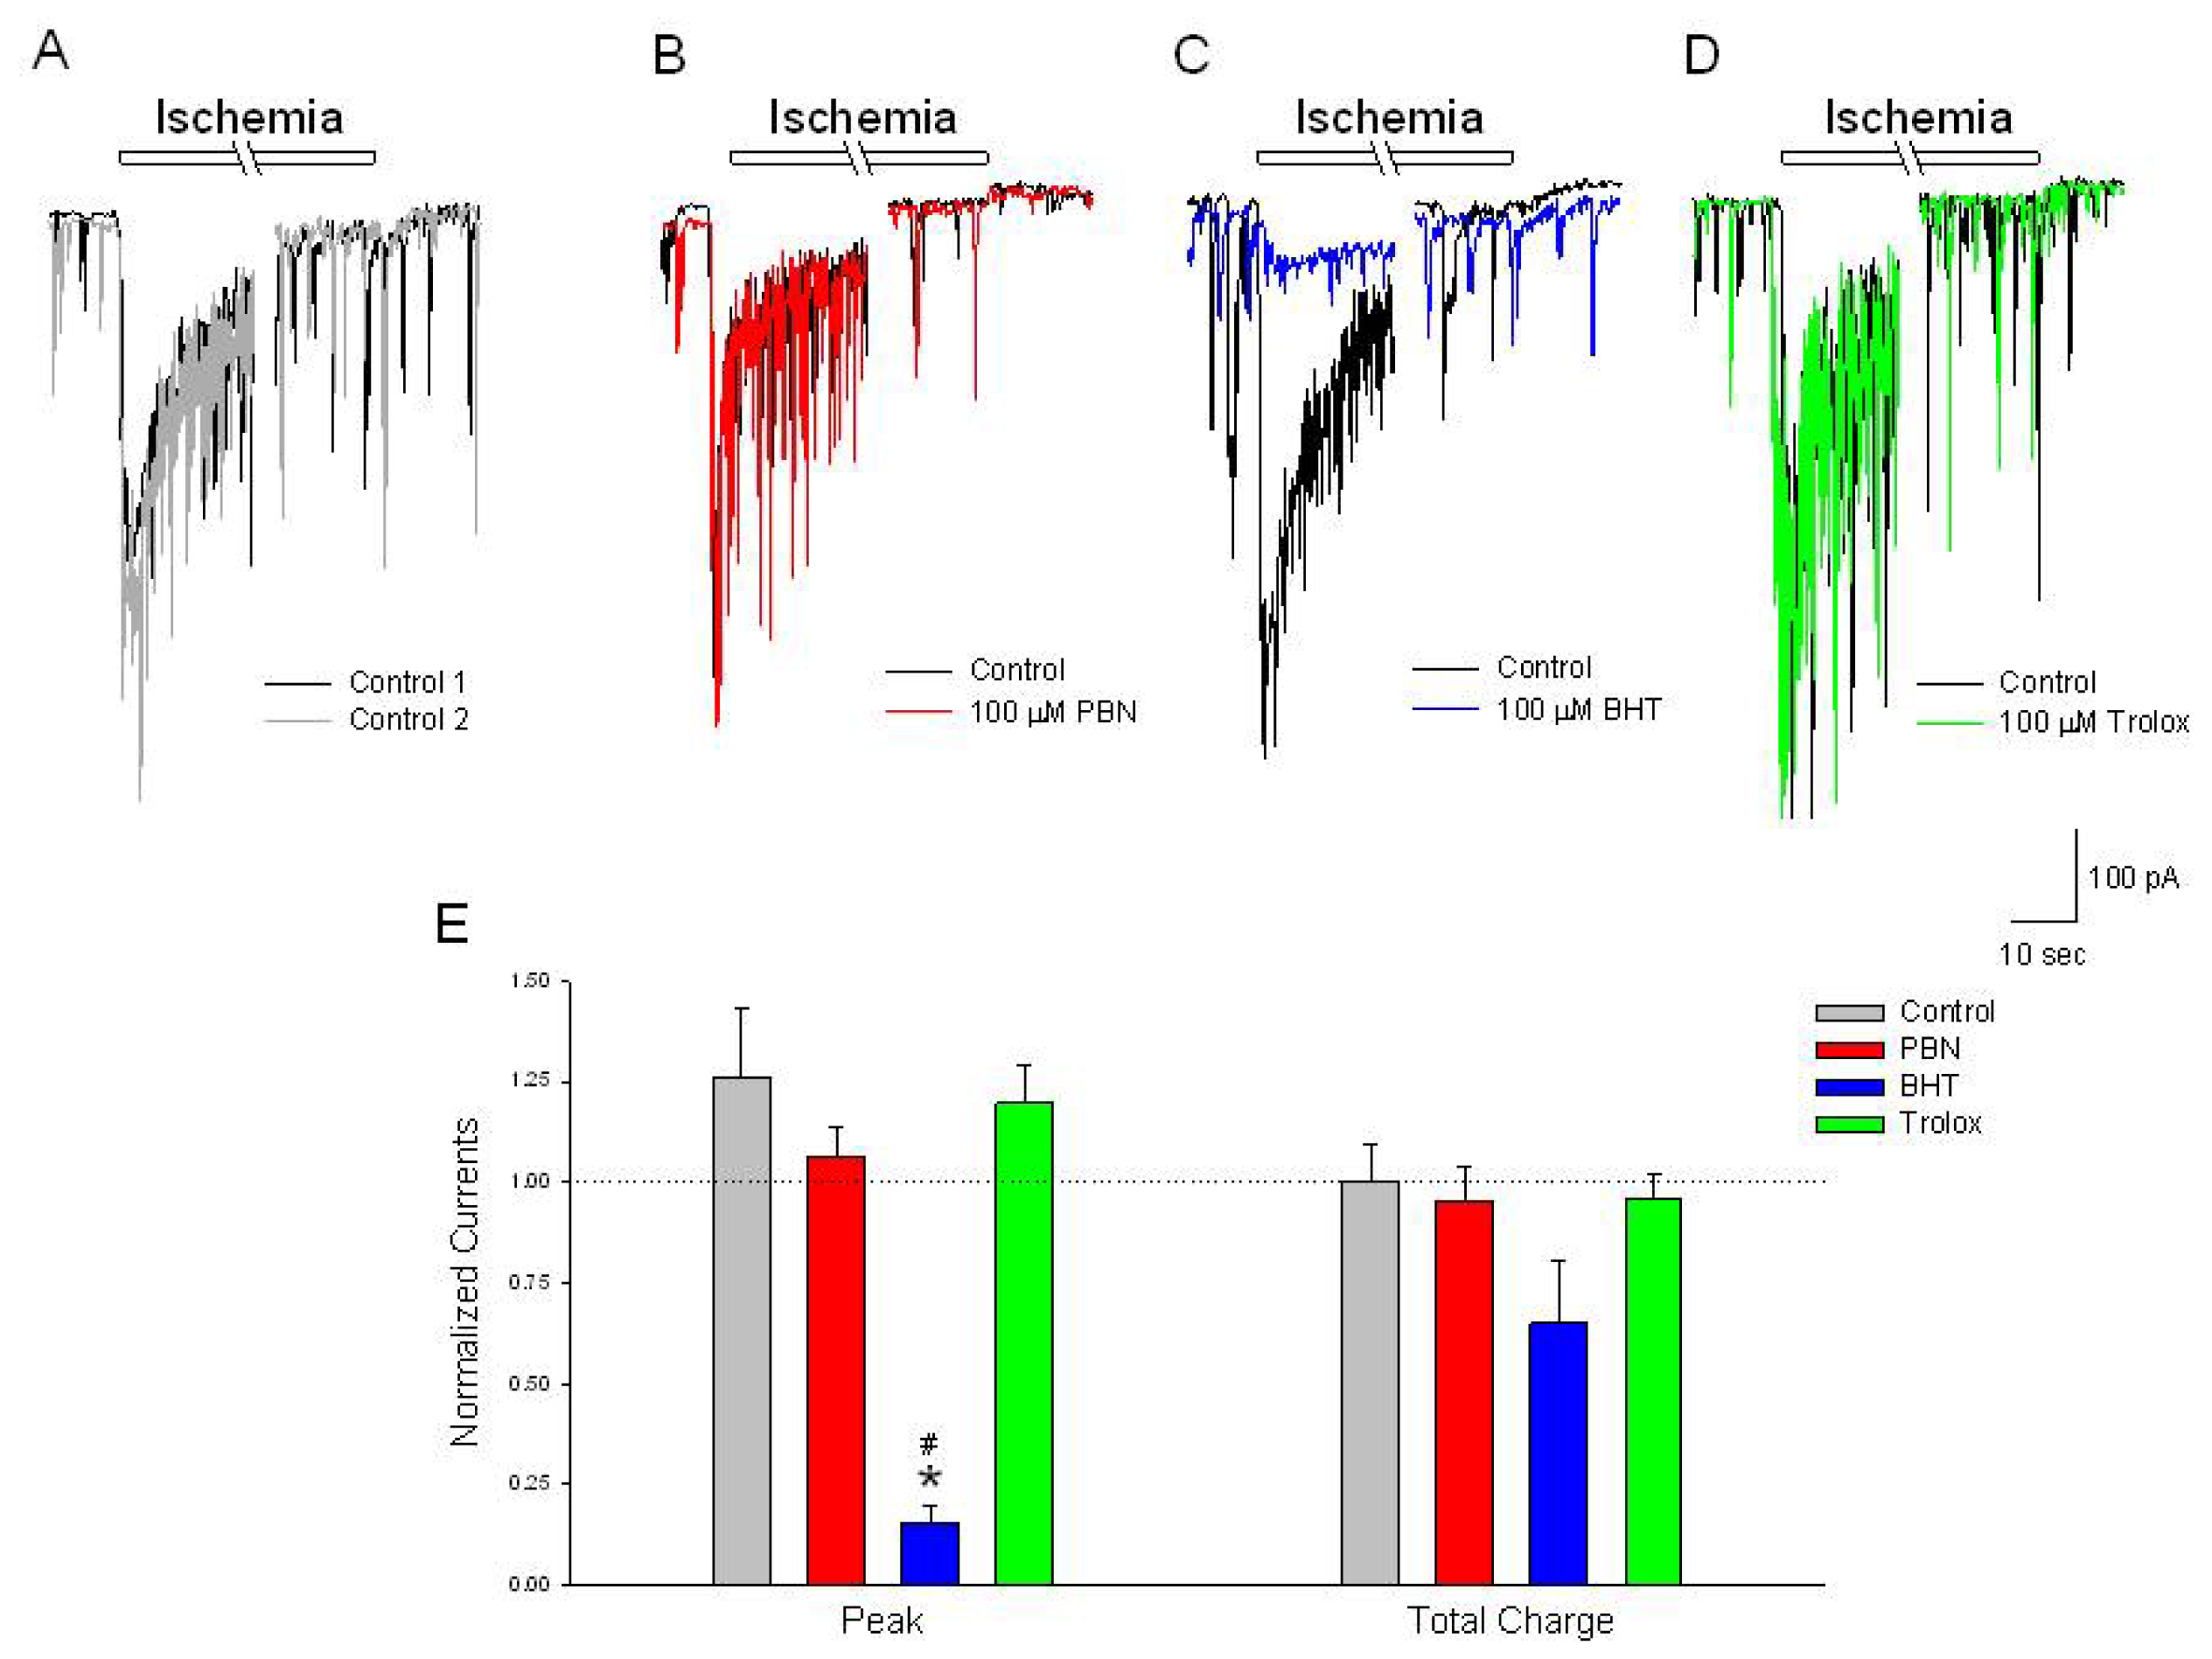
Figure 5.
BHT inhibits the initial peak inward current activated by ischemia. (A–D) Representative traces of inward currents recorded from cultured rat cortical neurons voltage clamped at −70 mV in the perforated-patch whole-cell configuration. Control recordings (black and grey traces) demonstrate a rapid activating, slow inactivating current induced by a 2 min application of NaN3 in the absence of glucose. In separate experiments, following the control ischemic responses (black traces), a 20 min incubation in (B) 100 μM PBN (red trace) or (D) 100 μM trolox (green trace) had no effects on the ischemia activated current; (C) 100 μM BHT, however, inhibited the initial peak inward current (blue trace); (E) Summarizing experiments identical to (A–D), second responses recorded in the absence and presence of the three antioxidants were normalized to initial control responses and expressed as means ± S.E.M. Peak, initial inward current relative to baseline; Total Charge, integration of inward current from beginning of acidic ischemia event to end of record. One way ANOVA comparison was performed on ratios of test responses/control responses. * p < 0.5 compared to control, # p < 0.5 compared to trolox. Number of cells measured; Control, n = 6; PBN, n = 7; BHT, n = 6; Trolox, n = 5.
![Ijms 15 03596f5]()
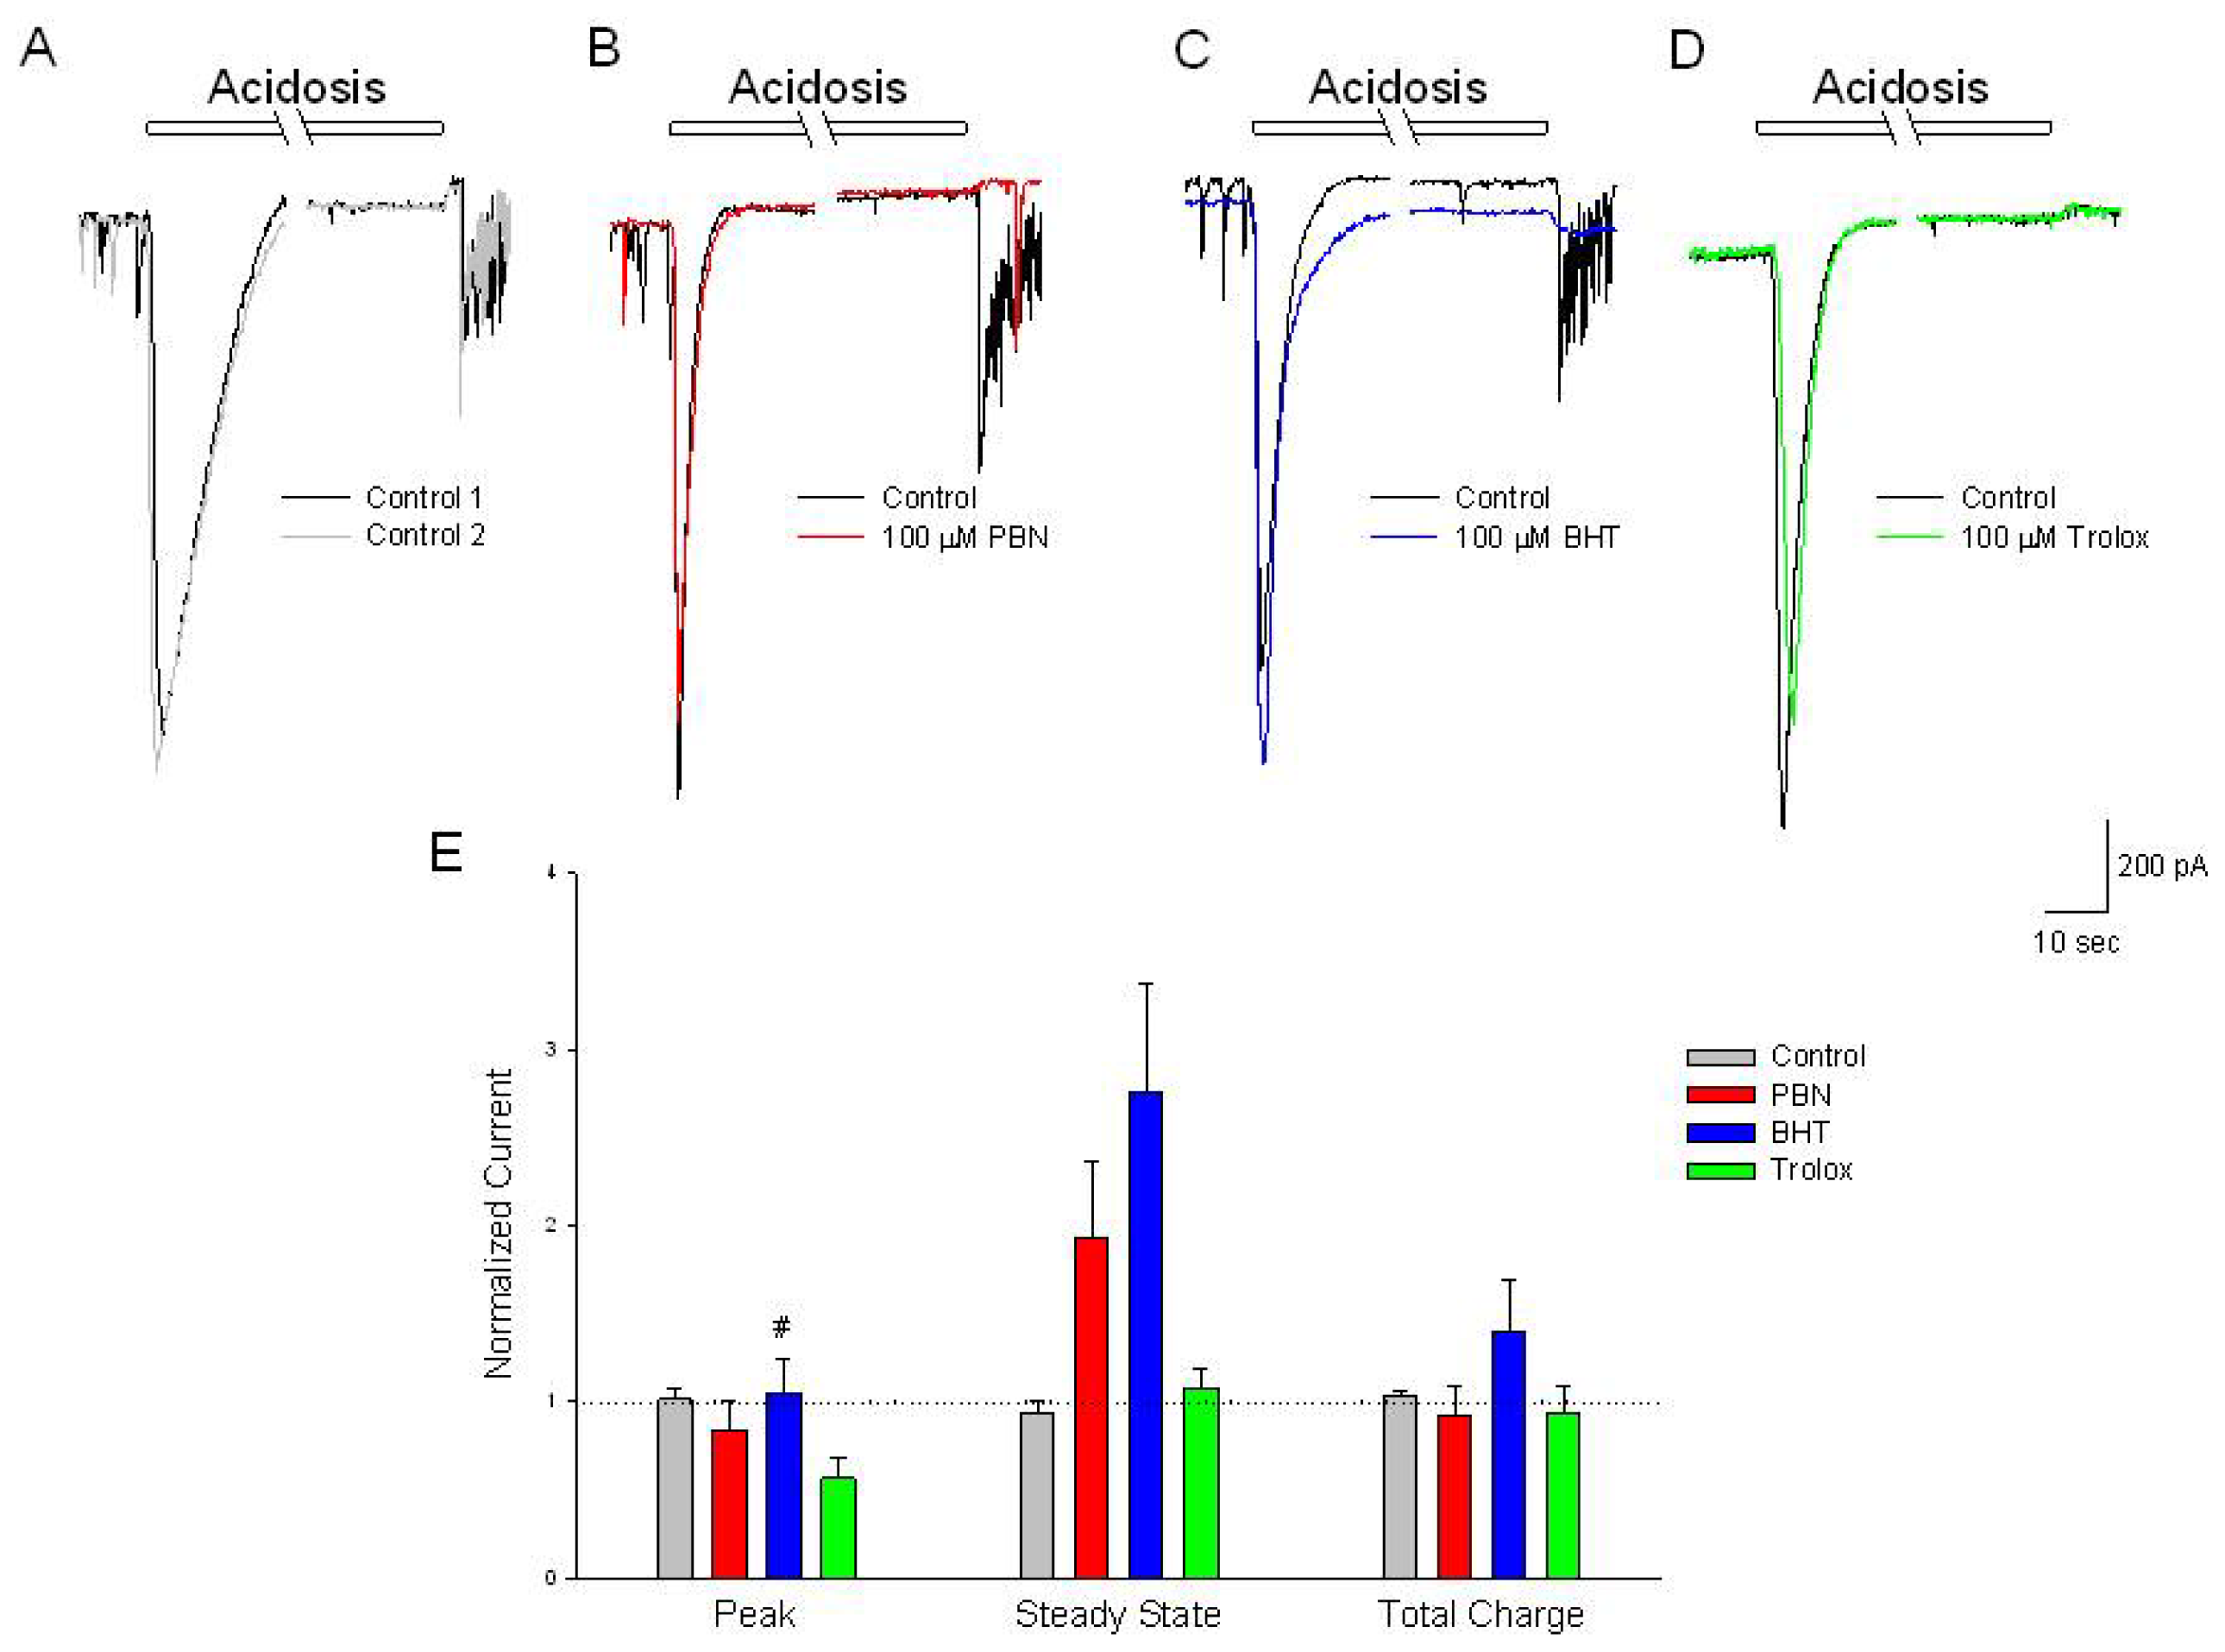
Figure 6.
Antioxidants have no effect on acidosis-activated inward currents compared to control. (A–D) Representative traces of inward currents recorded from cultured rat cortical neurons voltage clamped at −70 mV in the perforated-patch whole-cell configuration. Control recordings (black and grey traces) demonstrate a rapid activating, inactivating current along with a sustained outward current, induced by a 2 min change in external pH from 7.4 to 6.0. In separate experiments, following the control acidosis responses (black traces); a 20 min incubation in (B) 100 μM PBN (red trace); (C) 100 μM BHT (blue trace) or (D) 100 μM trolox (green trace) had no effects on the acidosis activated currents; (E) Summarizing experiments identical to (A–D), second responses recorded in the absence and presence of the three antioxidants were normalized to initial control responses and expressed as means ± S.E.M. Peak, initial inward current relative to baseline; Steady State, current measured at end of acidic episode relative to baseline; Total Charge, integration of inward current from beginning of acidic ischemia event to end of record. One way ANOVA comparison was performed on ratios of test responses/control responses. # p < 0.5 compared to trolox. Number of cells measured; Control, n = 6; PBN, n = 5; BHT, n = 6; Trolox, n = 5.
![Ijms 15 03596f6]()
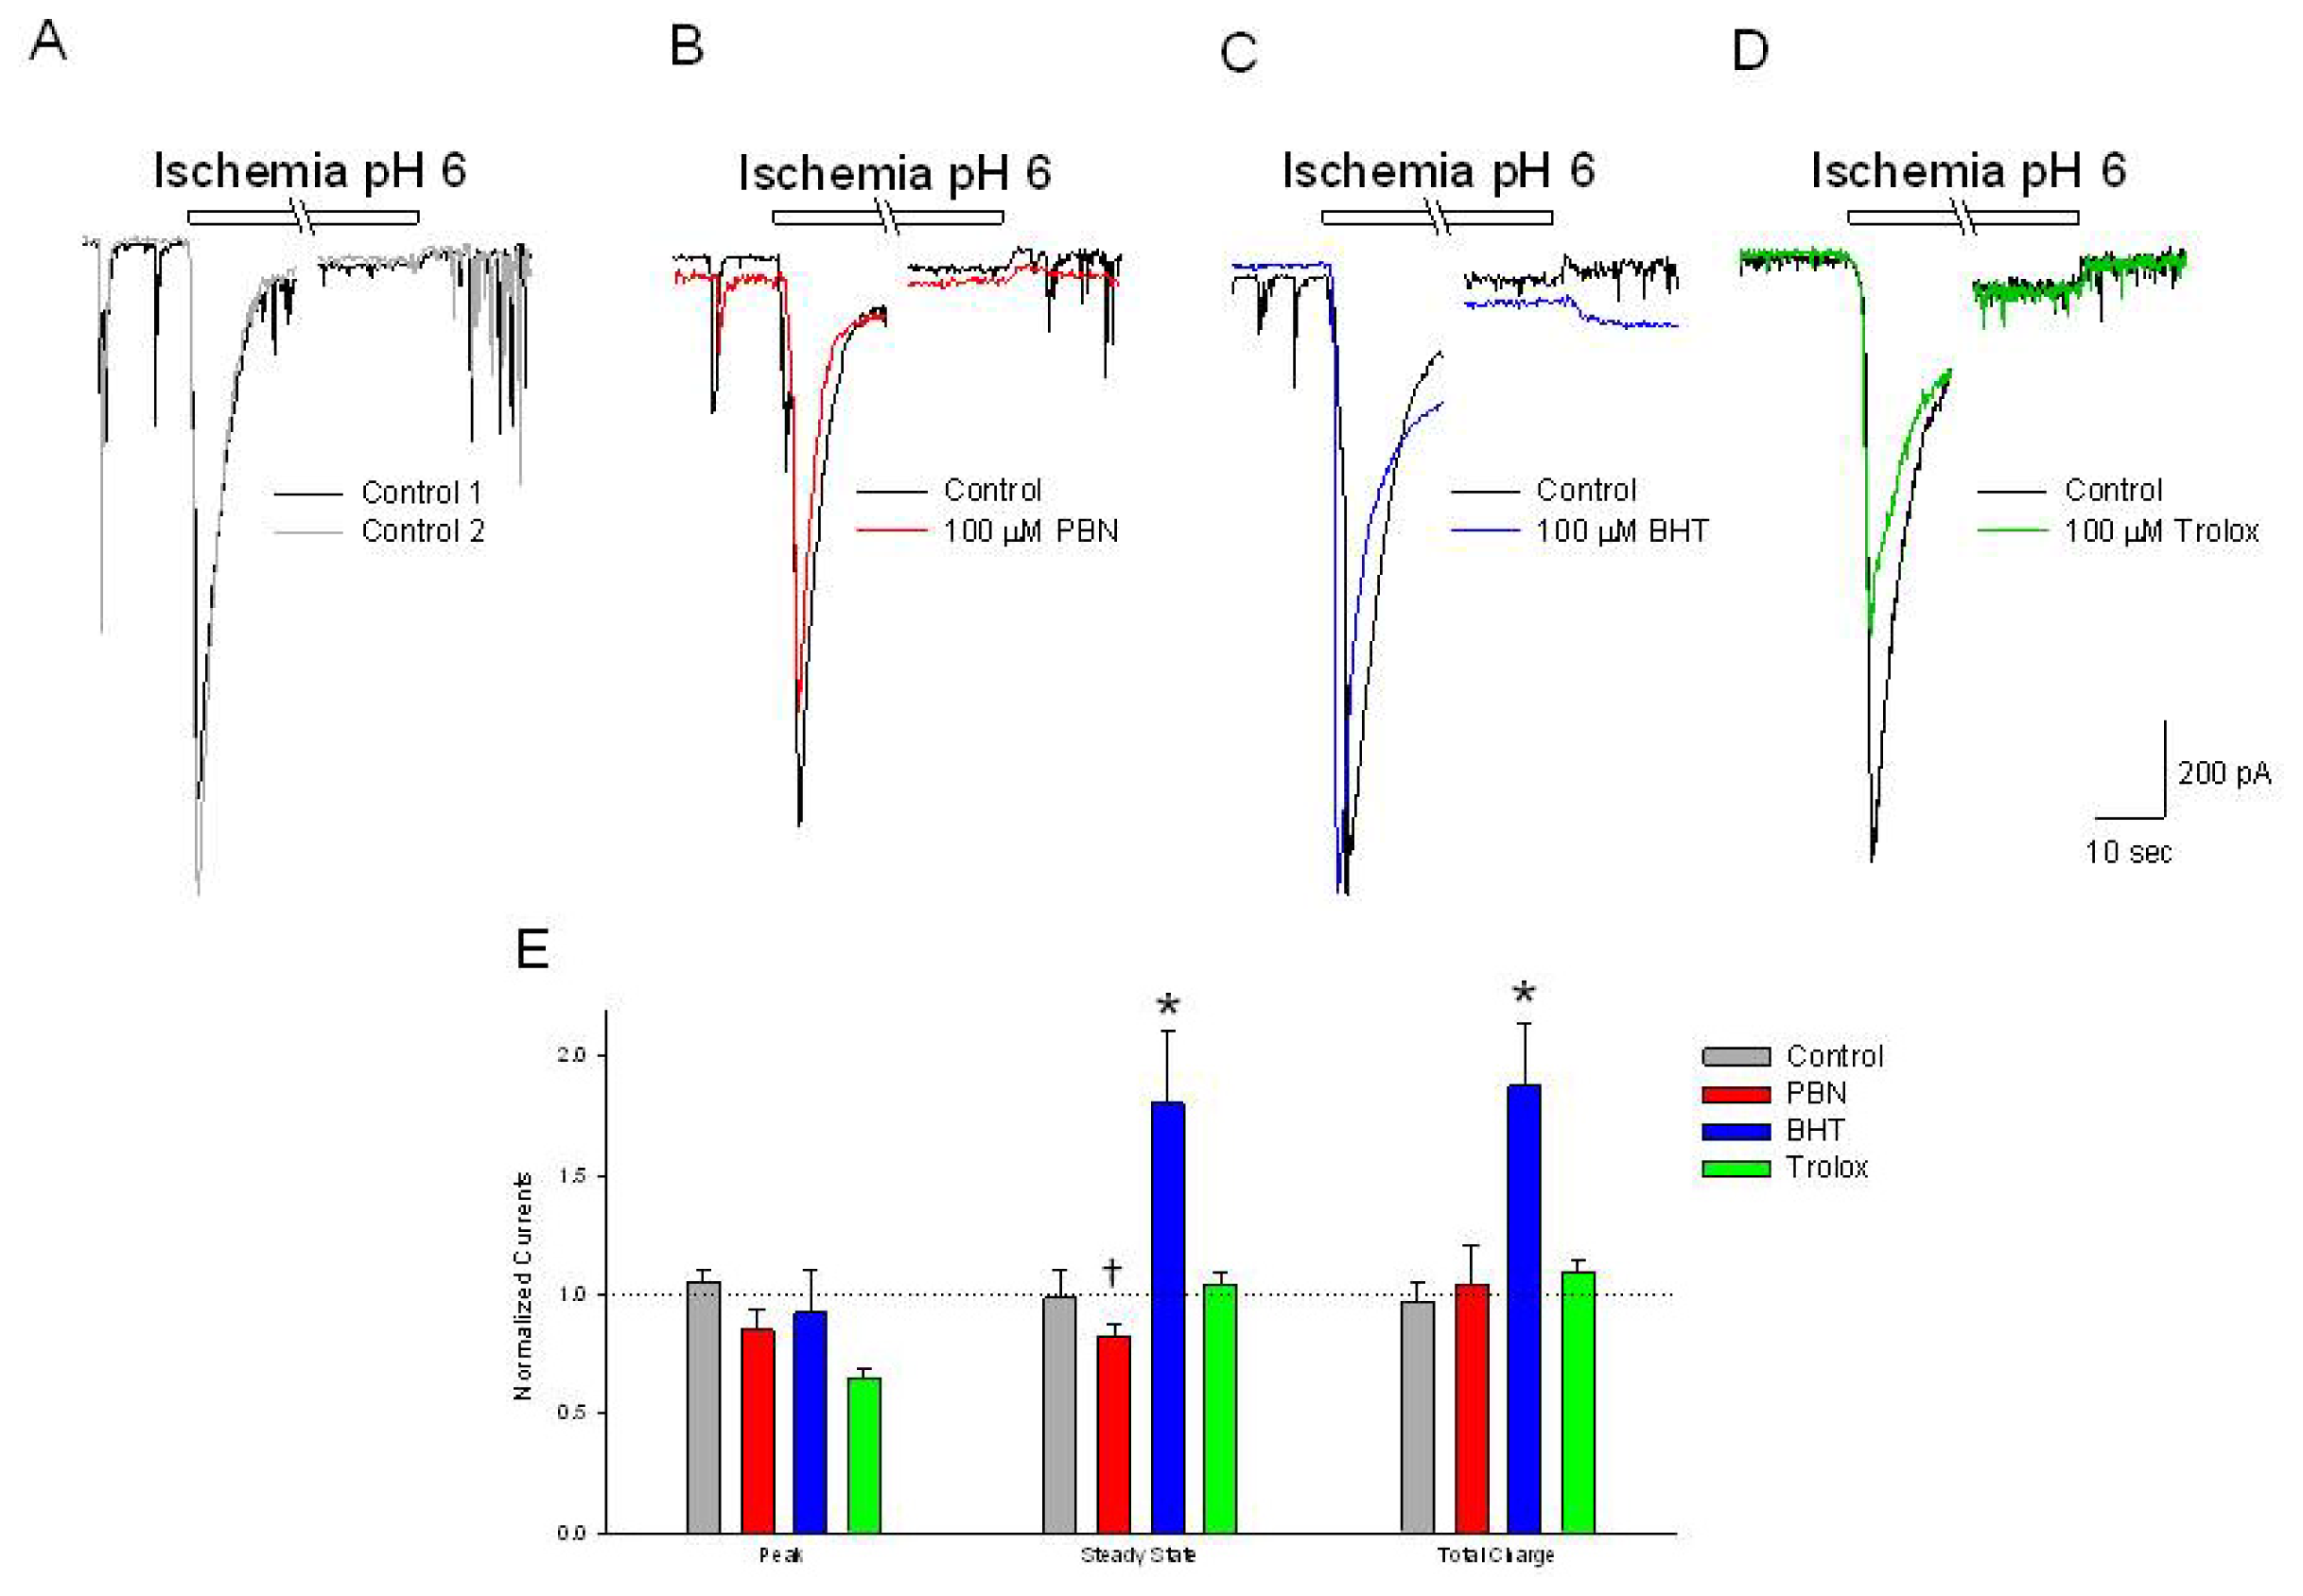
Figure 7.
Trolox decreases initial transient acidic ischemia-activated inward currents while BHT increases the sustained activated currents. (A–D) Representative traces of inward currents recorded from cultured rat cortical neurons voltage clamped at −70 mV in the perforated-patch whole-cell configuration. Control recordings (black and grey traces) demonstrate a rapid activating, inactivating current induced by 2 min acidic ischemia. In separate experiments, following the control acidic ischemia responses (black traces); a 20 min incubation in (B) 100 μM PBN (red trace) had not effect; (C) 100 μM BHT (blue trace) increased the steady state inward current and (D) 100 μM trolox (green trace) decreased the initial transient inward current; (E) Summarizing experiments identical to (A–D), second responses recorded in the absence and presence of the three antioxidants were normalized to initial control responses and expressed as means ± S.E.M. Peak, initial inward current relative to baseline; Steady State, current measured at end of acidic episode relative to baseline; Total Charge, integration of inward current from beginning of acidic ischemia event to end of record. One way ANOVA comparison was performed on ratios of test responses/control responses. * p < 0.5 compared to control, † p < 0.5 compared to BHT. Number of cells measured; Control, n = 6; PBN, n = 6; BHT, n = 5; Trolox, n = 4.
![Ijms 15 03596f7]()
