Differential Activity of Plasma and Vacuolar Membrane Transporters Contributes to Genotypic Differences in Salinity Tolerance in a Halophyte Species, Chenopodium quinoa

 ,
, 
Abstract
:1. Introduction
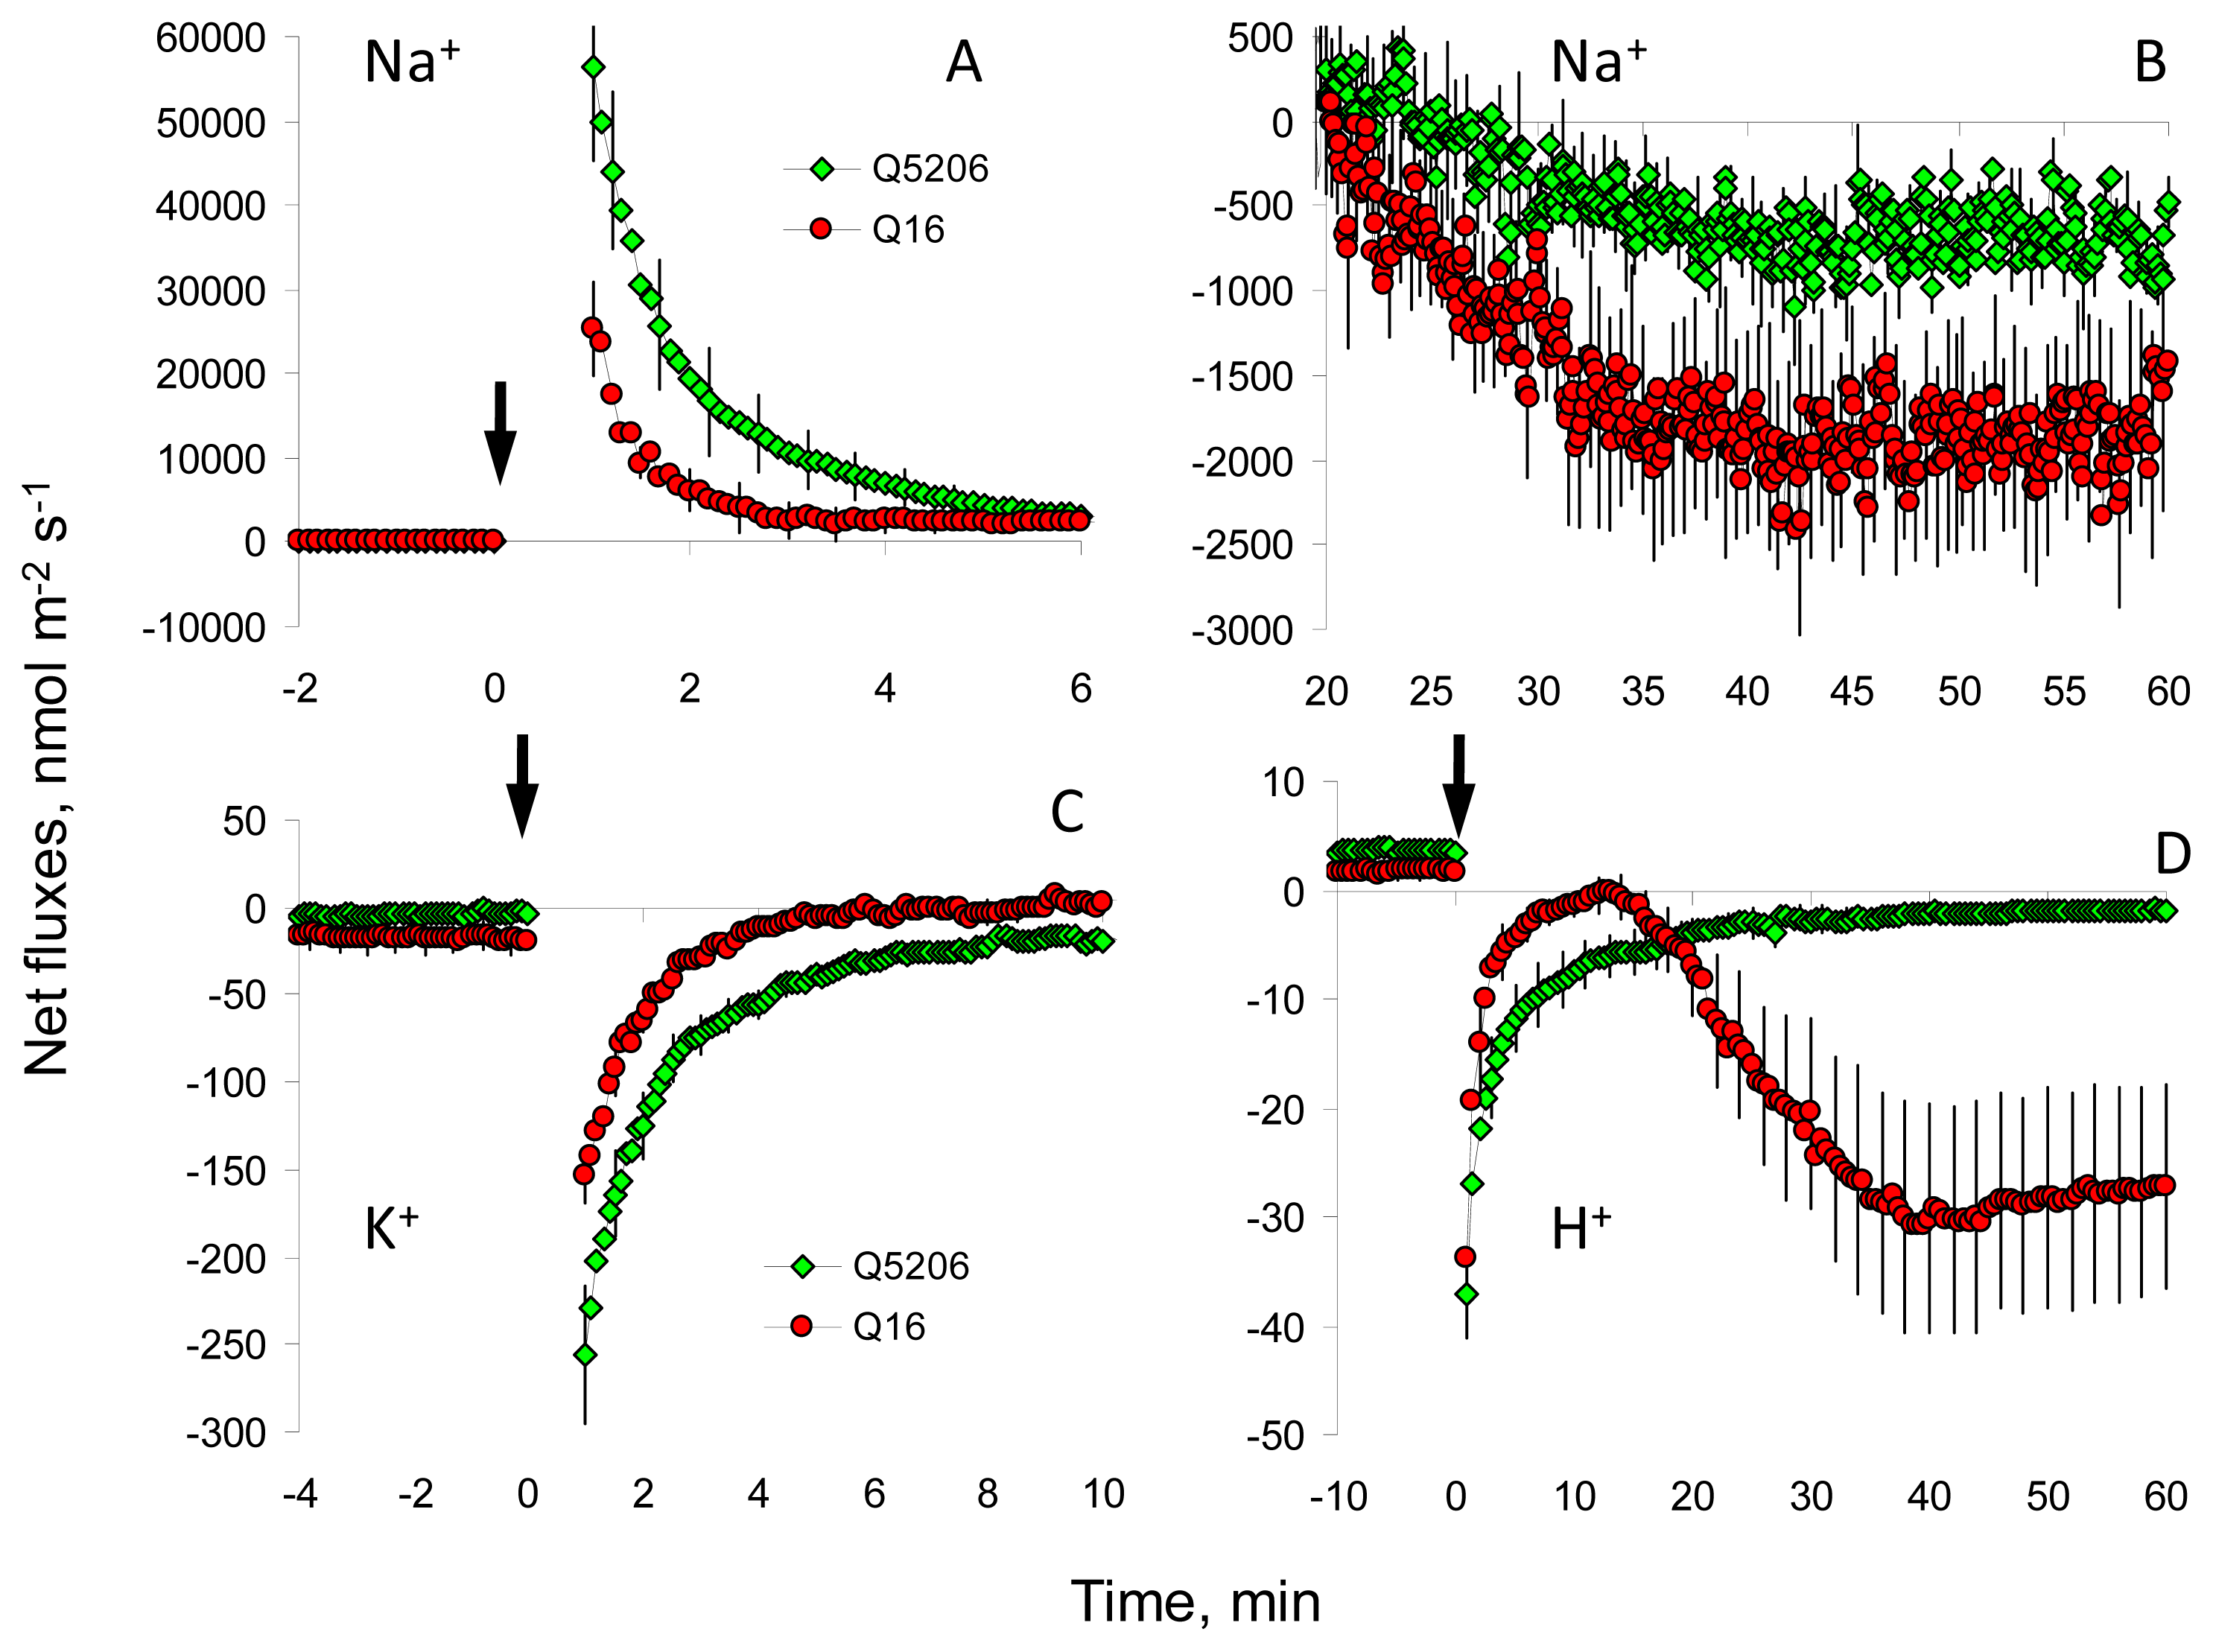
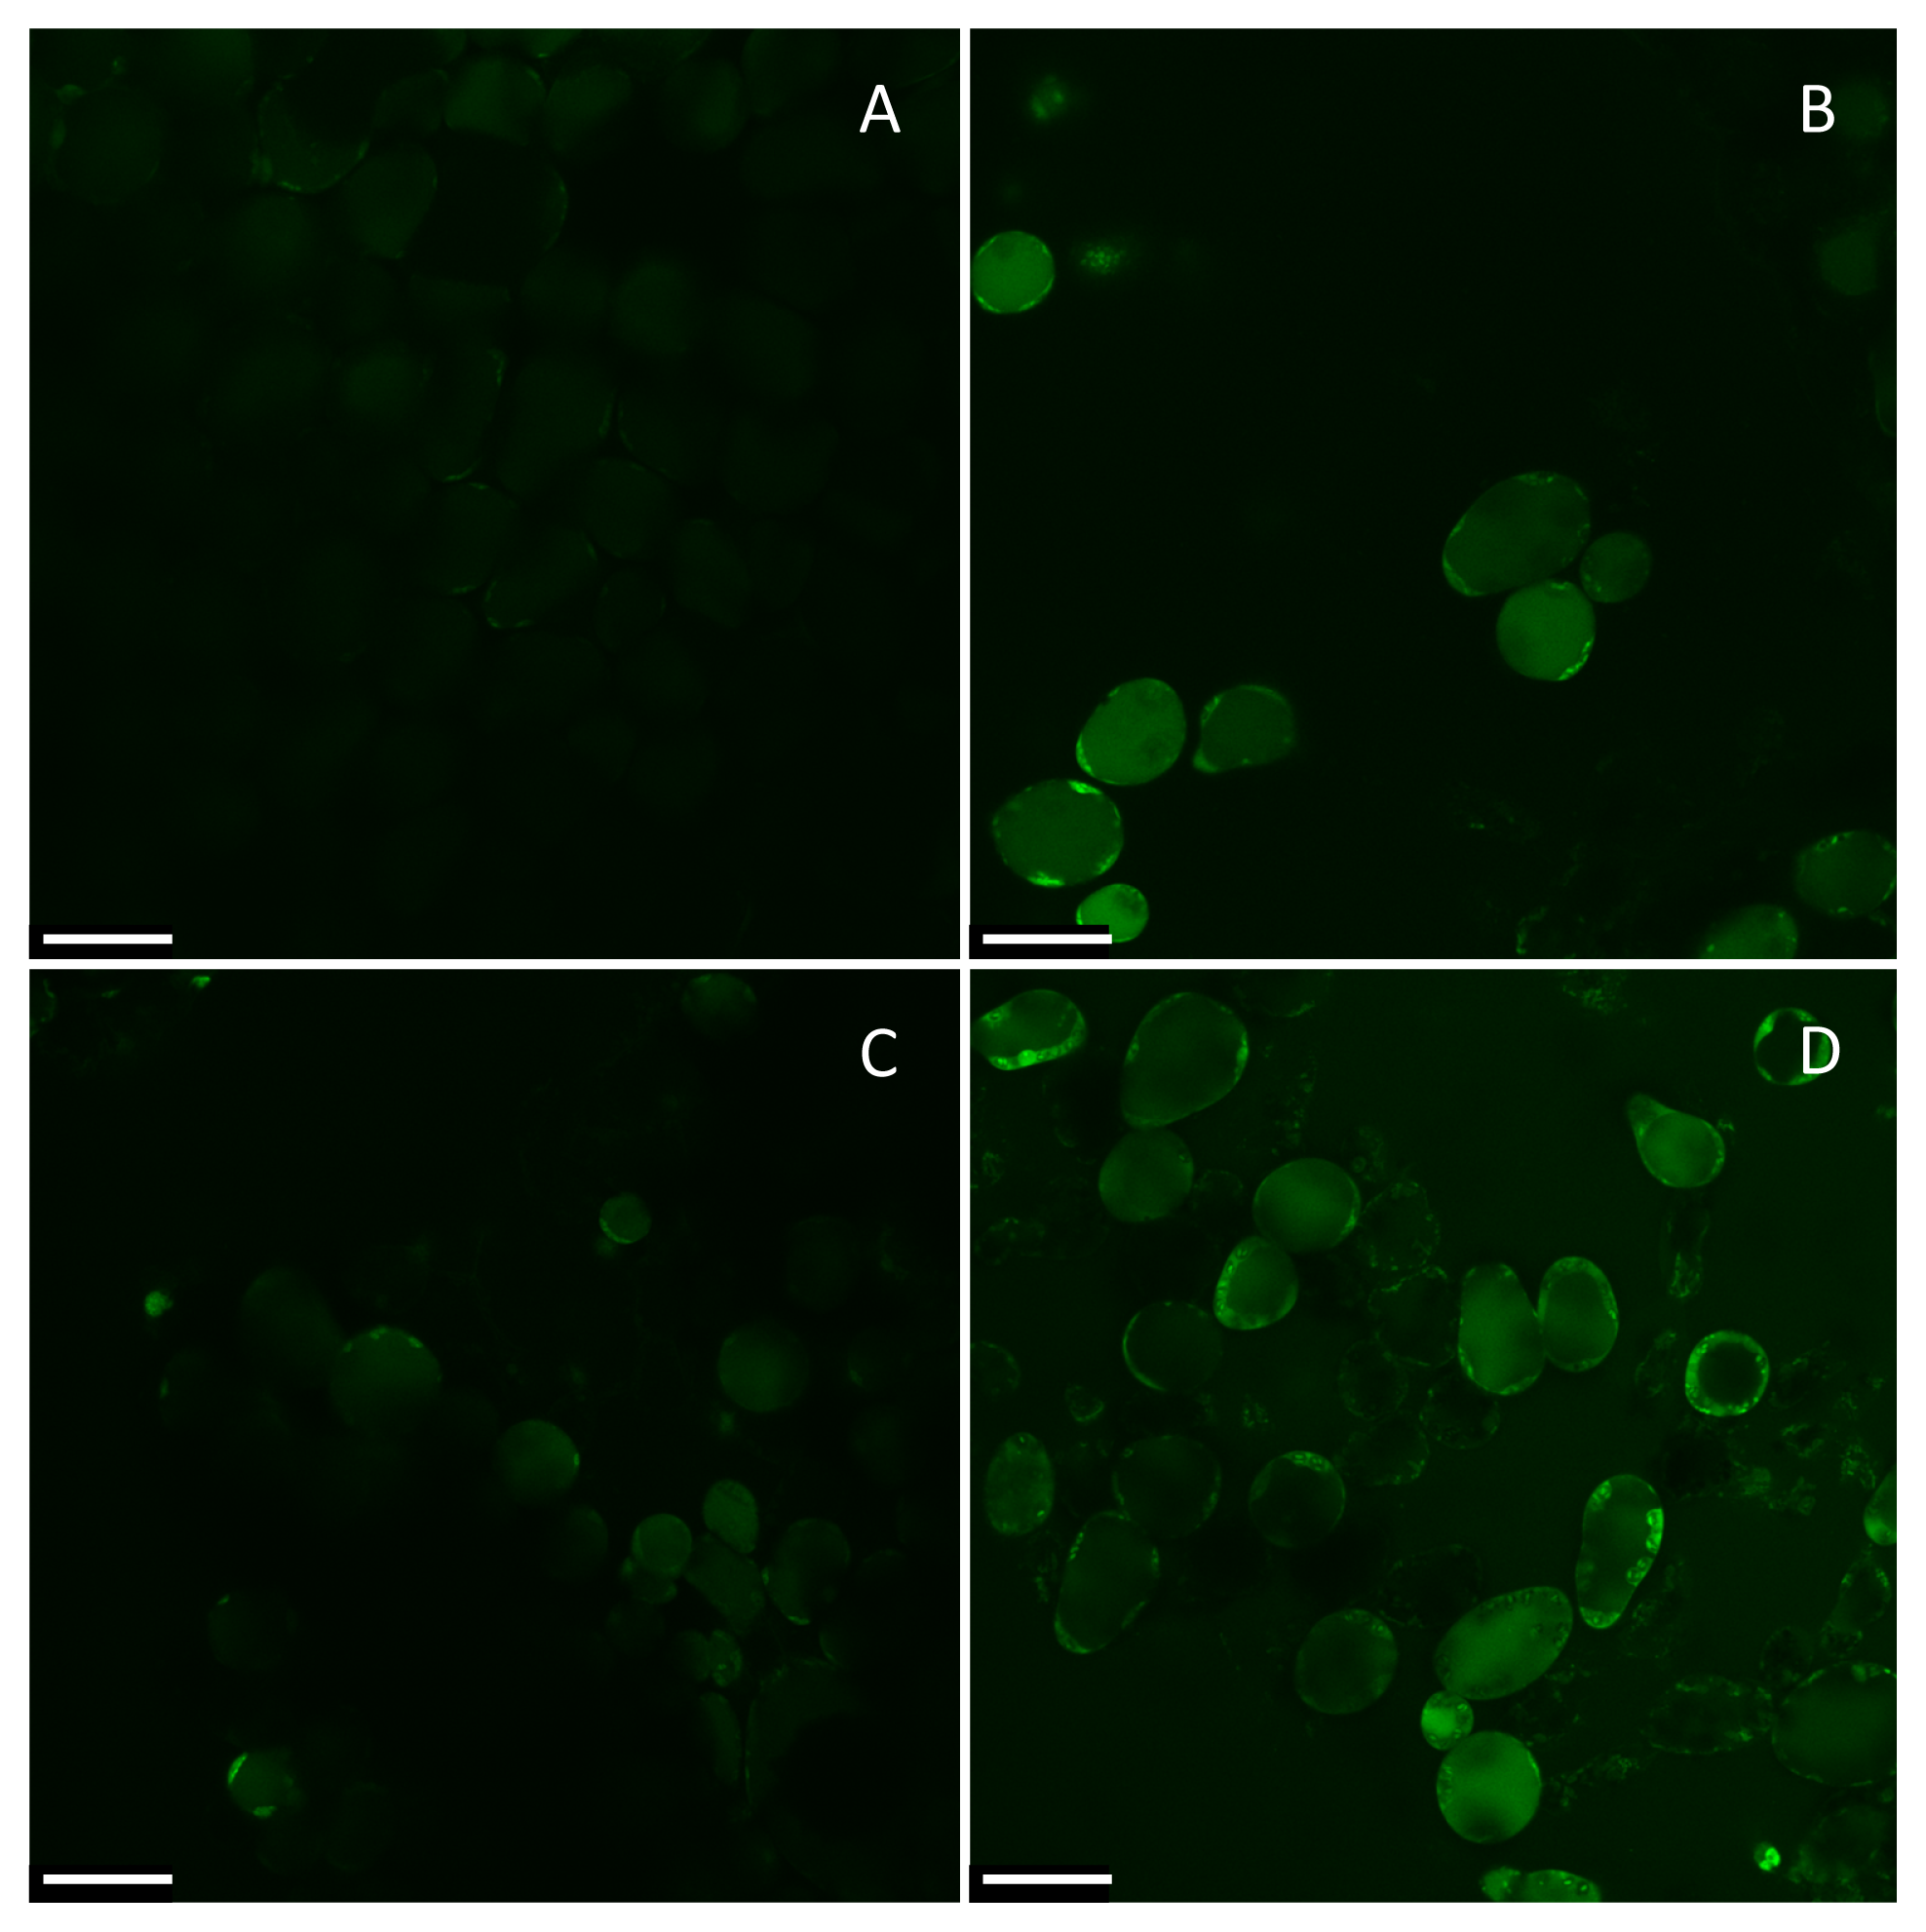
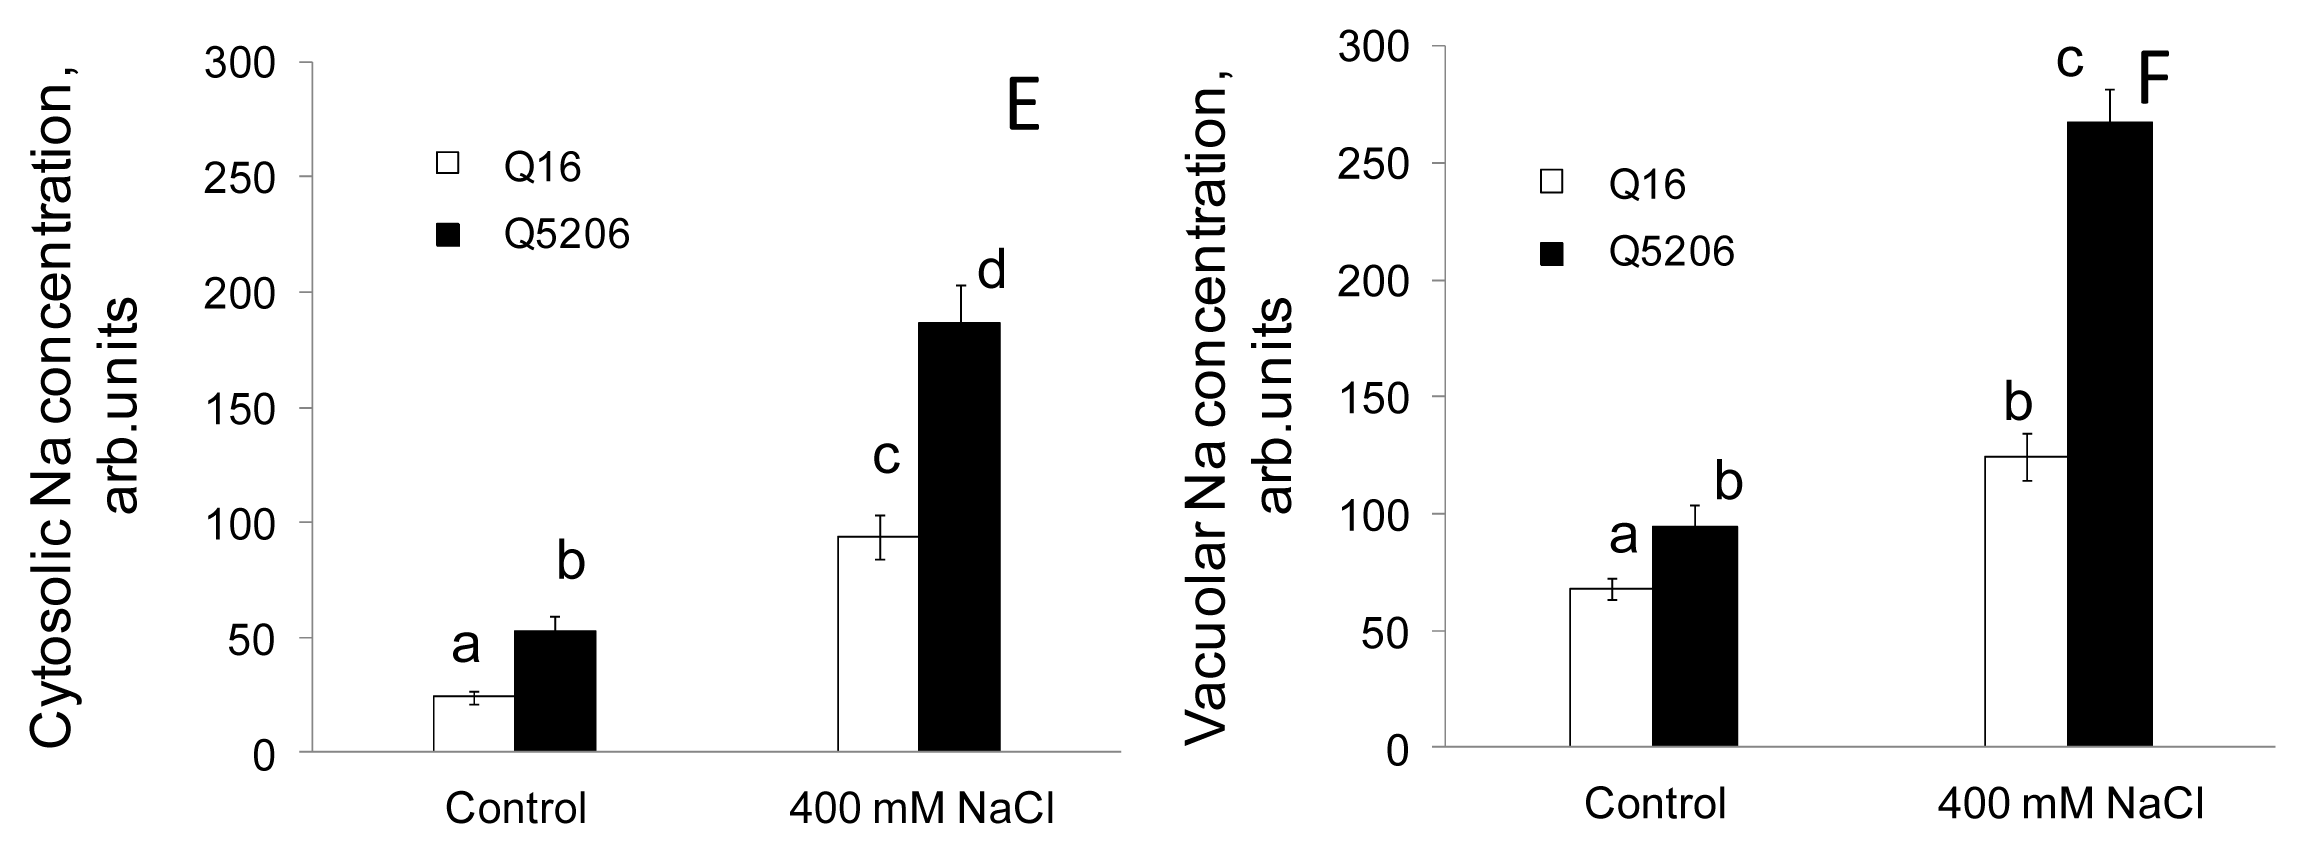
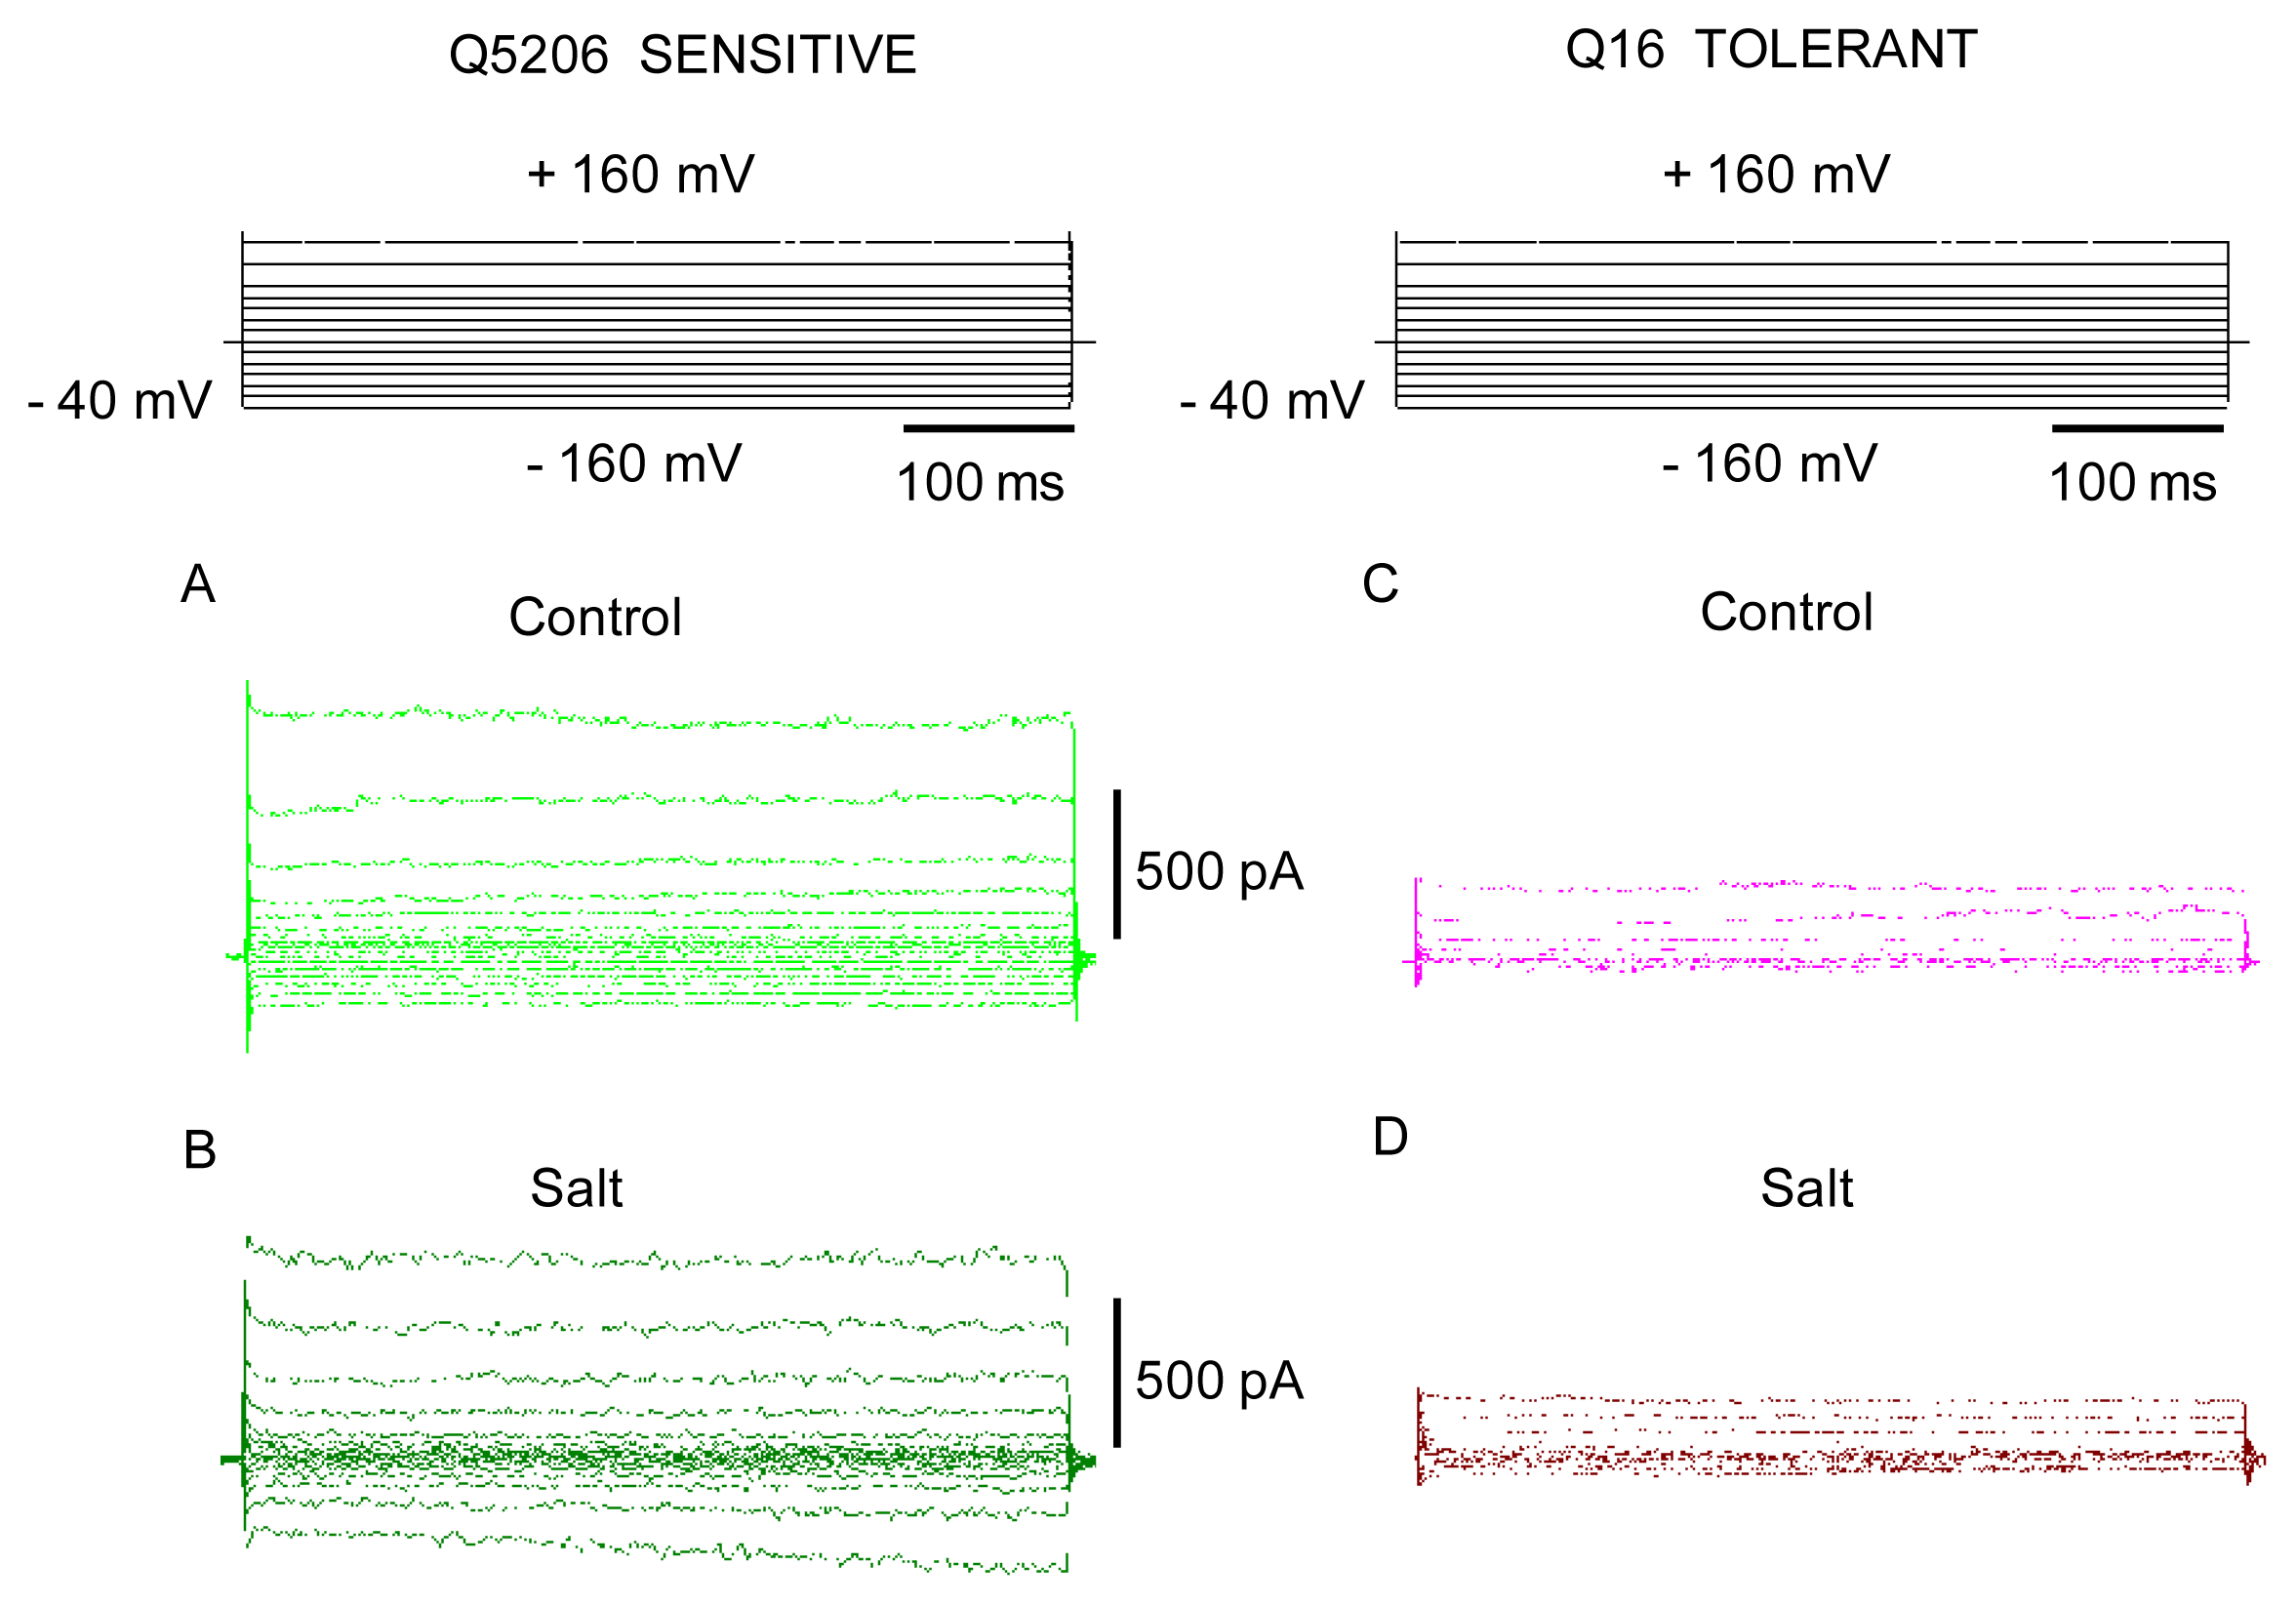
2. Results
3. Discussion
4. Experimental Section
4.1. Plant Material and Growth Conditions
4.2. Vacuole Isolation and Patch-Clamp Electrophysiology
4.3. Intracellular Na+ Measurements
4.4. Non-Invasive Ion Flux Measurements
5. Conclusions
Acknowledgements
Conflict of Interest
References
- Flowers, T.J. Improving crop salt tolerance. J. Exp. Bot 2004, 55, 307–319. [Google Scholar]
- Flowers, T.J.; Galal, H.K.; Bromham, L. Evolution of halophytes: Multiple origins of salt tolerance in land plants. Funct. Plant Biol 2010, 37, 604–612. [Google Scholar]
- Shabala, S.; Mackay, A. Ion transport in halophytes. Adv. Bot. Res 2011, 57, 151–199. [Google Scholar]
- Neales, T.F.; Sharkey, P.J. Effect of salinity on growth and on mineral and organic constituents of the halophyte Disphyma ustrale (Soland.) black. Austr. J. Plant Physiol 1981, 8, 165–179. [Google Scholar]
- Storey, R.; Wyn Jones, R.G. Responses of Atriplex spongiosa and Suaeda monoica to salinity. Plant Physiol 1979, 63, 156–162. [Google Scholar]
- Hariadi, Y.; Marandon, K.; Tian, Y.; Jacobsen, S.E.; Shabala, S. Ionic and osmotic relations in quinoa (Chenopodium quinoa Willd.) plants grown at various salinity levels. J. Exp. Bot 2011, 62, 185–193. [Google Scholar]
- Redondo-Gomez, S.; Mateos-Naranjo, E.; Davy, A.J.; Fernandez-Munoz, F.; Castellanos, E.M.; Luque, T.; Figueroa, M.E. Growth and photosynthetic responses to salinity of the salt-marsh shrub Atriplex portulacoides. Ann. Bot 2007, 100, 555–563. [Google Scholar]
- Maas, E.V.; Hoffman, G.J. Crop salt tolerance assessment. ASCE J. Irrig. Drain. Div 1977, 103, 115–134. [Google Scholar]
- Cuin, T.A.; Tian, Y.; Betts, S.A.; Chalmandrier, R.; Shabala, S. Ionic relations and osmotic adjustment in durum and bread wheat under saline conditions. Funct. Plant Biol 2009, 36, 1110–1119. [Google Scholar]
- Glenn, E.P.; Brown, J.J.; Blumwald, E. Salt tolerance and crop potential of halophytes. Crit. Rev. Plant Sci 1999, 18, 227–255. [Google Scholar]
- Flowers, T.J.; Colmer, T.D. Salinity tolerance in halophytes. New Phytol 2008, 179, 945–963. [Google Scholar]
- Greenway, H.; Munns, R. Mechanisms of salt tolerance in nonhalophytes. Annu. Rev. Plant Physiol 1980, 31, 149–190. [Google Scholar]
- Colmer, T.D.; Flowers, T.J.; Munns, R. Use of wild relatives to improve salt tolerance in wheat. J. Exp. Bot 2006, 57, 1059–1078. [Google Scholar]
- Chen, Z.H.; Zhou, M.X.; Newman, I.A.; Mendham, N.J.; Zhang, G.P.; Shabala, S. Potassium and sodium relations in salinised barley tissues as a basis of differential salt tolerance. Funct. Plant Biol 2007, 34, 150–162. [Google Scholar]
- Shabala, S.; Cuin, T.A.; Pang, J.Y.; Percey, W.; Chen, Z.H.; Conn, S.; Eing, C.; Wegner, L.H. Xylem ionic relations and salinity tolerance in barley. Plant J 2010, 61, 839–853. [Google Scholar]
- Mian, A.; Oomen, R.; Isayenkov, S.; Sentenac, H.; Maathuis, F.J.M.; Very, A.A. Over-expression of an Na+- and K+-permeable HKT transporter in barley improves salt tolerance. Plant J 2011, 68, 468–479. [Google Scholar]
- Repo-Carrasco, R.; Espinoza, C.; Jacobsen, S.E. Nutritional value and use of the Andean crops quinoa (Chenopodium quinoa) and kaniwa (Chenopodium pallidicaule). Food Rev. Int 2003, 19, 179–189. [Google Scholar]
- Adolf, V.I.; Jacobsen, S.-E.; Shabala, S. Salt tolerance mechanisms in quinoa (Chenopodium quinoaWilld.). Environ. Exp. Bot. 2013, in press. [Google Scholar]
- Jacobsen, S.E.; Mujica, A.; Jensen, C.R. The resistance of quinoa (Chenopodium quinoa Willd.) to adverse abiotic factors. Food Rev. Int 2003, 19, 99–109. [Google Scholar]
- Adolf, V.I.; Shabala, S.; Andersen, M.N.; Razzaghi, F.; Jacobsen, S.E. Varietal differences of quinoa’s tolerance to saline conditions. Plant Soil 2012, 357, 117–129. [Google Scholar]
- Shabala, S.; Hariadi, Y.; Jacobsen, S.-E. Genotypic difference in salinity tolerance in quinoa is determined by differential control of xylem Na+loading and stomatal density. J. Plant Physiol. 2013. [Google Scholar] [CrossRef]
- Blumwald, E.; Aharon, G.S.; Apse, M.P. Sodium transport in plant cells. Biochim. Biophys. Acta Biomembr 2000, 1465, 140–151. [Google Scholar]
- Pantoja, O.; Dainty, J.; Blumwald, E. Ion channels in vacuoles from halophytes and glycophytes. FEBS Lett 1989, 255, 92–96. [Google Scholar]
- Barkla, B.J.; Zingarelli, L.; Blumwald, E.; Smith, J.A.C. Tonoplast Na+/H+ antiport activity and its energization by the vacuolar H+-ATPase in the halophytic plant Mesembryanthemum crystallinum L. Plant Physiol 1995, 109, 549–556. [Google Scholar]
- Bonales-Alatorre, E.; Shabala, S.; Chen, Z.H.; Pottosin, I. Reduced tonoplast FV and SV channels activity is essential for conferring salinity tolerance in a facultative halophyte. Chenopodium quinoa. Plant Physiol. 2013, in press. [Google Scholar]
- Shi, H.Z.; Ishitani, M.; Kim, C.S.; Zhi, J.K. The Arabidopsis thaliana salt tolerance gene SOS1 encodes a putative Na+/H+ antiporter. Proc. Natl. Acad. Sci. USA 2000, 97, 6896–6901. [Google Scholar]
- Shabala, S. Ionic and osmotic components of salt stress specifically modulate net ion fluxes from bean leaf mesophyll. Plant Cell Environ 2000, 23, 825–837. [Google Scholar]
- Shabala, S.; Demidchik, V.; Shabala, L.; Cuin, T.A.; Smith, S.J.; Miller, A.J.; Davies, J.M.; Newman, I.A. Extracellular Ca2+ ameliorates NaCl-induced K+ loss from Arabidopsis root and leaf cells by controlling plasma membrane K+-permeable channels. Plant Physiol 2006, 141, 1653–1665. [Google Scholar]
- Shabala, S.; Shabala, L.; van Volkenburgh, E.; Newman, I. Effect of divalent cations on ion fluxes and leaf photochemistry in salinized barley leaves. J. Exp. Bot 2005, 56, 1369–1378. [Google Scholar]
- Smethurst, C.F.; Rix, K.; Garnett, T.; Auricht, G.; Bayart, A.; Lane, P.; Wilson, S.J.; Shabala, S. Multiple traits associated with salt tolerance in lucerne: Revealing the underlying cellular mechanisms. Funct. Plant Biol 2008, 35, 640–650. [Google Scholar]
- Palmgren, M.G.; Nissen, P. P-type ATPases. Annu. Rev. Biophys 2011, 40, 243–266. [Google Scholar]
- Shabala, S.; Cuin, T.A. Potassium transport and plant salt tolerance. Physiol. Plant 2008, 133, 651–669. [Google Scholar]
- Very, A.A.; Sentenac, H. Cation channels in the Arabidopsis plasma membrane. Trends Plant Sci 2002, 7, 168–175. [Google Scholar]
- Tikhonova, L.I.; Pottosin, I.I.; Dietz, K.J.; Schönknecht, G. Fast-activating cation channel in barley mesophyll vacuoles. Inhibition by calcium. Plant J 1997, 11, 1059–1070. [Google Scholar]
- Brüggemann, L.I.; Pottosin, I.I.; Schönknecht, G. Cytoplasmic polyamines block the fast-activating vacuolar cation channel. Plant J 1998, 16, 101–105. [Google Scholar]
- Pottosin, I.I.; Martínez-Estévez, M. Regulation of the fast vacuolar channel by cytosolic and vacuolar potassium. Biophys. J 2003, 84, 977–986. [Google Scholar]
- Pottosin, I.I.; Dobrovinskaya, O.R.; Muñiz, J. Conduction of monovalent and divalent cations in the slow vacuolar channel. J. Membr. Biol 2001, 181, 55–65. [Google Scholar]
- Pérez, V.; Wherrett, T.; Shabala, S.; Muñiz, J.; Dobrovinskaya, O.; Pottosin, I. Homeostatic control of slow vacuolar channels by luminal cations and evaluation of the channel-mediated tonoplast Ca2+ fluxes in situ. J. Exp. Bot 2008, 59, 3845–3855. [Google Scholar]
- Munns, R. Comparative physiology of salt and water stress. Plant Cell Environ 2002, 25, 239–250. [Google Scholar]
- Colmer, T.D.; Flowers, T.J. Flooding tolerance in halophytes. New Phytol 2008, 179, 964–974. [Google Scholar]
- Munns, R.; James, R.A.; Xu, B.; Athman, A.; Conn, S.J.; Jordans, C.; Byrt, C.S.; Hare, R.A.; Tyerman, S.D.; Tester, M.; et al. Wheat grain yield on saline soils is improved by an ancestral Na+ transporter gene. Nature Biotechnol 2012, 30, 360–364. [Google Scholar]
- Razzaghi, F.; Ahmadi, S.H.; Adolf, V.I.; Jensen, C.R.; Jacobsen, S.E.; Andersen, M.N. Water relations and transpiration of quinoa (Chenopodium quinoa Willd.) under salinity and soil drying. J. Agron. Crop Sci 2011, 197, 348–360. [Google Scholar]
- Cuin, T.A.; Bose, J.; Stefano, G.; Jha, D.; Tester, M.; Mancuso, S.; Shabala, S. Assessing the role of root plasma membrane and tonoplast Na+/H+ exchangers in salinity tolerance in wheat: In planta quantification methods. Plant Cell Environ 2011, 34, 947–961. [Google Scholar]
- Maughan, P.J.; Turner, T.B.; Coleman, C.E.; Elzinga, D.B.; Jellen, E.N.; Morales, J.A.; Udall, J.A.; Fairbanks, D.J.; Bonifacio, A. Characterization of Salt Overly Sensitive 1 (SOS 1) gene homologs in quinoa (Chenopodium quinoa Wilid.). Genome 2009, 52, 647–657. [Google Scholar]
- Ruiz-Carrasco, K.; Antognoni, F.; Coulibaly, A.K.; Lizardi, S.; Covarrubias, A.; Martinez, E.A.; Molina-Montenegro, M.A.; Biondi, S.; Zurita-Silva, A. Variation in salinity tolerance of four lowland genotypes of quinoa (Chenopodium quinoa Willd.) as assessed by growth, physiological traits, and sodium transporter gene expression. Plant Physiol. Biochem 2011, 49, 1333–1341. [Google Scholar]
- Dreyer, I.; Uozumi, N. Potassium channels in plant cells. FEBS J 2011, 278, 4293–4303. [Google Scholar]
- Affenzeller, M.J.; Darehshouri, A.; Andosch, A.; Lutz, C.; Lutz-Meindl, U. Salt stress-induced cell death in the unicellular green alga Micrasterias denticulata. J. Exp. Bot 2009, 60, 939–954. [Google Scholar]
- Demidchik, V.; Cuin, T.A.; Svistunenko, D.; Smith, S.J.; Miller, A.J.; Shabala, S.; Sokolik, A.; Yurin, V. Arabidopsis root K+-efflux conductance activated by hydroxyl radicals: Single-channel properties, genetic basis and involvement in stress-induced cell death. J. Cell Sci 2010, 123, 1468–1479. [Google Scholar]
- Wang, J.; Li, X.R.; Liu, Y.B.; Zhao, X.; Chen, C.Y.; Tian, F. MEK/ERK inhibitor U0126 enhanced salt stress-induced programmed cell death in Thellungiella halophila suspension-cultured cells. Plant Growth Regul 2011, 63, 207–216. [Google Scholar]
- Shabala, S. Salinity and programmed cell death: Unravelling mechanisms for ion specific signalling. J. Exp. Bot 2009, 60, 709–711. [Google Scholar]
- Maathuis, F.J.M.; Amtmann, A. K+ nutrition and Na+ toxicity: The basis of cellular K+/Na+ ratios. Ann. Bot 1999, 84, 123–133. [Google Scholar]
- Matoh, T.; Ishikawa, T.; Takahashi, E. Collapse of ATP-induced ph gradient by sodium ions in microsomal membrane vesicles prepared from Atriplex gmelini leaves—Possibility of Na+/H+ antiport. Plant Physiol 1989, 89, 180–183. [Google Scholar]
- Garbarino, J.; Dupont, F.M. NaCl induces a Na+/H+ antiport in tonoplast vesicles from barley roots. Plant Physiol 1988, 86, 231–236. [Google Scholar]
- Yokoi, S.; Quintero, F.J.; Cubero, B.; Ruiz, M.T.; Bressan, R.A.; Hasegawa, P.M.; Pardo, J.M. Differential expression and function of Arabidopsis thaliana NHX Na+/H+ antiporters in the salt stress response. Plant J 2002, 30, 529–539. [Google Scholar]
- Adler, G.; Blumwald, E.; Bar-Zvi, D. The sugar beet gene encoding the sodium/proton exchanger 1 (BvNHX1) is regulated by a MYB transcription factor. Planta 2010, 232, 187–195. [Google Scholar]
- Burgess, A.; Vigneron, S.; Brioudes, E.; Labbé, J.-C.; Lorca, T.; Castro, A. Loss of human Greatwall results in G2 arrest and multiple mitotic defects due to deregulation of the cyclin B-Cdc2/PP2A balance. Proc. Natl. Acad. Sci. USA 2010, 107, 12564–12569. [Google Scholar]
- Shabala, L.; Ross, T.; McMeekin, T.; Shabala, S. Non-invasive microelectrode ion flux measurements to study adaptive responses of microorganisms to the environment. FEMS Microbiol. Rev 2006, 30, 472–486. [Google Scholar]
- Jayakannan, M.; Babourina, O.; Rengel, Z. Improved measurements of Na+ fluxes in plants using calixarene-based microelectrodes. J. Plant Physiol 2011, 168, 1045–1051. [Google Scholar]


| Trait | Q5206 (sensitive) | Q16 (tolerant) |
|---|---|---|
| Na+ uptake into mesophyll | High | Low |
| Active Na+ exclusion | Low | High |
| Cytosolic Na+ level | High | Low |
| K+ retention in leaf mesophyll | Low | High |
| Ability to restore MP | Low | High |
| FV activity a | High | Low |
| SV density b | High | Low |
© 2013 by the authors; licensee MDPI, Basel, Switzerland This article is an open access article distributed under the terms and conditions of the Creative Commons Attribution license (http://creativecommons.org/licenses/by/3.0/).
Share and Cite
Bonales-Alatorre, E.; Pottosin, I.; Shabala, L.; Chen, Z.-H.; Zeng, F.; Jacobsen, S.-E.; Shabala, S. Differential Activity of Plasma and Vacuolar Membrane Transporters Contributes to Genotypic Differences in Salinity Tolerance in a Halophyte Species, Chenopodium quinoa. Int. J. Mol. Sci. 2013, 14, 9267-9285. https://doi.org/10.3390/ijms14059267
Bonales-Alatorre E, Pottosin I, Shabala L, Chen Z-H, Zeng F, Jacobsen S-E, Shabala S. Differential Activity of Plasma and Vacuolar Membrane Transporters Contributes to Genotypic Differences in Salinity Tolerance in a Halophyte Species, Chenopodium quinoa. International Journal of Molecular Sciences. 2013; 14(5):9267-9285. https://doi.org/10.3390/ijms14059267
Chicago/Turabian StyleBonales-Alatorre, Edgar, Igor Pottosin, Lana Shabala, Zhong-Hua Chen, Fanrong Zeng, Sven-Erik Jacobsen, and Sergey Shabala. 2013. "Differential Activity of Plasma and Vacuolar Membrane Transporters Contributes to Genotypic Differences in Salinity Tolerance in a Halophyte Species, Chenopodium quinoa" International Journal of Molecular Sciences 14, no. 5: 9267-9285. https://doi.org/10.3390/ijms14059267
APA StyleBonales-Alatorre, E., Pottosin, I., Shabala, L., Chen, Z.-H., Zeng, F., Jacobsen, S.-E., & Shabala, S. (2013). Differential Activity of Plasma and Vacuolar Membrane Transporters Contributes to Genotypic Differences in Salinity Tolerance in a Halophyte Species, Chenopodium quinoa. International Journal of Molecular Sciences, 14(5), 9267-9285. https://doi.org/10.3390/ijms14059267