Article

Plant Core Environmental Stress Response Genes Are Systemically Coordinated during Abiotic Stresses

Center for Plant Molecular Biology (ZMBP), Plant Physiology, University of Tübingen, Auf der Morgenstelle 1, Tübingen 72076, Germany
*
Author to whom correspondence should be addressed.
These authors contributed equally to this work.
Int. J. Mol. Sci. 2013, 14(4), 7617-7641; https://doi.org/10.3390/ijms14047617
Submission received: 1 February 2013 / Revised: 28 March 2013 / Accepted: 29 March 2013 / Published: 8 April 2013
(This article belongs to the Special Issue Abiotic and Biotic Stress Tolerance Mechanisms in Plants)

Abstract

:
Studying plant stress responses is an important issue in a world threatened by global warming. Unfortunately, comparative analyses are hampered by varying experimental setups. In contrast, the AtGenExpress abiotic stress experiment displays intercomparability. Importantly, six of the nine stresses (wounding, genotoxic, oxidative, UV-B light, osmotic and salt) can be examined for their capacity to generate systemic signals between the shoot and root, which might be essential to regain homeostasis in Arabidopsis thaliana. We classified the systemic responses into two groups: genes that are regulated in the non-treated tissue only are defined as type I responsive and, accordingly, genes that react in both tissues are termed type II responsive. Analysis of type I and II systemic responses suggest distinct functionalities, but also significant overlap between different stresses. Comparison with salicylic acid (SA) and methyl-jasmonate (MeJA) responsive genes implies that MeJA is involved in the systemic stress response. Certain genes are predominantly responding in only one of the categories, e.g., WRKY genes respond mainly non-systemically. Instead, genes of the plant core environmental stress response (PCESR), e.g., ZAT10, ZAT12, ERD9 or MES9, are part of different response types. Moreover, several PCESR genes switch between the categories in a stress-specific manner.

1. Introduction

Plants follow a sessile lifestyle and, thus, display a wide ecological plasticity that allows them to adapt to environmental changes by modulating their physiology, growth and development. Although some cells and organs act partly autonomous upon external stimuli, adaptive processes require extensive local and systemic coordination, e.g., during biotic or abiotic stress responses [15]. After local stress perception, the information has to be communicated to the rest of the organism by the generation and spread of systemic signals.
Systemic signaling employs various kinds of molecules and is not restricted to stress notification alone. Hormones, such as auxin or strigolactones, are transported from the place of synthesis through the plant to function systemically [6]. In addition, siRNA molecules and possibly ssRNA transmit systemic information and synchronize plant development [79]. Some peptides and proteins also constitute mobile signals, such as FT, which is required for flower induction, or TMO7, which is involved in embryonic root specification [1012].
Salicylic acid (SA) and jasmonate (JA) are well-known systemic signals that are locally induced upon pathogen and herbivore attack and are rapidly transported throughout the plant to established systemic acquired resistance (SAR) in non-challenged tissues [1316]. In addition, azelaic acid was discovered as a mobile metabolite that most likely primes the plant for SAR and might also activate the secreted, putatively mobile protein AZI1 [17].
Recently, it became evident that reactive oxygen species (ROS) are involved in a multitude of developmental processes and stress response pathways [1823]. Also electrical signals might contribute as effective systemic signals, which can rapidly be transmitted as action potentials, voltage potentials or as proposed system potentials [2426]. In addition, a hydraulic signal migrates systemically from the roots to the shoots during drought stress [27,28]. Although the importance of systemic signaling has been known for a long while in plants, it is still not well understood. The characterization of the signaling processes on a genetic basis is difficult, because of the diverse molecule types, which presumably transduce partially redundant systemic information upon various external stimuli.
Studies in yeast have uncovered general stress responses, which were shown to activate similar sets of genes by various stresses [2931]. These sets of genes are known as common environmental response (CER) in Saccharomyces cerevisiae[32] or core environmental stress response (CESR) in Schizosaccharomyces pombe[33]. Therefore, CER or CESR can be considered as stereotypical gene expression changes that occur during a multitude of different stresses [30,32,33]. Individual genes, however, might not be necessarily regulated by every stress. It is noteworthy that these stress responses are, at least partly, conserved between Saccharomyces cereviae and Schizosaccharomyces pombe. While it still remains unknown what kind of roles these genes might play, it seems evident that a common battery of responses can be triggered by various stresses.
In analogy to the common environmental stress responses in yeast, we identified sets of genes that were commonly responsive in several stresses of the AtGenExpress abiotic stress experiment [3,4,34]. A considerable portion of the immediate early responsive genes is differentially expressed in more than only one stress treatment and might represent a plant core environmental stress response (PCESR). Importantly, this PCESR is not restricted to Arabidopsis thaliana, but appears to be conserved between different plant species, such as rice, barley or wheat [3,3537]. These early-induced, common genes are not related to those responsible for the CESR in yeast cells, which suggests that distinct stress response pathways are required during plant evolution [4,32,33].
Here, we make use of the intercomparability of the nine stresses of the AtGenExpress abiotic stress experiment [4,34]. Six of these stresses were applied to either the shoots or the roots and, hence, allow the comparative investigation of the systemic environmental stress response. We found that gene expression trajectories can be classified into three distinct categories: non-systemic (regulated in the stressed tissue only), systemic type I (regulated in the non-treated tissue only) or systemic type II (regulated in both tissues). Although these categories display distinct functional groups, they still partially overlap between the different stresses and response types. Moreover, meta-analysis suggests that several of the stress responsive gene loci are also SA or JA responsive. We show that type II systemic expression responses are more stress specific than others. In contrast, PCESR genes are common to several abiotic stresses, but are rather promiscuous for the response types. Most PCESR genes have paralogs that transduce presumably redundant information of the incoming stresses, which reveals a possible backup function.

2. Results

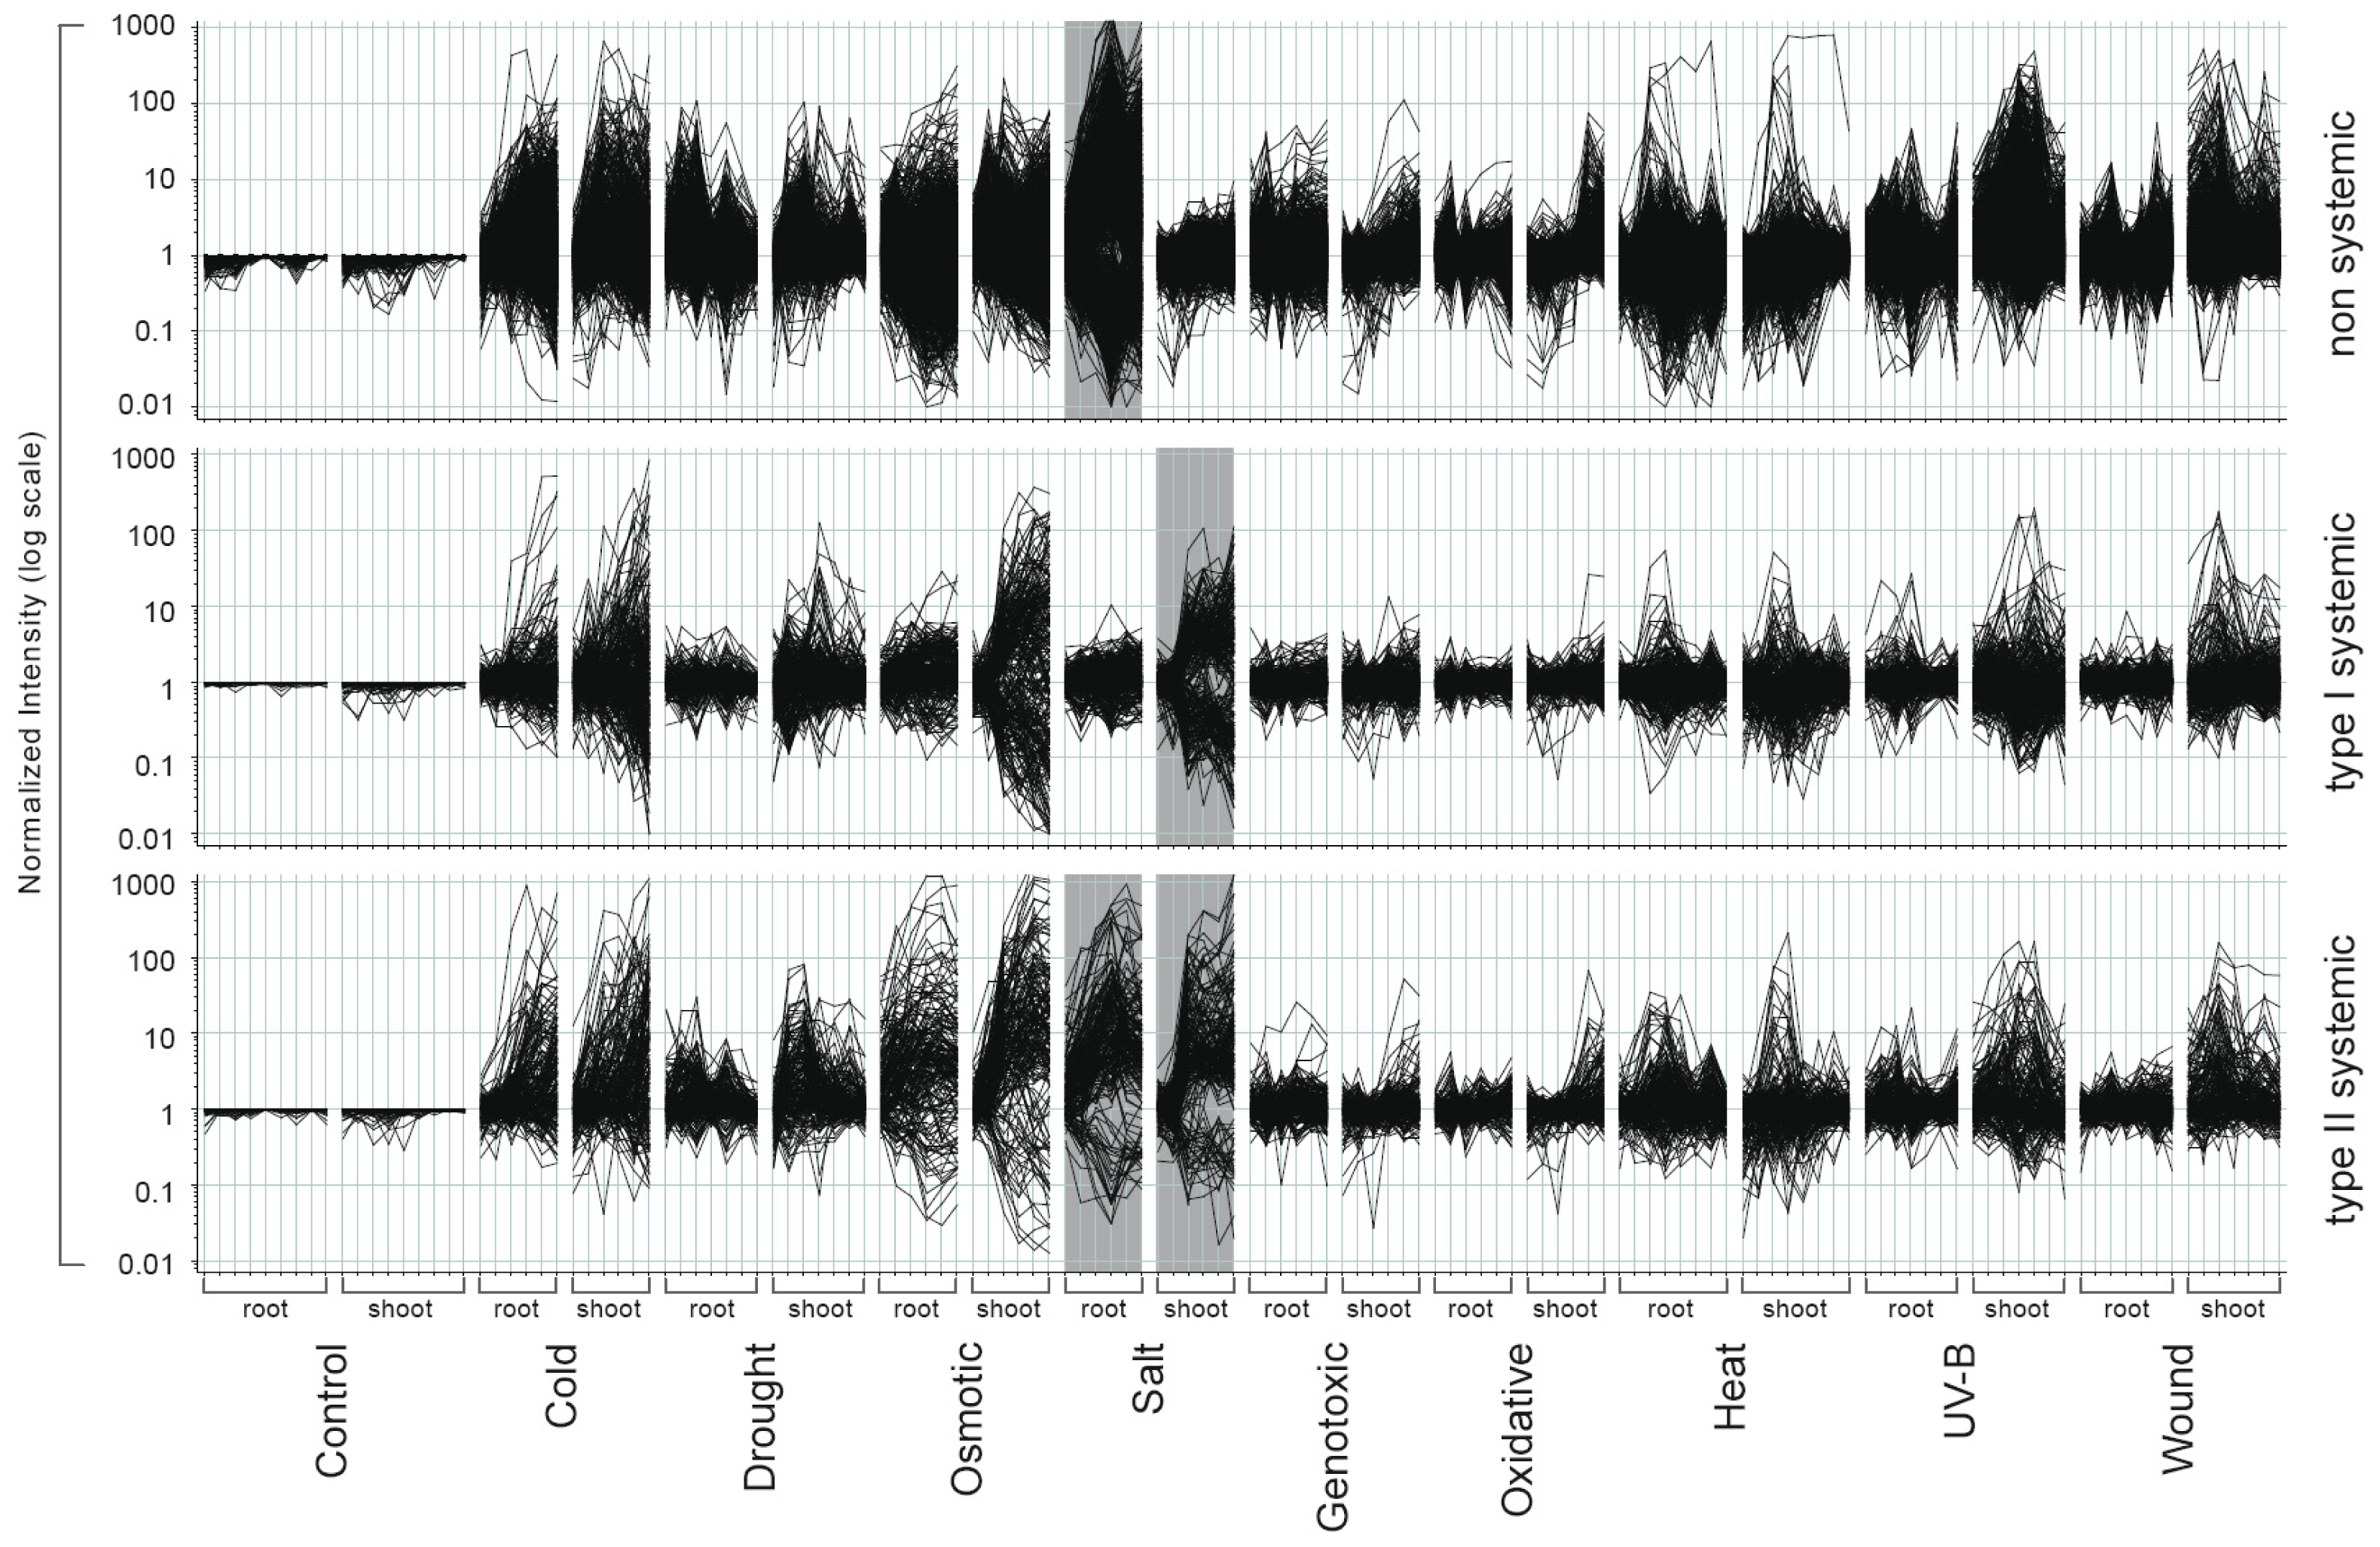
2.1. Gene Expression Responses Follow a Highly Diverse Pattern during Abiotic Stresses

The analysis of the AtGenExpress abiotic stress experiment disclosed a plethora of gene expression responses also in those tissues that were not directly exposed to the stress treatment [4,34]. We observed both non-systemic and systemic responses to characterize a specific abiotic stress response in Arabidopsis thaliana. To dissect these responses and to provide a detailed description of our observations, we need to extend the basic terminology into three principal response types of gene expression (Figure 1). Genes that are differentially expressed in the treated tissue only display a non-systemic response (Figure 1A). We next divided the systemic responses into two categories. A type I systemic response displays gene expression changes exclusively in the non-treated tissue, while, conversely, a type II systemic response is characterized by gene expression changes in both the treated and non-treated tissue (Figure 1A). We exemplified these three principal response types for a subset of genes that were responsive after UV-B light treatment (Figure 1B).

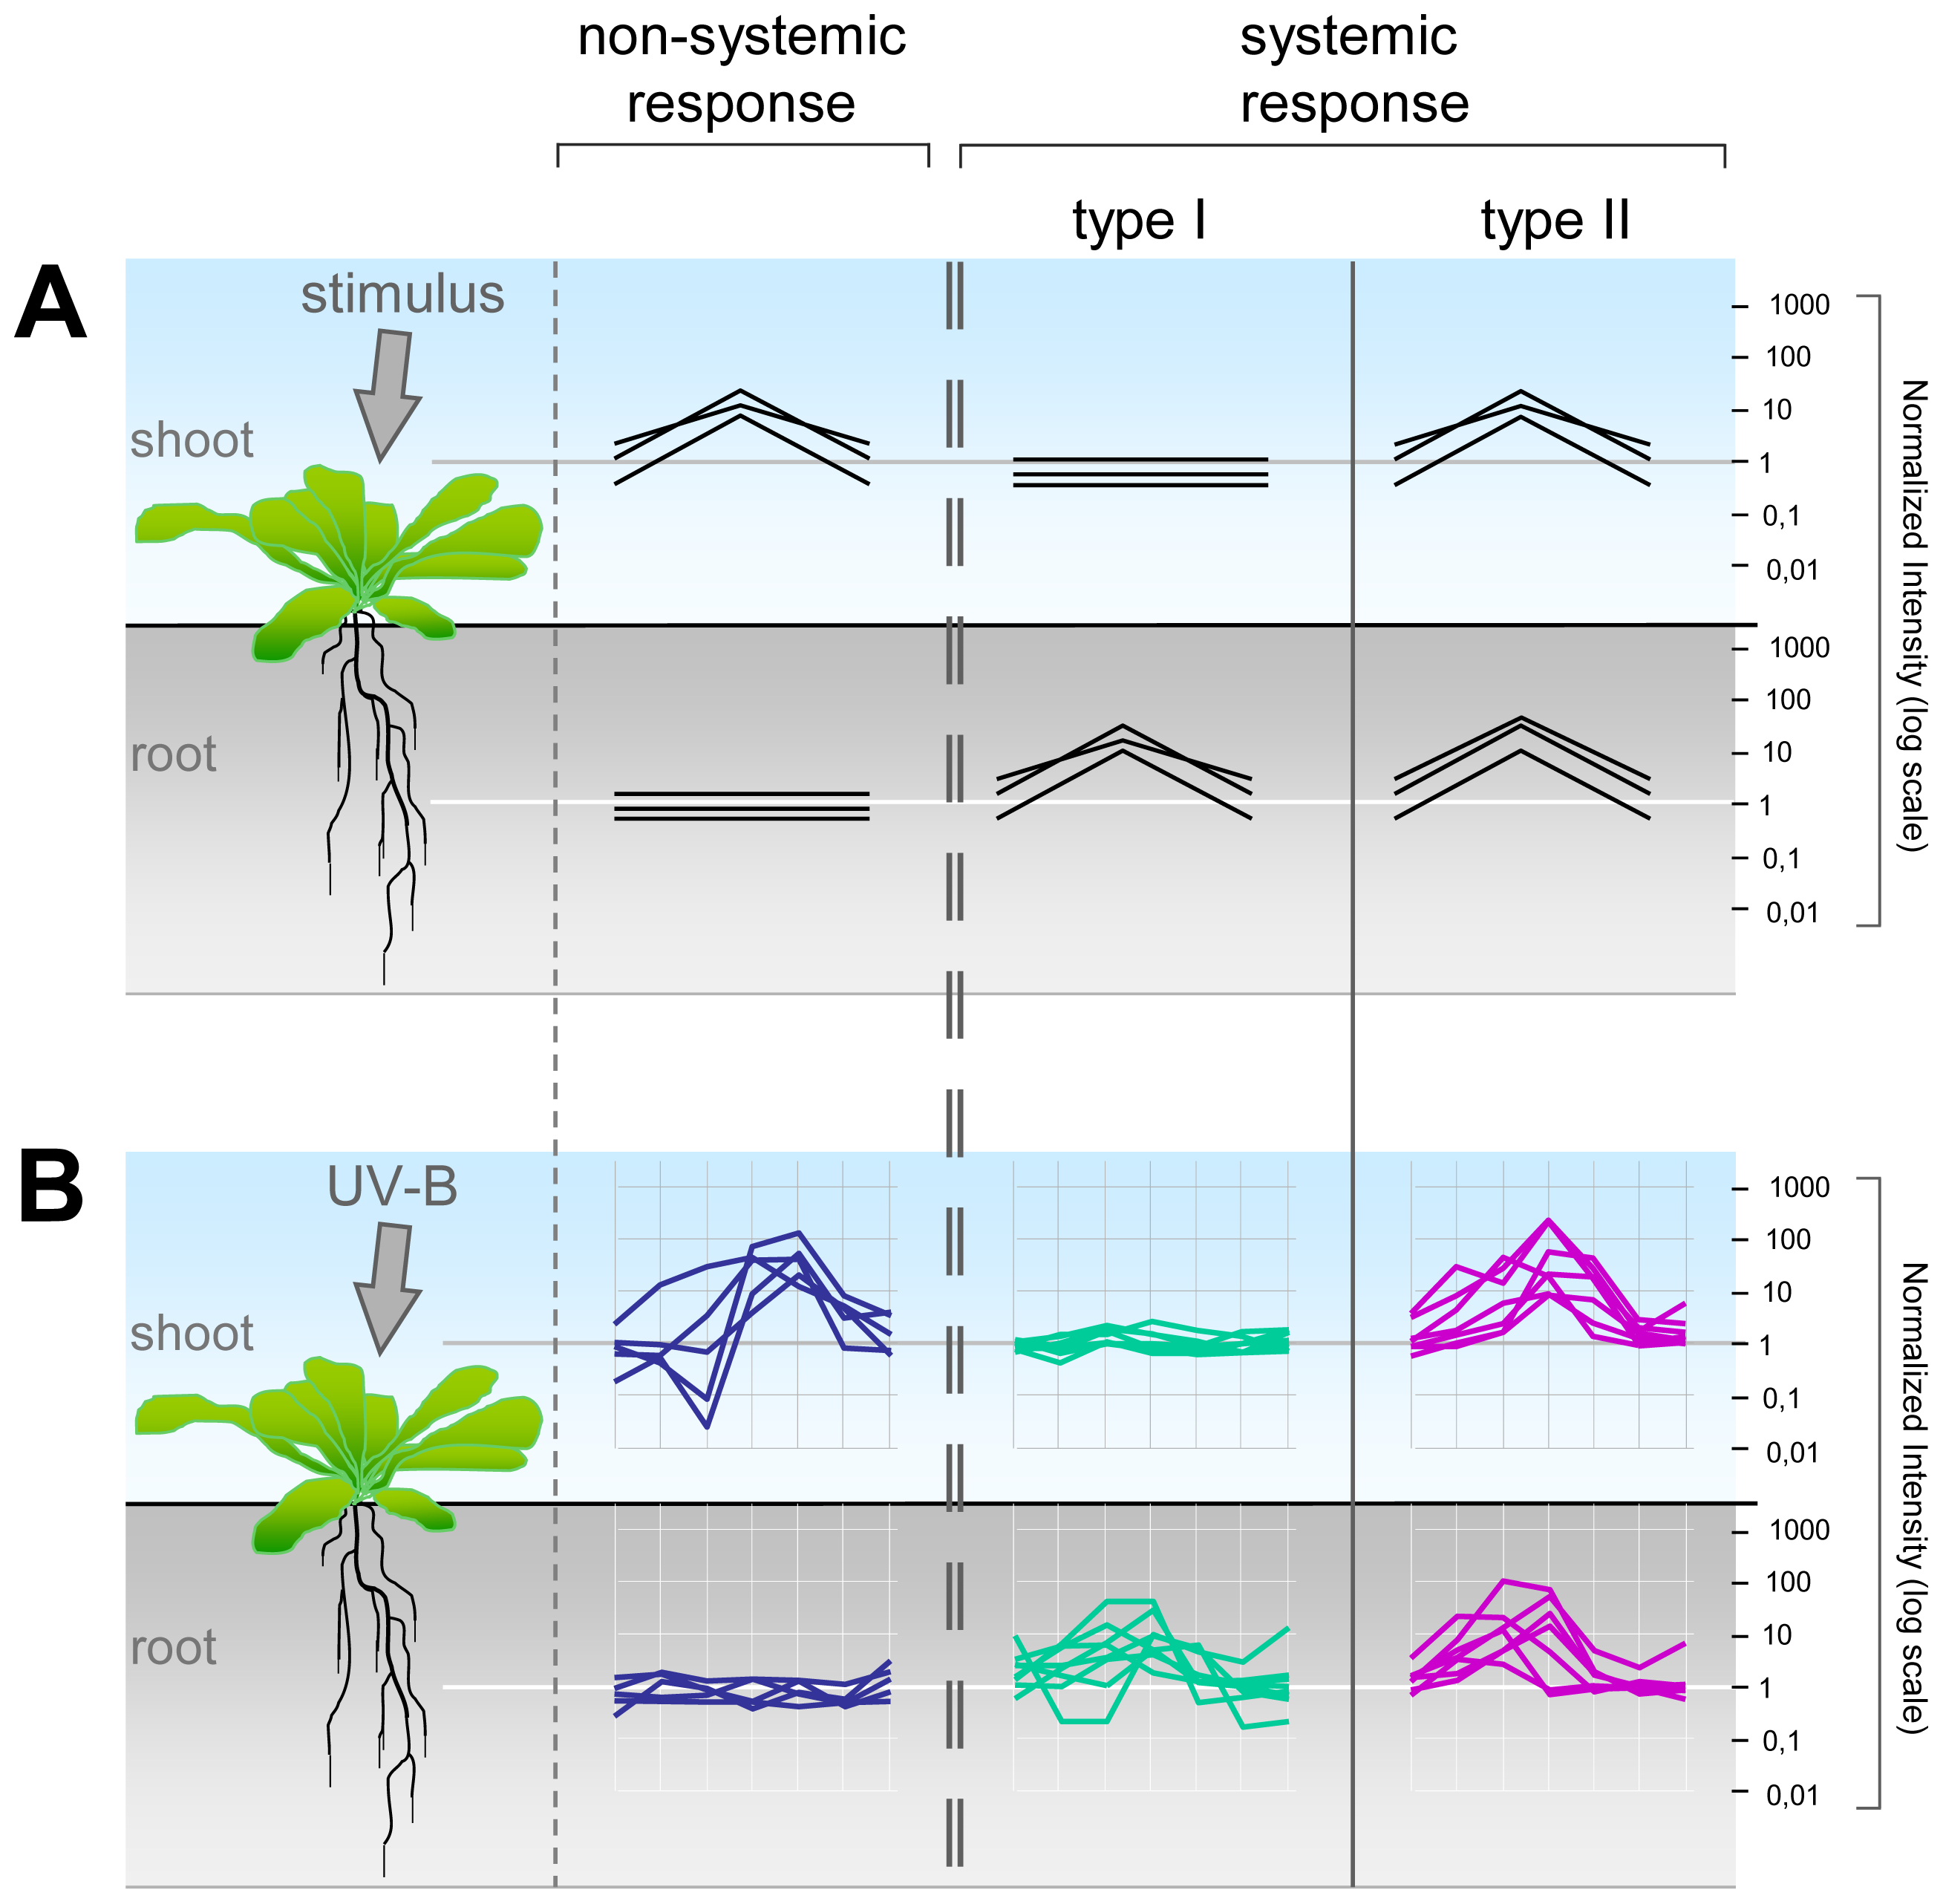
2.2. Systemic and Non-Systemic Gene Expression Responses

We applied these definitions to our previously described multidimensional AtGenExpress abiotic stress microarray dataset, which currently provides the unique opportunity of intercomparability between nine different environmental conditions or between the shoot and the root tissue [3,4,34]. Most important for our present analyses are six stresses, i.e., genotoxic, osmotic, oxidative, salt, UV-B and wounding stress, that were applied either to the shoot or the root exclusively. Nevertheless, the three remaining stresses, i.e., drought, cold, and heat, serve as our controls for data validation, because these stresses were simultaneously applied to both tissues and, hence, we can expect overlapping local and systemic responses throughout the entire organism.
To unambiguously categorize differentially expressed genes into the three response types, we applied a chronology-dependency filter to the previously described sets of differentially expressed genes [4]. We require that only those genes are classified, which exhibit differential expression in two consecutive samples with the same trend in both of the replicates. This approach effectively removes outliers and fluctuating gene expression pattern from time series datasets. On the one hand, we are aware that relevant stress-specific information is lost in this process, especially in comparison with the many genes previously identified [4,34]. On the other hand, plain and unequivocal expression response patterns of high informative value are disclosed. These non-systemic, type I and type II systemic responses provide precious information, which are otherwise hidden within complex and partially overlapping expression trajectories.
Indeed, each stress experiment uncovered genes that could be placed in one of the three categories, which indicates the elicitation of systemically activated gene expression after any treatment. In most stress treatments, the highest number of regulated genes is observed locally in the non-systemic organ directly exposed to the stimulus (Table 1; Table S1). In general, the salt, osmotic and UV-B stress treatments affect more genes, compared with genotoxic and wounding stress. There are more systemic type I responsive genes found during the osmotic and oxidative stresses than during the non-systemic response, which underlines a rapid alarm signaling mechanism between the treated and the systemic organs.
Most noteworthy, there was only a single gene of yet unknown function (At3g20340) that was type II responsive during oxidative stress (Table 1). In addition, more type I than type II responsive genes are regulated during the osmotic, salt, wounding and oxidative stress treatments.

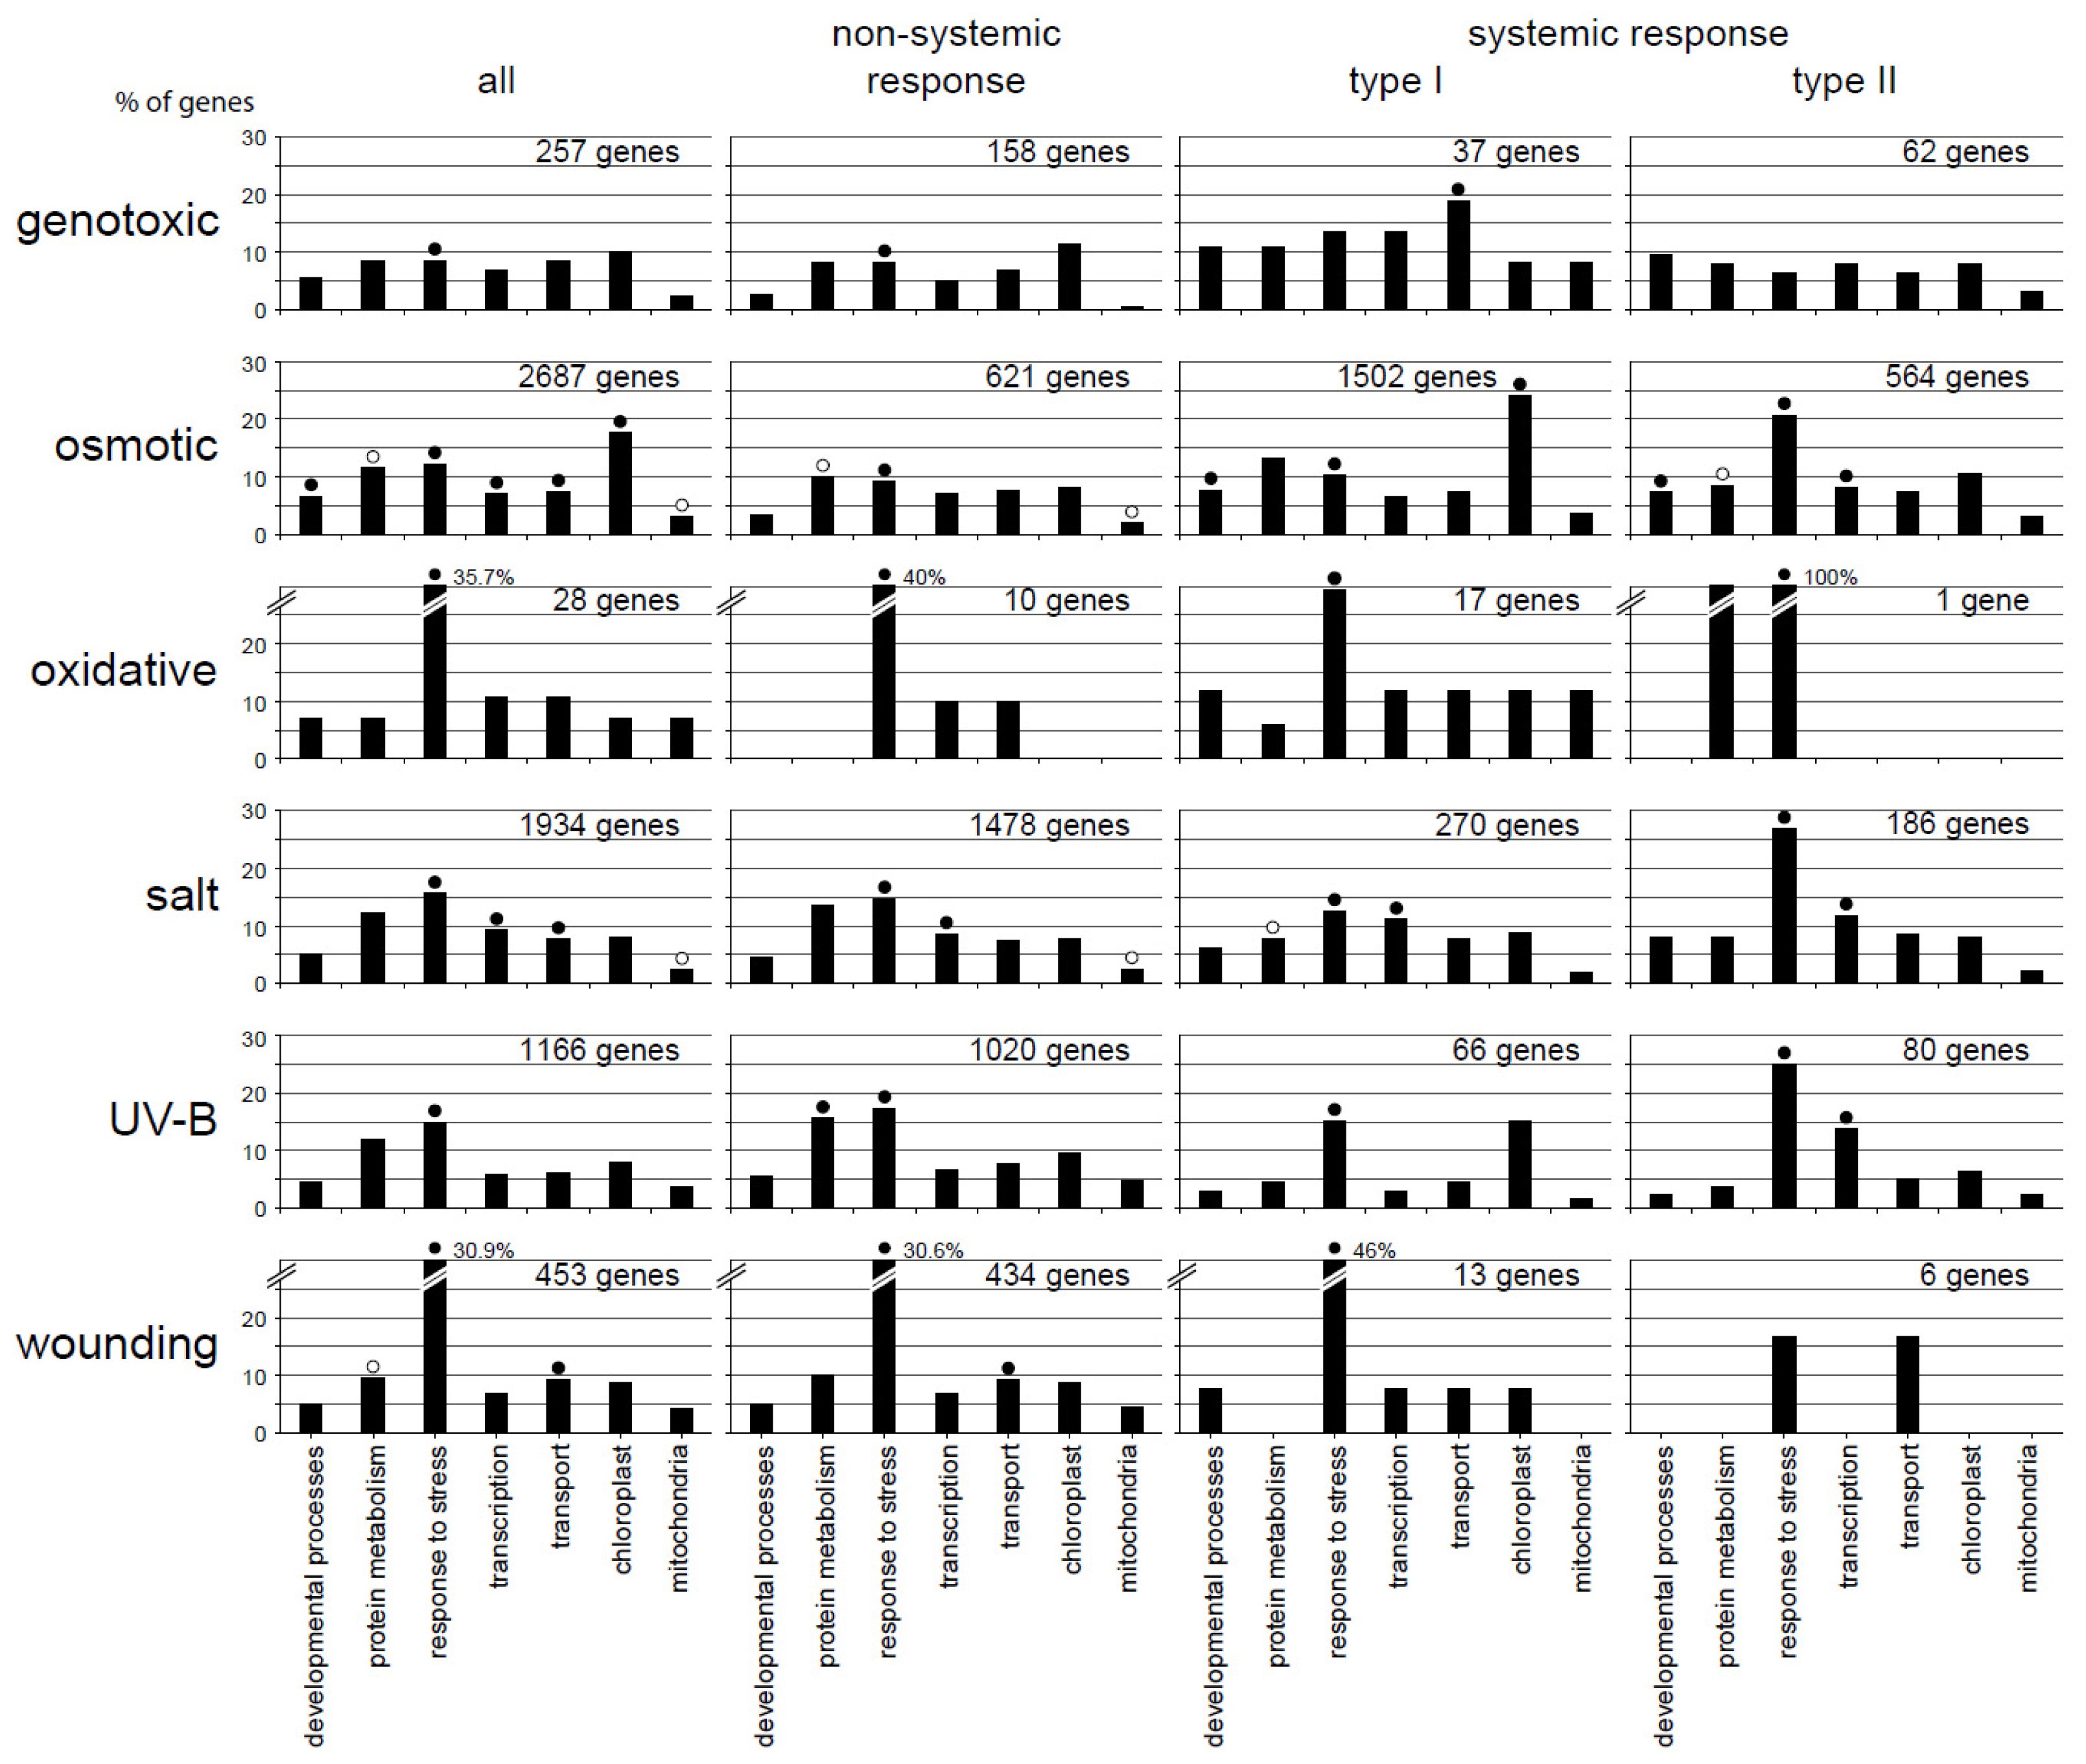
2.3. Functional Categorization Uncovers Specificity in the Different Response Patterns

A subset of gene ontology (GO) terms was used to classify genes with respect to their putative function (Figure 2). Remarkably, the comparison between all differentially expressed genes and the non-systemic, type I and type II responsive genes revealed significant differences in the GO terms. There is one exception, however, nearly all conditions and categories are enriched for the GO term “stress response,” which is consistent with the types of experiments.
As all of our distinct stress response types contain genes that are linked with “stress response”, we propose that several of those genes are non-specifically responding to many different stress stimuli. This observation can be explained by gene sets that are shared between the GO categories of different treatments, as was proposed before [4], or by genes that switch between our response types in a stress-dependent manner.
Besides the ubiquitous “stress response”, it is noteworthy that some responses involve the categories “developmental processes”, “transcription”, or “organelles”. We noted already that these functional categories are common to almost all stress responses and are shared between different plant species [3]. In addition, significant GO terms differ between the response types and did not correlate with the number of genes [osmotic vs. salt vs. UV-B] or [genotoxic vs. wounding] and, hence, indicate an overall difference in stress response pattern.

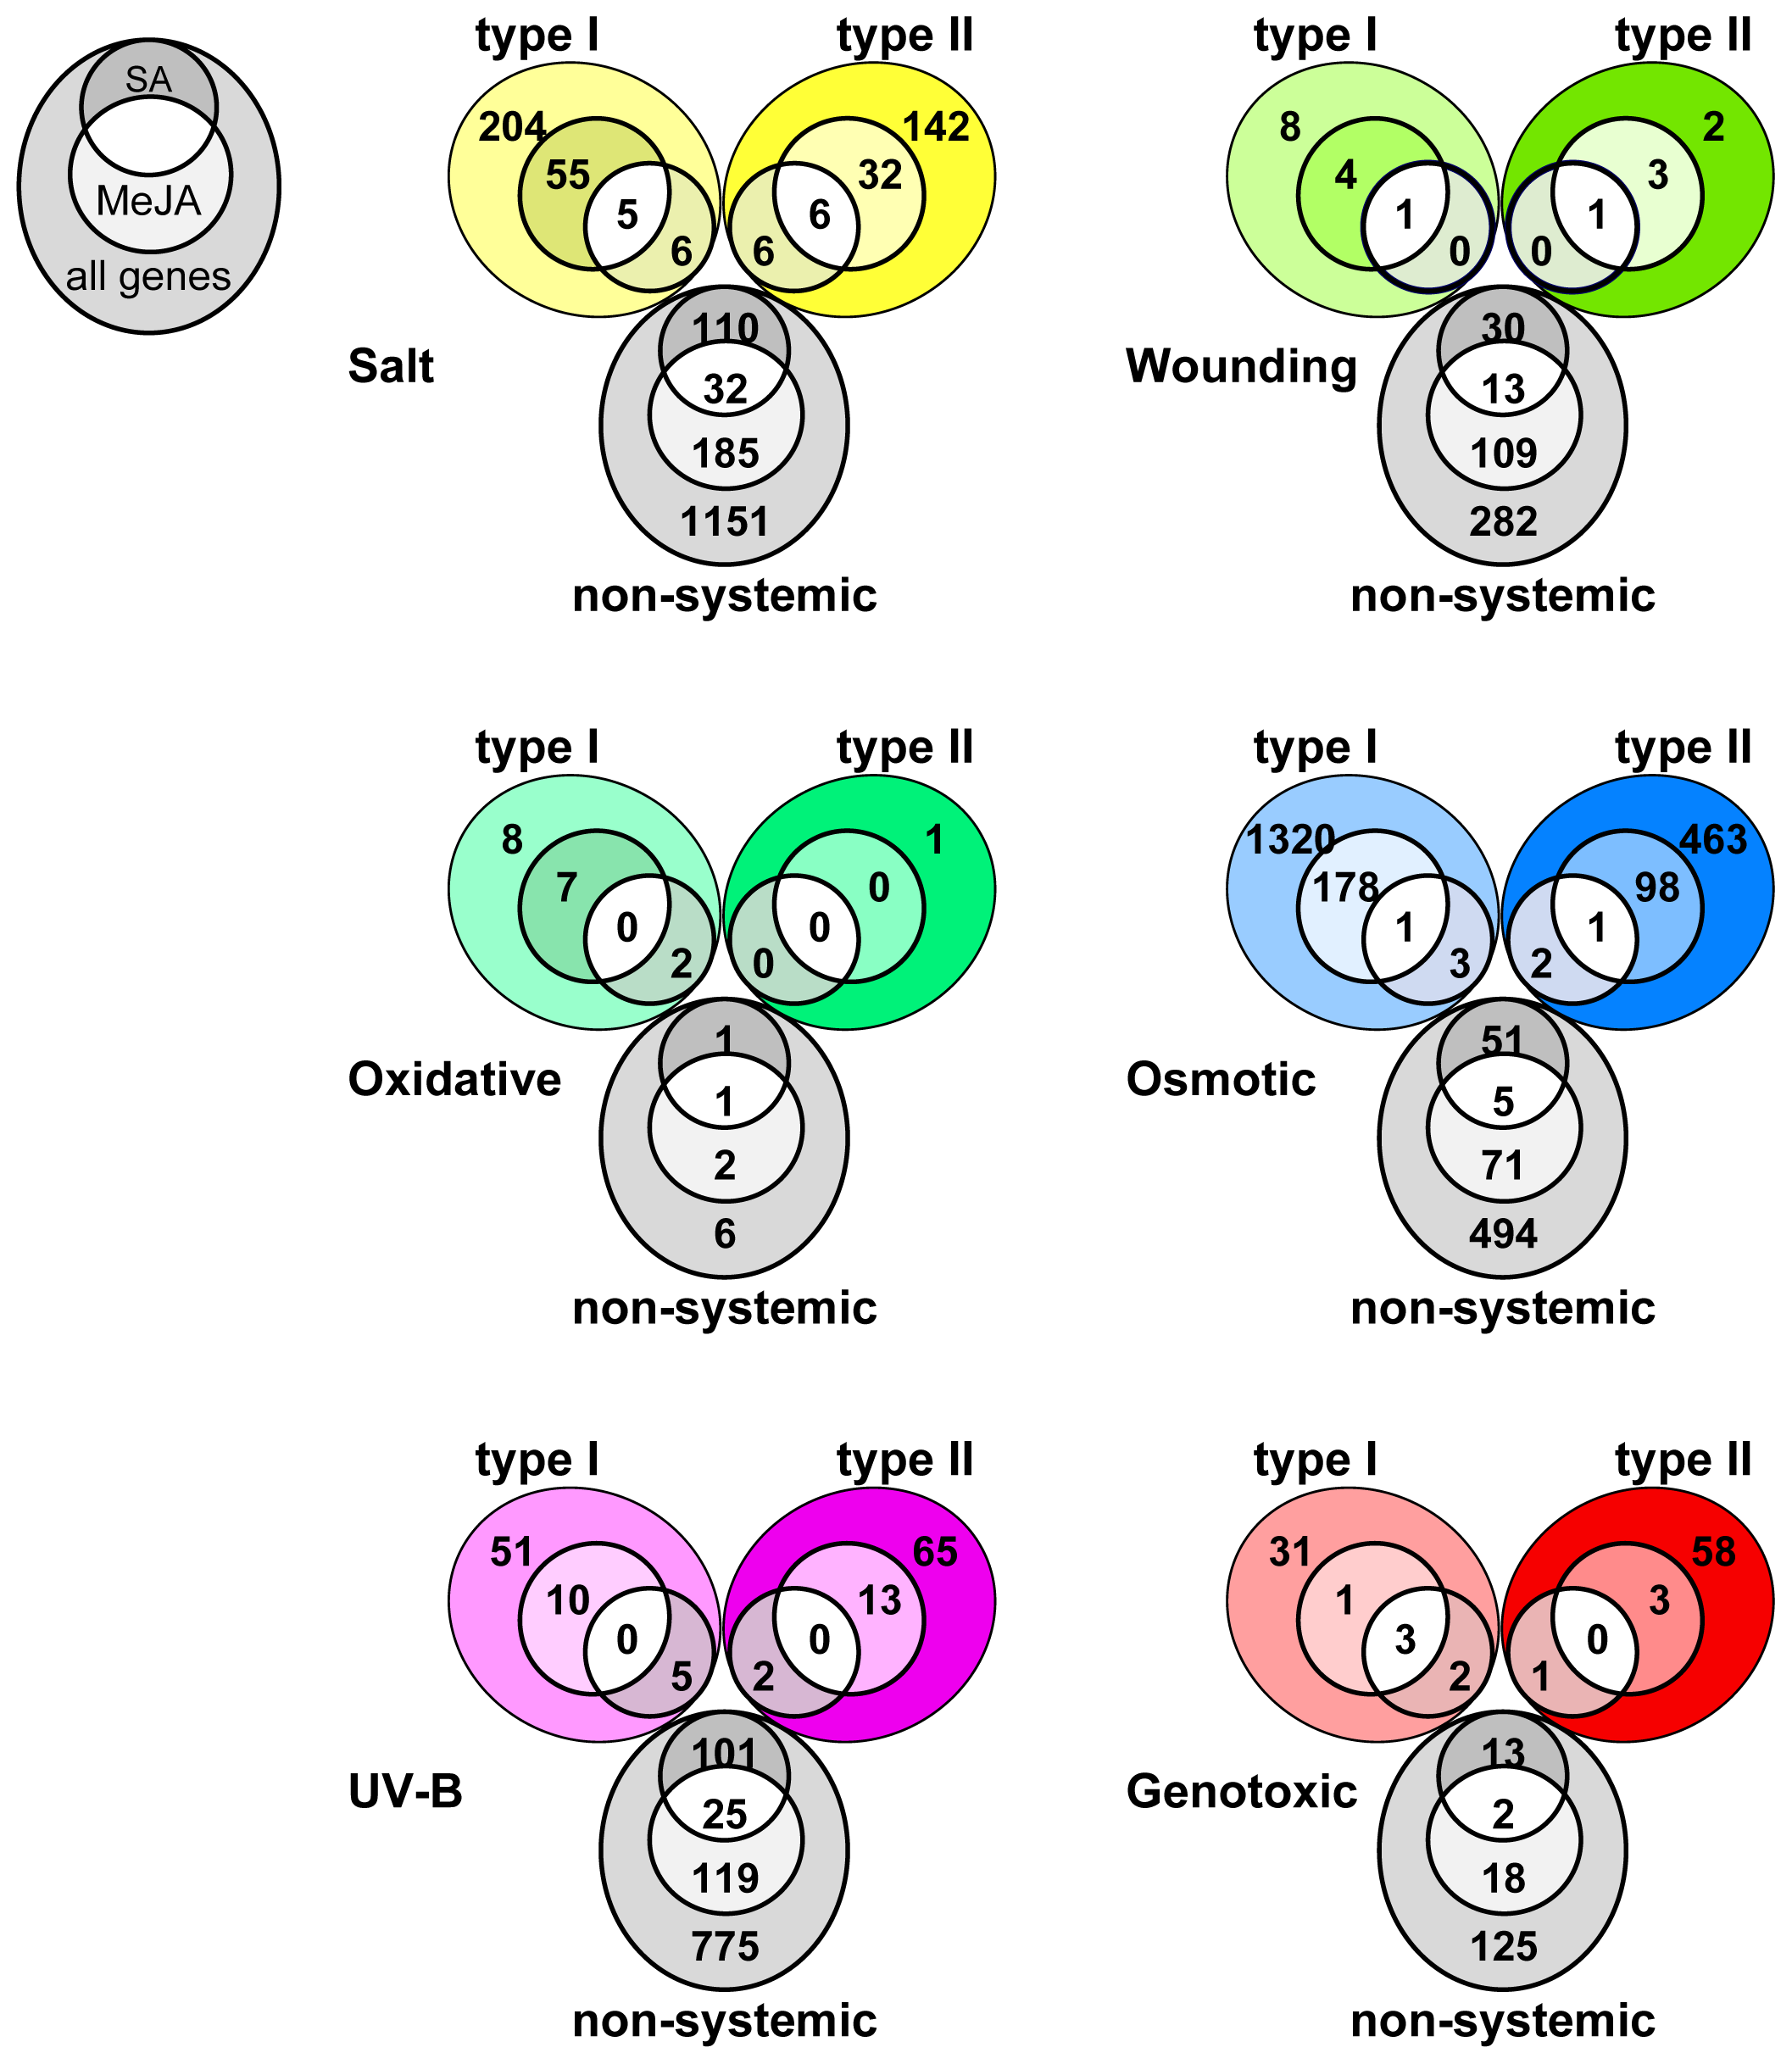
2.4. Overlap in Non-Systemic, Type I and Type II Systemic Stress Responses

We have described that considerable overlap between stress responses exists [34]. Especially diverse and seemingly unrelated stresses such as cold, drought and UV-B light stress treatments share a set of common genes, in addition to a generally independent transcriptional response pattern [4]. To gain a more detailed insight into the specificity of systemic or local stress responses, we next examined the responsive gene overlap between our non-systemic, type I systemic and type II systemic datasets amongst the six different stresses.
A hierarchical graph of the stress responsive gene sets was generated (Figure 3): nodes (gene sets) and directed edges (connecting arrows) are shown proportionally to the total number of genes. As the number of genes inside the sets varies from very few to many regulated genes (Table 1), we choose 10% as the minimal shared rate to equally represent all datasets. The graph separates into two major clusters in the non-systemic expression responses with overlap in the salt and osmotic or the UV-B light and wounding stress responses. This split represents the major differences between the root or the shoot [4].
We can conclude that the principal component of the tissue, to which the stress was applied, dominates over the response type (Figure 3). This tissue-dependent expression is also found in the type I systemic gene sets, even though they are triggered by treatments, which are applied in the non-systemic tissue.
In contrast, the oxidative stress treatment does not activate a unique set of genes and, instead, its genes are found responsive within the other stresses. This is consistent with previous reports about the general involvement of reactive oxygen species (ROS) in many different stresses [18,19,21,34]. Similarly, the genotoxic treatment induces sets of gene expression changes that overlap with many other stresses, but exhibits also specific non-overlapping expression trajectories.
Systemic type II genes have a more complex patterning when compared to the non-systemic or type I systemic gene sets. Interestingly, the type II systemic responses display only little overlap between the type II responses of the other stresses. Instead, significant overlap with the response types of the other stresses exists. Thus, type II systemic response genes are more stress specific than non-systemic or type I systemic genes. In contrast, distinct sets of non-systemic or type I systemic genes respond independently in either the shoot or the root.

2.5. The Systemic Stress Response Utilizes Jasmonic Acid

We have shown that the successful stress response requires both the coordinated systemic and non-systemic expression responses. In addition, there is significant overlap between the stress responses in both the treated and the non-treated tissues, which requires yet unknown systemic signaling modules for the rapid coordination of gene expression throughout the entire plant.
To address whether already known signaling molecules such as salicylic acid (SA) or methyl-jasmonate (MeJA) might at least partially be involved in the systemic expression responses, we compared our gene lists with already published microarray data on SA and MeJA signaling (Figure 4).
We find SA and MeJA to be involved in the systemic stress responses, as has been described before [1416,19,38,39]. Interestingly, there is considerable overlap between SA responsive and the non-systemic responsive genes irrespective of the kind of stress. A similar observation is found for MeJA and, thus, both hormones are important for the local non-systemic response. In contrast, type I and type II systemic responses predominantly share genes with the MeJA responses, while the overlap with SA is negligible in the systemic tissue. A portion of genes appears to be under the control of both phytohormones in the non-systemic tissues.
These data suggest that MeJA is a good candidate for the coordination of gene expression in the systemic stress response, whereas the concerted action of SA and MeJA is implicated in the local non-systemic responses.

2.6. WRKY Genes Are Mainly Involved in the Non-Systemic Stress Response

We have shown that there is a considerable amount of overlap between different stress responses that involves MeJA for its systemic coordination. Gene expression is controlled by transcription factors, and the WRKY transcription factor genes are well known to be responsive during biotic and abiotic stresses [4043]. To investigate whether these transcription factors might be involved in the coordination of either the type I or type II stress responses, we compared our datasets with all 61 WRKY genes present on the microarray. The majority of the WRKY genes is not involved in the systemic stress response, but implies a substantial function almost exclusively in the treated non-systemic tissue (Table 2). Consistently, we analyzed the occurrence of cis-regulatory elements in each of the response types and found that the cognate W-box binding motif of WRKY transcription factors is exclusively enriched in the non-systemic responsive genes (Table S3).

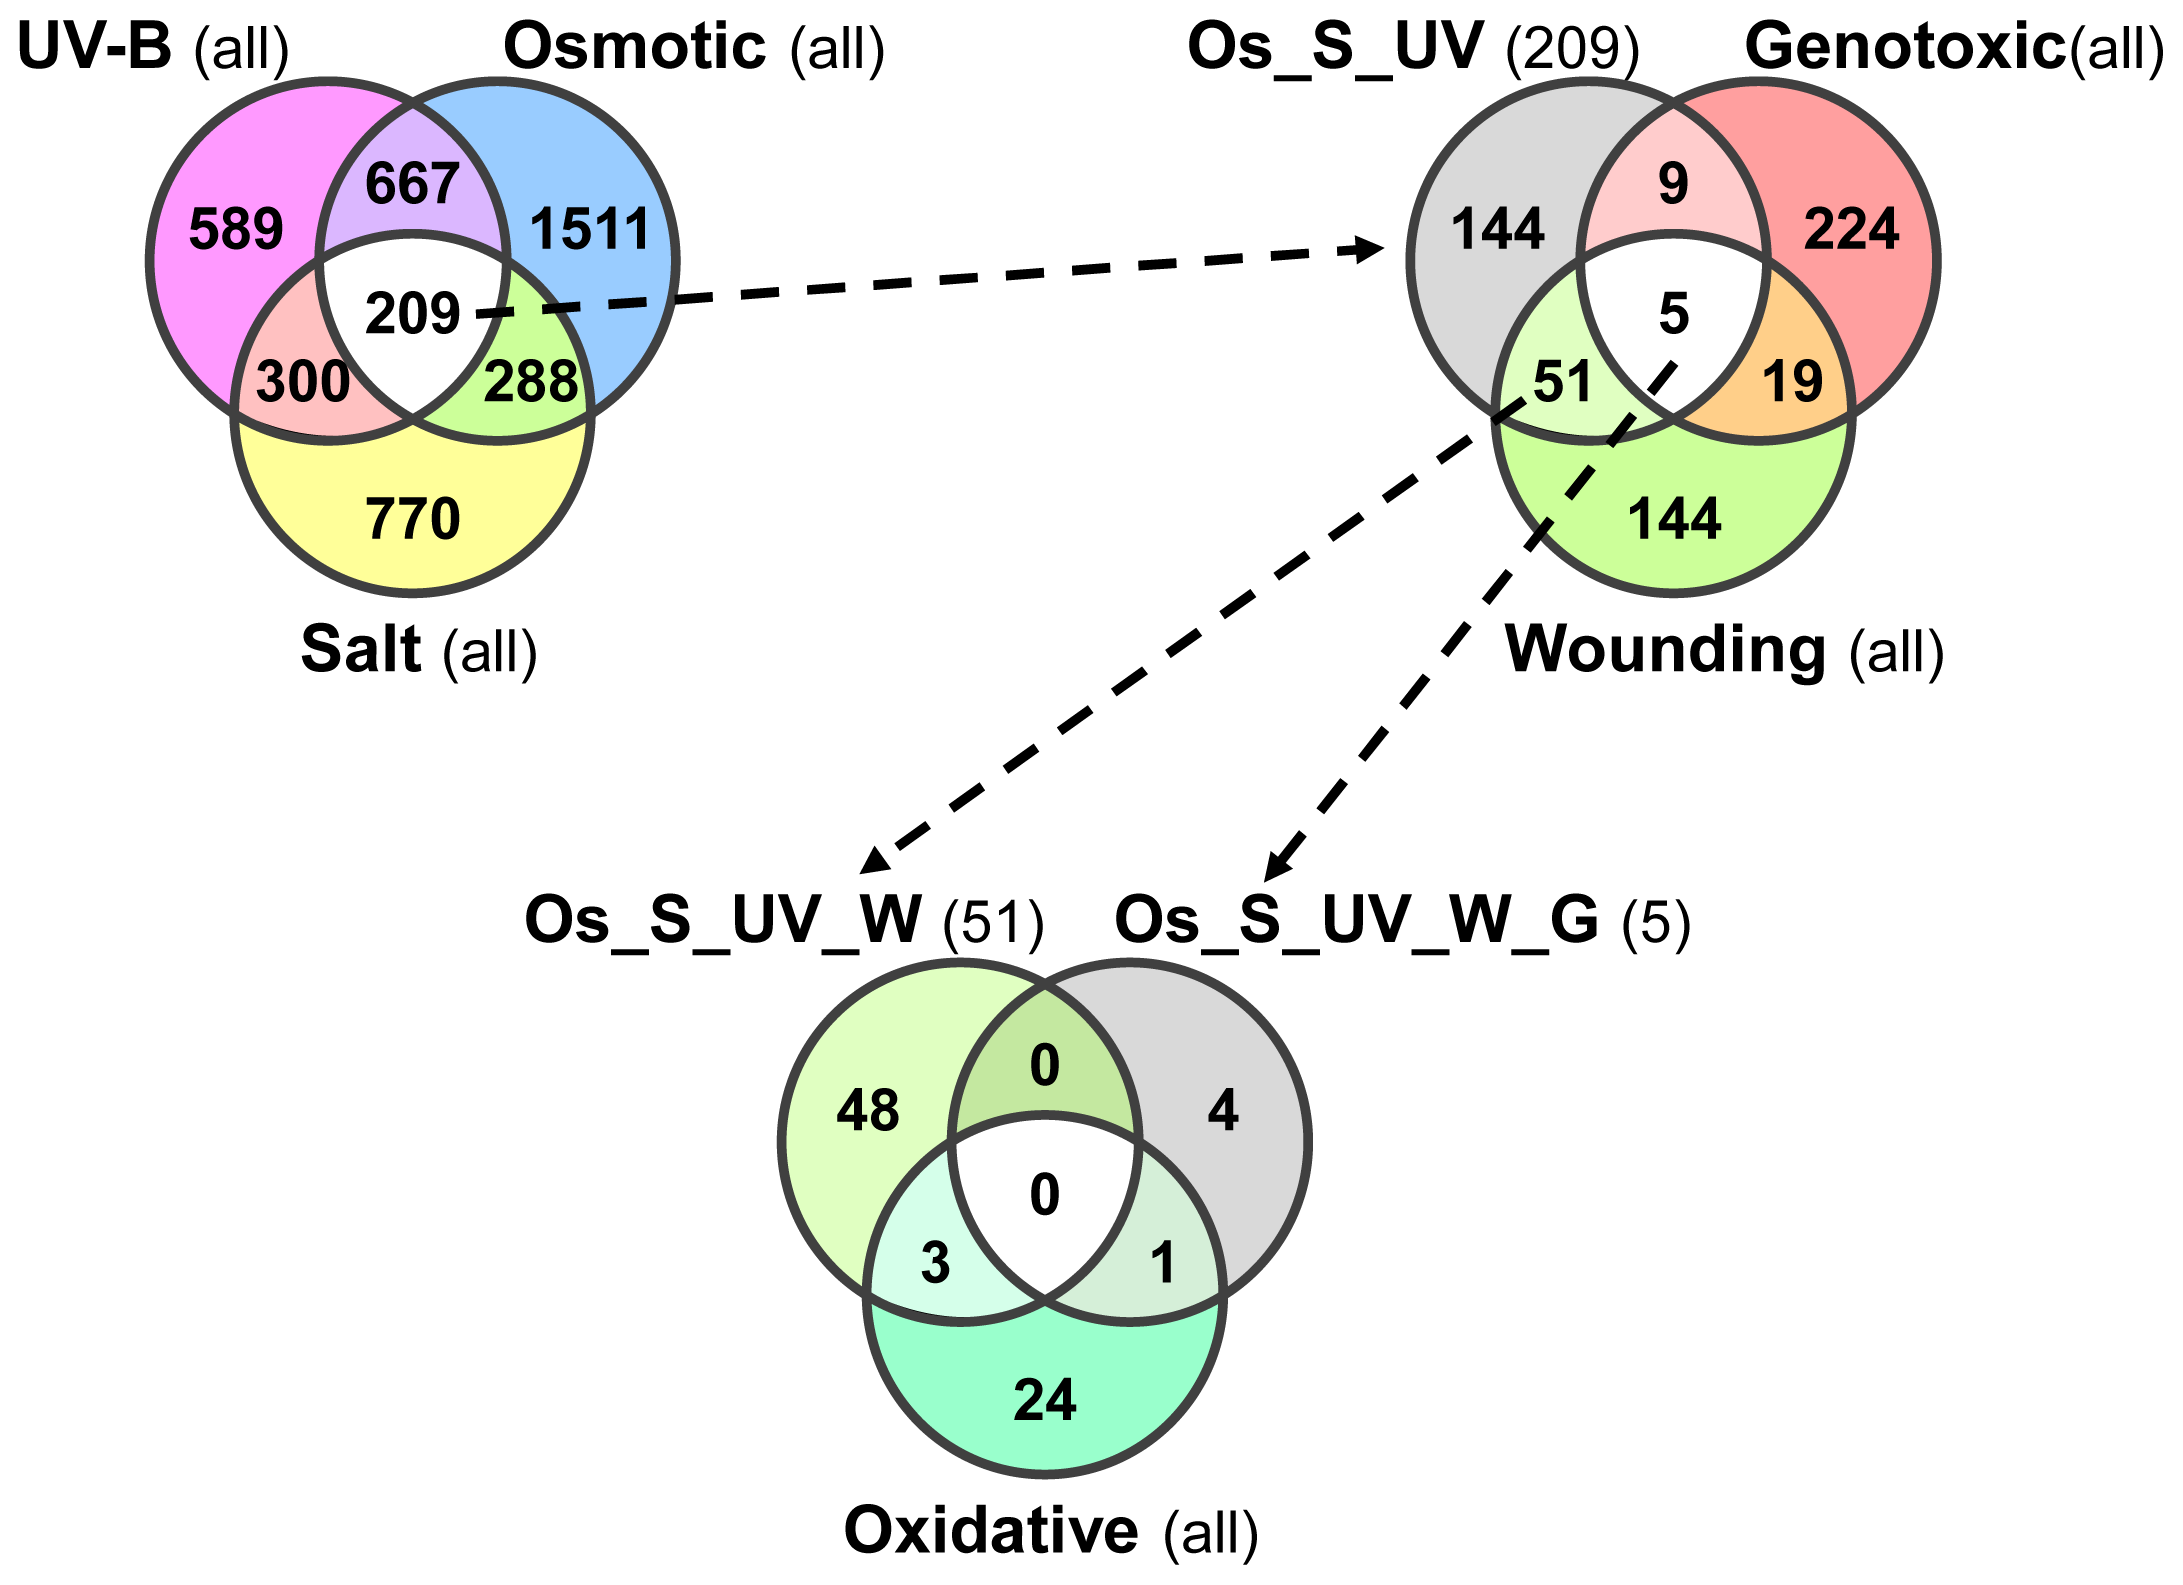
2.7. Plant Core Environmental Stress Response (PCESR) Genes

Besides the stress specific gene expression responses, it was noted that a group of genes exists that is differentially expressed in almost any biotic or abiotic stress condition. Therefore, we mined the AtGenExpress abiotic stress experiment for putative Plant Core Environmental Stress Response (PCESR) genes that are involved in most of the nine stresses, as was suggested also in previous publications [3,4]. One example of such a gene that meets this definition is ZAT12, which is regulated by light, ROS, oxidative, heat, UV-B, cold and drought stress [4,44,45]. Hence, we used ZAT12, which encodes a putative zinc-finger transcription factor protein, as a suitable PCESR marker.
First, we focused on the overlap between the osmotic, salt and UV-B stress treatments. Only 209 genes are shared between the three stresses, including ZAT12 (Figure 5).
There are 56 of the 209 genes also differentially expressed after wounding of the leaves. Only five of those 56 are also regulated by genotoxic stress, while four of these are also responsive during the oxidative stress treatment. We, therefore, restrict our set of PCESR genes to these 56, as this comprises the best overlap between as many experiments as possible (Figure 5; Table 3). Interestingly, our PCESR marker ZAT12 is not contained in all of the datasets. The reasons are its rapidly changing transcript abundance between the shoot, the root and between the conditions, as well as its temporal expression fluctuations, which has led to its exclusion from the oxidative and UV-B stress dataset. We performed a similar comparison also for the osmotic, salt and UV-B stress treatments and we surprisingly found only nine systemically responsive (Figure S1). This finding also underlines that the systemic stress responses are rather specific to each of the stresses, which we have previously noted (Figure 3).
Most of the previously proposed PCESR genes responsive during the seemingly unrelated cold, drought and UV-B light (CDU) stresses are expressed only in the shoots and failed to show up in this analysis due to our stringent filtering criteria (Table 3) [4]. Nevertheless, the vast majority of these CDU responsive genes are also responsive in our systemic datasets examined in this paper and are contained in the 209 genes that overlap between UV-B light, osmotic and salt stress (Figure 5; Table S1) Consistent with the subset of PCESR genes identified previously [4], our 56 PCESR genes are enriched for genes encoding transcriptional regulators (34%; Table 3). Of the nine genes that are shared between our PCESR gene set and the one reported by Kilian et al.[4], six are transcription factors, including ZAT12. Interestingly, we found nine of our 56 PCESR genes to be target gene loci for the H3K27 trimethylation mark that coincides with active repression and silencing of the respective genes in the shoot tissue (Table 3) [46,47]. Instead, we observed a rapid activation of gene expression within a few minutes for several of the presumably silenced PCESR genes after application of the stress stimulus. The gene loci of ZAT12 and MES9 are rapidly induced in the shoot tissue, although both are also amongst those genes that are H3K27me3 decorated in the shoot. This finding suggests the involvement of rapid chromatin remodeling after the onset of the stress stimulus to mark the PCESR genes that are transcriptionally active. During the process of PCESR gene identification we found that 30 out of the 56 (54%) genes possess one or more paralogs of presumably redundant function (Table 3) [48]. In the cases of the membrane-associated transcription factors Anac036 and Anac062 [49,50] or the ribonucleases CAF1a and CAF1b [51], the paralogs of the genes are contained in our PCESR gene list. This proportionally high number of paralogous PCESR genes might be indicative of a putative backup functionality that transduces redundant information of the incoming stresses [48].

2.8. PCESR Genes Are Systemically Coordinated during Abiotic Stresses

From our observation with ZAT12, we have noted that some of the PCESR genes might not uniformly follow only one type of expression response or might even be non-responsive under certain conditions. Therefore, our PCESR genes are analyzed for their involvement in the non-systemic, type I or type II systemic gene expression responses for each of the six stresses (Table 4).
Intriguingly, the 56 PCESR genes exhibit a much more diverse response pattern than what we have previously assumed on the basis of the simple overlap of gene expression responses (Figure 5). In fact, there were only two genes that displayed a coherent response pattern: both the DA1-related gene DAR3 and the WRKY18 transcription factor exclusively respond in the non-systemic tissue, which is characteristic at least of the majority of the entire WRKY transcription factor family (Table 2). Most of our PCESR genes, however, respond in two categories, non-systemically, and in either type I or type II systemic responses, which underlines the probable importance of PCESR genes in mediating a specific stress response and to regain plant’s homeostasis. During non-systemic or type I systemic responses, the dirigent gene DIR5, which is involved modifying the cell wall, is the only gene that was differentially expressed in all of the six datasets. Interestingly, the two ribonucleases CAF1a and CAF1b follow predominantly a non-systemic response category. During osmotic stress, however, CAF1a displays a type I response, while CAF1b is type II responsive.
We recognized that the systemic response pattern is especially prominent during the related osmotic and salt stresses. Almost all of our PCESR genes (53/56; 95%) follow a systemic expression response during these two stresses. Moreover, several of the PCESR genes switched their response category between these stresses. For example, the heavy-metal-transport superfamily gene At5g52750 exhibits mainly a type II systemic response, except for the osmotic stress, where it is type I responsive. Likewise, the MATE-transporter SID1 shows a non-systemic response pattern, while its gene expression is type I responsive during the osmotic stress treatment.
Some PCESR genes are well characterized for their involvement in the stress responses in Arabidopsis; however, it has not been discovered that their expression response pattern are specifically shifted between the different stress responses: ZAT10 is also a zinc-finger transcription factor gene like ZAT12. However, the expression responses of ZAT10 are either type I systemic (oxidative stress), type II systemic (osmotic and salt stress) or non-systemic (UV-B light and wounding stress). Likewise, the heavy-metal-transport superfamily gene At5g52750, ERD9, methyl-esterase MES9 or a member of the GNAT-family At2g32030 exhibit a distinct and specific expression pattern in all three response categories and in a stress-dependent manner. Hence, the majority of PCESR genes are likely to respond to various environmental conditions, but with diverse expression trajectories that are stress specific.

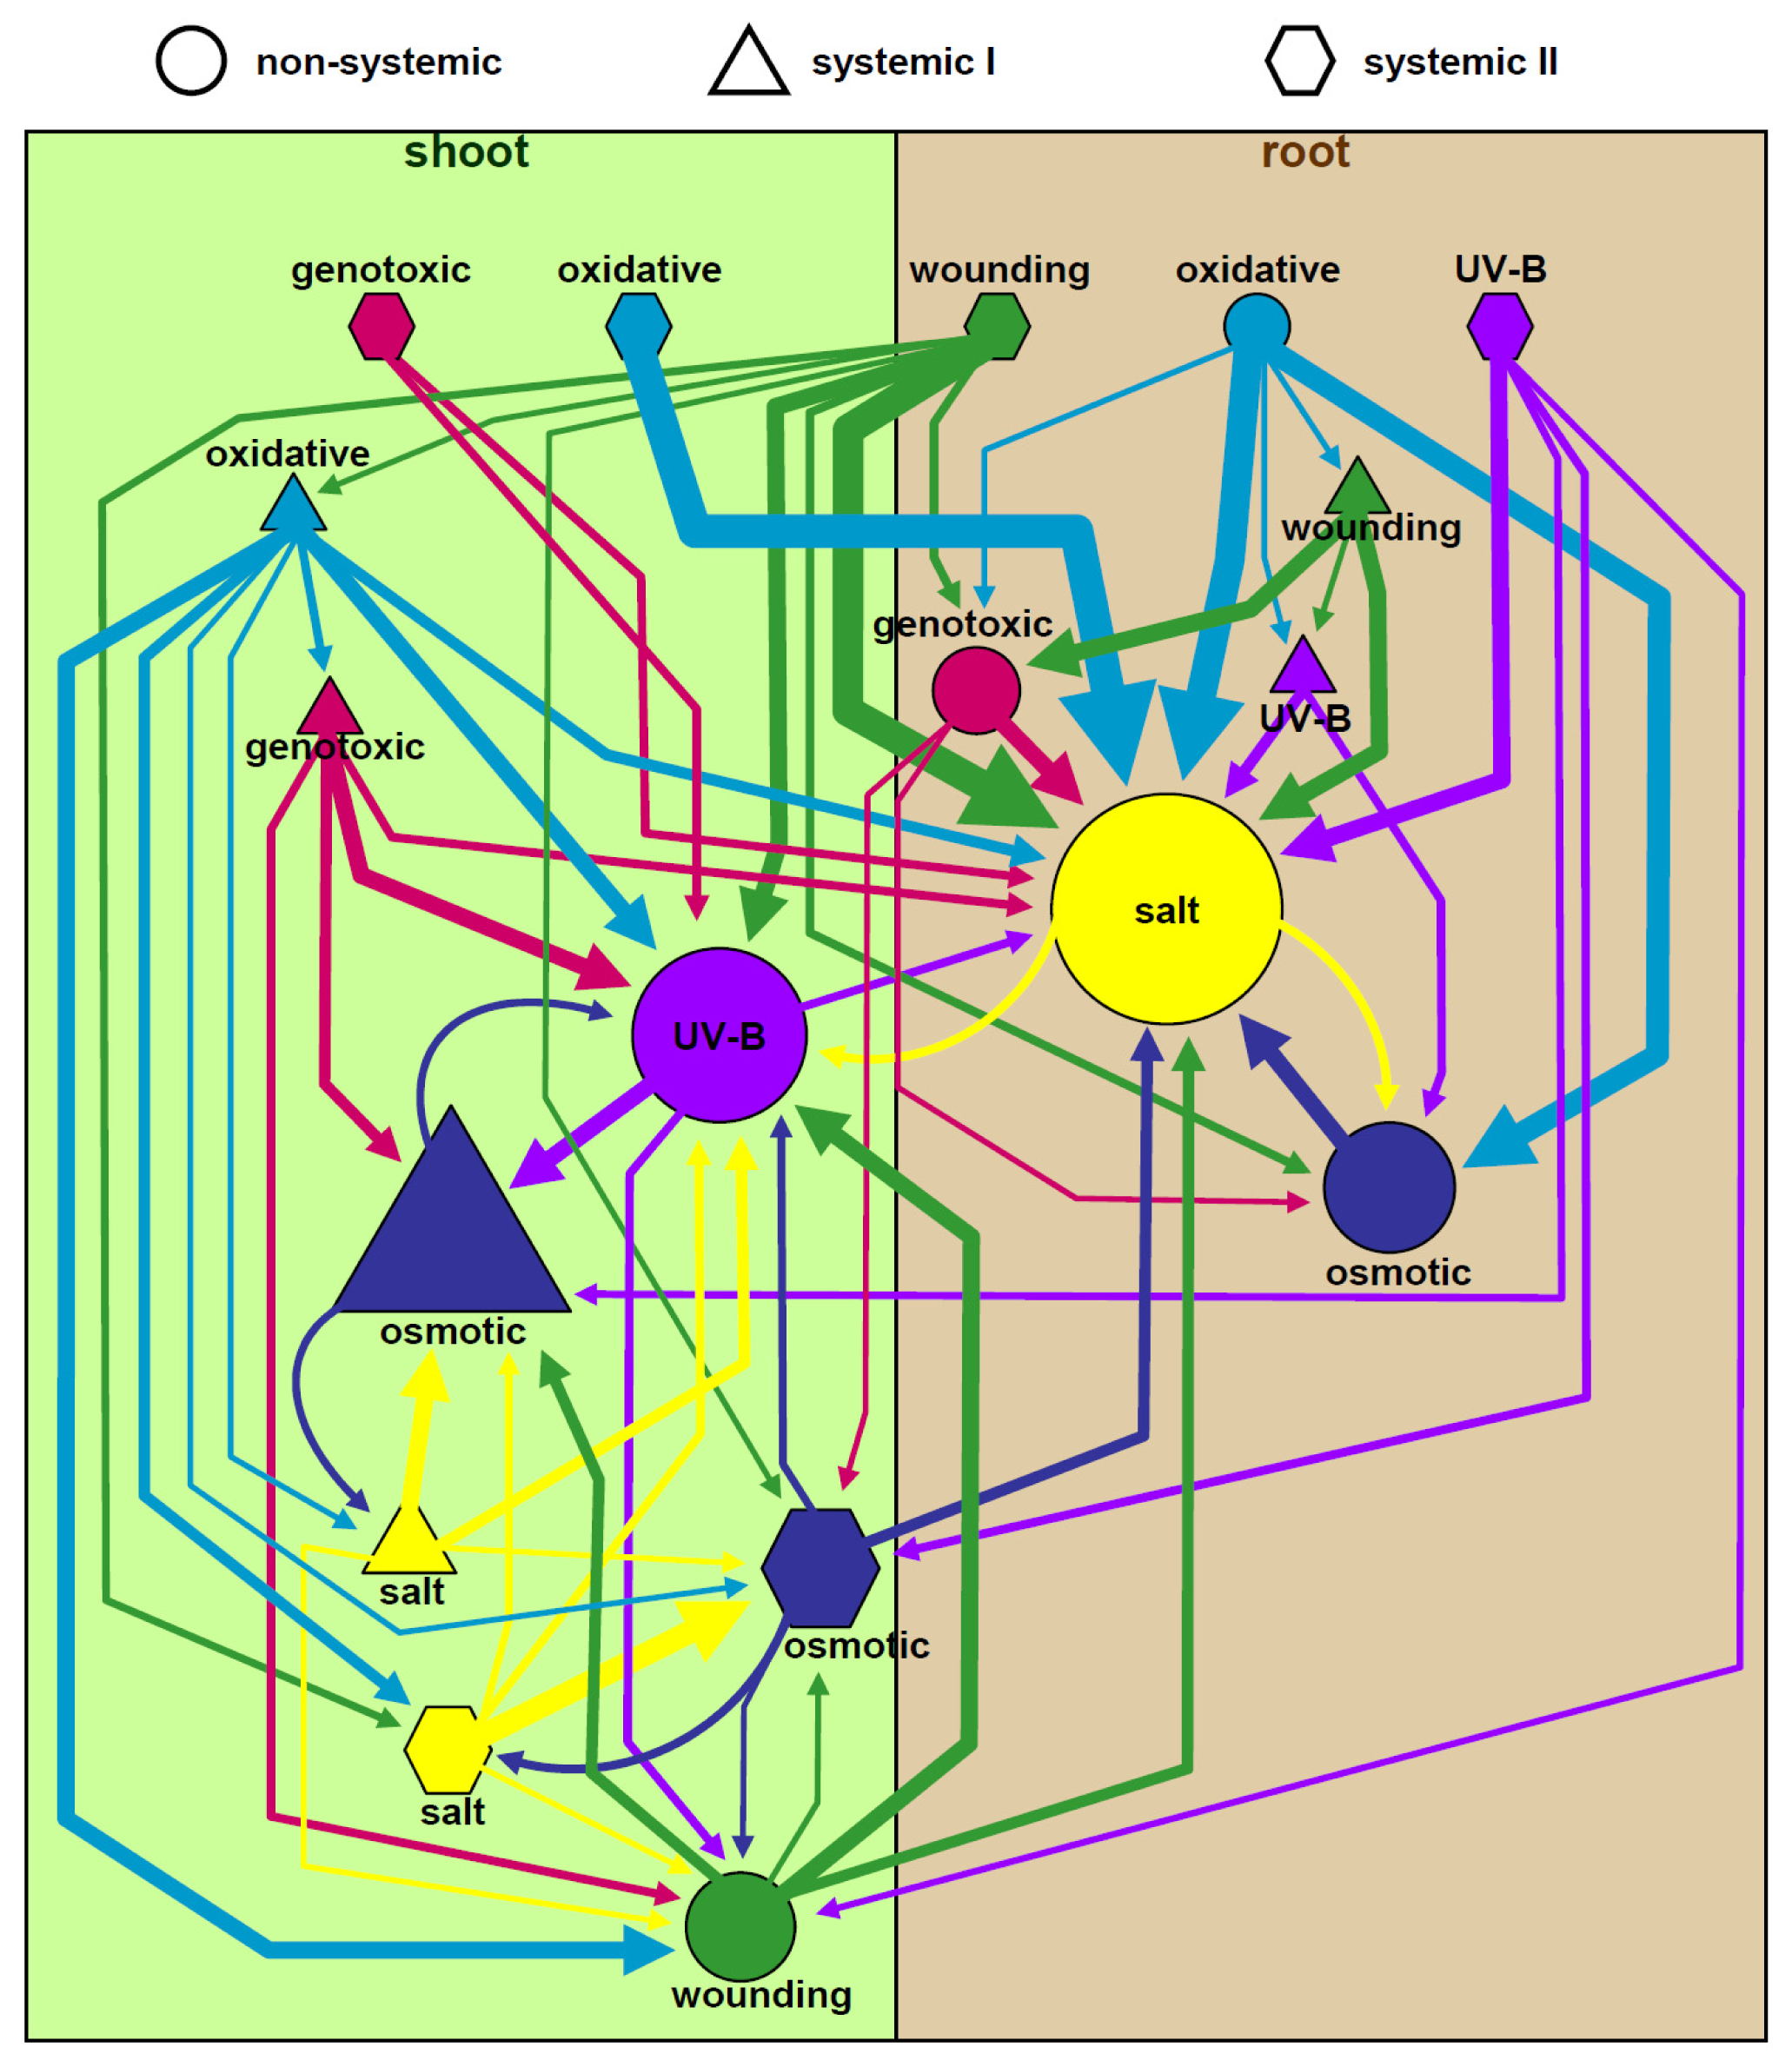
2.9. Stress-Induced Systemic Signaling Uses Multiple Pathways

We have shown that each of the abiotic stresses did not specifically invoke only a discrete set of genes, but also many genes that are responding specifically to the different stress conditions. We have focused on the analysis of the six abiotic stresses that can be mined for a non-systemic and systemic response pattern. Indeed, most of the genes that respond to the six systemic stresses are also regulated during cold, heat and drought, which were applied to the whole plant and which affected both tissue types (Figure 5). To illustrate that there is considerable overlap of differentially expressed genes between the stresses, we chose to display the three response types for the salt stress response.
The majority of non-systemic as well as type I and type II systemic response genes of the one stress stimulus is also differentially expressed in response to other stresses. Furthermore, systemic responsiveness of a given gene to a certain stress condition did not imply a general role as a systemic response gene (Figure 5), which we have already shown for the PCESR genes. Instead, the diverse expression signatures suggest an important, underlying role in homeostatic balance and, thus, an activation by local or systemic signals as needed.

3. Discussion

Our detailed analysis of the AtGenExpress abiotic stress data set allowed us to identify genes, which are either non-systemic or of two different types of systemic responses (type I, type II). This provokes the idea of the existence of specific, yet unknown, systemic signaling mechanisms, which must rapidly integrate the stress perception for stress-specific signaling from the treated to the non-treated organ. Based on what is currently known in the literature, the systemic signals could be ssRNA, siRNA, peptides, proteins, JA or electrical signals. The earliest time point in the AtGenExpress dataset is 15 min, which is sufficient time for such a systemic signal to move. Electrical signals take seconds to minutes to be propagated [25]. JA signal transmission (not necessarily JA itself) has been shown to occur within minutes [5254]. The difficulty in defining stress-specific transcriptional changes is likely due to components that overlap with other stress. For example, mechanical wounding is characterized by the physical rupture of tissues, which affects both ionic fluxes (presumably similar to salt stress) and cellular osmotic potential (osmotic stress treatments). This is in agreement with the observation that wounding elicits responses that overlap with those of biotic and abiotic stresses [55]. Likewise, UV-B treatments activate many genes that are not just specific to UV radiation treatments, but instead had been attributed to pathogen response [5658], further supporting a connection between abiotic stresses and pathogen defense. The transcriptional wounding response has been shown to overlap with that of JA [15,16,38], which is in turn required for the plant defense against pathogen and herbivore attack [52].
We also observed that genes could be activated either directly or systemically depending on the type of stress, which generates an alarm signal to coordinate responses throughout the entire organism. This has already been proposed in earlier experiments that investigated the systemic activation of transcription by wounding [59], pathogen attack, or the systemic detection of electrical signals [60]. In these publications, it is suggested that an alarm state was raised first followed by the treatment-specific response. Comparable to the systemic leaf-to-leaf signaling described in these publications, in our analysis the establishment of an alarm state is also sent from shoot-to-root or root-to-shoot.
A major outcome of our work is that type II systemic responses appear to be more stress specific than non-systemic or type I systemic responses. This finding might be indicative of the fact that the type II responsive genes have an important function in specifying the stress response, downstream of a mobile systemic signal. In contrast, non-systemic or type I systemic responses displayed considerable overlap also between seemingly unrelated types of stresses or between different stress categories. In fact, Chen et al.[33] showed that it was difficult to identify transcriptional responses that could easily be attributed to an individual stress. Similarly, also the intercomparable AtGenExpress abiotic stress experiment suggests the involvement of different molecular pathways that contain the Plant Core Environmental Stress Response (PCESR) genes [4].
The PCESR genes identified in this work are by no means exhaustive, and as we have shown, many PCESR genes will probably be identified from different stress treatments. It is important to note that it is unclear how interlaced the effects on transcription are during different stresses [39]. Nevertheless, the PCESR genes identified in this study have several properties that are consistent with a fundamental role in mediating an alarm response. First, they are enriched in transcriptional regulators that are needed for transcriptional re-programming. Second, most of them systemically coordinated and expressed in both the shoot and root. Third, some of the PCESR genes are functionally conserved throughout plant evolution, which is a requirement for an effective definition of a plant core environmental stress response, as was proposed for yeast [32,33].
Support that our 56 PCESR genes are indeed part of a common alarm system in plants can be taken from the high number of already known genes that have an assigned function in environmental stress responses: ZAT10 has already been shown to respond to multiple stresses [61,62] and its gene product is known to be involved in diverse developmental pathways. More convincing is the identification of AtCOR413-TM1 and AtCOR413-PM1 amongst the PCESR genes. AtCOR413-TM1 and -PM1 genes are activated by water stress, ABA, light, freezing tolerance and these responses are conserved between wheat and Arabidopsis[36]. An evolutionary conserved function is one of the major arguments that core environmental stress responses exist. AtCOR413-TM1/PM1 are proposed to play a pivotal role in environmental stress signaling and a structural role by stabilizing the plasma membrane lipid bilayer [36]. It is tempting to speculate that gene families evolved and gene duplication occurred to compose a robust system of stress responses. Temperature and UV-B stress have been shown to affect genome stability epigenetically, indicating that abiotic stresses can have heritable effects at least for a few generations [63]. The recent findings that PCESR gene expression is increased in Polycomb mutants hints to active repression of some of these genes by H3K27me3 in the non-stressed (shoot) tissue [64]. These findings are supported from a previous publication that describes the dynamic removal of H3K27me3 marks at the PCESR gene locus of COR15A during cold stress treatment [65]. Similarly, pathogen attack has been shown to cause an increase in the frequency of somatic DNA recombination [66]. It is, therefore, apparent that responses to stress have short and long-term consequences influencing plant evolution. Not all of our 56 PCESR genes responded under all stress stimuli. Especially genotoxic and oxidative stresses revealed little overlap between otherwise commonly involved PCESR genes. One explanation is that most of the PCESR genes are downstream from a highly specific and well-defined ROS signal [18]. Consistently, the genotoxic and oxidative stresses are presumably affected in ROS production and signaling more generally. A concerted activation of PCESR genes under these circumstances might, thus, be impaired.

4. Experimental Section

4.1. Microarray Data Processing

We used our publicly available AtGenExpress microarray experiment [4], which consists of control arrays (included individually within every stress set at TAIR; 9 time points, 36 chips), cold stress (ME00325, 6 time points; 24 chips), drought stress (ME00338; 7 time points; 28 chips), UV-B light stress, (ME00329; 7 time points; 28 chips), salt stress (ME00328; 6 time points; 24 chips), osmotic stress (ME00327; 6 time points; 24 chips), wounding (ME00330; 7 time points; 28 chips), heat stress (ME00339; without the cell culture data, 8 time points, 32 chips), genotoxic stress (ME00326; 6 time points; 24 chips) and oxidative stress (ME00340; 6 time points; 24 chips).
The arrays were adjusted for the background of optical noise with the GC-RMA package in the R statistical environment of bioconductor [67] and normalized using quantile normalization [4,35,41,68]. Gene expression was normalized to the controls (36 chips) and the 118 conditions (236 chips) present in the entire dataset to identify regulated genes as in Kilian et al.[4]. Genes were considered differentially expressed, if they were regulated at least at two consecutive time points (each stress time point was compared to the respective control). Very noisy genes contaminating type II and non-systemic gene sets were removed by hand. The primary normalization was used to generate the principal component analysis. The secondary normalization was used to identify up- or downregulated genes. Centroids were formed for each classification (non-systemic, type I and type II) with k-means set to 2 clusters on the respective tissue. The PCA, regulated genes, and centroids were calculated using GeneSpring GX v7.3.1 (Agilent Technology, Böblingen, German).

4.2. Gene List Analysis

A functional categorization using GO-terms was performed with the TAIR web-interface [69]. Significant over- or under-representation (p ≤ 0.01) of a particular GO category was assessed by applying a hypergeometric distribution calculation restricted to the universe of all 22,747 genes on the ATH1 array. Calculations were performed in Excel; Results were plotted with plot 0.997 [70]. Cis-regulatory element analysis was performed with Athena [71]. Updated using Toronto “_at to AGI converter” 2009-7-29 release [72]. Transcription Factors were found using The Plant Transcription Factor Database (PlnTFDB) [73]. Genes that were hormone responsive were taken from literature [74]. Gene loci that are targeted by histone methylation were derived from publications [46,47].

4.3. Network Graph Analysis

The arrays were adjusted for the background of optical noise with the GC-RMA package in the R statistical environment [67,68] and normalized using quantile normalization. Gene expression was normalized to the controls (36 chips) and the 118 conditions (236 Gene lists were compared using the List Distance function from Motif Mapper v5.2.4.01 [75,76]. The values for direct overlap were used as input for Cytoscape v.2.6 [77] and arranged using the yFiles hierarchal clustering algorithm (Table S4). Node size was continually scaled to list size; edge thicknesses were continually scaled to overlap-percentage.

5. Conclusions

To conclude, the different stress treatments share an initial alarm state even before the plant can determine exactly what type of stress is actually there. We propose that unknown systemic signaling modules must be responsible for this coordination. However, our categorization of the gene expression responses into the different non-systemic type I and type II systemic stress responses allowed for the first time the in-depth analysis and characterization of six abiotic stresses. Moreover, PCESR genes have been identified and have been shown to display a highly stress-specific response pattern. Some of the PCESR genes switch between non-systemic, type I and type II systemic responses in a stress-specific manner. In addition, the type II stress responsive genes were found to be more stress specific than the non-systemic or the type I systemic responsive genes. The identification of the mobile signals and the analysis of how a specific response type is enforced at distinct gene loci will be a challenging task for future research.

Acknowledgments

We would like to thank the research group of Andeas Zell, ZBIT University of Tübingen, for support on bioinformatics; especially Jochen Supper and Carsten Henneges for valuable input and discussions on microarray analyses. We acknowledge Luise Brand and Andreas Hecker for critical remarks on the manuscript. This research was financially supported by the DFG (HA 2146/11-1), the Landesgraduiertenförderung des Landes Baden-Würtemberg and the Reinhold-und-Maria-Teufel-Stiftung.

Conflict of Interest

The authors declare no conflict of interest.

References

  1. De Wit, P.J. How plants recognize pathogens and defend themselves. Cell. Mol. Life Sci. CMLS 2007, 64, 2726–2732. [Google Scholar]
  2. Guimil, S.; Chang, H.S.; Zhu, T.; Sesma, A.; Osbourn, A.; Roux, C.; Ioannidis, V.; Oakeley, E.J.; Docquier, M.; Descombes, P.; et al. Comparative transcriptomics of rice reveals an ancient pattern of response to microbial colonization. Proc. Natl. Acad. Sci. USA 2005, 102, 8066–8070. [Google Scholar]
  3. Kilian, J.; Peschke, F.; Berendzen, K.W.; Harter, K.; Wanke, D. Prerequisites, performance and profits of transcriptional profiling the abiotic stress response. Biochim. Biophys. Acta 2012, 1819, 166–175. [Google Scholar]
  4. Kilian, J.; Whitehead, D.; Horak, J.; Wanke, D.; Weinl, S.; Batistic, O.; D’Angelo, C.; Bornberg-Bauer, E.; Kudla, J.; Harter, K. The AtGenExpress global stress expression data set: Protocols, evaluation and model data analysis of UV-B light, drought and cold stress responses. Plant J. Cell Mol. Biol 2007, 50, 347–363. [Google Scholar]
  5. Marshall, A.; Aalen, R.B.; Audenaert, D.; Beeckman, T.; Broadley, M.R.; Butenko, M.A.; Cano-Delgado, A.I.; de Vries, S.; Dresselhaus, T.; Felix, G.; et al. Tackling drought stress: Receptor-Like kinases present new approaches. Plant Cell 2012, 24, 2262–2278. [Google Scholar]
  6. Puig, J.; Pauluzzi, G.; Guiderdoni, E.; Gantet, P. Regulation of shoot and root development through mutual signaling. Mol. Plant 2012, 5, 974–983. [Google Scholar]
  7. Buhtz, A.; Pieritz, J.; Springer, F.; Kehr, J. Phloem small RNAs, nutrient stress responses, and systemic mobility. BMC Plant Biol 2010, 10, 64. [Google Scholar]
  8. Pant, B.D.; Buhtz, A.; Kehr, J.; Scheible, W.R. MicroRNA399 is a long-distance signal for the regulation of plant phosphate homeostasis. Plant J. Cell Mol. Biol 2008, 53, 731–738. [Google Scholar]
  9. Huang, N.C.; Yu, T.S. The sequences of Arabidopsis GA-INSENSITIVE RNA constitute the motifs that are necessary and sufficient for RNA long-distance trafficking. Plant J. Cell Mol. Biol 2009, 59, 921–929. [Google Scholar]
  10. Corbesier, L.; Vincent, C.; Jang, S.; Fornara, F.; Fan, Q.; Searle, I.; Giakountis, A.; Farrona, S.; Gissot, L.; Turnbull, C.; et al. FT protein movement contributes to long-distance signaling in floral induction of Arabidopsis. Science 2007, 316, 1030–1033. [Google Scholar]
  11. Schlereth, A.; Moller, B.; Liu, W.; Kientz, M.; Flipse, J.; Rademacher, E.H.; Schmid, M.; Jurgens, G.; Weijers, D. MONOPTEROS controls embryonic root initiation by regulating a mobile transcription factor. Nature 2010, 464, 913–916. [Google Scholar]
  12. Bahyrycz, A.; Konopinska, D. Plant signalling peptides: Some recent developments. J. Peptide Sci. Off. Publ. Eur. Peptide Soc 2007, 13, 787–797. [Google Scholar]
  13. Vlot, A.C.; Klessig, D.F.; Park, S.W. Systemic acquired resistance: The elusive signal(s). Curr. Opin. Plant Biol 2008, 11, 436–442. [Google Scholar]
  14. Beckers, G.J.; Spoel, S.H. Fine-Tuning plant defence signalling: Salicylate versus Jasmonate. Plant Biol 2006, 8, 1–10. [Google Scholar]
  15. Gfeller, A.; Baerenfaller, K.; Loscos, J.; Chetelat, A.; Baginsky, S.; Farmer, E.E. Jasmonate controls polypeptide patterning in undamaged tissue in wounded Arabidopsis leaves. Plant Physiol 2011, 156, 1797–1807. [Google Scholar]
  16. Acosta, I.F.; Farmer, E.E. Jasmonates. In The Arabidopsis book 8; American Society of Plant Biologists, American Society of Plant Biologists: Rockville, MD, USA, 2010; Volume 8, p. e0129. [Google Scholar]
  17. Jung, H.W.; Tschaplinski, T.J.; Wang, L.; Glazebrook, J.; Greenberg, J.T. Priming in systemic plant immunity. Science 2009, 324, 89–91. [Google Scholar]
  18. Mehterov, N.; Balazadeh, S.; Hille, J.; Toneva, V.; Mueller-Roeber, B.; Gechev, T. Oxidative stress provokes distinct transcriptional responses in the stress-tolerant atr7 and stress-sensitive loh2 Arabidopsis thaliana mutants as revealed by multi-parallel quantitative real-time PCR analysis of ROS marker and antioxidant genes. Plant Physiol. Biochem. PPB Soc. Fr. Physiol. Veg 2012, 59, 20–29. [Google Scholar]
  19. Miller, G.; Schlauch, K.; Tam, R.; Cortes, D.; Torres, M.A.; Shulaev, V.; Dangl, J.L.; Mittler, R. The plant NADPH oxidase RBOHD mediates rapid systemic signaling in response to diverse stimuli. Sci. Signal. 2009, 2, ra45. [Google Scholar]
  20. Kimura, S.; Kawarazaki, T.; Nibori, H.; Michikawa, M.; Imai, A.; Kaya, H.; Kuchitsu, K. The CBL-interacting protein kinase CIPK26 is a novel interactor of Arabidopsis NADPH oxidase AtRbohF that negatively modulates its ROS-producing activity in a heterologous expression system. J. Biochem 2013, 153, 191–195. [Google Scholar]
  21. Pitzschke, A.; Hirt, H. Mitogen-Activated protein kinases and reactive oxygen species signaling in plants. Plant Physiol 2006, 141, 351–356. [Google Scholar]
  22. Apel, K.; Hirt, H. Reactive oxygen species: Metabolism, oxidative stress, and signal transduction. Ann. Rev. Plant Biol 2004, 55, 373–399. [Google Scholar]
  23. Alvarez, M.E.; Pennell, R.I.; Meijer, P.J.; Ishikawa, A.; Dixon, R.A.; Lamb, C. Reactive oxygen intermediates mediate a systemic signal network in the establishment of plant immunity. Cell 1998, 92, 773–784. [Google Scholar]
  24. Davies, E. New functions for electrical signals in plants. New Phytol 2004, 161, 607–610. [Google Scholar]
  25. Zimmermann, M.R.; Maischak, H.; Mithofer, A.; Boland, W.; Felle, H.H. System potentials, a novel electrical long-distance apoplastic signal in plants, induced by wounding. Plant Physiol 2009, 149, 1593–1600. [Google Scholar]
  26. Felle, H.H.; Zimmermann, M.R. Systemic signalling in barley through action potentials. Planta 2007, 226, 203–214. [Google Scholar]
  27. Raghavendra, A.S.; Gonugunta, V.K.; Christmann, A.; Grill, E. ABA perception and signalling. Trends Plant Sci 2010, 15, 395–401. [Google Scholar]
  28. Christmann, A.; Weiler, E.W.; Steudle, E.; Grill, E. A hydraulic signal in root-to-shoot signalling of water shortage. Plant J. Cell Mol. Biol 2007, 52, 167–174. [Google Scholar]
  29. Kim, D.; Kim, M.S.; Cho, K.H. The core regulation module of stress-responsive regulatory networks in yeast. Nucleic Acids Res 2012, 40, 8793–8802. [Google Scholar]
  30. Gasch, A.P. Comparative genomics of the environmental stress response in ascomycete fungi. Yeast 2007, 24, 961–976. [Google Scholar]
  31. Lai, L.C.; Kissinger, M.T.; Burke, P.V.; Kwast, K.E. Comparison of the transcriptomic “stress response” evoked by antimycin A and oxygen deprivation in Saccharomyces cerevisiae. BMC Genomics 2008, 9, 627. [Google Scholar]
  32. Causton, H.C.; Ren, B.; Koh, S.S.; Harbison, C.T.; Kanin, E.; Jennings, E.G.; Lee, T.I.; True, H.L.; Lander, E.S.; Young, R.A. Remodeling of yeast genome expression in response to environmental changes. Mol. Biol. Cell 2001, 12, 323–337. [Google Scholar]
  33. Chen, D.; Toone, W.M.; Mata, J.; Lyne, R.; Burns, G.; Kivinen, K.; Brazma, A.; Jones, N.; Bahler, J. Global transcriptional responses of fission yeast to environmental stress. Mol. Biol. Cell 2003, 14, 214–229. [Google Scholar]
  34. Wanke, D.; Berendzen, K.W.; Kilian, J.; Harter, K. Insights into the Arabidopsis Abiotic Stress Response from the AtGenExpress Expression Profile Dataset. In Plant Stress Biology; Hirt, H., Ed.; WILEY-VCH Verlag: Weinheim, Germany, 2009; pp. 199–225. [Google Scholar]
  35. Mangelsen, E.; Kilian, J.; Harter, K.; Jansson, C.; Wanke, D.; Sundberg, E. Transcriptome analysis of high-temperature stress in developing barley caryopses: Early stress responses and effects on storage compound biosynthesis. Mol. Plant 2011, 4, 97–115. [Google Scholar]
  36. Breton, G.; Danyluk, J.; Charron, J.B.; Sarhan, F. Expression profiling and bioinformatic analyses of a novel stress-regulated multispanning transmembrane protein family from cereals and Arabidopsis. Plant Physiol 2003, 132, 64–74. [Google Scholar]
  37. Le, D.T.; Nishiyama, R.; Watanabe, Y.; Tanaka, M.; Seki, M.; Ham le, H.; Yamaguchi-Shinozaki, K.; Shinozaki, K.; Tran, L.S. Differential gene expression in soybean leaf tissues at late developmental stages under drought stress revealed by genome-wide transcriptome analysis. PLoS One 2012, 7, e49522. [Google Scholar]
  38. Andi, S.; Taguchi, F.; Toyoda, K.; Shiraishi, T.; Ichinose, Y. Effect of methyl jasmonate on harpin-induced hypersensitive cell death, generation of hydrogen peroxide and expression of PAL mRNA in tobacco suspension cultured BY-2 cells. Plant Cell Physiol 2001, 42, 446–449. [Google Scholar]
  39. Mittler, R. Abiotic stress, the field environment and stress combination. Trends Plant Sci 2006, 11, 15–19. [Google Scholar]
  40. Rushton, D.L.; Tripathi, P.; Rabara, R.C.; Lin, J.; Ringler, P.; Boken, A.K.; Langum, T.J.; Smidt, L.; Boomsma, D.D.; Emme, N.J.; et al. WRKY transcription factors: Key components in abscisic acid signalling. Plant Biotechnol. J 2012, 10, 2–11. [Google Scholar]
  41. Wenke, K.; Wanke, D.; Kilian, J.; Berendzen, K.; Harter, K.; Piechulla, B. Volatiles of two growth-inhibiting rhizobacteria commonly engage AtWRKY18 function. Plant J. Cell Mol. Biol 2012, 70, 445–459. [Google Scholar]
  42. Babitha, K.C.; Ramu, S.V.; Pruthvi, V.; Mahesh, P.; Nataraja, K.N.; Udayakumar, M. Co-Expression of AtbHLH17 and AtWRKY28 confers resistance to abiotic stress in Arabidopsis. Transgenic Res 2012, 22, 327–341. [Google Scholar]
  43. Ren, X.; Chen, Z.; Liu, Y.; Zhang, H.; Zhang, M.; Liu, Q.; Hong, X.; Zhu, J.K.; Gong, Z. ABO3, a WRKY transcription factor, mediates plant responses to abscisic acid and drought tolerance in Arabidopsis. Plant J. Cell Mol. Biol 2010, 63, 417–429. [Google Scholar]
  44. Davletova, S.; Schlauch, K.; Coutu, J.; Mittler, R. The zinc-finger protein Zat12 plays a central role in reactive oxygen and abiotic stress signaling in Arabidopsis. Plant Physiol 2005, 139, 847–856. [Google Scholar]
  45. Sakamoto, H.; Maruyama, K.; Sakuma, Y.; Meshi, T.; Iwabuchi, M.; Shinozaki, K.; Yamaguchi-Shinozaki, K. Arabidopsis Cys2/His2-type zinc-finger proteins function as transcription repressors under drought, cold, and high-salinity stress conditions. Plant Physiol 2004, 136, 2734–2746. [Google Scholar]
  46. Zhang, X.; Clarenz, O.; Cokus, S.; Bernatavichute, Y.V.; Pellegrini, M.; Goodrich, J.; Jacobsen, S.E. Whole-Genome analysis of histone H3 lysine 27 trimethylation in Arabidopsis. PLoS Biol 2007, 5, e129. [Google Scholar]
  47. Zhang, X.; Yazaki, J.; Sundaresan, A.; Cokus, S.; Chan, S.W.; Chen, H.; Henderson, I.R.; Shinn, P.; Pellegrini, M.; Jacobsen, S.E.; et al. Genome-Wide high-resolution mapping and functional analysis of DNA methylation in arabidopsis. Cell 2006, 126, 1189–1201. [Google Scholar]
  48. Haberer, G.; Mader, M.T.; Kosarev, P.; Spannagl, M.; Yang, L.; Mayer, K.F. Large-Scale cis-element detection by analysis of correlated expression and sequence conservation between Arabidopsis and Brassica oleracea. Plant Physiol 2006, 142, 1589–1602. [Google Scholar]
  49. Kato, H.; Motomura, T.; Komeda, Y.; Saito, T.; Kato, A. Overexpression of the NAC transcription factor family gene ANAC036 results in a dwarf phenotype in Arabidopsis thaliana. J. Plant Physiol 2010, 167, 571–577. [Google Scholar]
  50. Seo, P.J.; Park, C.M. A membrane-bound NAC transcription factor as an integrator of biotic and abiotic stress signals. Plant Signal. Behav 2010, 5, 481–483. [Google Scholar]
  51. Walley, J.W.; Kelley, D.R.; Nestorova, G.; Hirschberg, D.L.; Dehesh, K. Arabidopsis deadenylases AtCAF1a and AtCAF1b play overlapping and distinct roles in mediating environmental stress responses. Plant Physiol 2010, 152, 866–875. [Google Scholar]
  52. Wasternack, C. Jasmonates: An update on biosynthesis, signal transduction and action in plant stress response, growth and development. Ann. Bot 2007, 100, 681–697. [Google Scholar]
  53. Glauser, G.; Dubugnon, L.; Mousavi, S.A.; Rudaz, S.; Wolfender, J.L.; Farmer, E.E. Velocity estimates for signal propagation leading to systemic jasmonic acid accumulation in wounded Arabidopsis. J. Biol. Chem 2009, 284, 34506–34513. [Google Scholar]
  54. Koo, A.J.; Gao, X.; Jones, A.D.; Howe, G.A. A rapid wound signal activates the systemic synthesis of bioactive jasmonates in Arabidopsis. Plant J. Cell Mol. Biol 2009, 59, 974–986. [Google Scholar]
  55. Mithofer, A.; Wanner, G.; Boland, W. Effects of feeding Spodoptera littoralis on lima bean leaves. II. Continuous mechanical wounding resembling insect feeding is sufficient to elicit herbivory-related volatile emission. Plant Physiol 2005, 137, 1160–1168. [Google Scholar]
  56. Walter, M.H.; Grima-Pettenati, J.; Grand, C.; Boudet, A.M.; Lamb, C.J. Cinnamyl-Alcohol dehydrogenase, a molecular marker specific for lignin synthesis: cDNA cloning and mRNA induction by fungal elicitor. Proc. Natl. Acad. Sci. USA 1988, 85, 5546–5550. [Google Scholar]
  57. Lois, R.; Dietrich, A.; Hahlbrock, K.; Schulz, W. A phenylalanine ammonia-lyase gene from parsley: Structure, regulation and identification of elicitor and light responsive cis-acting elements. EMBO J 1989, 8, 1641–1648. [Google Scholar]
  58. Douglas, C.J.; Hauffe, K.D.; Ites-Morales, M.E.; Ellard, M.; Paszkowski, U.; Hahlbrock, K.; Dangl, J.L. Exonic sequences are required for elicitor and light activation of a plant defense gene, but promoter sequences are sufficient for tissue specific expression. EMBO J 1991, 10, 1767–1775. [Google Scholar]
  59. Delessert, C.; Wilson, I.W.; van Der Straeten, D.; Dennis, E.S.; Dolferus, R. Spatial and temporal analysis of the local response to wounding in Arabidopsis leaves. Plant Mol. Biol 2004, 55, 165–181. [Google Scholar]
  60. Shimmen, T. Electrical perception of “death message” in Chara: Involvement of turgor pressure. Plant Cell Physiol 2001, 42, 366–373. [Google Scholar]
  61. Mittler, R.; Kim, Y.; Song, L.; Coutu, J.; Coutu, A.; Ciftci-Yilmaz, S.; Lee, H.; Stevenson, B.; Zhu, J.K. Gain- and loss-of-function mutations in Zat10 enhance the tolerance of plants to abiotic stress. FEBS Lett 2006, 580, 6537–6542. [Google Scholar]
  62. Rossel, J.B.; Wilson, P.B.; Hussain, D.; Woo, N.S.; Gordon, M.J.; Mewett, O.P.; Howell, K.A.; Whelan, J.; Kazan, K.; Pogson, B.J. Systemic and intracellular responses to photooxidative stress in Arabidopsis. Plant Cell 2007, 19, 4091–4110. [Google Scholar]
  63. Lang-Mladek, C.; Popova, O.; Kiok, K.; Berlinger, M.; Rakic, B.; Aufsatz, W.; Jonak, C.; Hauser, M.T.; Luschnig, C. Transgenerational inheritance and resetting of stress-induced loss of epigenetic gene silencing in Arabidopsis. Mol. Plant 2010, 3, 594–602. [Google Scholar]
  64. Latrasse, D.; Germann, S.; Houba-Herin, N.; Dubois, E.; Bui-Prodhomme, D.; Hourcade, D.; Juul-Jensen, T.; Le Roux, C.; Majira, A.; Simoncello, N.; et al. Control of flowering and cell fate by LIF2, an RNA binding partner of the polycomb complex component LHP1. PLoS One 2011, 6, e16592. [Google Scholar]
  65. Kwon, C.S.; Lee, D.; Choi, G.; Chung, W.I. Histone occupancy-dependent and -independent removal of H3K27 trimethylation at cold-responsive genes in Arabidopsis. Plant J. Cell Mol. Biol 2009, 60, 112–121. [Google Scholar]
  66. Kovalchuk, I.; Kovalchuk, O.; Kalck, V.; Boyko, V.; Filkowski, J.; Heinlein, M.; Hohn, B. Pathogen-Induced systemic plant signal triggers DNA rearrangements. Nature 2003, 423, 760–762. [Google Scholar]
  67. Gentleman, R.C.; Carey, V.J.; Bates, D.M.; Bolstad, B.; Dettling, M.; Dudoit, S.; Ellis, B.; Gautier, L.; Ge, Y.; Gentry, J.; et al. Bioconductor: Open software development for computational biology and bioinformatics. Genome Biol. 2004, 5, R80. [Google Scholar]
  68. The R Project for Statistical Computing. Available online: http://www.r-project.org (accessed on 1 April 2012).
  69. GO term enrichment at The Arabidopsis Information Resource’s Gene Ontology (GO) annotation search page. Available online: http://www.arabidopsis.org/tools/bulk/go/index.jsp (accessed on 10 May 2011).
  70. Plot 0.997. Available online: http://plot.micw.eu/ (accessed on 1 April 2012).
  71. O’Connor, T.R.; Dyreson, C.; Wyrick, J.J. Athena: A resource for rapid visualization and systematic analysis of Arabidopsis promoter sequences. Bioinformatics 2005, 21, 4411–4413. [Google Scholar]
  72. AGI Conversion Tool. Availble online: http://bar.utoronto.ca/ntools/cgi-bin/ntools_agi_converter.cgi (accessed on 11 May 2012).
  73. Perez-Rodriguez, P.; Riano-Pachon, D.M.; Correa, L.G.; Rensing, S.A.; Kersten, B.; Mueller-Roeber, B. PlnTFDB: Updated content and new features of the plant transcription factor database. Nucleic Acids Res 2010, 38, D822–D827. [Google Scholar]
  74. Goda, H.; Sasaki, E.; Akiyama, K.; Maruyama-Nakashita, A.; Nakabayashi, K.; Li, W.; Ogawa, M.; Yamauchi, Y.; Preston, J.; Aoki, K.; et al. The AtGenExpress hormone and chemical treatment data set: Experimental design, data evaluation, model data analysis and data access. Plant J. Cell Mol. Biol 2008, 55, 526–542. [Google Scholar]
  75. Motif Mapper script collection. Available online: http://www.zmbp.uni-tuebingen.de/plant-physiology/research-groups/harter/berendzen/programs.html (accessed on 10 May 2011).
  76. Berendzen, K.W.; Stuber, K.; Harter, K.; Wanke, D. Cis-Motifs upstream of the transcription and translation initiation sites are effectively revealed by their positional disequilibrium in eukaryote genomes using frequency distribution curves. BMC Bioinformatics 2006, 7, 522. [Google Scholar]
  77. Cline, M.S.; Smoot, M.; Cerami, E.; Kuchinsky, A.; Landys, N.; Workman, C.; Christmas, R.; Avila-Campilo, I.; Creech, M.; Gross, B.; et al. Integration of biological networks and gene expression data using Cytoscape. Nat. Protoc 2007, 2, 2366–2382. [Google Scholar]
Figure 1. (A) Model of the three different gene expression response types in the shoot and root after a stress stimulus; (B) Example of non-systemic gene expression trajectories after UV-B irradiation of the shoot, the type I systemic response in the root or the type II systemic response in both tissues. Gene expression changes represent signal intensities normalized to the median and the control experiments.
Ijms 14 07617f1
Figure 2. Functional categorization according to the gene ontology (GO) terms. Genes involved in non-systemic, type I systemic or type II systemic responses during the six systemic abiotic stress treatments are categorized for significant over (●)- or under (○)-representation (p ≤ 0.01). Percentages of genes categorized into the seven well-annotated GO terms “developmental processes”, “protein metabolism”, “responses to stress”, “transcription”, “transport”, “chloroplast”, or “mitochondria” are given for each of the six stress responses. Number of genes, observed GO counts and p-values can be found in Table S2.
Ijms 14 07617f2
Figure 3. Pair-wise network of gene overlap between the six stresses. Reciprocal comparison of a non-systemic (circle), type I systemic (triangles) or type II systemic (hexagons) responses. The size of each dataset (node) and connecting arrows (edges) represent the overlap of genes shared between two datasets. The sizes of each node or edge are proportional to the amount of overlap (10% to 100%).
Ijms 14 07617f3
Figure 4. Number of non-systemic, type I systemic or type II systemic genes that respond also to salicylic acid (SA) or methyl-jasmonate (MeJA) treatments.
Ijms 14 07617f4
Figure 5. Number of putative PCESR genes that responded during most abiotic stress treatments. Overlapping UV-B light, osmotic and salt stress responsive genes are labeled Os_S_UV. Wounding, UV-B light, osmotic and salt stress responsive genes (Os_S_UV_W) or genotoxic, wounding, UV-B light, osmotic and salt stress responsive genes (Os_S_UV_W_G) are indicated accordingly. The base number of genes contained in each set is indicated in parenthesis.
Ijms 14 07617f5
Figure 5. Expression profiles of salt stress response genes. Genes of the non-systemic, type I systemic and type II systemic salt stress response are visualized for all nine treatments of the AtGenExpress abiotic stress experiment. Each line represents the expression trajectory of one gene for each stress condition, in each tissue and along all points in time. The grey bar indicates those genes of the salt stress response that were used as input. Each of the three panels displays individually the non-systemic, systemic type I and systemic type II salt response genes that passed our strict filtering criteria.
Ijms 14 07617f6
Table 1. Number of genes involved in a systemic or non-systemic stress response. Genes were classified as regulated under high-stringency conditions, as was described in the text. Identification of significantly regulated genes was conducted for shoot and root datasets independently. Detailed lists of genes are given in Table S1.
TotalRootShootNon-SystemicSystemic Type ISystemic Type II
Genotoxic257220991583762
Osmotic2,6871,1852,0666211,502564
Oxidative28111810171
Salt1,9341,6644561,478270186
UV-B1,1661461,1001,0206680
Wounding45319440434136
Table 2. Number of WRKY genes involved in a systemic or non-systemic abiotic stress response. The 61 WRKY genes present on the ATH1 Genechip Array are compared with all genes in each response type.
Non-SystemicSystemic Type ISystemic Type II
Genotoxic211
Osmotic643
Oxidative100
Salt2110
UV-B802
Wounding410
Table 3. The 56 genes of the plant core environmental stress response (PCESR). All genes are regulated during UV-B, osmotic, salt and wounding stress. CDU: genes that were previously proposed as PCESR genes [4] during cold, drought and UV-B (CDU) treatment. TR: gene products that are involved in the regulation of transcription (TR). H3K27me3: genes that are known targets for histone methylation in the shoot [46,47]; Paralog: genes with paralogs contained in the list (x), genes that have paralogs in the genome (p), probes that identify paralogous genes (o).
Affy IDAGIDescriptionCDUTRH3K27me3Paralog
263584_ATAt2g17040Anac036xx
252278_ATAt3g49530Anac062xx
257644_ATAt3g25780Allene oxide cyclase 3p
264217_ATAt1g60190AtPUB19 E3 ubiquitin ligasep
246099_ATAt5g20230Blue-copper binding SAG14x
265480_ATAt2g15970AtCOR413-PM1/Cyclophilin 19
259789_ATAt1g29395AtCOR413-TM1p
255479_ATAt4g02380AtLEA5/SAG21p
246272_ATAt4g37150Methyl esterase 9xp
252053_ATAt3g52400AtSYP122 syntaxin
253485_ATAt4g31800AtWRKY18xp
257022_ATAt3g19580AZF2xxp
252679_ATAt3g44260CAF1a/CCR4-associated factor 1xxxx
249928_ATAt5g22250CAF1b/CCR4-associated factor 1xx
250149_ATAt5g14700Cinnamoyl-CoA reductase-related
263497_ATAt2g42540AtCOR15Axp
254232_ATAt4g23600AtCORI3xp
247071_ATAt5g66640AtDAR3p
252102_ATAt3g50970Dehydrin XERO2
252265_ATAt3g49620Dark inducible 11xp
256526_ATAt1g66090TIR-NBS disease resistance proteinx
249264_S_ATAt5g41740
At5g41750
TIR-NBS disease resistance proteinso
262325_ATAt1g64160Dirigent family protein AtDIR5
264436_ATAt1g10370ERD9p
261470_ATAt1g28370ERF11xxp
248799_ATAt5g47230ERF5xxp
265276_ATAt2g28400Protein of unknown function
259445_ATAt1g02400Gibberellin oxidase 6
266555_ATAt2g46270G-box binding factor 3x
265725_ATAt2g32030GNAT family proteinxp
266142_ATAt2g39030GNAT family proteinxxp
251200_ATAt3g63010Gibberellin receptor GID1B
258792_ATAt3g04640RNA-binding glycine-rich proteinx
250279_ATAt5g13200GRAM domain-containing protein
262930_ATAt1g65690LEA-related/HIN1-related
246214_ATAt4g36990Heat shock factor protein 4x
248327_ATAt5g52750Heavy-metal-transport superfamilyp
265724_ATAt2g32100Ovate family protein 16xp
250793_ATAt5g05600Fe(II)-dependent oxygenase
248164_ATAt5g54490EF-hand containing PBP1
264580_ATAt1g05340Protein of unknown functionp
256933_ATAt3g22600Lipid-binding proteinp
252470_ATAt3g46930Protein kinase family proteinp
258650_ATAt3g09830Protein kinase family protein
266834_S_ATAt2g30020
At3g27140
At4g08260
Protein phosphatase 2Co
251259_ATAt3g62260Protein phosphatase 2C
253140_ATAt4g35480RING finger protein RHA3Bxp
252921_ATAt4g39030MATE-transporter SID1/EDS5
256017_ATAt1g19180TIFY10A/JAZ1xp
254321_ATAt4g22590Trehalose-6-phosphate phosphatase
266452_ATAt2g43320Putative methyltransferase
250796_ATAt5g05300Protein of unknown functionx
254500_ATAt4g20110Vacuolar sorting receptor 7p
261648_ATAt1g27730ZAT10xx
247655_ATAt5g59820ZAT12xxx
245711_ATAt5g04340ZAT6xx
Table 4. The 56 PCESR genes are involved in different response types. The genes are listed according to a non-systemic (nsy) or type I (I) or type II (II) systemic response. As indicated, several PCESR genes do not respond in all of the stresses (●).
AGIDescriptionoxidativegenotoxicosmoticsaltUV-Bwounding
At5g66640AtDAR3nsynsynsynsy
At4g31800AtWRKY18nsynsynsy
At1g64160Dirigent family protein AtDIR5nsynsynsynsyII
At5g05600Fe(II)-dependent oxygenaseIIIInsyII
At1g27730ZAT10IIIIInsynsy
At4g02380AtLEA5/SAG21IIInsynsy
At3g49620Dark inducible 11IInsynsynsy
At5g52750Heavy-metal-transport superfamilyIIIIIIInsy
At1g10370ERD9IIIInsy
At5g14700Cinnamoyl-CoA reductase-relatedIIIIIInsy
At1g29395AtCOR413-TM1IIInsynsy
At2g15970AtCOR413-PM1/Cyclophilin 19IIIInsynsy
At2g17040Anac036IInsynsynsy
At3g49530Anac062Insynsynsy
At3g25780Allene oxide cyclase 3Insynsynsy
At3g52400AtSYP122 syntaxinInsynsynsy
At5g22250CAF1b/CCR4-associated factor 1Insynsynsy
At3g44260CAF1a/CCR4-associated factor 1IInsynsynsy
At5g47230ERF5Insynsy
At1g28370ERF11IInsynsy
At4g37150Methyl esterase 9IIInsy
At4g23600AtCORI3IInsynsy
At2g42540AtCOR15AIIIInsynsy
At3g19580AZF2IIIInsynsy
At3g50970Dehydrin XERO2IIIInsynsy
At2g46270G-box binding factor 3IIIInsy
At5g13200GRAM domain-containing proteinIIIInsynsy
At2g28400Protein of unknown functionIIIInsynsy
At1g60190AtPUB19 E3 ubiquitin ligaseIIIInsynsy
At1g19180TIFY10A/JAZ1IIIInsynsy
At5g59820ZAT12IIIInsy
At5g04340ZAT6IIIInsynsy
At5g05300Protein of unknown functionIIInsynsy
At4g36990Heat shock factor protein 4IIInsynsy
At2g32030GNAT family proteinInsyIInsy
At2g39030GNAT family proteinIInsynsy
At3g63010Gibberellin receptor GID1BIInsynsy
At1g65690LEA-related/HIN1-relatedIInsynsy
At3g22600Lipid-binding proteinIInsynsy
At2g32100Ovate family protein 16IInsynsy
At4g20110Vacuolar sorting receptor 7IInsynsy
At5g54490EF-hand containing PBP1Insynsynsy
At4g39030MATE-transporter SID1/EDS5Insynsynsy
At2g43320Putative methyltransferaseInsynsynsy
At3g46930Protein kinase family proteinInsynsynsy
At3g09830Protein kinase family proteinInsynsynsy
At2g30020
At3g27140
At4g08260
Protein phosphatase 2CInsynsynsy
At4g22590Trehalose-6-phosphate phosphataseInsynsynsy
At1g66090TIR-NBS disease resistance proteinInsynsy
At5g41740
At5g41750
TIR-NBS disease resistance proteinsIInsynsynsy
At5g20230Blue-copper binding SAG14IInsynsy
At1g02400Gibberellin oxidase 6IInsynsynsy
At3g62260Protein phosphatase 2CIInsynsynsy
At3g04640RNA-binding glycine-rich proteinIInsynsynsy
At4g35480RING finger protein RHA3BIInsynsynsy
At1g05340Protein of unknown functionIInsynsy

