Structural Characterization of an LPA1 Second Extracellular Loop Mimetic with a Self-Assembling Coiled-Coil Folding Constraint

Abstract
:1. Introduction
2. Results and Discussion
2.1. Peptide Design
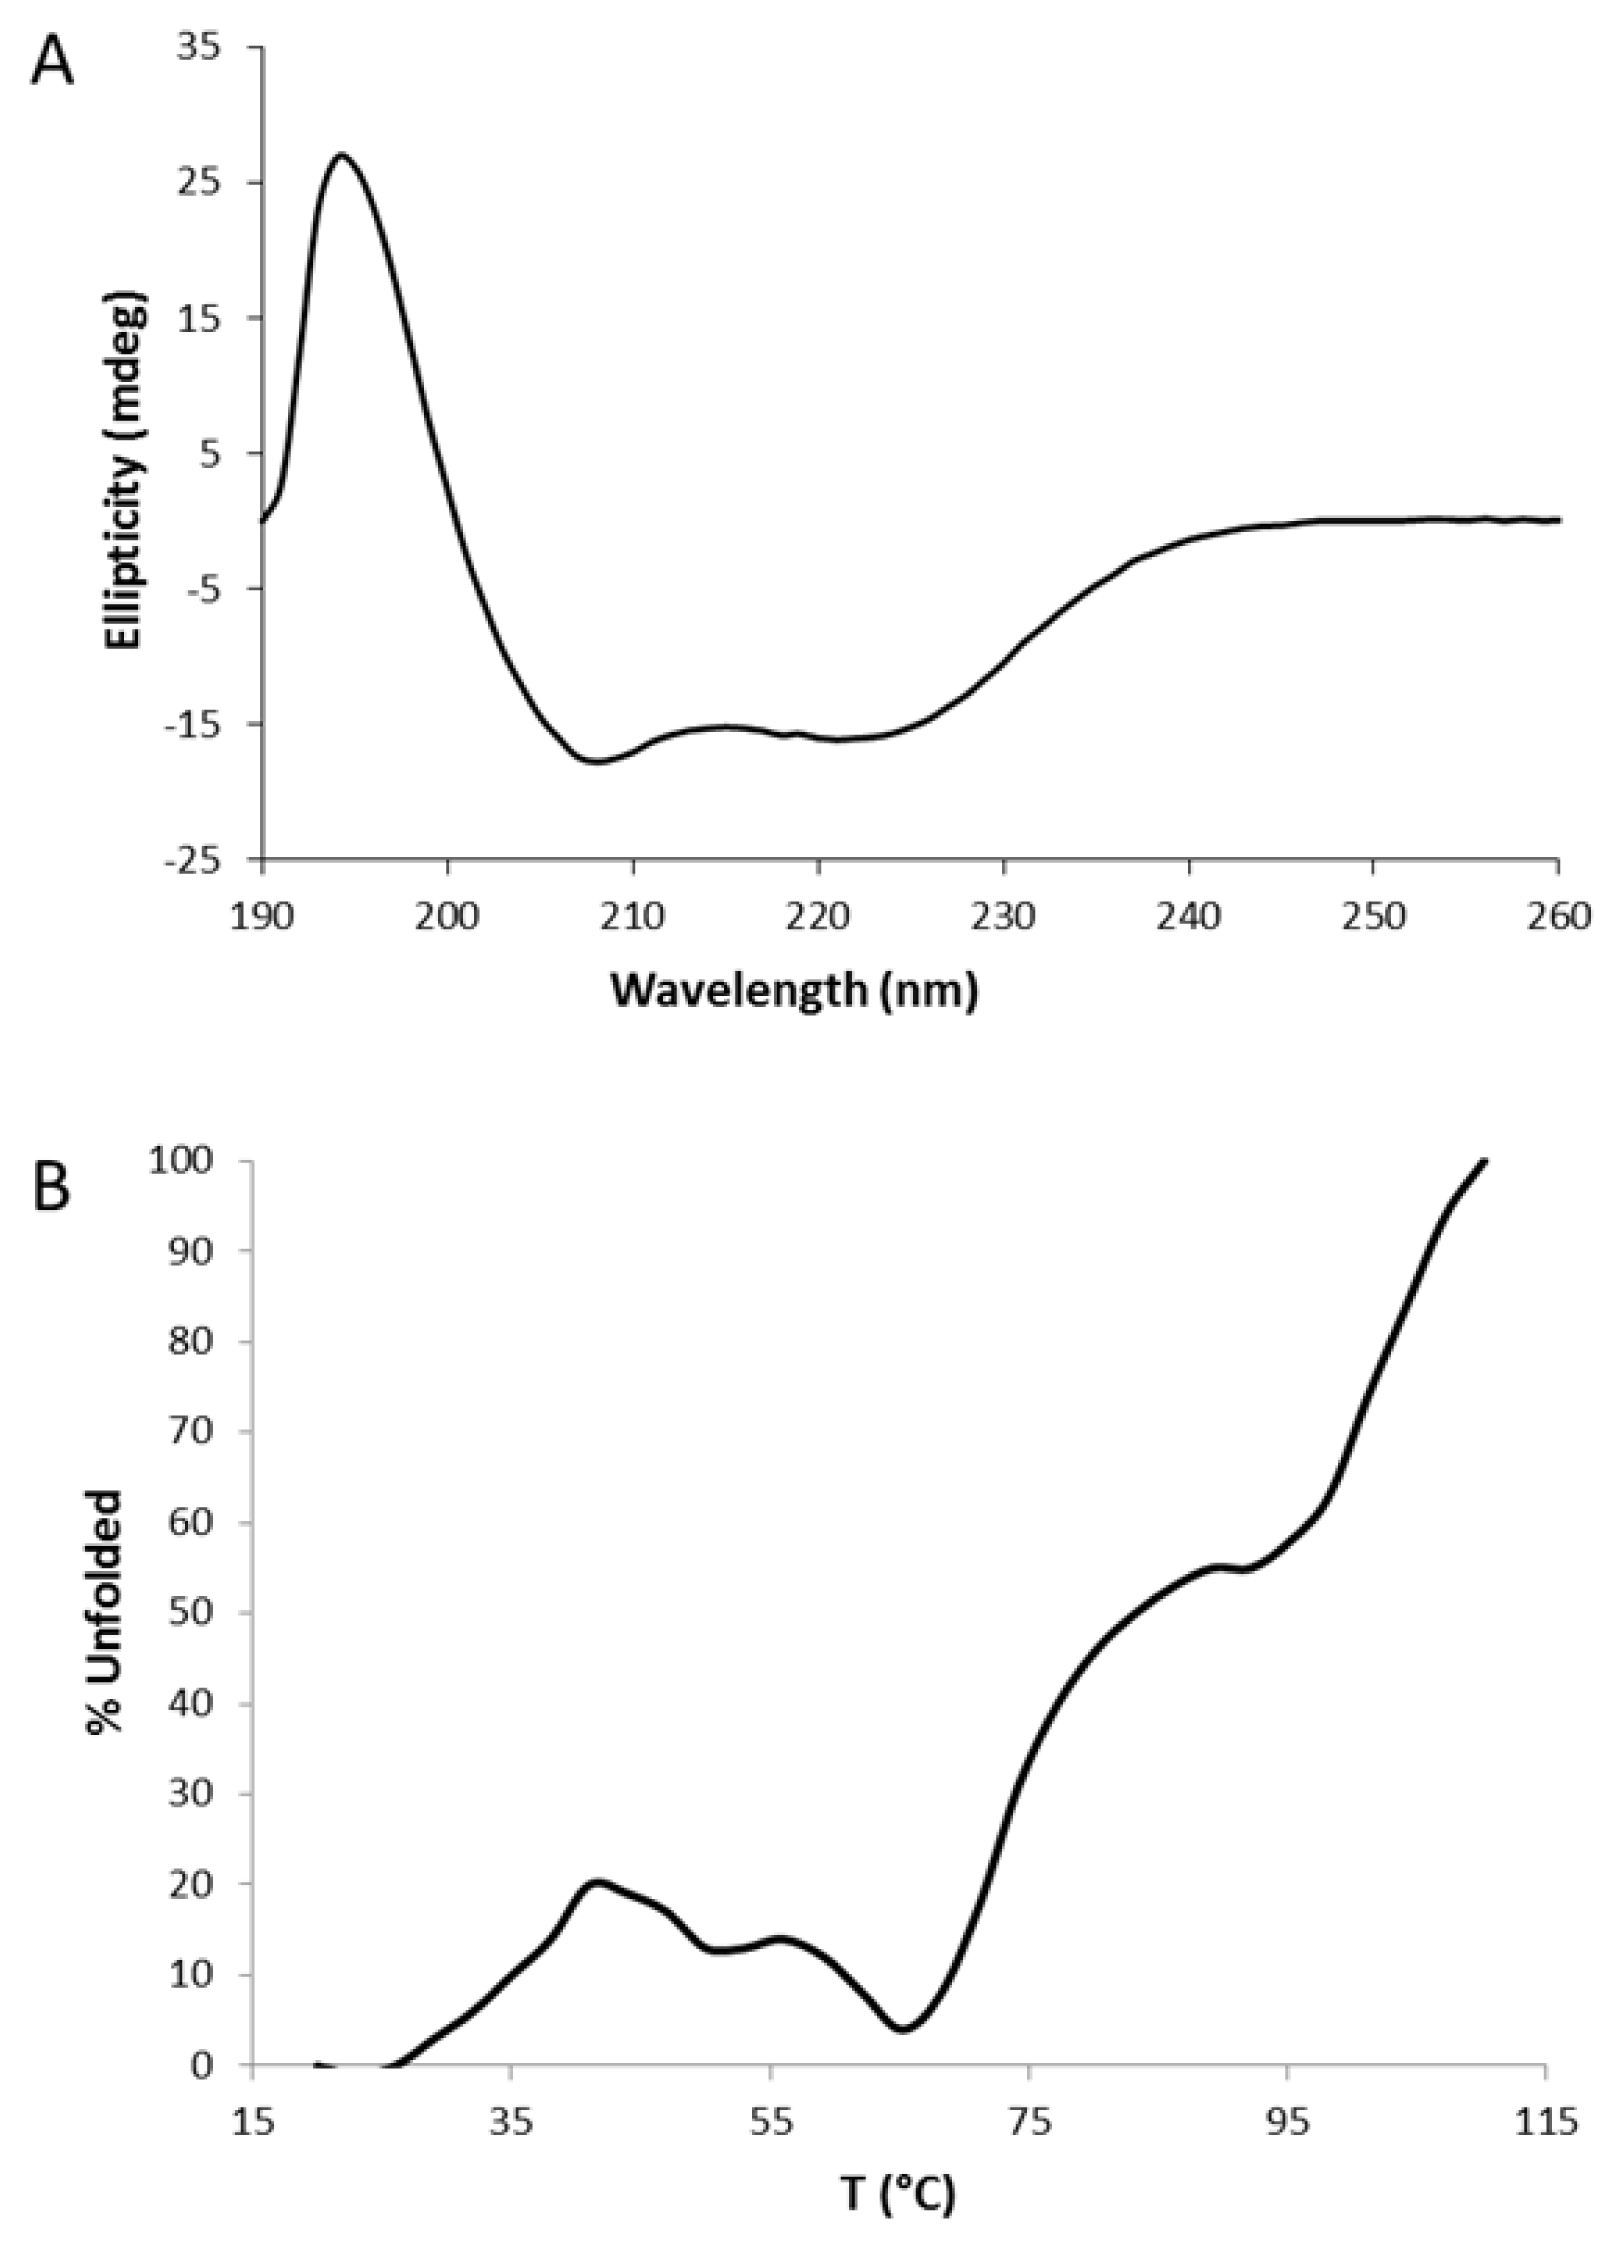
2.2. Circular Dichroism (CD)
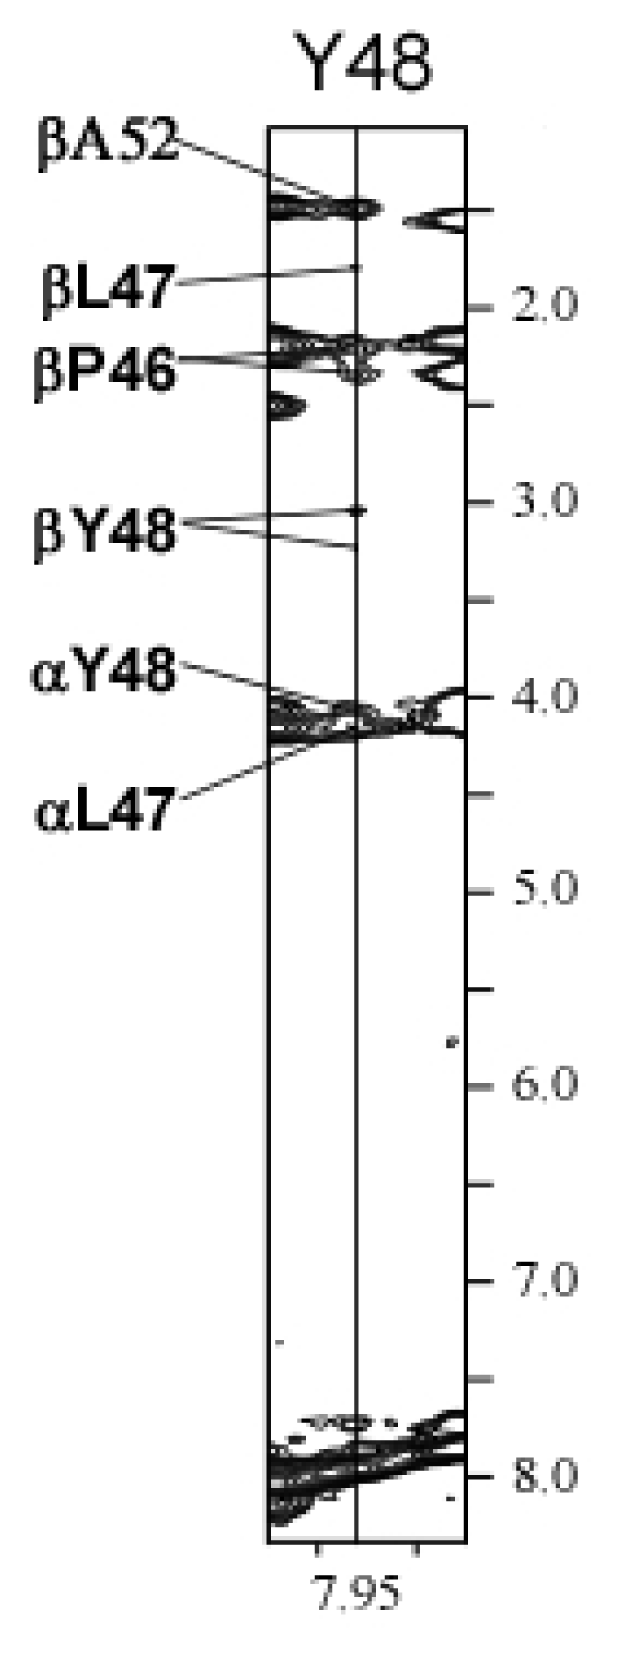
2.3. Chemical Shift Assignments and Helical Calculations
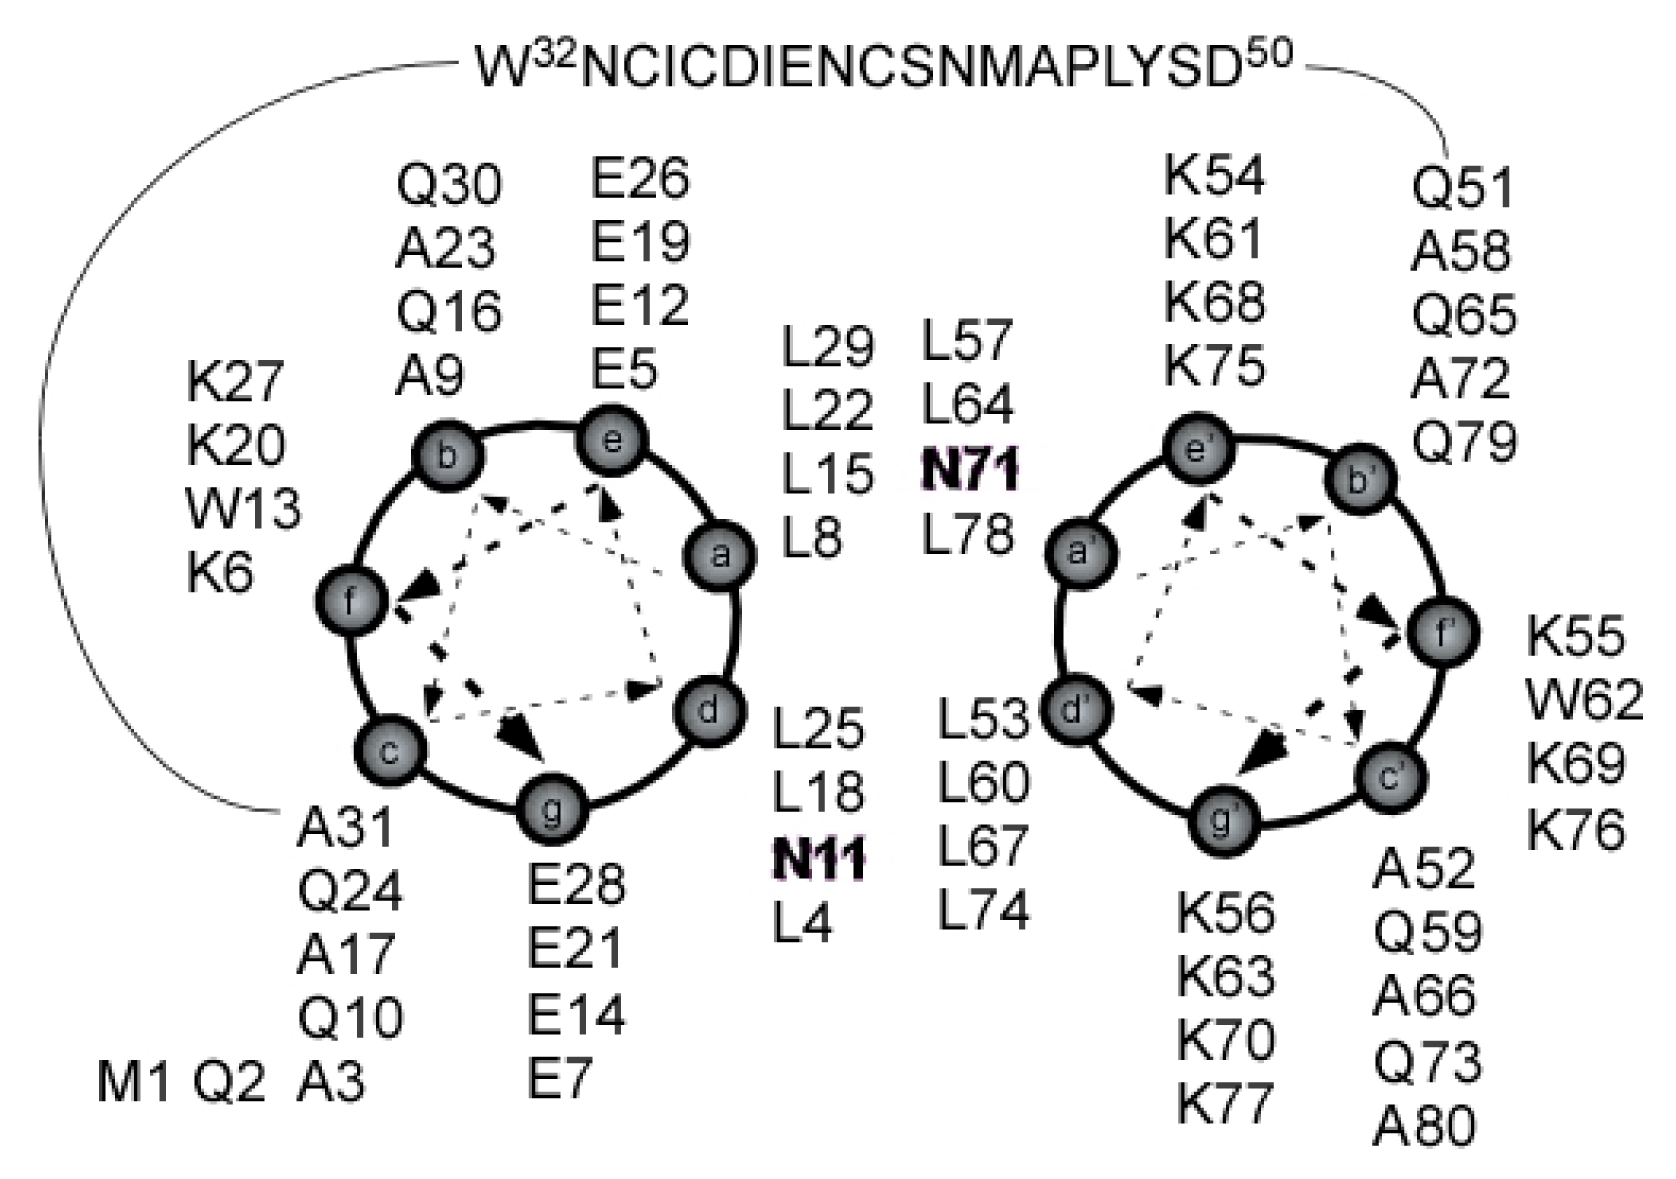
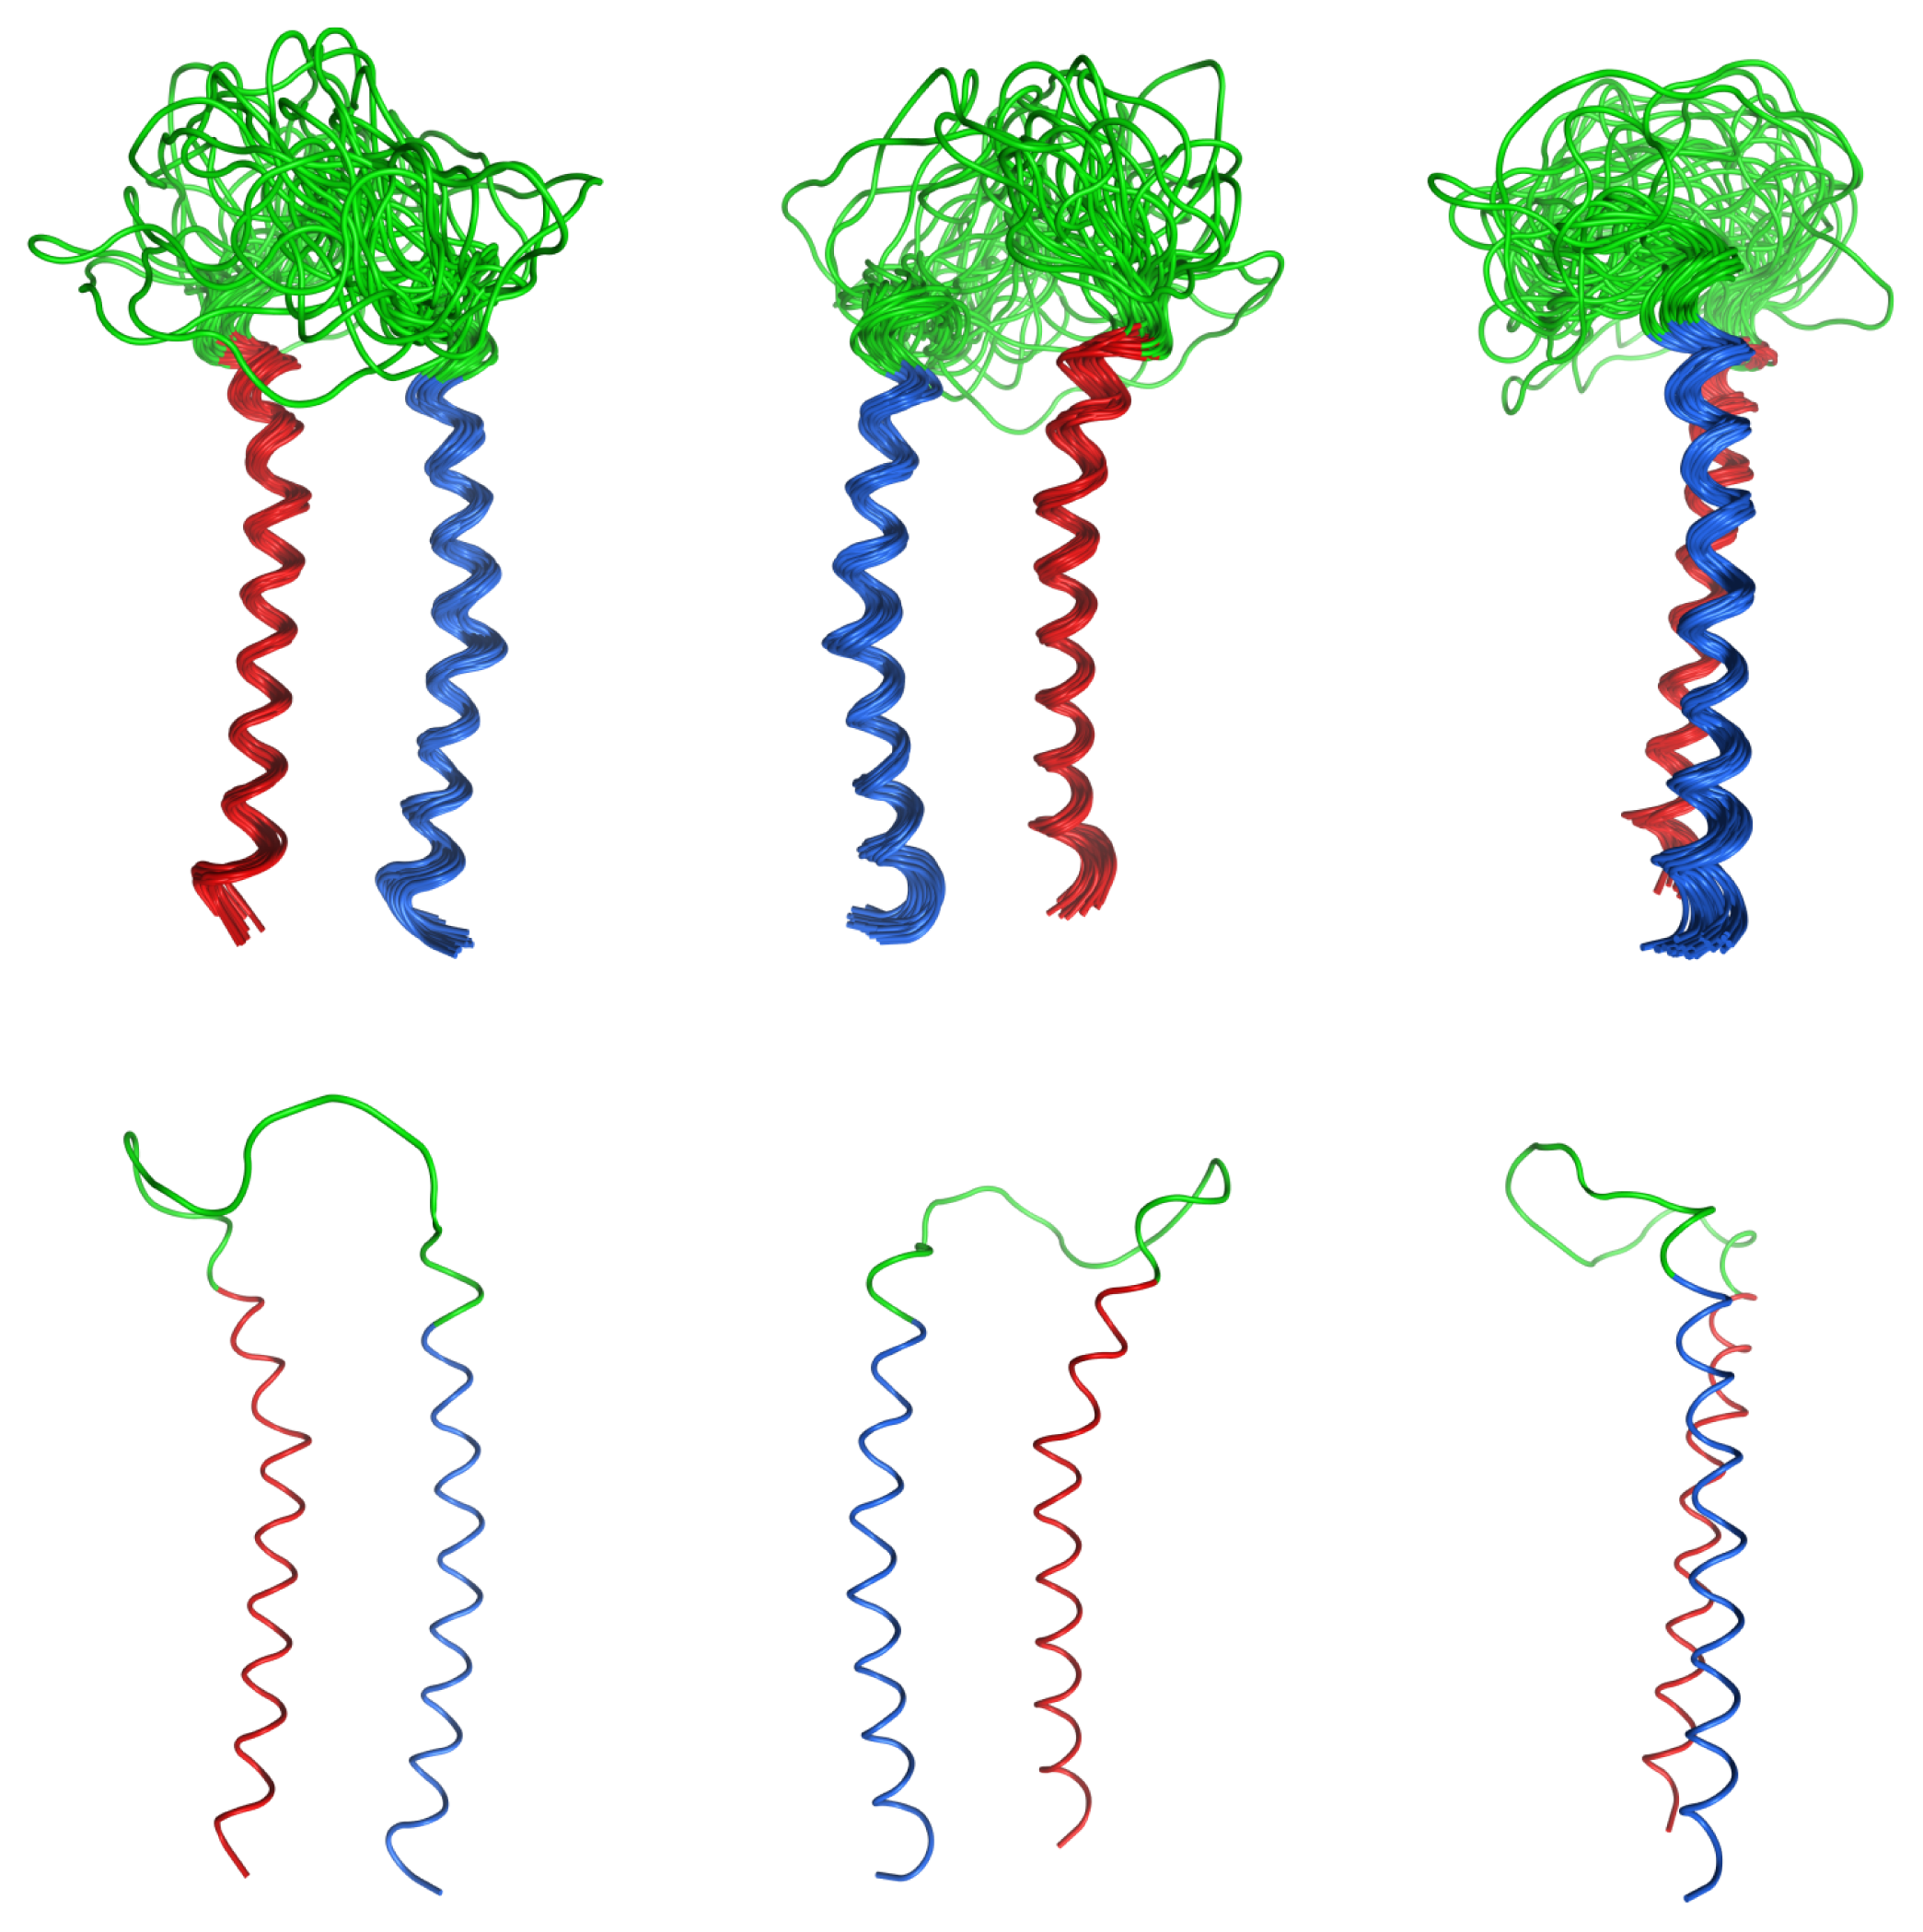
2.4. Coiled Coil
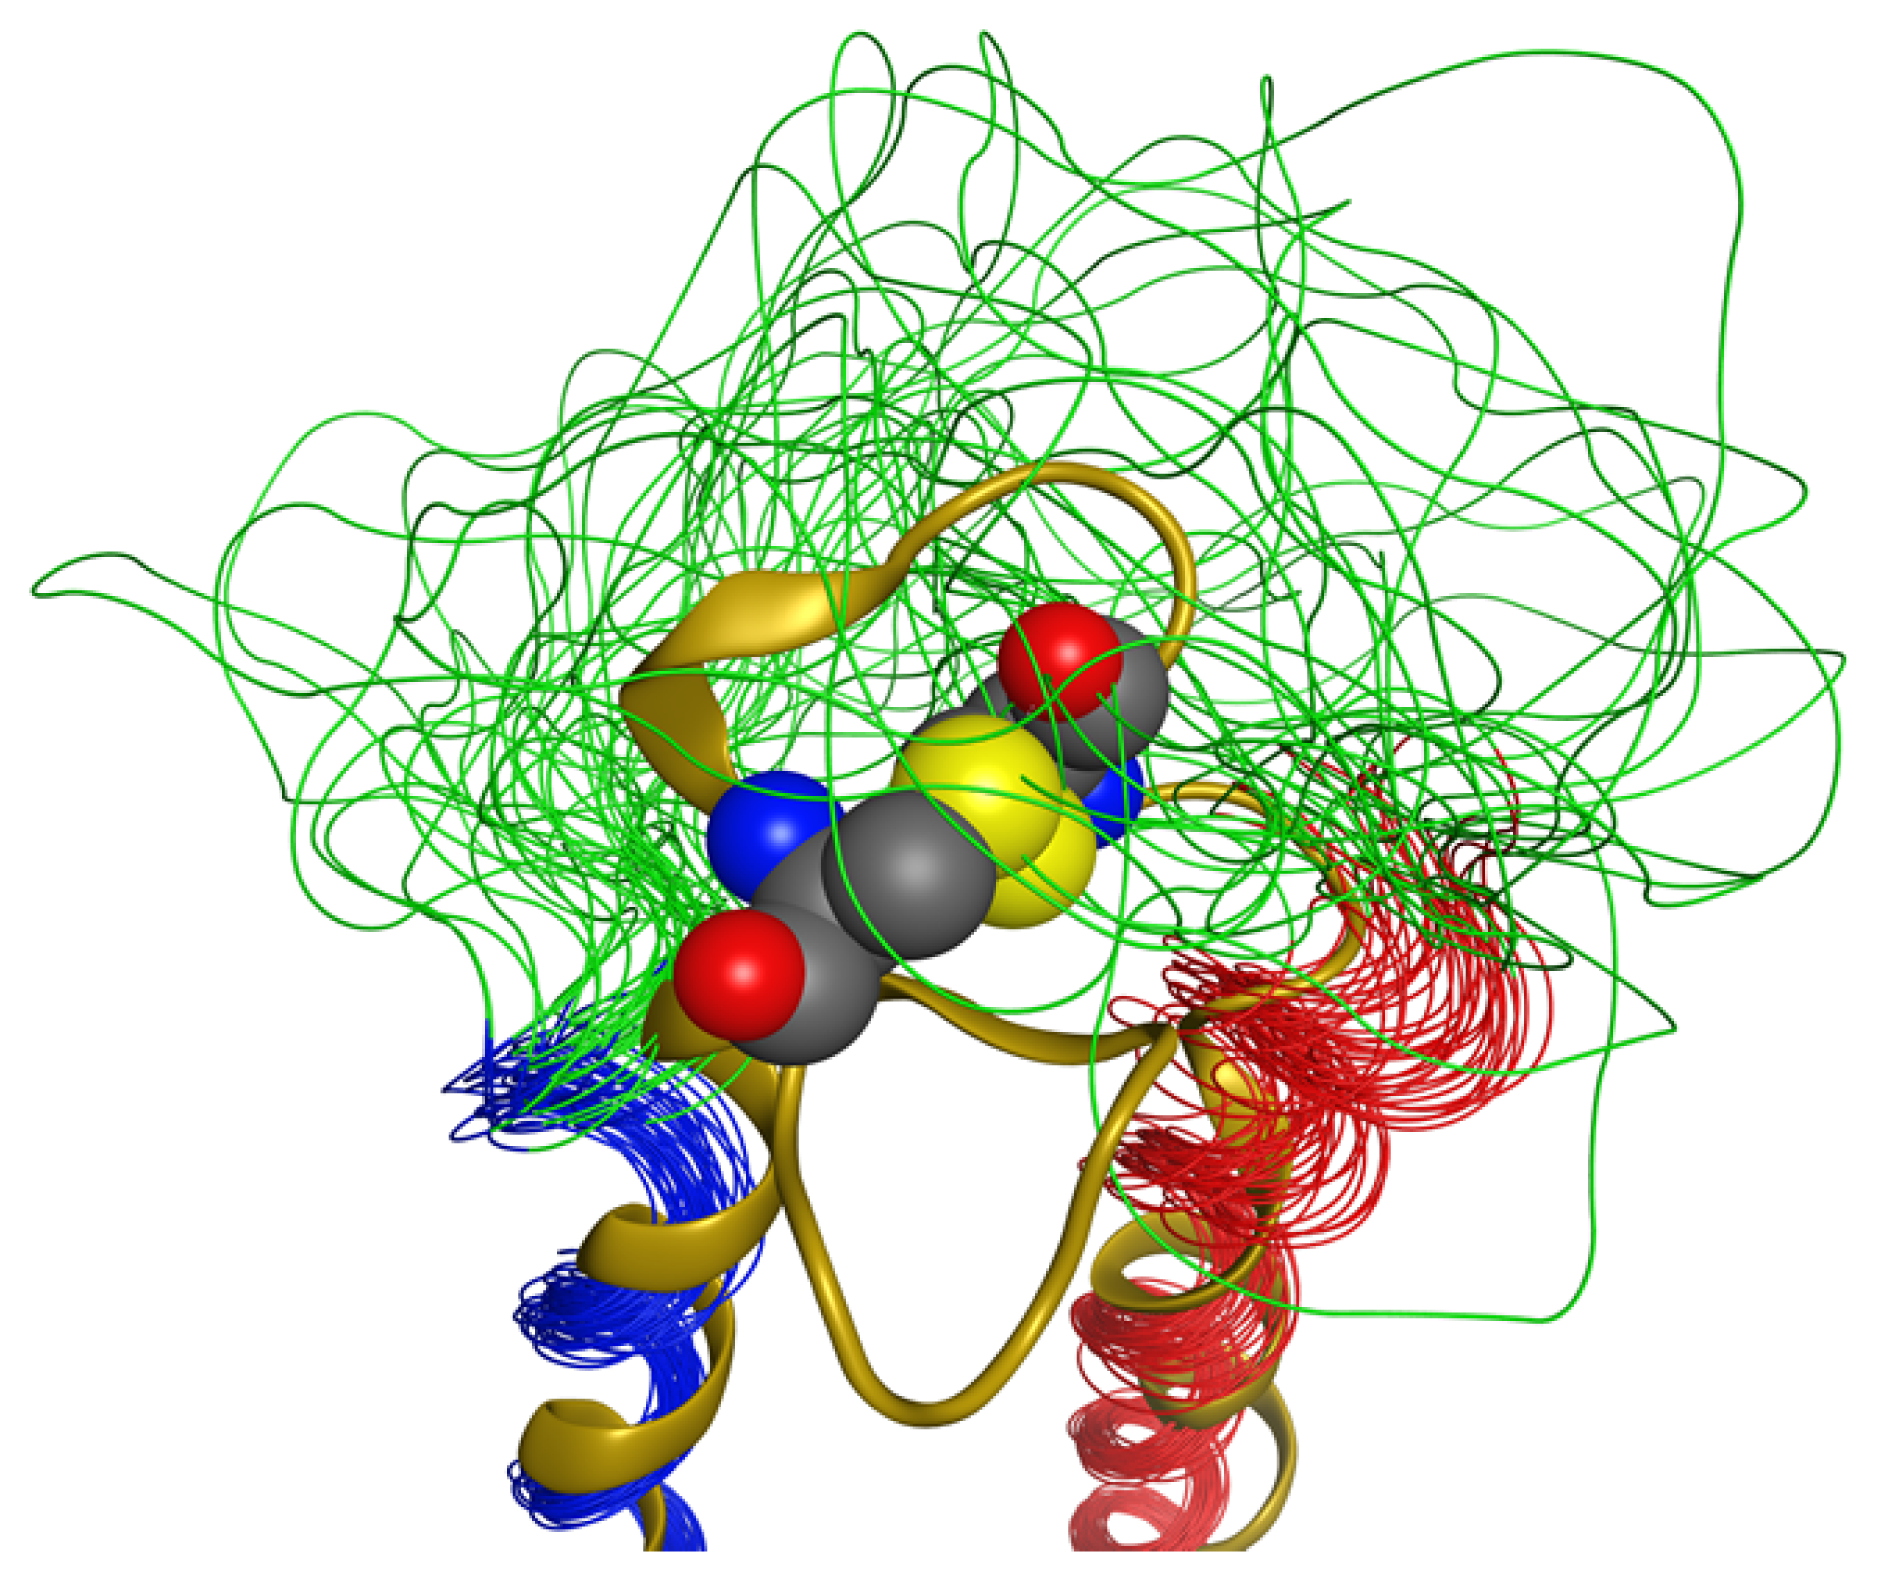
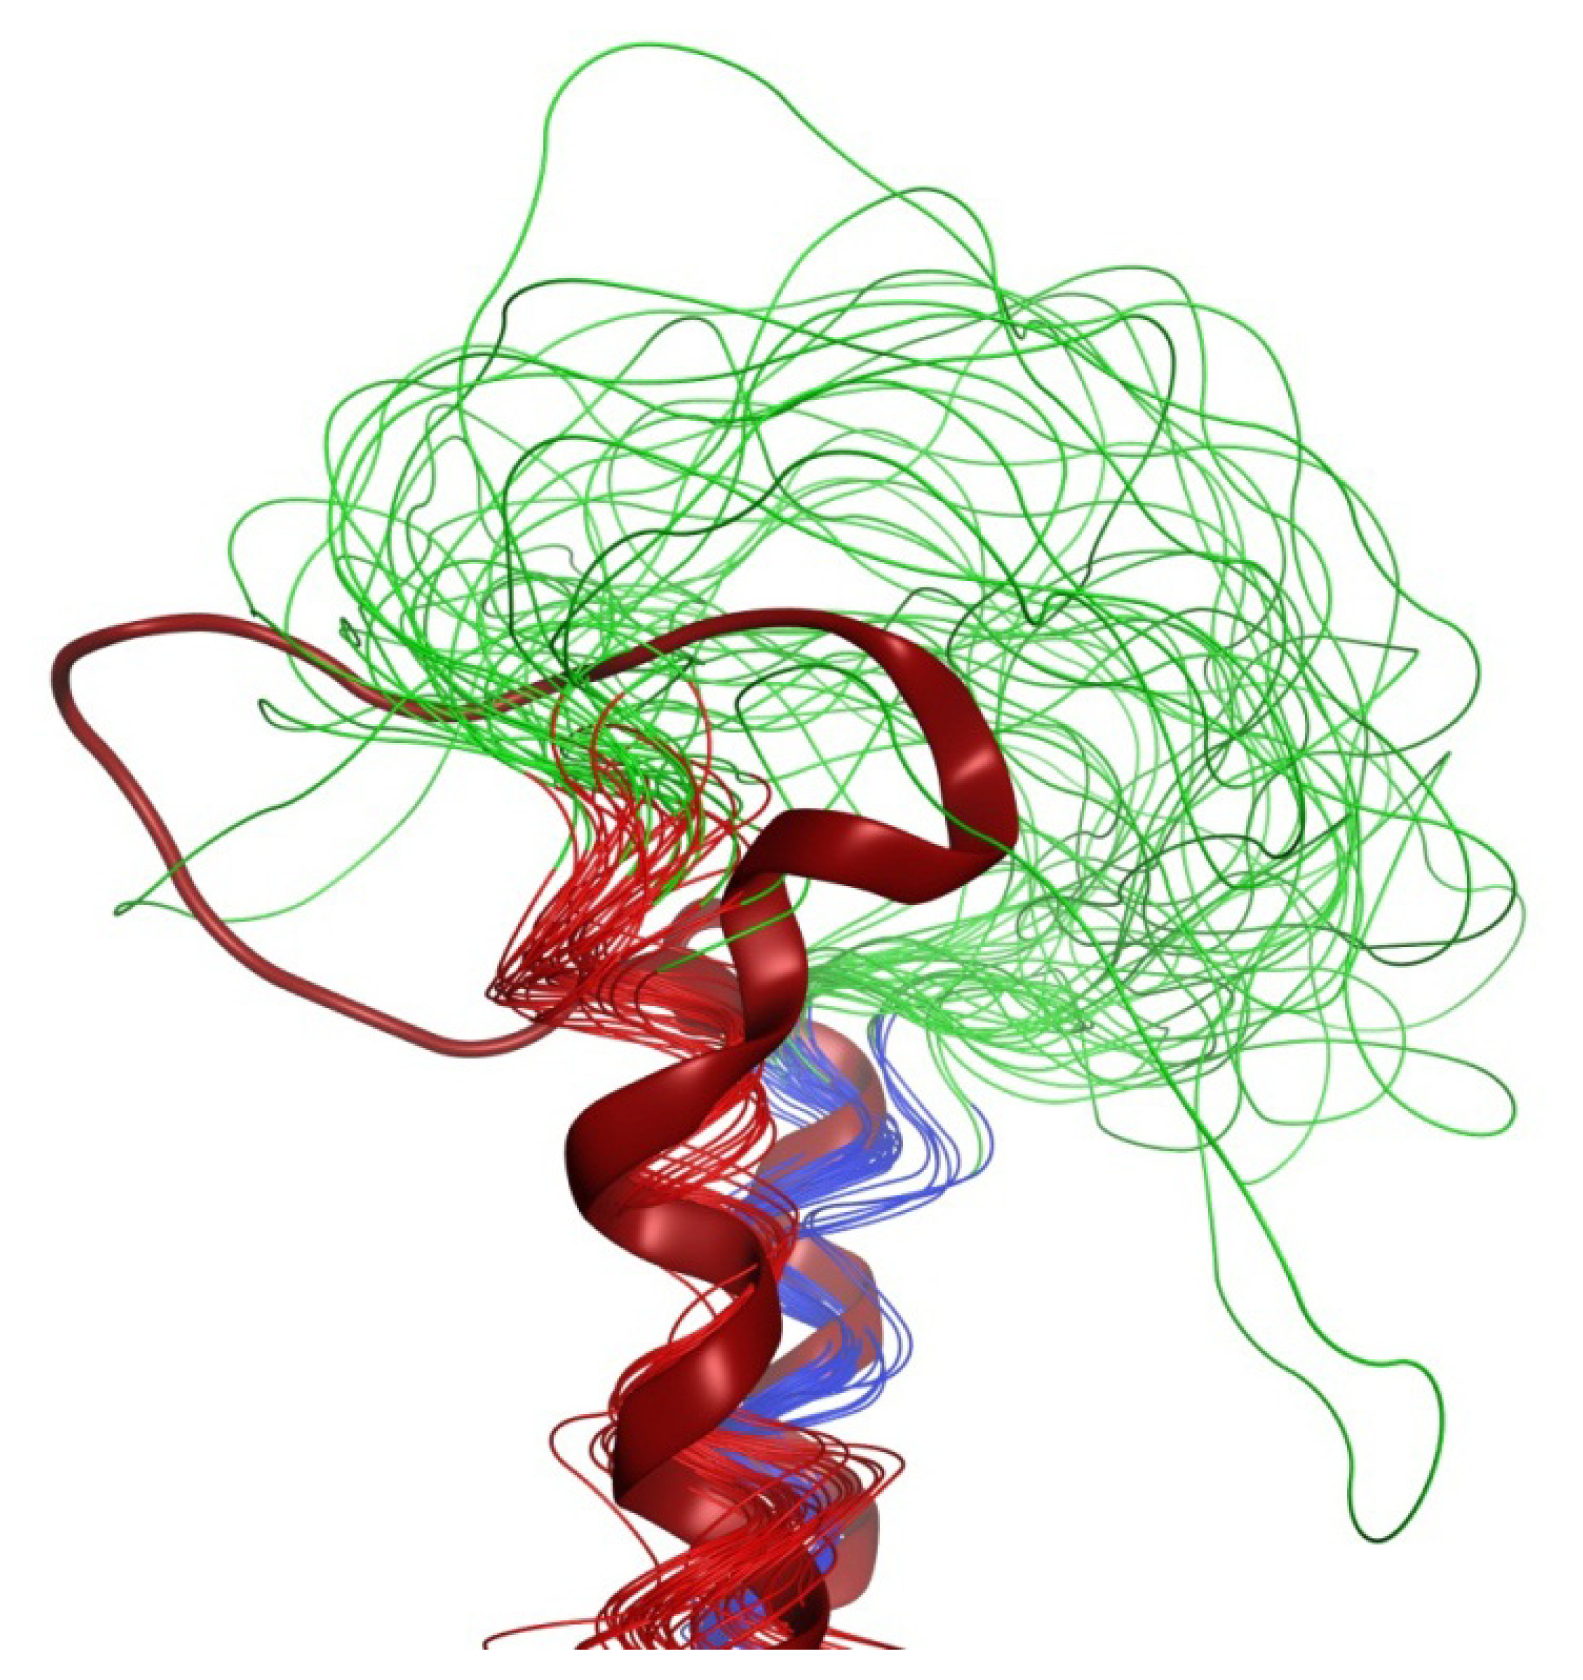
2.5. Loop
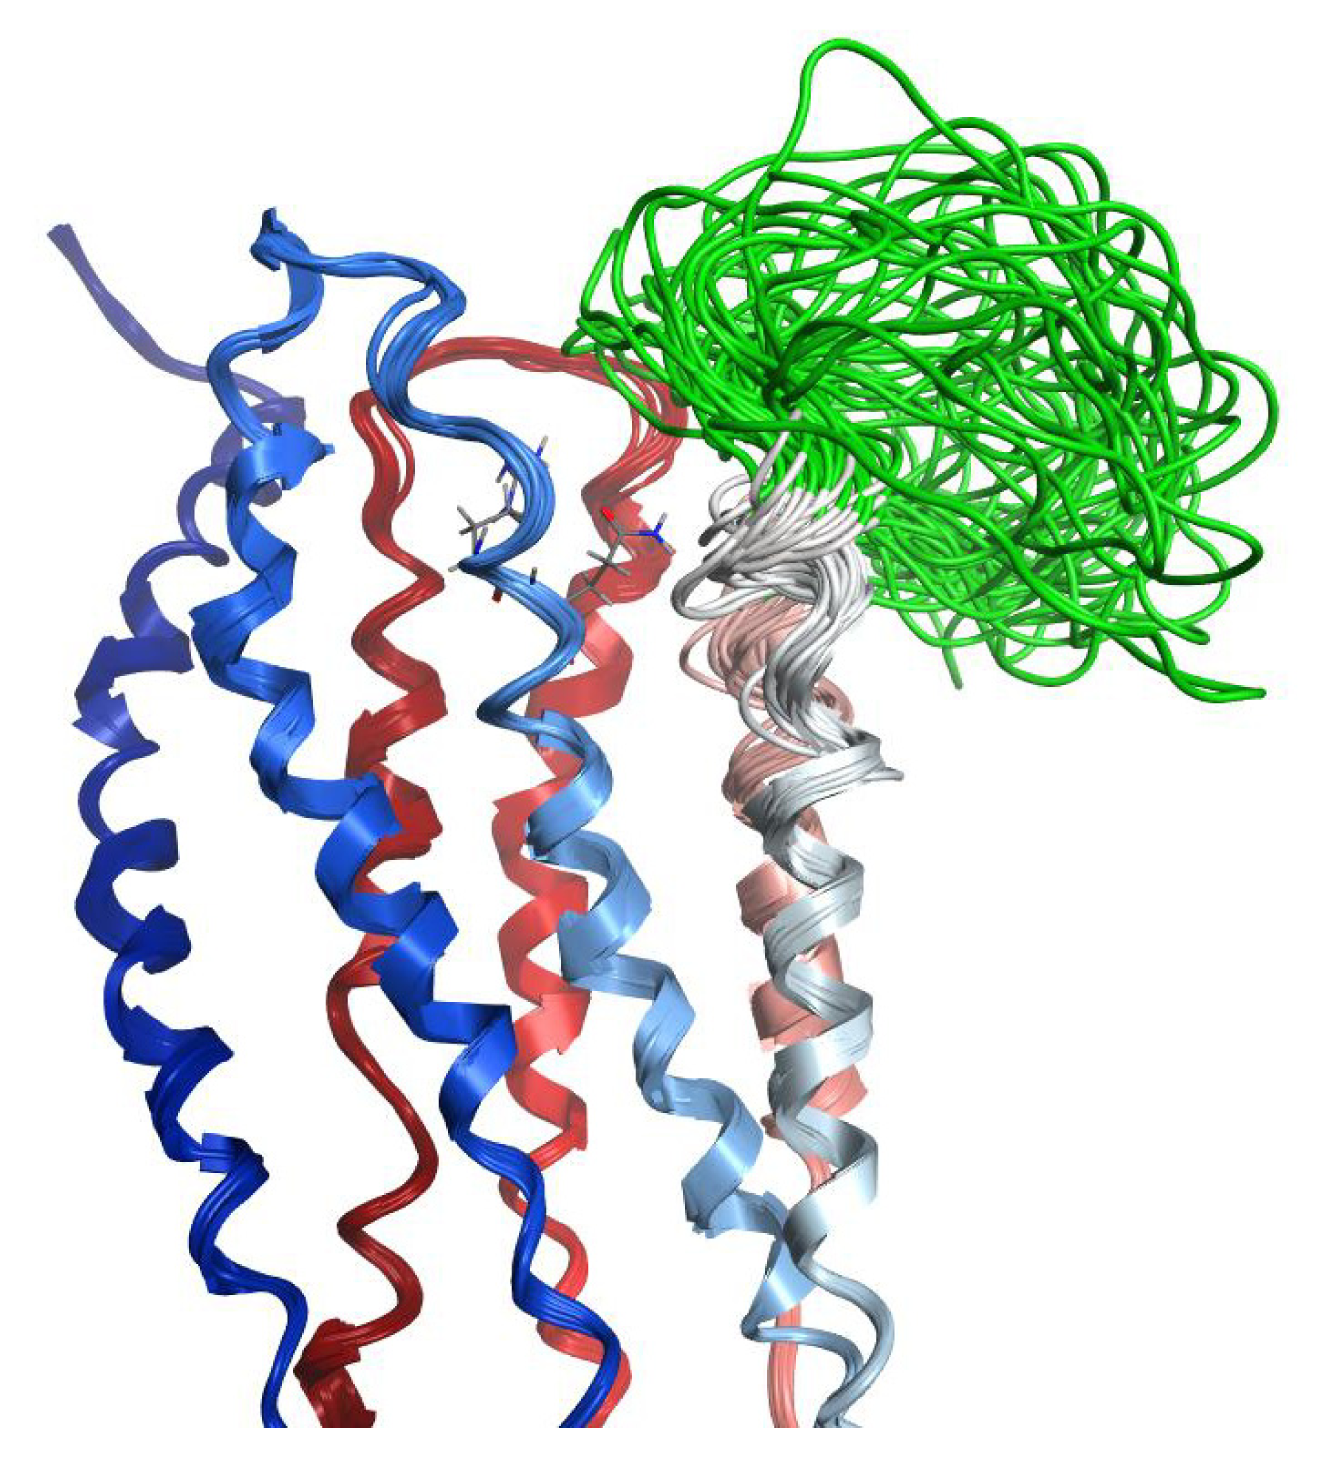
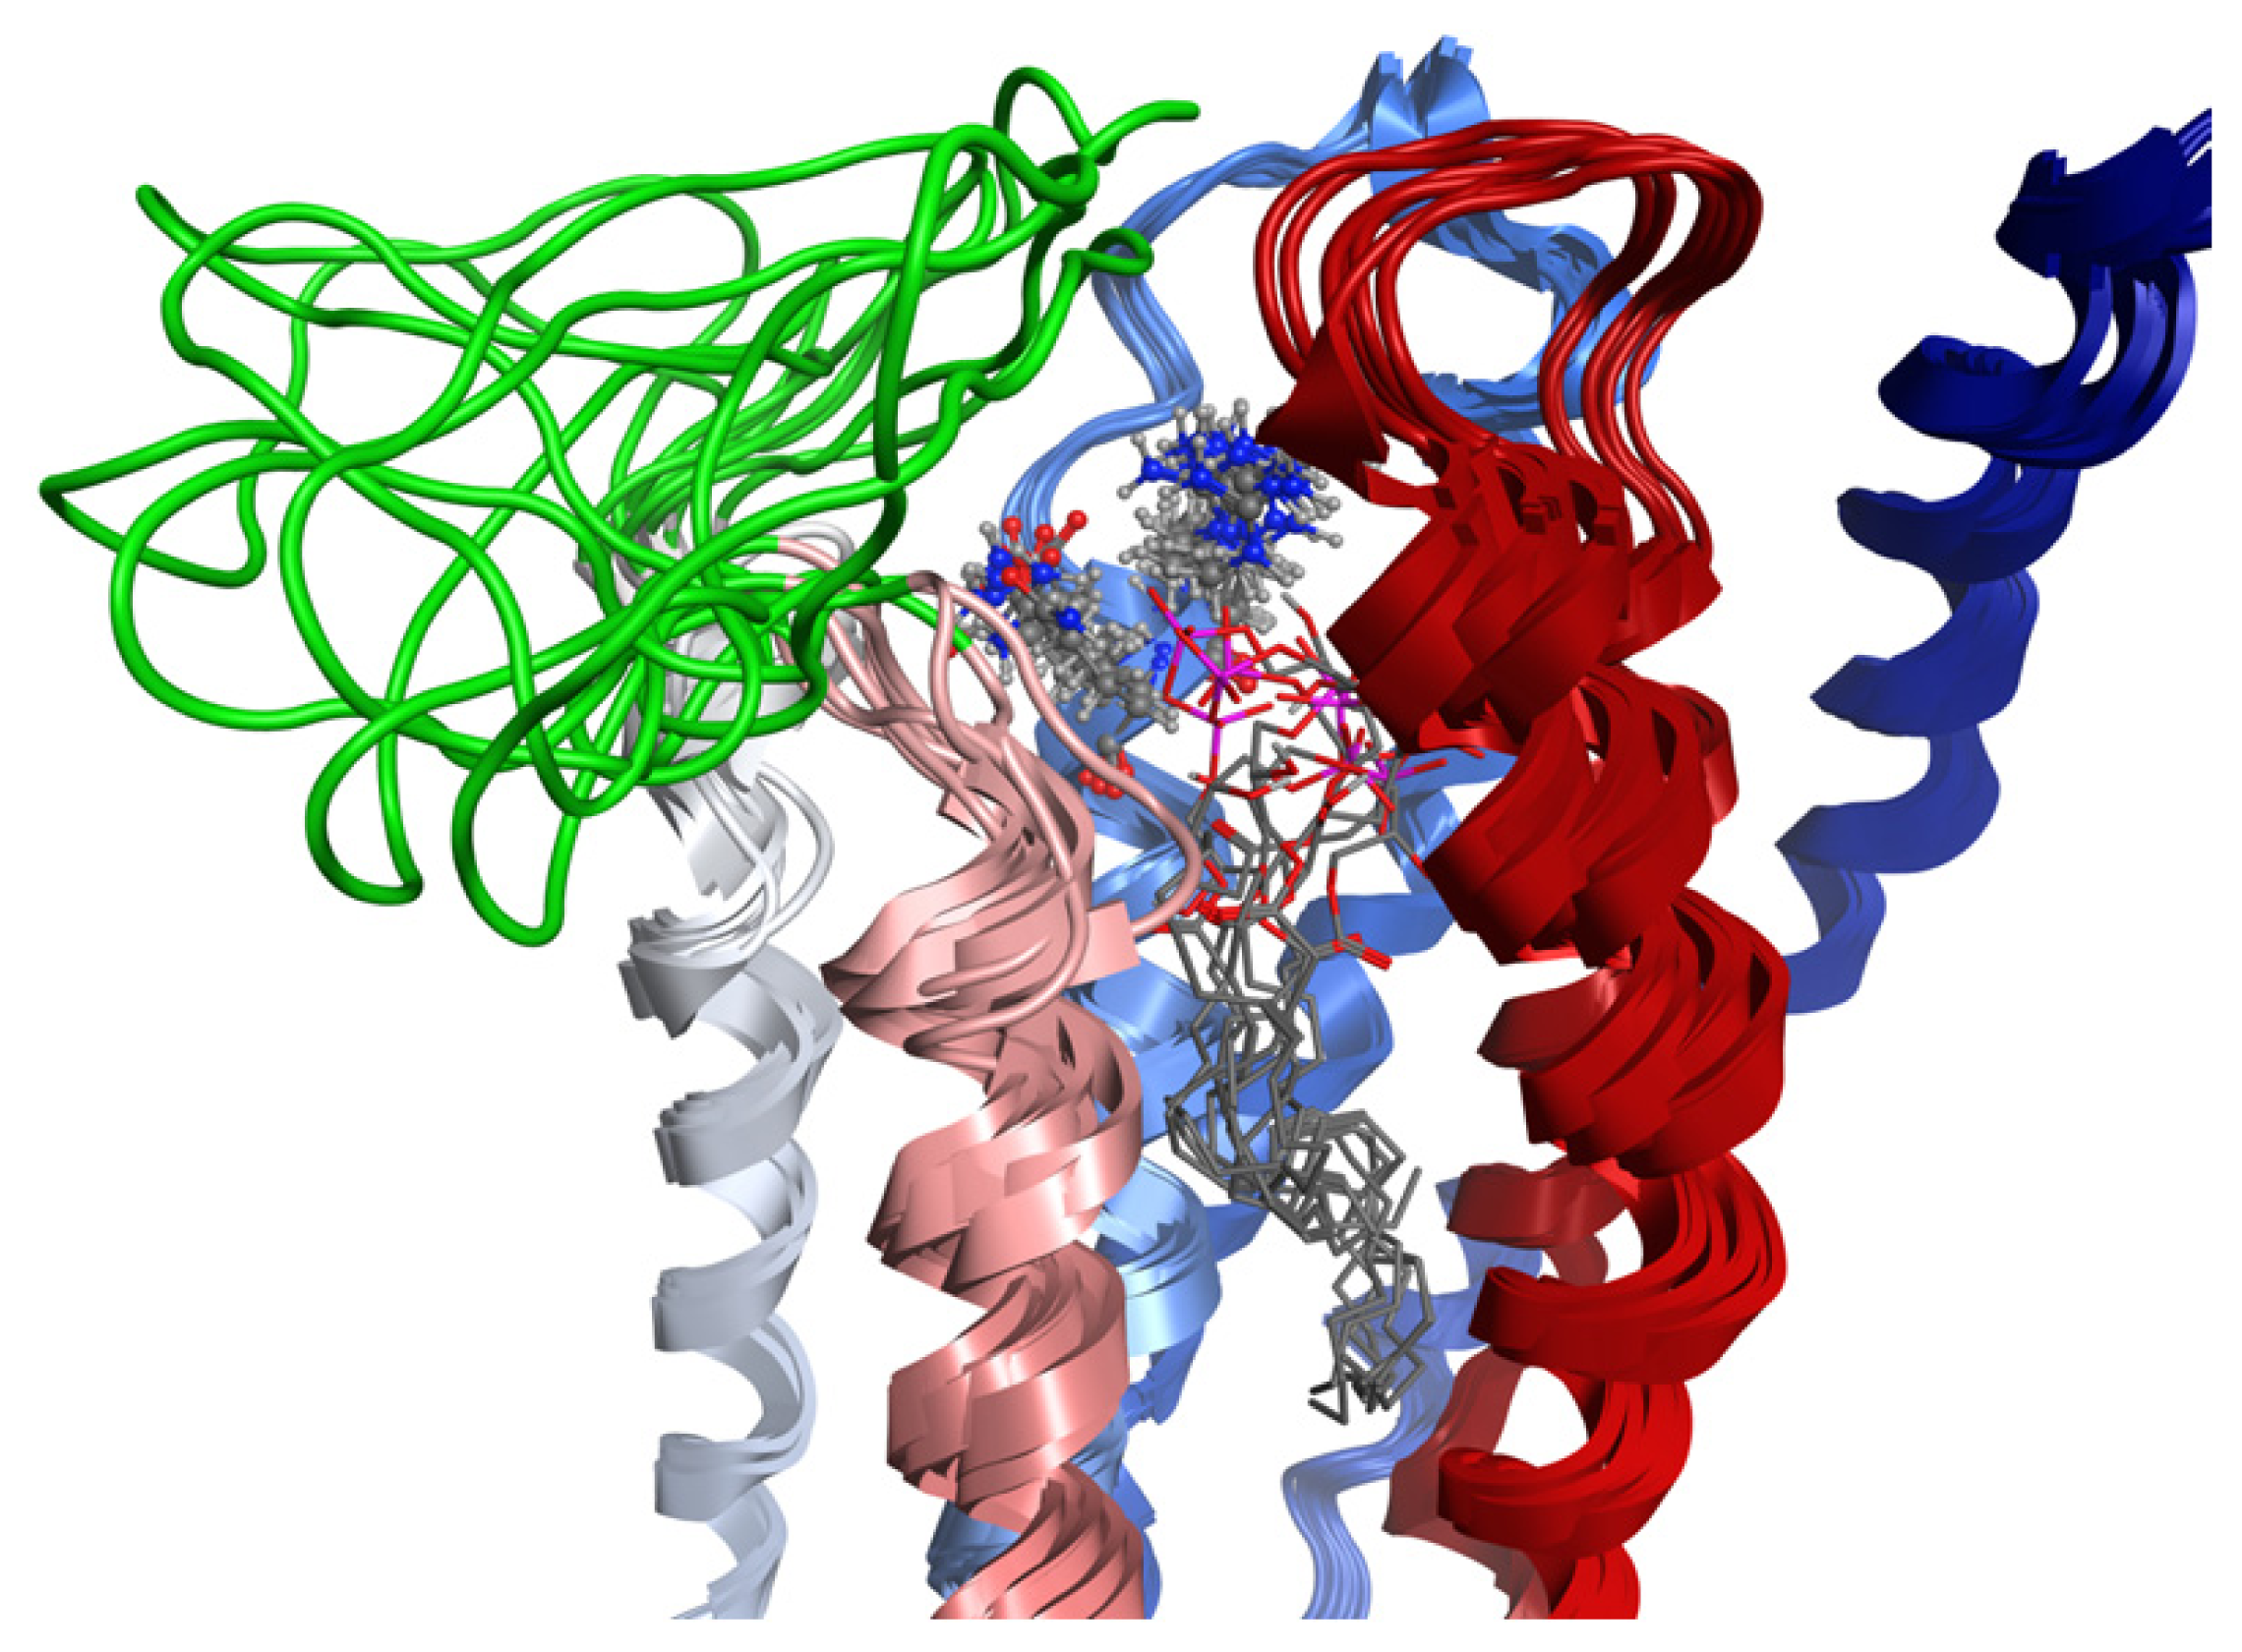
2.6. Overall Structure
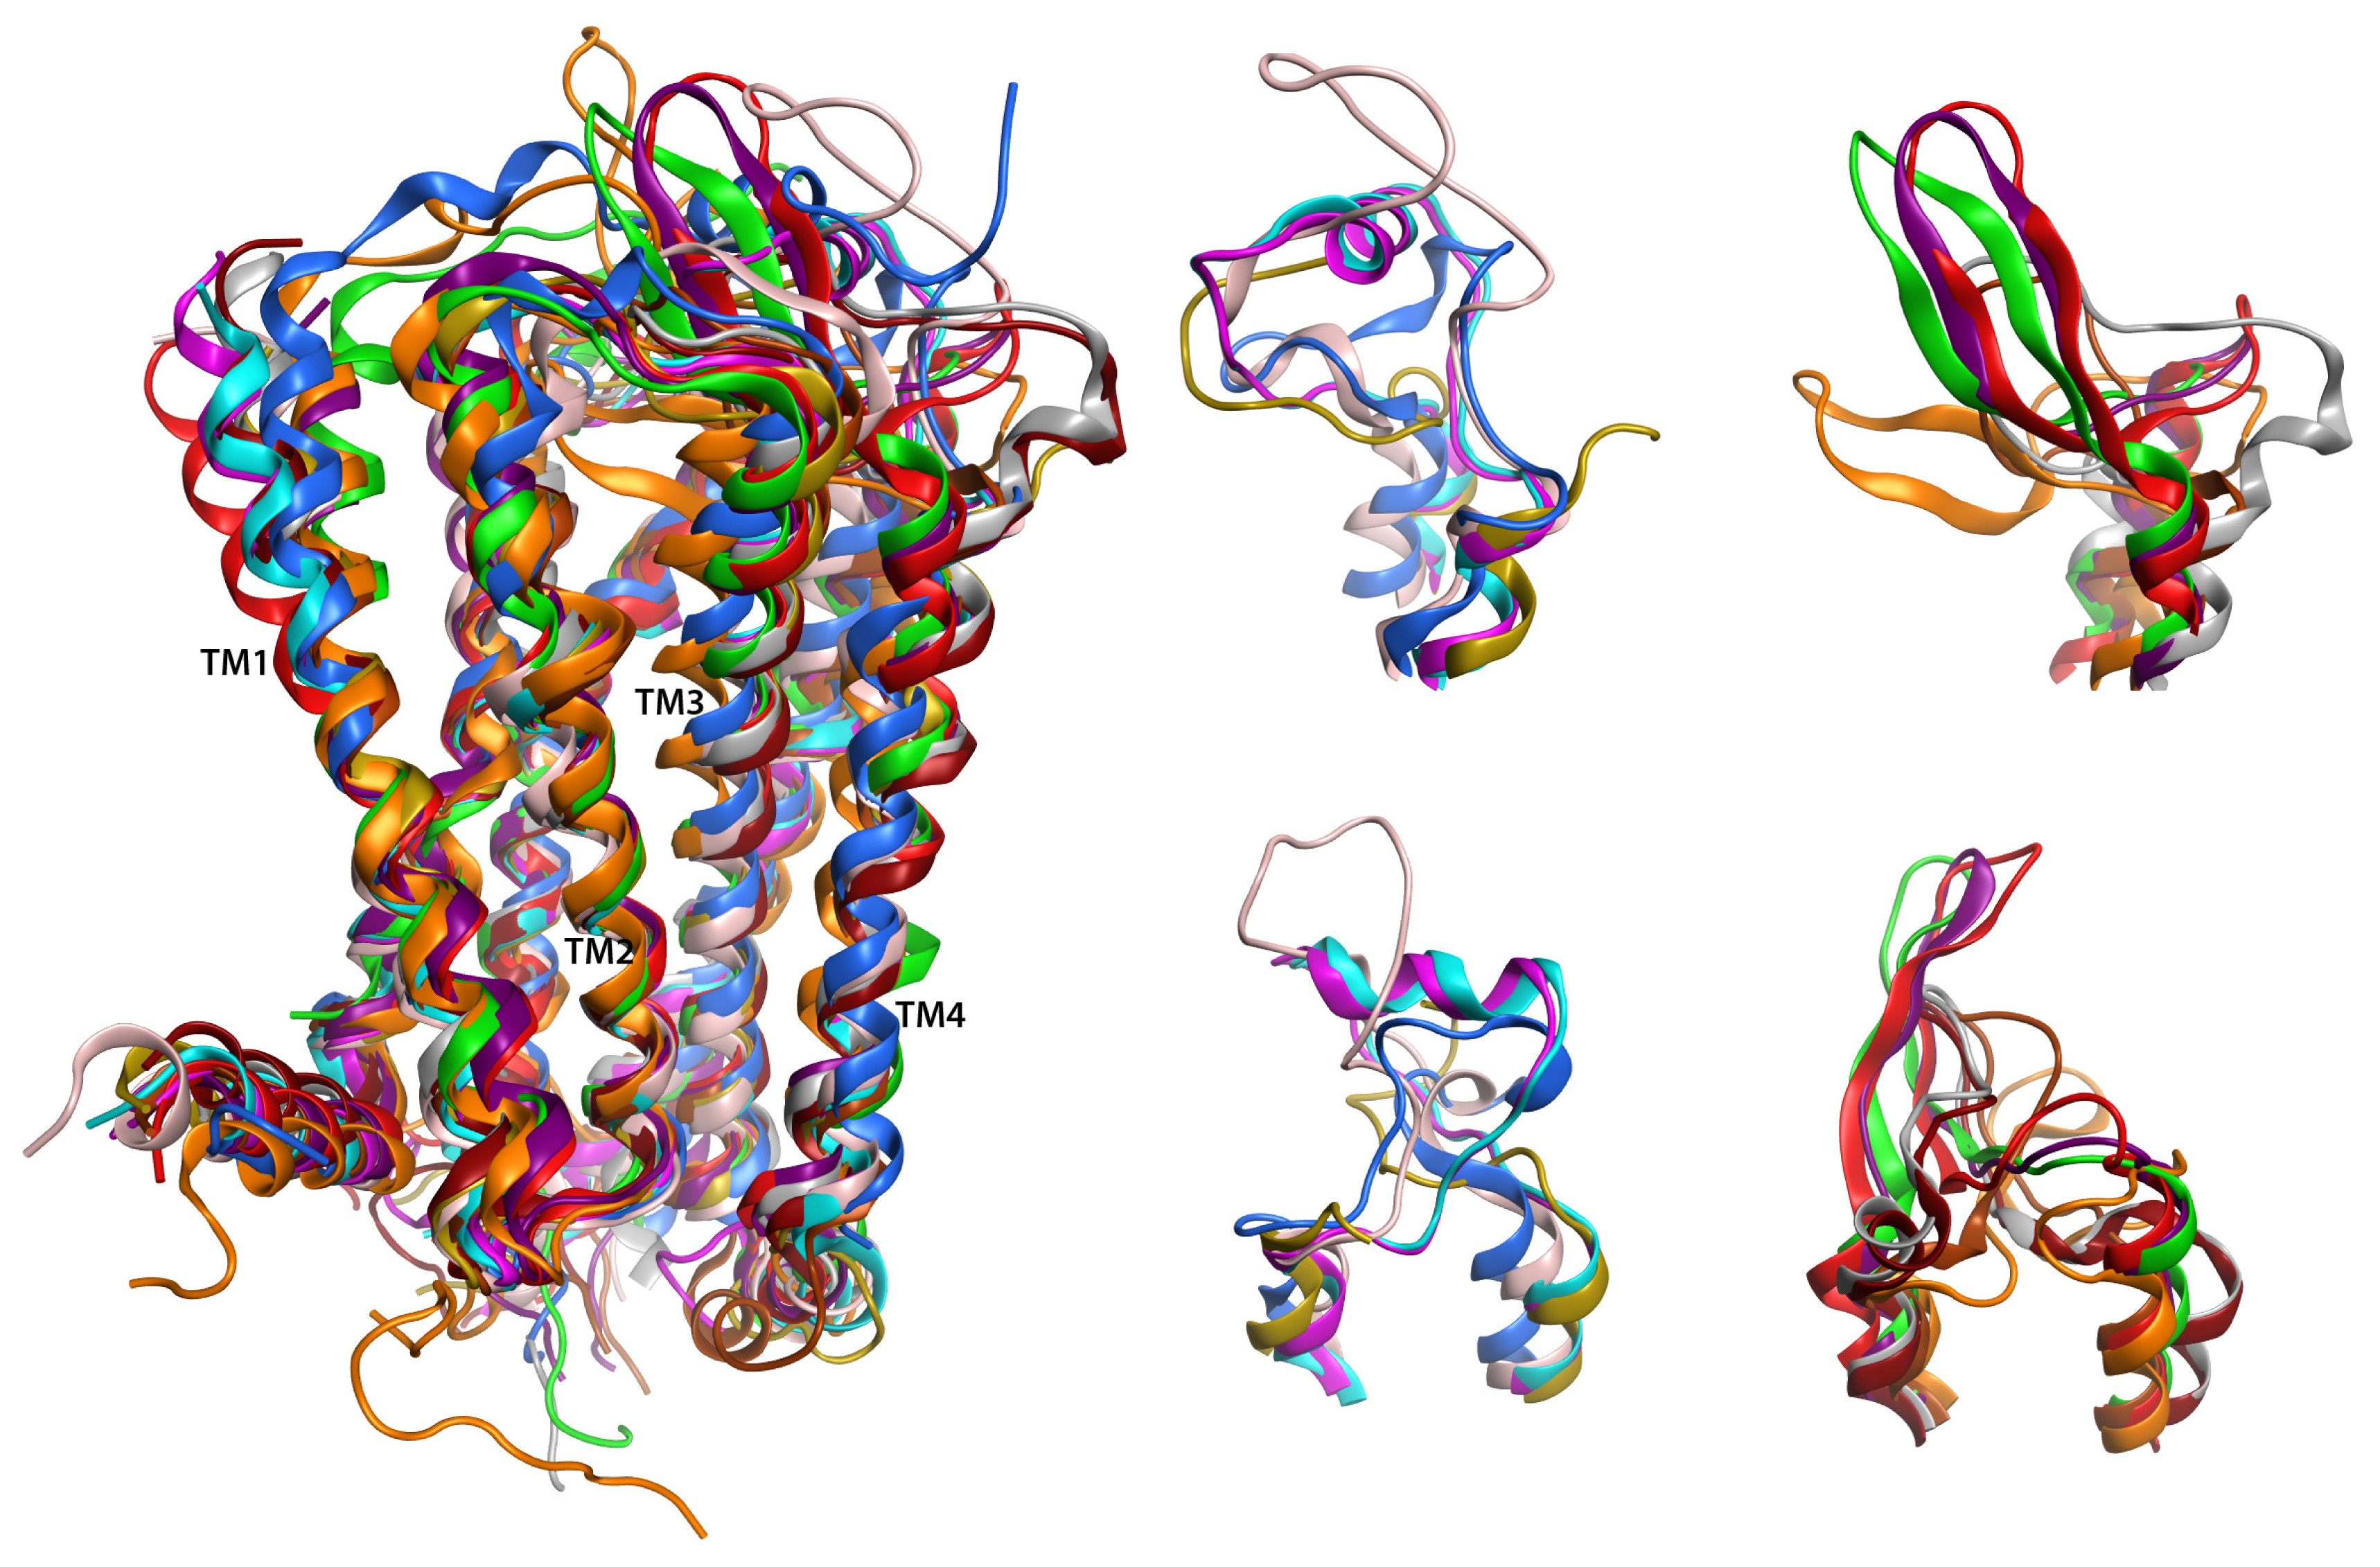
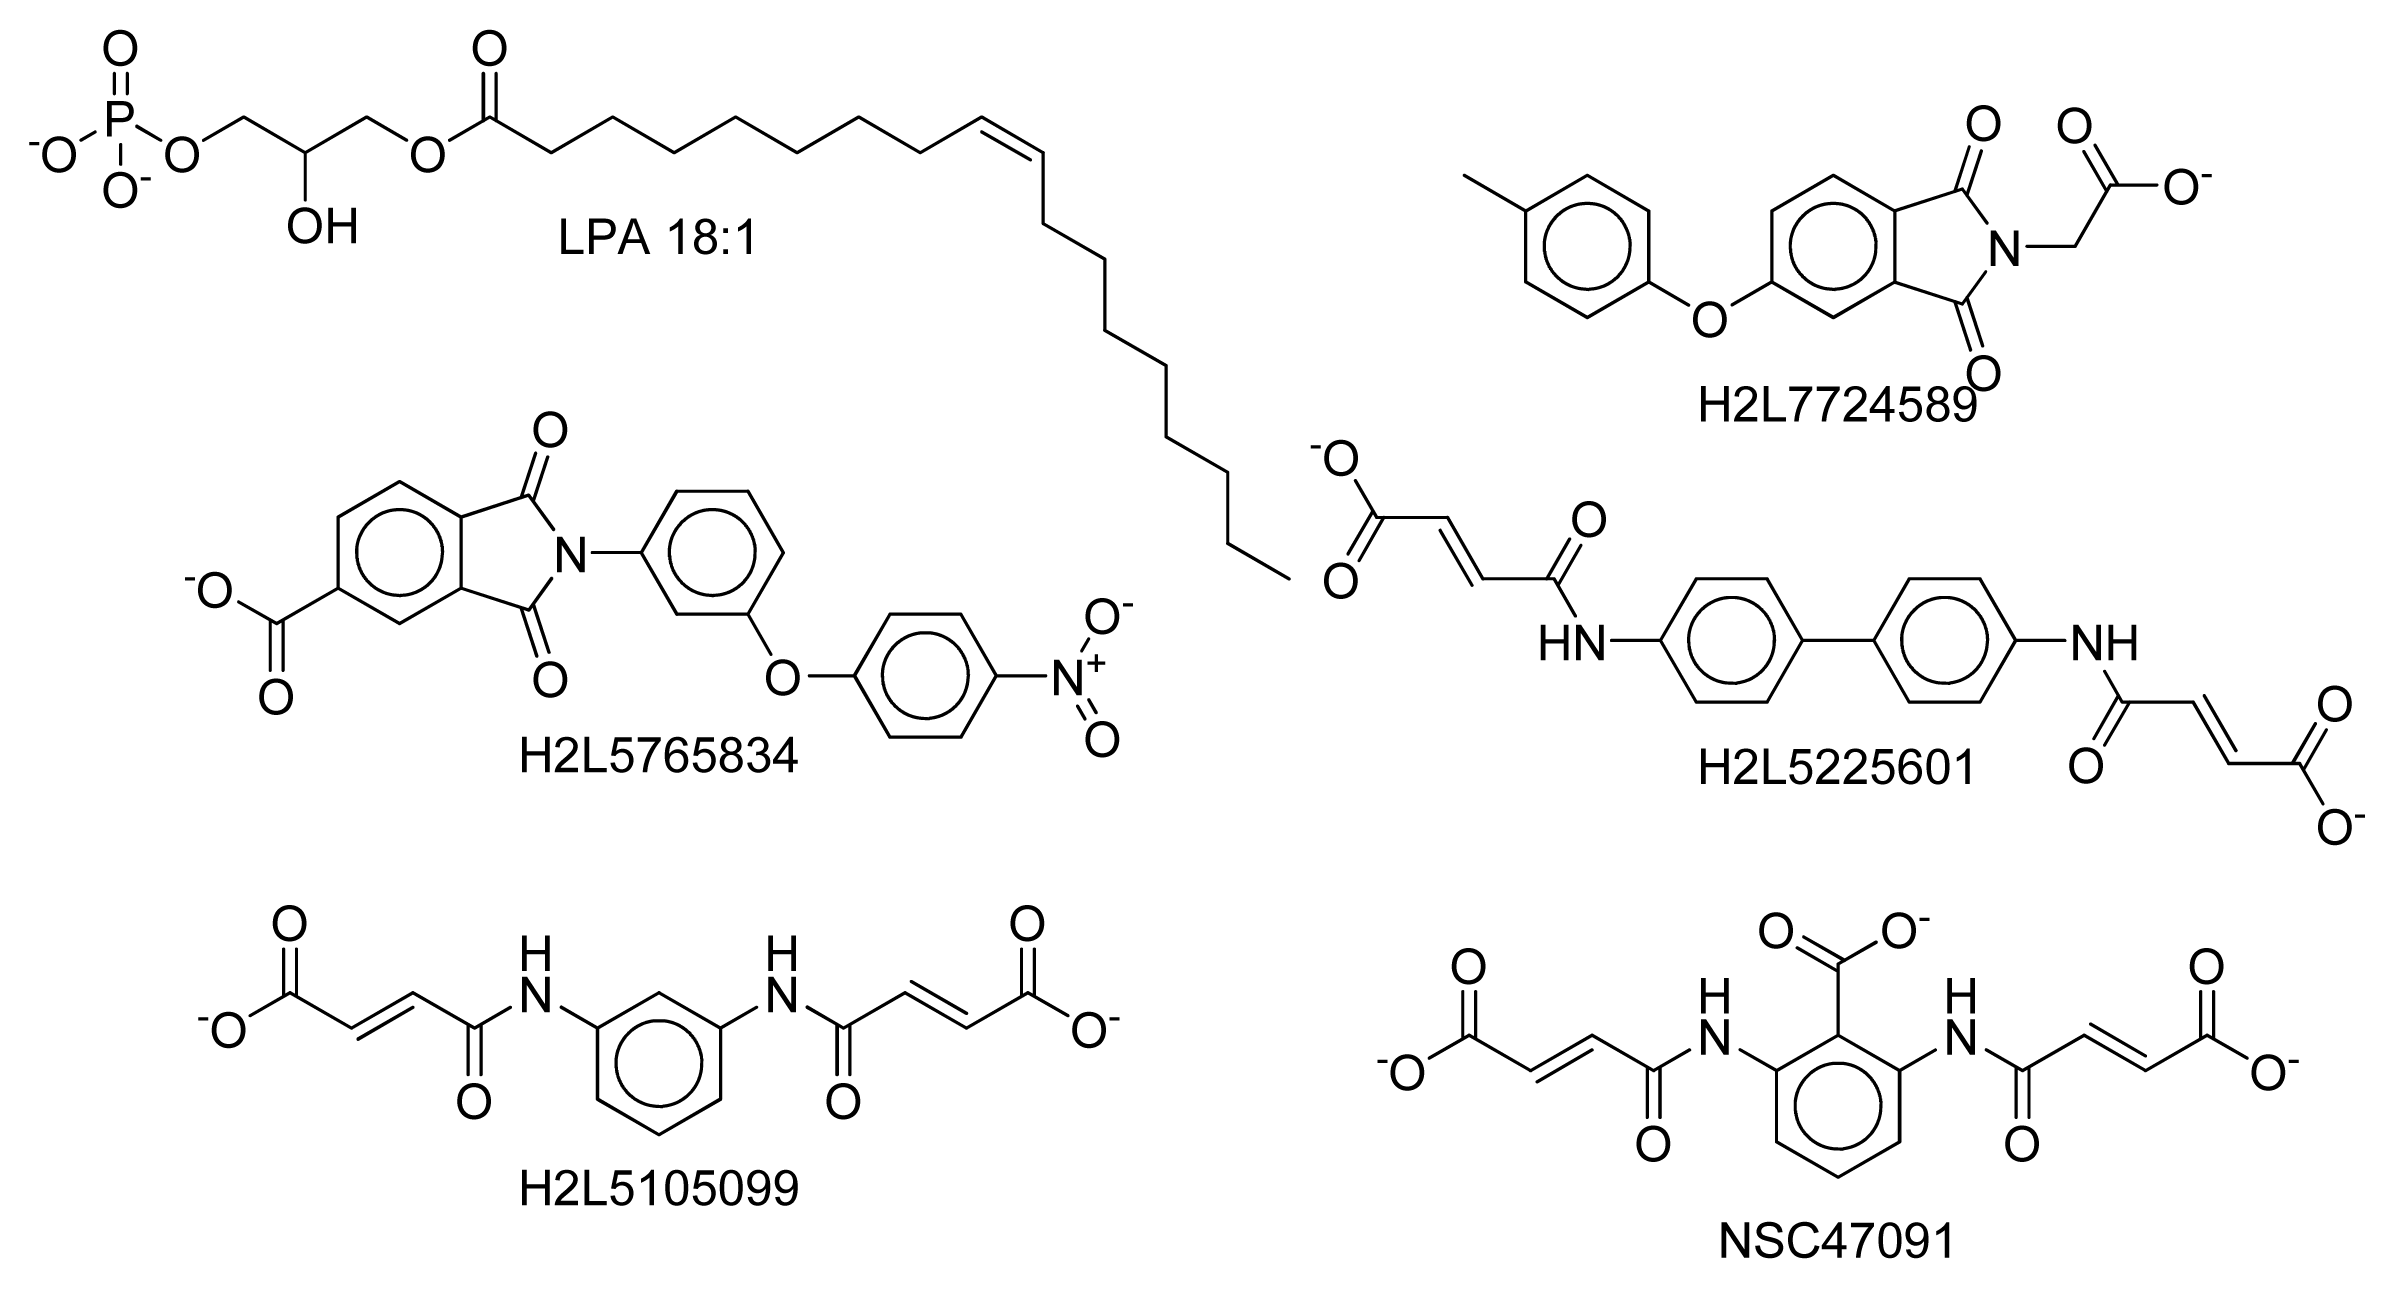
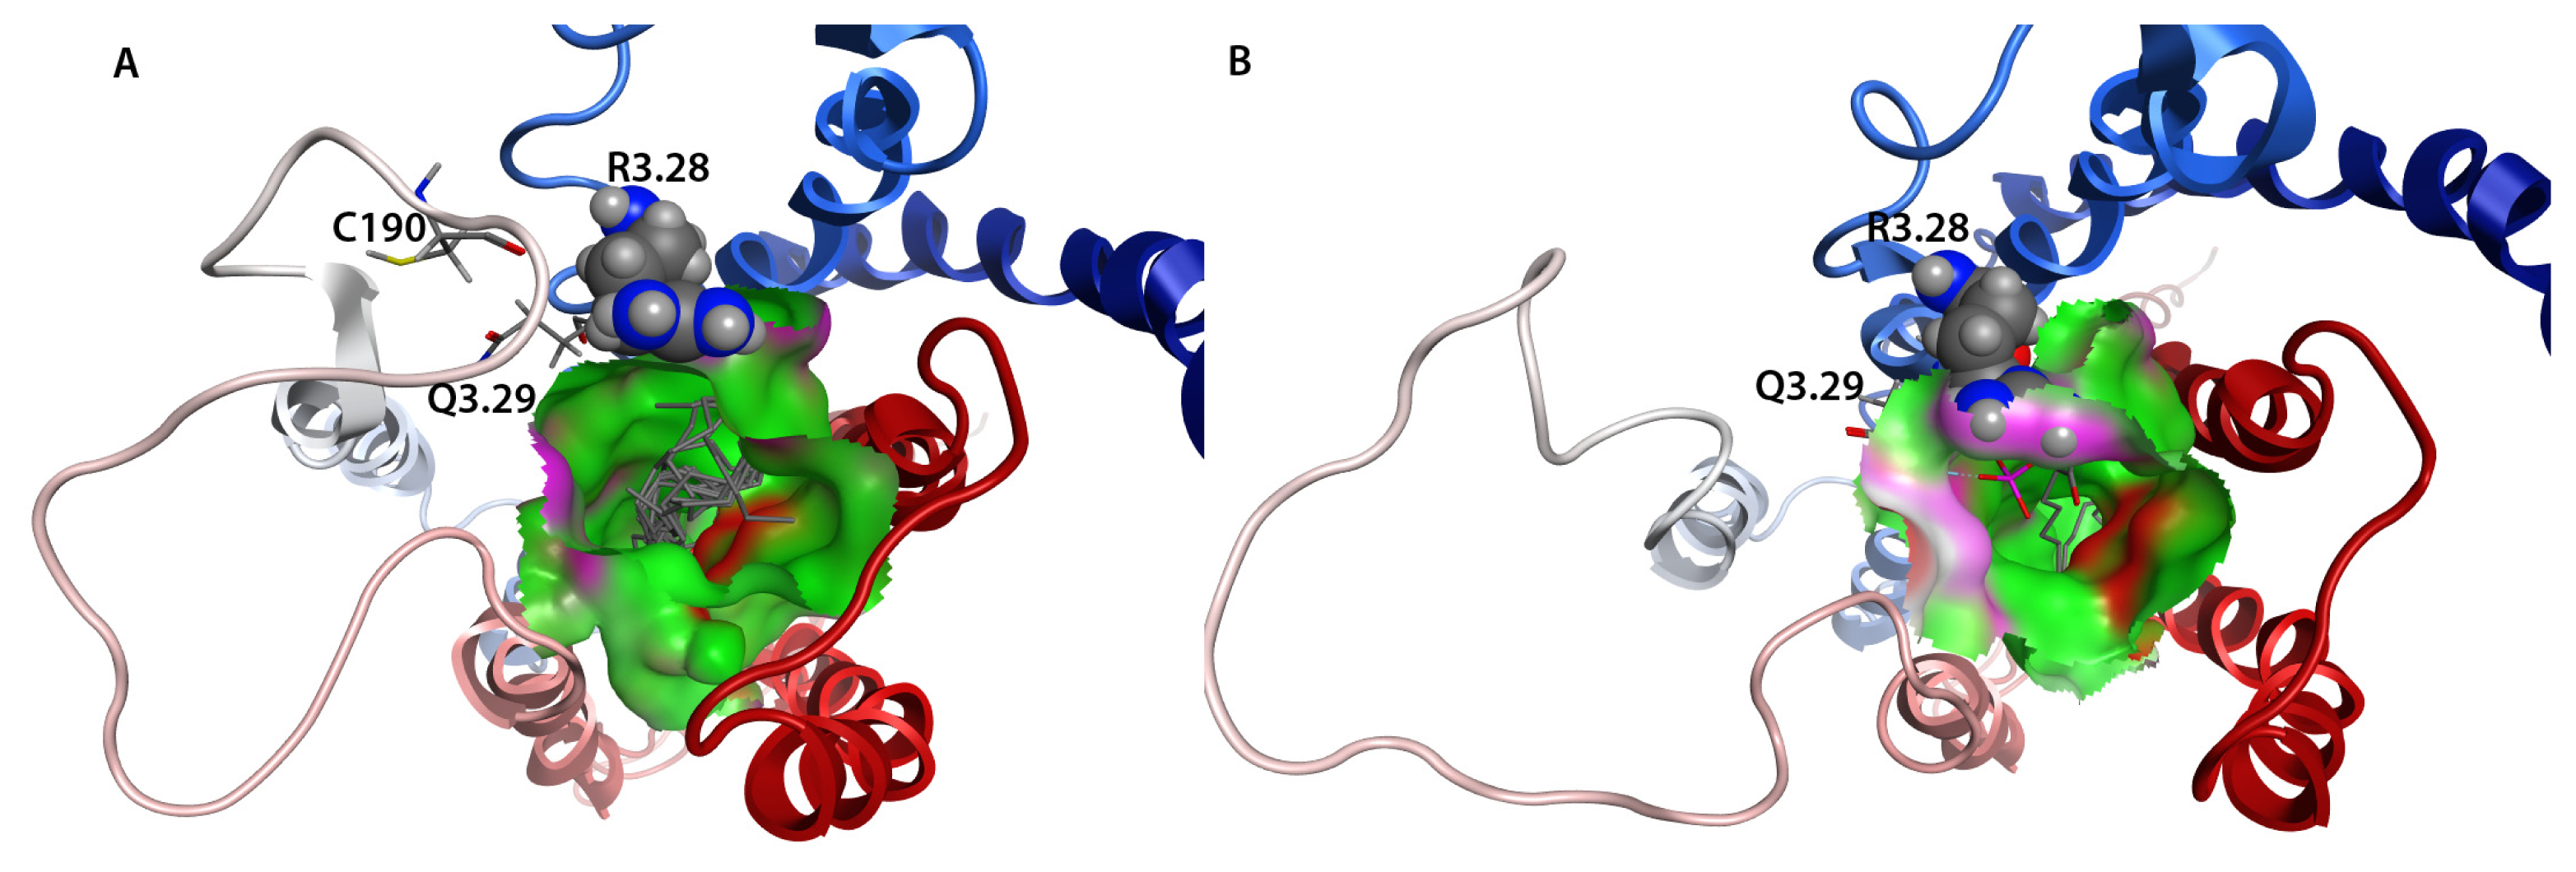
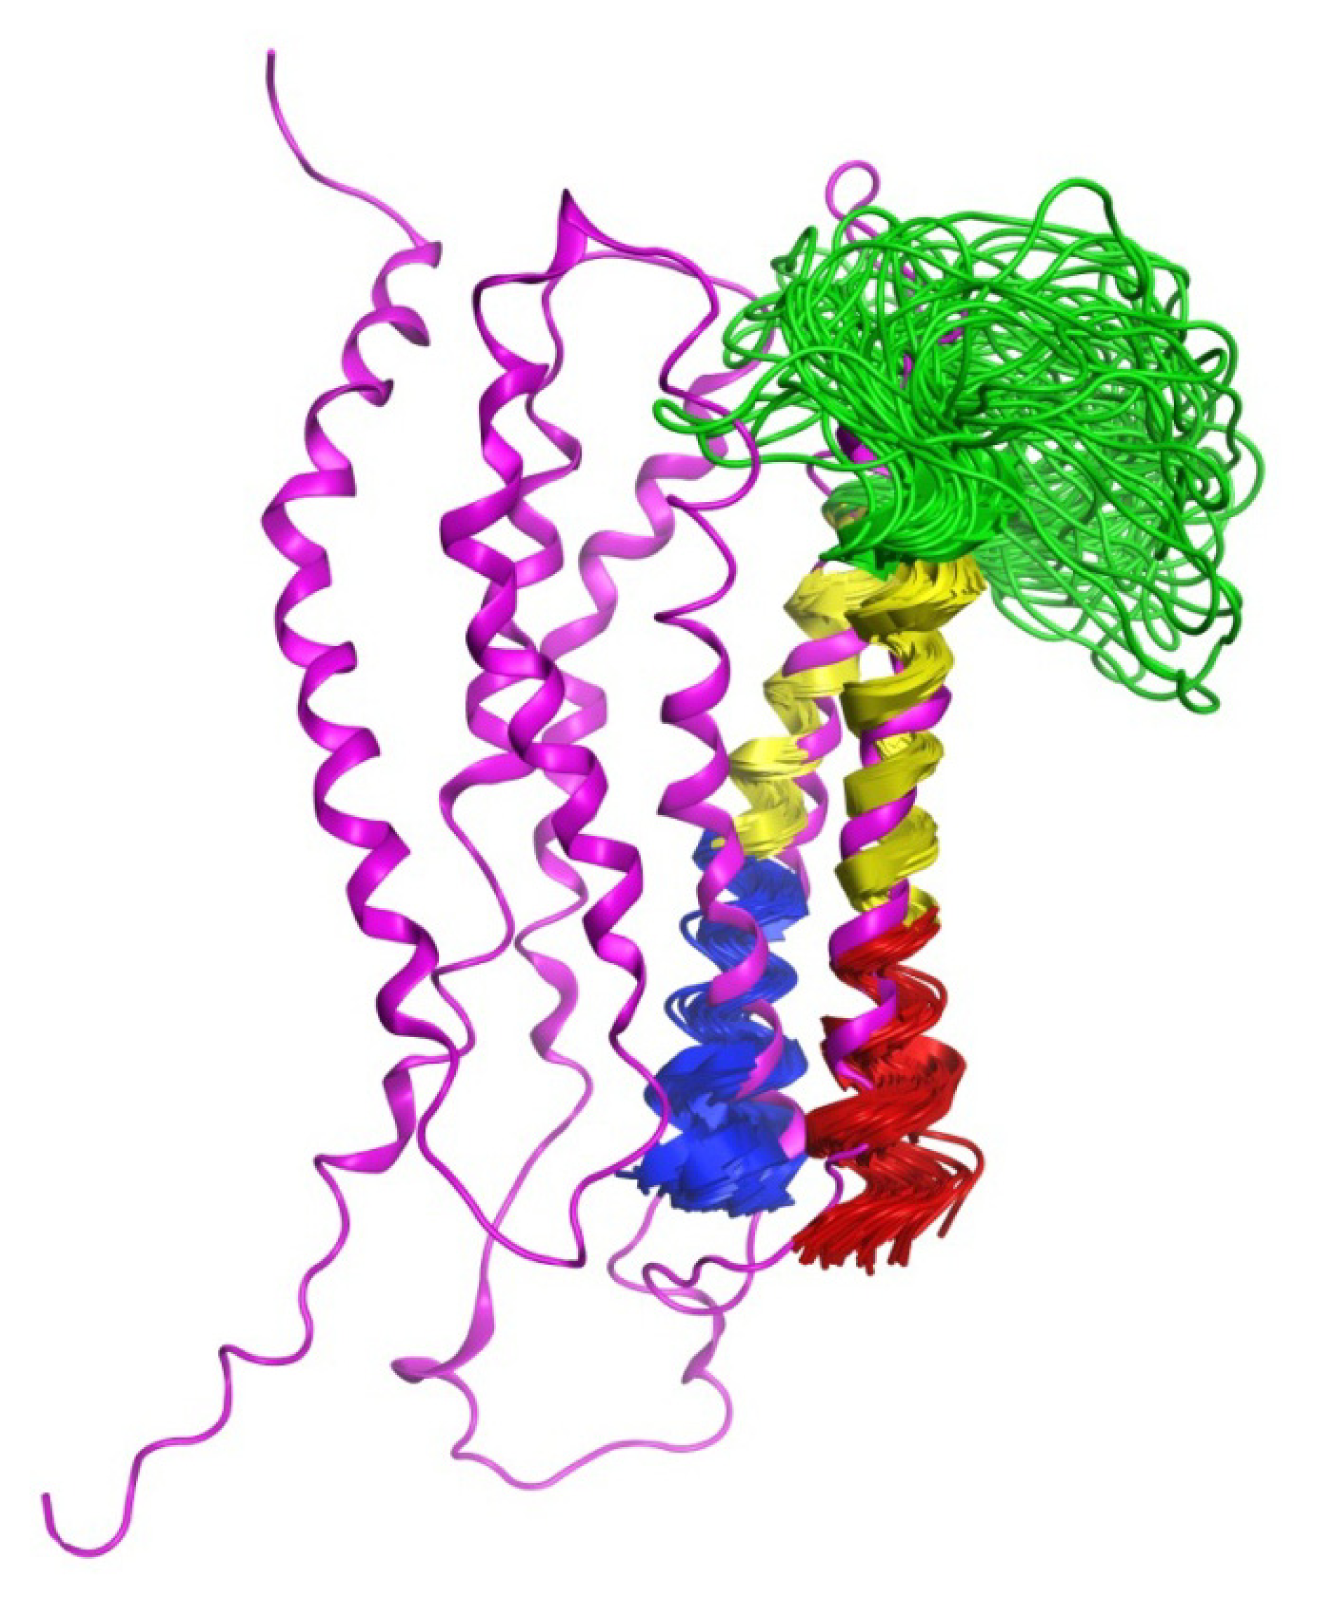
2.7. Hybrid LPA1 Receptor Models
2.8. Docking Results
2.9. Full-length Sequence Context
3. Experimental Section
3.1. Sample Preparation
3.2. Circular Dichroism (CD) Data
3.3. NMR Data
3.4. Structure Calculations
3.5. Hybrid Receptor Model Development
3.6. Docking
4. Conclusions
Acknowledgments
Conflict of Interest
References
- Lundstrom, K. Latest development in drug discovery on G protein-coupled receptors. Curr. Protein Pept. Sci 2006, 7, 465–470. [Google Scholar]
- Esbenshade, T.A. G protein-coupled receptors as targets for drug discovery. Drug Discov. Series 2006, 4, 15–36. [Google Scholar]
- Herr, D.R.; Chun, J. Effects of LPA and S1P on the nervous system and implications for their involvement in disease. Curr. Drug Targets 2007, 8, 155–167. [Google Scholar]
- Murph, M.; Mills, G.B. Targeting the lipids LPA and S1P and their signalling pathways to inhibit tumour progression. Expert Rev. Mol. Med 2007, 9, 1–18. [Google Scholar]
- Pua, T.L.; Wang, F.Q.; Fishman, D.A. Roles of LPA in ovarian cancer development and progression. Future Oncol 2009, 5, 1659–1673. [Google Scholar]
- Shida, D.; Kitayama, J.; Yamaguchi, H.; Okaji, Y.; Tsuno, N.H.; Watanabe, T.; Takuwa, Y.; Nagawa, H. Lysophosphatidic acid (LPA) enhances the metastatic potential of human colon carcinoma DLD1 cells through LPA1. Cancer Res 2003, 63, 1706–1711. [Google Scholar]
- Hama, K.; Aoki, J.; Fukaya, M.; Kishi, Y.; Sakai, T.; Suzuki, R.; Ohta, H.; Yamori, T.; Watanabe, M.; Chun, J.; et al. Lysophosphatidic acid and autotaxin stimulate cell motility of neoplastic and non-neoplastic cells through LPA1. J. Biol. Chem 2004, 279, 17634–17639. [Google Scholar]
- Kishi, Y.; Okudaira, S.; Tanaka, M.; Hama, K.; Shida, D.; Kitayama, J.; Yamori, T.; Aoki, J.; Fujimaki, T.; Arai, H. Autotaxin is overexpressed in glioblastoma multiforme and contributes to cell motility of glioblastoma by converting lysophosphatidylcholine to lysophosphatidic acid. J. Biol. Chem 2006, 281, 17492–17500. [Google Scholar]
- Wang, D.; Lorincz, Z.; Bautista, D.L.; Liliom, K.; Tigyi, G.; Parrill, A.L. A Single Amino Acid Determines Ligand Specificity of the S1P1 (EDG1) and LPA1 (EDG2) Phospholipid Growth Factor Receptors. J. Biol. Chem 2001, 276, 49213–49220. [Google Scholar]
- Sardar, V.M.; Bautista, D.L.; Fischer, D.J.; Yokoyama, K.; Nusser, N.; Virag, T.; Wang, D.; Baker, D.L.; Tigyi, G.; Parrill, A.L. Molecular Basis for Lysophosphatidic Acid Receptor Antagonist Selectivity. Biochim. Biophys. Acta 2002, 1582, 309–317. [Google Scholar]
- Virag, T.; Elrod, D.B.; Liliom, K.; Sardar, V.M.; Parrill, A.L.; Yokoyama, K.; Durgam, G.; Deng, W.; Miller, D.D.; Tigyi, G. Fatty Alcohol Phosphates are Subtype-Selective Agonists and Antagonists of LPA Receptors. Mol. Pharmacol 2003, 63, 1032–1042. [Google Scholar]
- Valentine, W.J.; Fells, J.I.; Perygin, D.H.; Mujahid, S.; Yokoyama, K.; Fujiwara, Y.; Tsukahara, R.; van Brocklyn, J.R.; Parrill, A.L.; Tigyi, G. Subtype-specific residues involved in ligand activation of the endothelial differentiation gene family lysophosphatidic acid receptors. J. Biol. Chem 2008, 283, 12175–12187. [Google Scholar]
- Zhang, H.; Xu, X.; Gajewiak, J.; Tsukahara, R.; Fujiwara, Y.; Liu, J.; Fells, J.I.; Perygin, D.; Parrill, A.L.; Tigyi, G.; et al. Dual activity lysophosphatidic acid receptor pan-antagonist/autotaxin inhibitor reduces breast cancer cell migration in vitro and causes tumor regression in vivo. Cancer Res 2009, 69, 5441–5449. [Google Scholar]
- Shimamura, T.; Shiroishi, M.; Weyand, S.; Tsujimoto, H.; Winter, G.; Katritch, V.; Abagyan, R.; Cherezov, V.; Liu, W.; Han, G.W.; et al. Structure of the human histamine H1 receptor complex with doxepin. Nature 2011, 475, 65–70. [Google Scholar] [Green Version]
- Chien, E.Y.; Liu, W.; Zhao, Q.; Katritch, V.; Han, G.W.; Hanson, M.A.; Shi, L.; Newman, A.H.; Javitch, J.A.; Cherezov, V.; et al. Structure of the human dopamine D3 receptor in complex with a D2/D3 selective antagonist. Science 2010, 330, 1091–1095. [Google Scholar]
- Wu, B.; Chien, E.Y.; Mol, C.D.; Fenalti, G.; Liu, W.; Katritch, V.; Abagyan, R.; Brooun, A.; Wells, P.; Bi, F.C.; et al. Structures of the CXCR4 chemokine GPCR with small-molecule and cyclic peptide antagonists. Science 2010, 330, 1066–1071. [Google Scholar]
- Jaakola, V.P.; Griffith, M.T.; Hanson, M.A.; Cherezov, V.; Chien, E.Y.; Lane, J.R.; Ijzerman, A.P.; Stevens, R.C. The 2.6 angstrom crystal structure of a human A2A adenosine receptor bound to an antagonist. Science 2008, 322, 1211–1217. [Google Scholar]
- Warne, T.; Serrano-Vega, M.J.; Baker, J.G.; Moukhametzianov, R.; Edwards, P.C.; Henderson, R.; Leslie, A.G.; Tate, C.G.; Schertler, G.F. Structure of a beta1-adrenergic G-protein-coupled receptor. Nature 2008, 454, 486–491. [Google Scholar]
- Cherezov, V.; Rosenbaum, D.M.; Hanson, M.A.; Rasmussen, S.G.; Thian, F.S.; Kobilka, T.S.; Choi, H.J.; Kuhn, P.; Weis, W.I.; Kobilka, B.K.; et al. High-resolution crystal structure of an engineered human beta2-adrenergic G protein-coupled receptor. Science 2007, 318, 1258–1265. [Google Scholar]
- Rasmussen, S.G.; Choi, H.J.; Rosenbaum, D.M.; Kobilka, T.S.; Thian, F.S.; Edwards, P.C.; Burghammer, M.; Ratnala, V.R.; Sanishvili, R.; Fischetti, R.F.; et al. Crystal structure of the human beta2 adrenergic G-protein-coupled receptor. Nature 2007, 450, 383–387. [Google Scholar]
- Palczewski, K.; Kumasaka, T.; Hori, T.; Behnke, C.A.; Motoshima, H.; Fox, B.A.; Le Trong, I.; Teller, D.C.; Okada, T.; Stenkamp, R.; et al. Crystal Structure of Rhodopsin: A G Protein-Coupled Receptor. Science 2000, 289, 739–745. [Google Scholar]
- Haga, K.; Kruse, A.C.; Asada, H.; Yurugi-Kobayashi, T.; Shiroishi, M.; Zhang, C.; Weis, W.I.; Okada, T.; Kobilka, B.K.; Haga, T.; et al. Structure of the human M2 muscarinic acetylcholine receptor bound to an antagonist. Nature 2012, 482, 547–551. [Google Scholar]
- Wu, H.; Wacker, D.; Mileni, M.; Katritch, V.; Han, G.W.; Vardy, E.; Liu, W.; Thompson, A.A.; Huang, X.P.; Carroll, F.I.; et al. Structure of the human kappa-opioid receptor in complex with JDTic. Nature 2012, 485, 327–332. [Google Scholar]
- Manglik, A.; Kruse, A.C.; Kobilka, T.S.; Thian, F.S.; Mathiesen, J.M.; Sunahara, R.K.; Pardo, L.; Weis, W.I.; Kobilka, B.K.; Granier, S. Crystal structure of the micro-opioid receptor bound to a morphinan antagonist. Nature 2012, 485, 321–326. [Google Scholar]
- Hanson, M.A.; Roth, C.B.; Jo, E.; Griffith, M.T.; Scott, F.L.; Reinhart, G.; Desale, H.; Clemons, B.; Cahalan, S.M.; Schuerer, S.C.; et al. Crystal structure of a lipid G protein-coupled receptor. Science 2012, 335, 851–855. [Google Scholar]
- Granier, S.; Manglik, A.; Kruse, A.C.; Kobilka, T.S.; Thian, F.S.; Weis, W.I.; Kobilka, B.K. Structure of the delta-opioid receptor bound to naltrindole. Nature 2012, 485, 400–404. [Google Scholar]
- Thompson, A.A.; Liu, W.; Chun, E.; Katritch, V.; Wu, H.; Vardy, E.; Huang, X.P.; Trapella, C.; Guerrini, R.; Calo, G.; et al. Structure of the nociceptin/orphanin FQ receptor in complex with a peptide mimetic. Nature 2012, 485, 395–399. [Google Scholar]
- Park, S.H.; Casagrande, F.; Chu, M.; Maier, K.; Kiefer, H.; Opella, S.J. Optimization of purification and refolding of the human chemokine receptor CXCR1 improves the stability of proteoliposomes for structure determination. Biochim. Biophys. Acta 2012, 1818, 584–591. [Google Scholar]
- Park, S.H.; Das, B.B.; Casagrande, F.; Tian, Y.; Nothnagel, H.J.; Chu, M.; Kiefer, H.; Maier, K.; de Angelis, A.A.; Marassi, F.M.; et al. Structure of the chemokine receptor CXCR1 in phospholipid bilayers. Nature 2012, 491, 779–783. [Google Scholar]
- Parrill, A.L.; Bautista, D.L. GPCR Conformations: Implications for Rational Drug Design. Pharmaceuticals 2011, 4, 7–43. [Google Scholar]
- Pham, T.T.; Kriwacki, R.W.; Parrill, A.L. Peptide Design and Structural Characterization of a GPCR Loop Mimetic. Biopolymers 2007, 86, 298–310. [Google Scholar]
- Oakley, M.G.; Kim, P.S. A buried polar interaction can direct the relative orientation of helices in a coiled coil. Biochemistry 1998, 37, 12603–12610. [Google Scholar]
- Kruse, A.C.; Hu, J.; Pan, A.C.; Arlow, D.H.; Rosenbaum, D.M.; Rosemond, E.; Green, H.F.; Liu, T.; Chae, P.S.; Dror, R.O.; et al. Structure and dynamics of the M3 muscarinic acetylcholine receptor. Nature 2012, 482, 552–556. [Google Scholar]
- Janes, R.W. Reference Datasets for Circular Dichroism and Synchrotron Radiation Circular Dichroism Spectroscopy of Proteins. In Advances in Biomedical Spectrscopy; Wallace, B. A., Janes, R.W., Eds.; IOS Press: Fairfax, VA, USA, 2008; Volume 1. [Google Scholar]
- Lobley, A.; Whitmore, L.; Wallace, B.A. DICHROWEB: An interactive website for the analysis of protein secondary structure from circular dichroism spectra. Bioinformatics 2002, 18, 211–212. [Google Scholar]
- Whitmore, L.; Wallace, B.A. DICHROWEB, an online server for protein secondary structure analyses from circular dichroism spectroscopic data. Nucleic Acids Res 2004, 32, W668–W673. [Google Scholar]
- Whitmore, L.; Wallace, B.A. Protein Secondary Structure Analyses from Circular Dichroism Spectroscopy: Methods and Reference Databases. Biopolymers 2008, 89, 392–400. [Google Scholar]
- Parrill, A.L.; Tigyi, G. Integrating the puzzle pieces: The current atomistic picture of phospholipid-G protein coupled receptor interactions. Biochim. Biophys. Acta 2013, 1831. [Google Scholar] [CrossRef]
- Luthra, A.; Malik, S.S.; Ramachandran, R. Cloning, purification and comparative structural analysis of two hypothetical proteins from Mycobacterium tuberculosis found in the human granuloma during persistence and highly up-regulated under carbon-starvation conditions. Protein Expr. Purif 2008, 62, 64–74. [Google Scholar]
- Delaglio, F.; Grzesiek, S.; Vuister, G.W.; Zhu, G.; Pfeifer, J.; Bax, A. NMRPipe: A multidimensional spectral processing system based on UNIX pipes. J. Biomol. NMR 1995, 6, 277–293. [Google Scholar]
- Garrett, D.S.; Powers, R.; Gronenborn, A.M.; Clore, G.M. A Common-Sense Approach to Peak Picking in 2-Dimensional, 3-Dimensional, and 4-Dimensional Spectra Using Automatic Computer-Analysis of Contour Diagrams. J. Magn. Resonance 1991, 95, 214–220. [Google Scholar]
- Cornilescu, G.; Delaglio, F.; Bax, A. Protein backbone angle restraints from searching a database for chemical shift and sequence homology. J. Biomol. NMR 1999, 13, 289–302. [Google Scholar]
- Brunger, A.T.; Adams, P.D.; Clore, G.M.; DeLano, W.L.; Gros, P.; Grosse-Kunstleve, R.W.; Jiang, J.S.; Kuszewski, J.; Nilges, M.; Pannu, N.S.; et al. Crystallography & NMR system: A new software suite for macromolecular structure determination. Acta Crystallogr. D 1998, 54, 905–921. [Google Scholar]
- Fujiwara, Y.; Sardar, V.; Tokumura, A.; Baker, D.; Murakami-Murofushi, K.; Parrill, A.; Tigyi, G. Identification of residues responsible for ligand recognition and regioisomeric selectivity of lysophosphatidic acid receptors expressed in mammalian cells. J. Biol. Chem 2005, 280, 35038–35050. [Google Scholar]
- MOE 2010; Volume 12, Chemical Computing Group: Montreal, Canada, 2010.
- Fells, J.I.; Tsukahara, R.; Fujiwara, Y.; Liu, J.; Perygin, D.H.; Osborne, D.A.; Tigyi, G.; Parrill, A.L. Identification of non-lipid LPA3 antagonists by virtual screening. Bioorg. Med. Chem 2008, 16, 6207–6217. [Google Scholar]
- Fells, J.I.; Tsukahara, R.; Liu, J.; Tigyi, G.; Parrill, A.L. Structure-based drug design identifies novel LPA3 antagonists. Bioorg. Med. Chem 2009, 17, 7457–7464. [Google Scholar]


| Distance Restraints | |
| No. of total restraints | 858 |
| No. of intraresidue (i = j) | 274 |
| No. of interresidue ((i − j) = 1, (i + j) = 1) | 279 |
| No. of medium (1 < (i − j) < 5) | 150 |
| No. of long ((i − j) ≥ 5) | 12 |
| No. of dihedral-angle constraints (Φ and Ψ) | 119 |
| No. of hydrogen bonds | 24 |
| Etotal (kcal/mol) | 3149.26 ± 32.19 |
| RMSDs from experimental restraints (CNS defaults) | |
| Bonds (Å) | 0.0079 ± 0.0002 |
| Angles (°) | 1.141 ± 0.021 |
| Impropers (°) | 1.099 ± 0.032 |
| NOEs | 0.119 ± 0.002 |
| Dihedrals | 0.677 ± 0.139 |
| Coordinate superimpose | |
| Backbone RMSD (Å) (2–79) | 4.01 |
| Backbone RMSD (Å) (3–30) | 0.63 |
| Backbone RMSD (Å) (53–78) | 0.58 |
| Backbone RMSD (Å) (3–30 and 53–78) | 0.95 |
© 2013 by the authors; licensee Molecular Diversity Preservation International, Basel, Switzerland. This article is an open access article distributed under the terms and conditions of the Creative Commons Attribution license (http://creativecommons.org/licenses/by/3.0/).
Share and Cite
Young, J.K.; Clayton, B.T.; Kikonyogo, A.; Pham, T.-C.T.; Parrill, A.L. Structural Characterization of an LPA1 Second Extracellular Loop Mimetic with a Self-Assembling Coiled-Coil Folding Constraint. Int. J. Mol. Sci. 2013, 14, 2788-2807. https://doi.org/10.3390/ijms14022788
Young JK, Clayton BT, Kikonyogo A, Pham T-CT, Parrill AL. Structural Characterization of an LPA1 Second Extracellular Loop Mimetic with a Self-Assembling Coiled-Coil Folding Constraint. International Journal of Molecular Sciences. 2013; 14(2):2788-2807. https://doi.org/10.3390/ijms14022788
Chicago/Turabian StyleYoung, John K., Benjamin T. Clayton, Alexandra Kikonyogo, Truc-Chi T. Pham, and Abby L. Parrill. 2013. "Structural Characterization of an LPA1 Second Extracellular Loop Mimetic with a Self-Assembling Coiled-Coil Folding Constraint" International Journal of Molecular Sciences 14, no. 2: 2788-2807. https://doi.org/10.3390/ijms14022788