2.1. Optimization by Plackett-Burman Design (PBD)
The importance of the eleven components, corn starch, glucose, (NH
4)
2SO
4, peptone, NaCl, CaCO
3, MgSO
4·7H
2O, K
2HPO
4·3H
2O, MnCl
2·4H
2O, FeSO
4·7H
2O and ZnSO
4·7H
2O for NW-G01 production was investigated by PBD. The results showed the effects of these components on the response and significant levels in
Tables 1 and
2.
According to statistical analysis of the data by Design expert software, the results showed that only (NH4)2SO4, peptone and CaCO3 had confidence levels above 95% (p < 0.05) and were considered to influence NW-G01 production significantly. The others had confidence levels below 95% and hence were considered insignificant. In these results, R2 = 0.9285 indicated that 92.85% of the variability in the response could be explained in the model.
PBD results indicated that the effect of (NH4)2SO4, peptone and CaCO3 were negative. Decreasing the three components concentration might result in higher production of antibiotic NW-G01. Thus, the three variables (NH4)2SO4 (x3), peptone (x4) and CaCO3 (x6) were selected and their optimal levels were identified further using response surface methodology.
2.2. Optimization by Response Surface Methodology
RSM using central composite design (CCD) was applied to determine the optimal levels of the three selected variables that affected the production of NW-G01. The respective low and high levels (g/L) with the coded levels for the factors are defined in
Table 3.
The concentrations of the other factors were fixed at zero level as shown in
Table 1. Experimental design and results are shown in
Table 4.
The experimental results were fitted with the second-order polynomial (
Equation (1)):
where Y was the predicted response, x3, x4 and x6 were coded values of (NH4)2SO4, peptone and CaCO3 concentration, respectively.
The statistical significance of
Equation (1) was checked by
F-test, and the ANOVA for response surface quadratic model is summarized in
Table 5. The model
F-value of 222.43 implied the model was significant, the
P-value was also very low (<0.0001) indicating that there was only a 0.01% chance that a “Model
F-Value” this large could occur due to noise. The success of the model could be checked by the determination coefficient
R2, which was calculated to be 0.9850, indicating that 98.50% of the variability in the response could be explained by the model. Normally, a regression model, having an
R2-value higher than 0.9, was considered as a high correlation [
23]. The present
R2-value, therefore, reflected a very good fit between the observed and predicted responses, and it was considered reasonable to use the regression model to analyze trends of the responses. A lower value of coefficient variation (CV = 3.33%) showed the experiments conducted were precise and reliable [
24]. The Lack of fit
P-value of 0.1095 implied the “Lack of Fit” is not significant relative to the pure error and no-significant lack of fit indicated the model is good.
The significance of the regression coefficients was tested by a
t-test. The regression coeffiecients and corresponding
p-values for the model presented in
Table 6. Values of “Prob >
F” less than 0.05 indicate that model terms are significant while values greater than 0.1 indicate that the model terms are not significant [
25]. Therefore, among the model terms in the present study, (NH
4)
2SO
4 (
x3) and CaCO
3 (
x6) were very significant with probability of over 99% while peptone (
x4) was not significant with a probability of over 84%. In
Table 6, the results also indicated that the mutual interaction between
x3 and
x3,
x4 and
x4,
x6 and
x6,
x3 and
x4,
x3 and
x6,
x4 and
x6, had a very significant influence on antibiotics NW-G01 production.
The final results showed that among the independent factors, x3((NH4)2SO4) and x6(CaCO3) had significant effects on antibiotic NW-G01 production and the negative coefficient of them showed a linear effect to decrease antibiotics NW-G01 production. The quadratic term of the three factors and the interaction between x3((NH4)2SO4), x4(peptone) and x6(CaCO3) also had a significant effect.
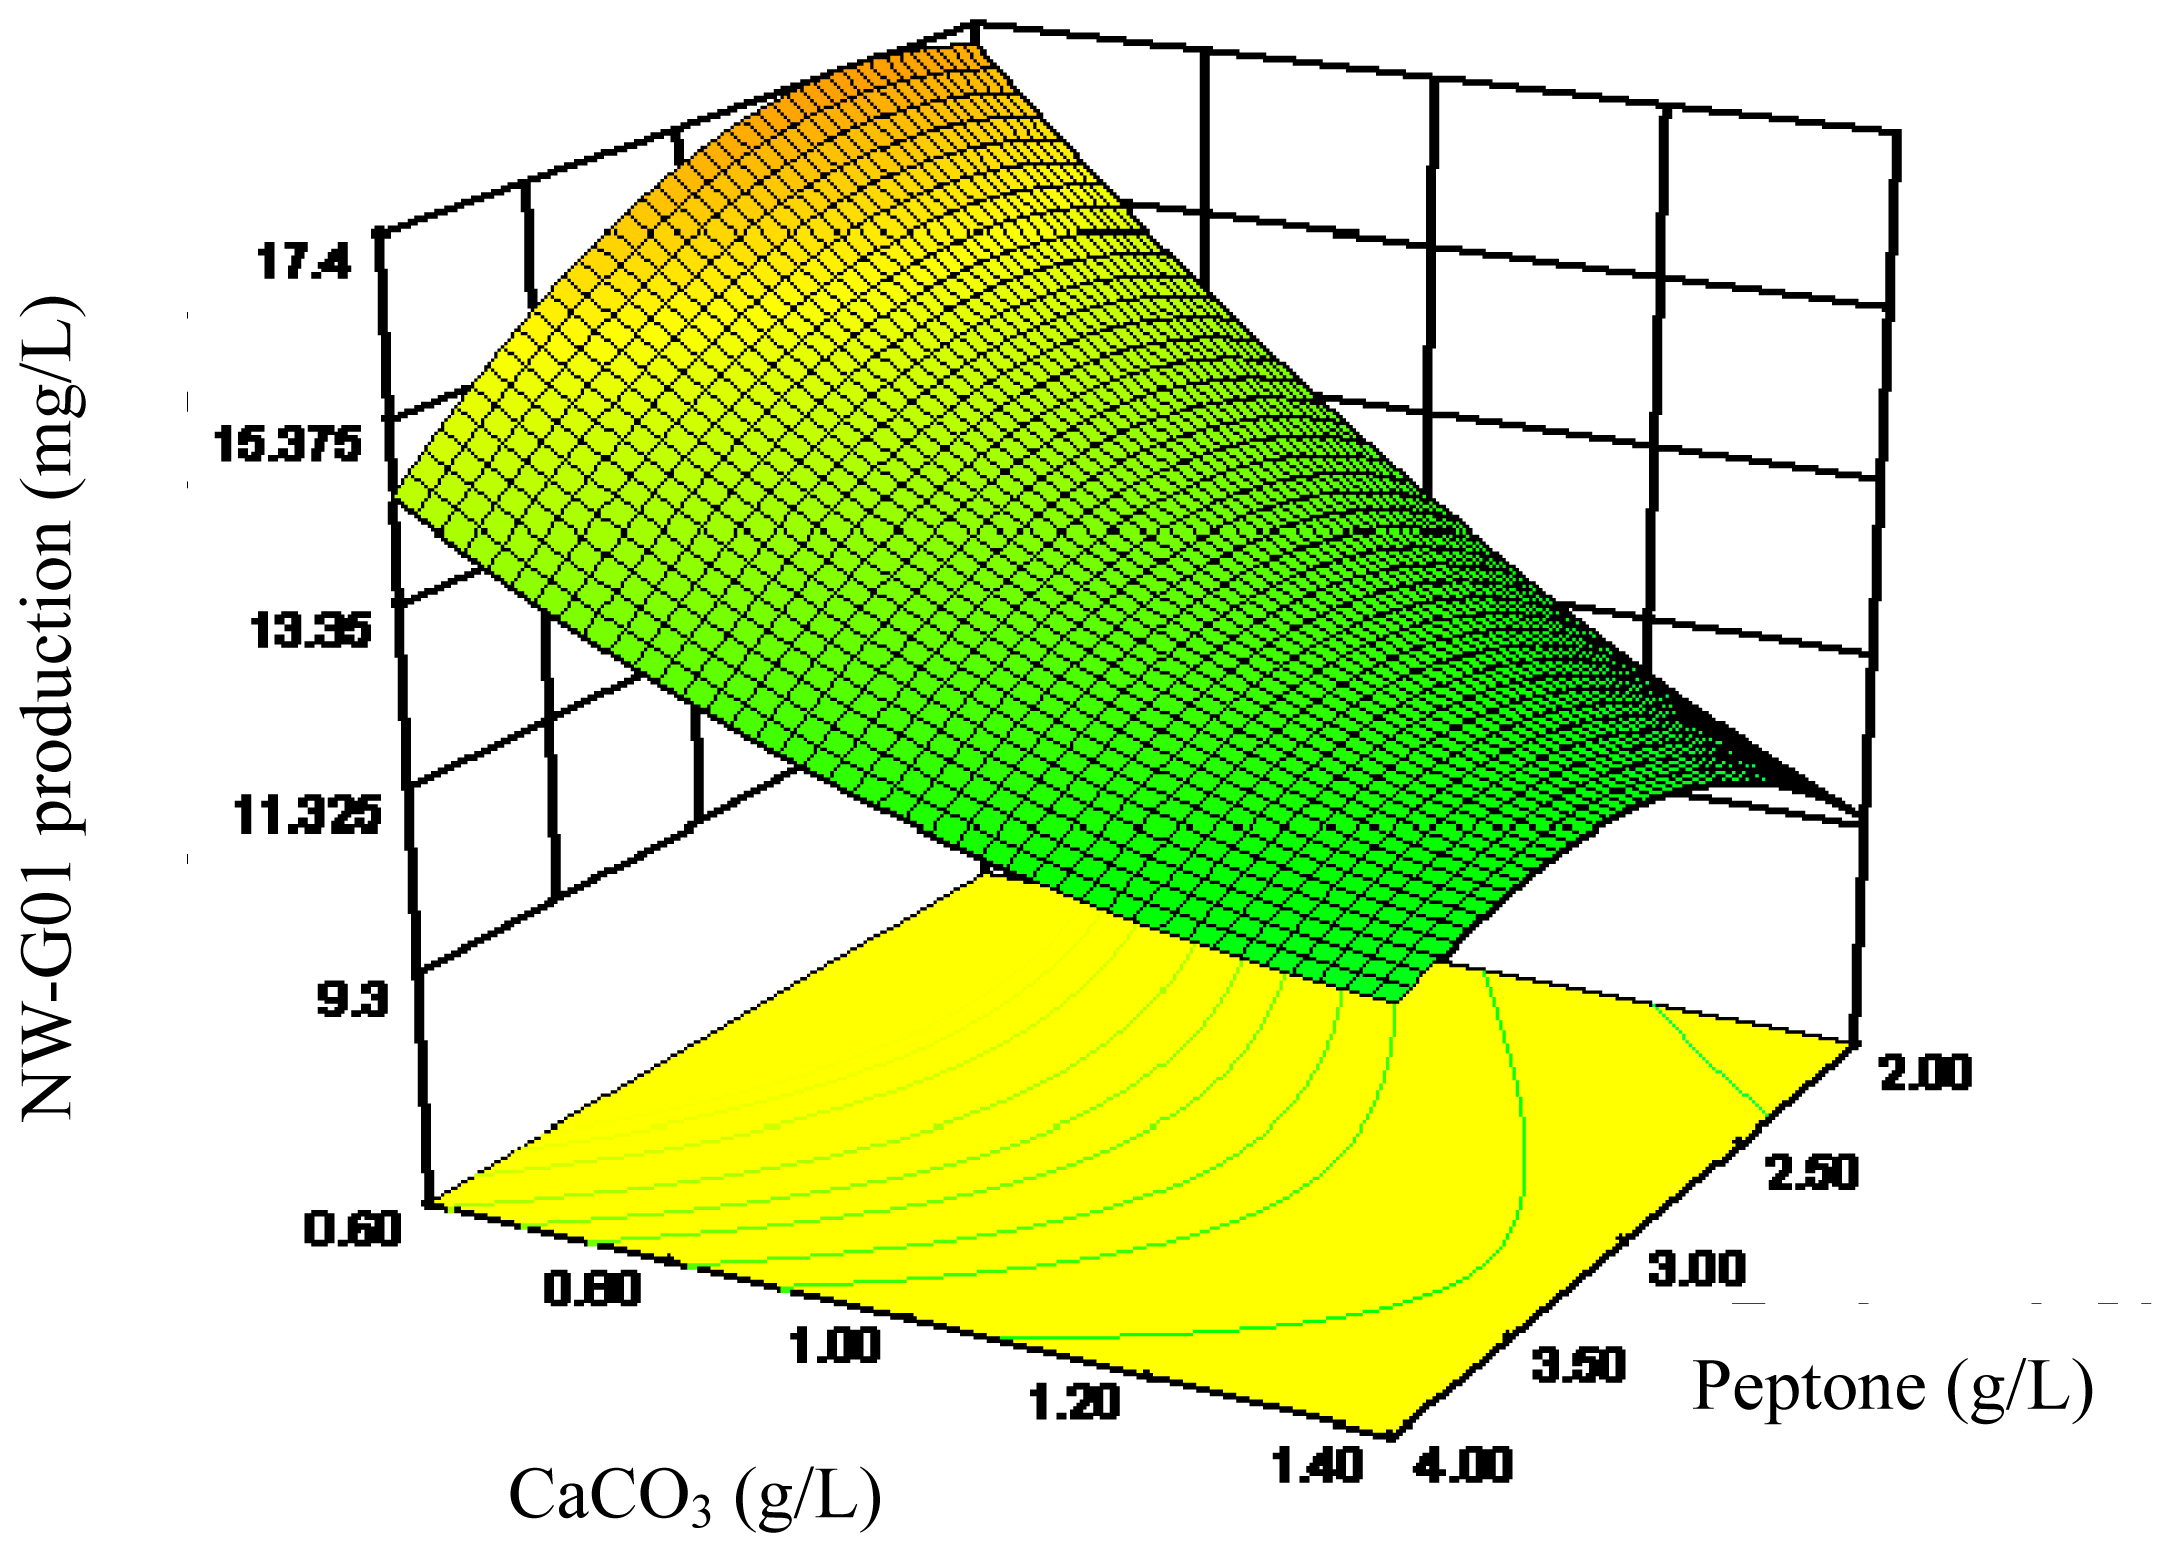
The 3D response surface curves were then plotted to explain the interactions of medium components and the optimum concentration of each component required for the NW-G01 production (
Figures 2–
4). Each figure presents the effect of two factors while the other factor was held at zero level. These 3D plots and their respective contour plots provided a visual interpretation of the interaction between two factors and facilitate the location of optimum experimental conditions.
2.3. Validation of the Optimized Condition
On the basis of medium optimization, the quadratic model predicted that the maximum production of NW-G01 was 15.387 mg/L, when the model predicted the optimal values of test factors in the coded units were x3 = −1.68, x4 = 0.80 and x6 = 0.74, which were 0.06 g/L (NH4)2SO4, 3.80 g/L peptone and 1.30 g/L CaCO3, respectively. To verify the predicted results, validation experiments in shake flasks were performed in triplicate testes. Under the optimized medium, the observed experimental value of average NW-G01 concentration was 15.564 mg/L, suggesting that experimental and predicted values (15.387 mg/L) of NW-G01 yield were in good agreement. The concentration was 5.707 mg/L in non-optimized medium, 2.73-fold increase had been obtained, while the growth of the strain in the two media was comparable. This result therefore corroborated the predicted values and the effectiveness of the model, indicating that the optimized medium favors the production of NW-G01.


