Identifying Protein-Protein Interaction Sites Using Covering Algorithm

Abstract
:
1. Introduction
2. Results and Discussion
2.1. Cross-validation
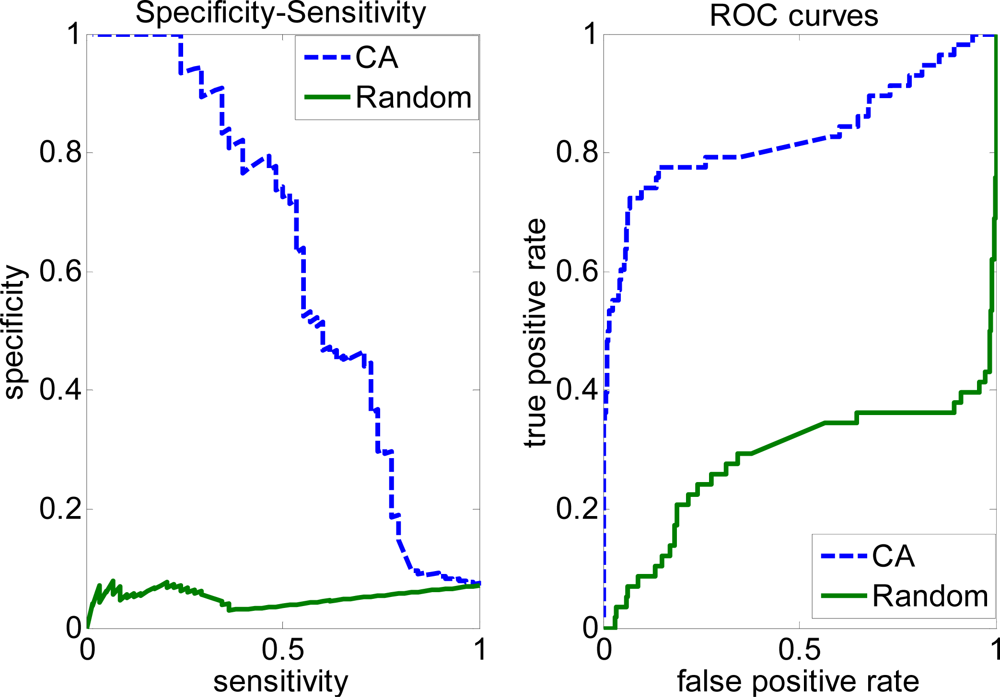
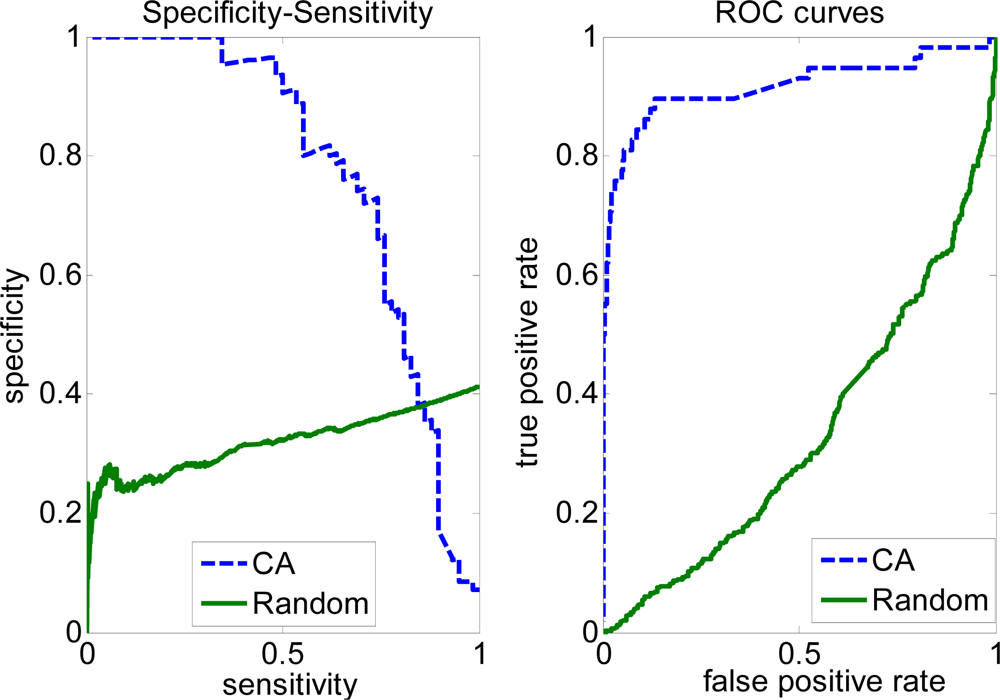
2.2. Evaluation measures of the covering algorithm (CA)
2.3. FP rate versus TP rate tradeoff
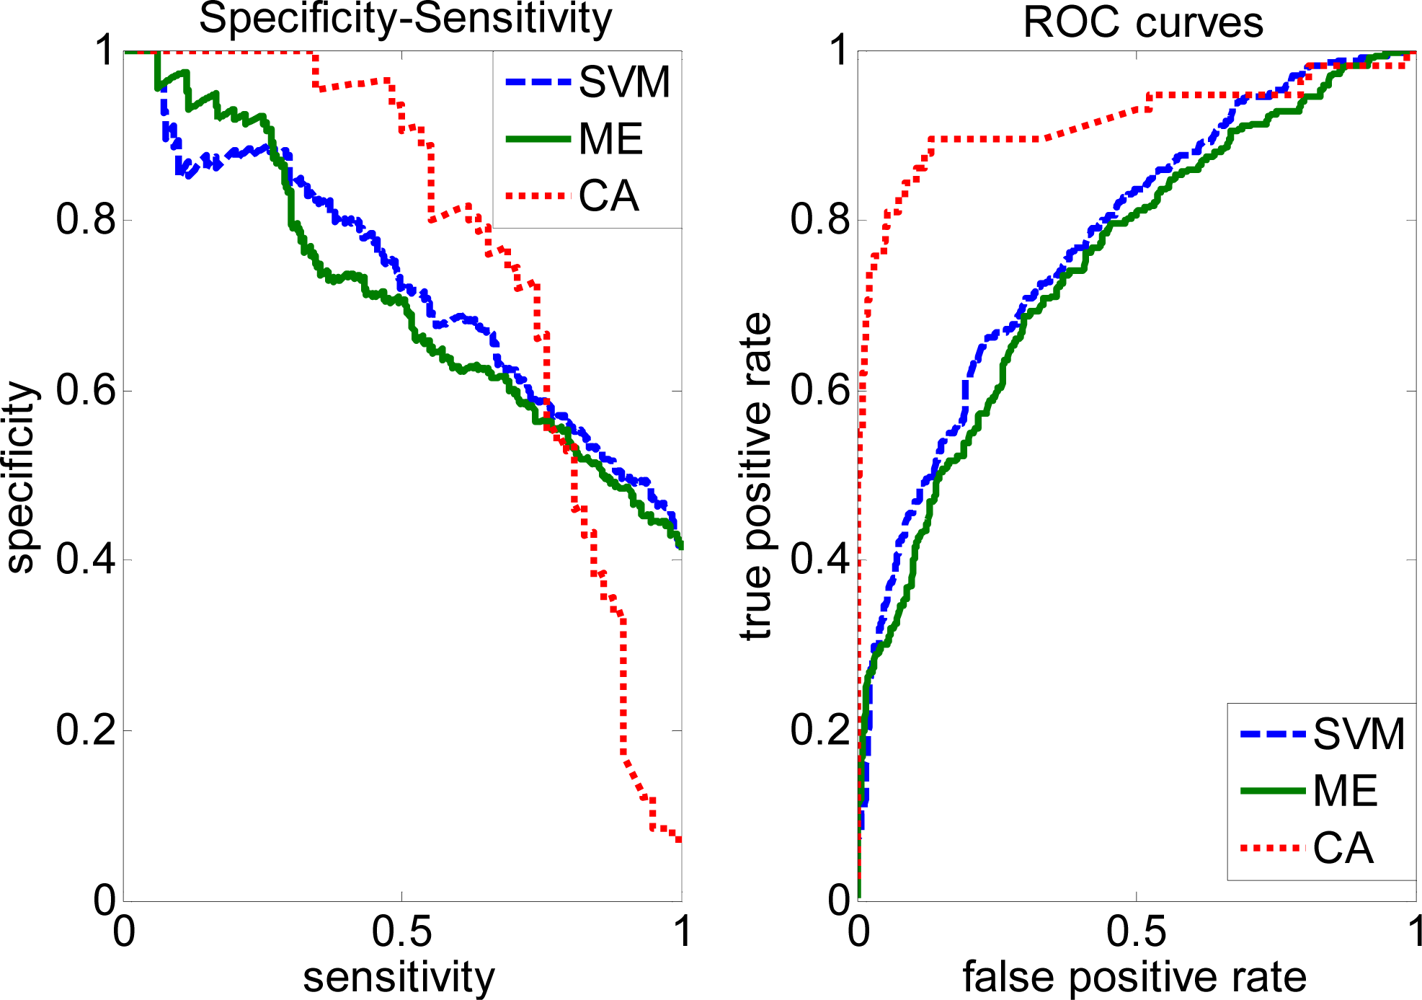
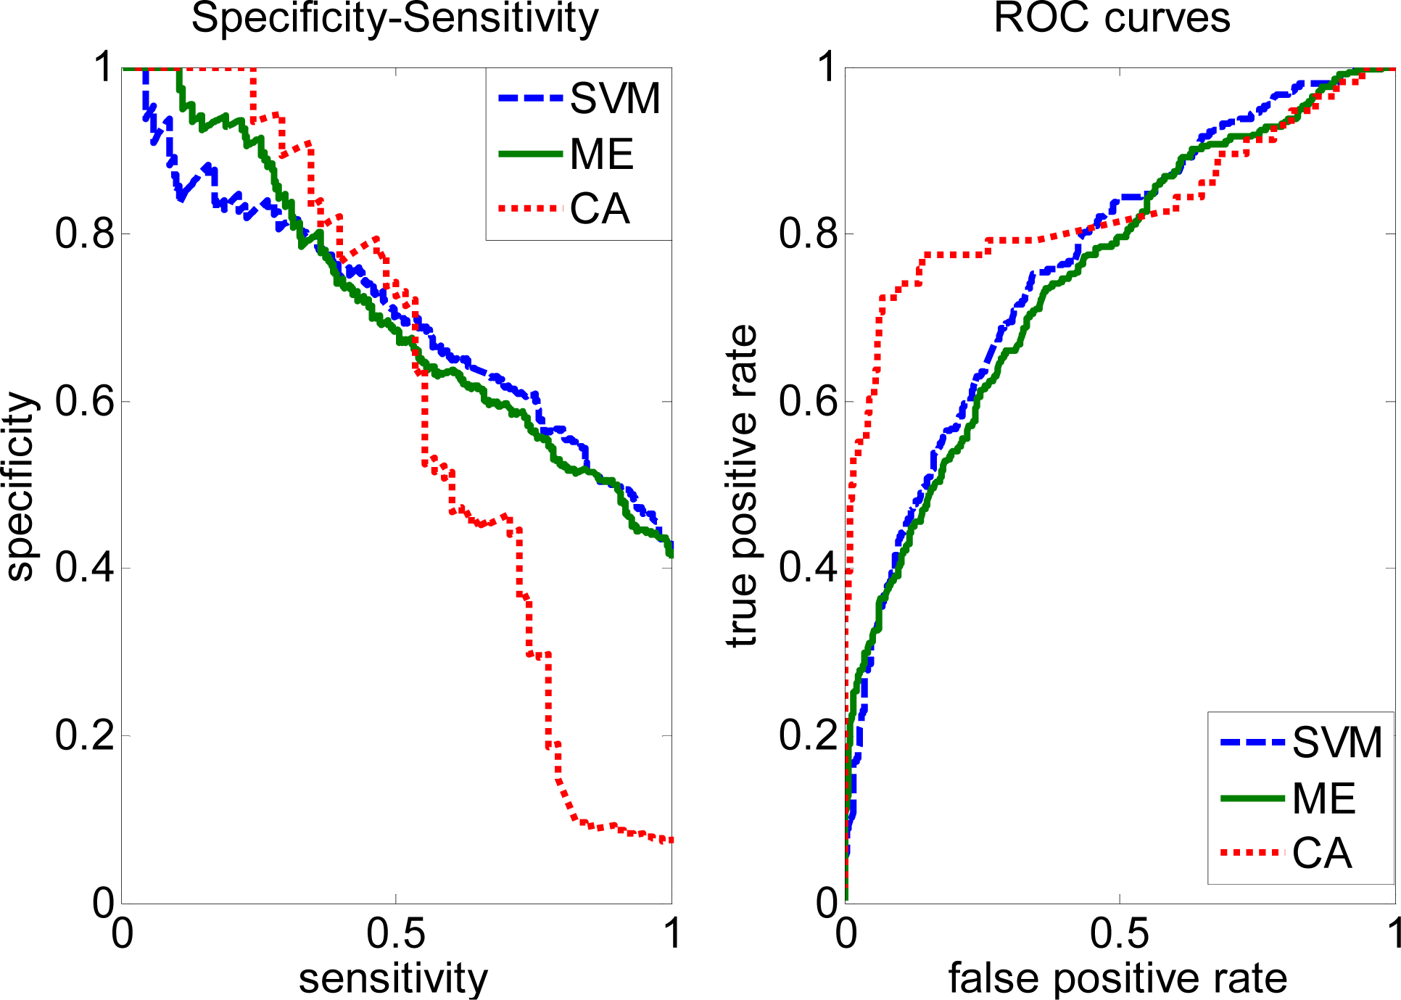
2.4. Comparison with other methods
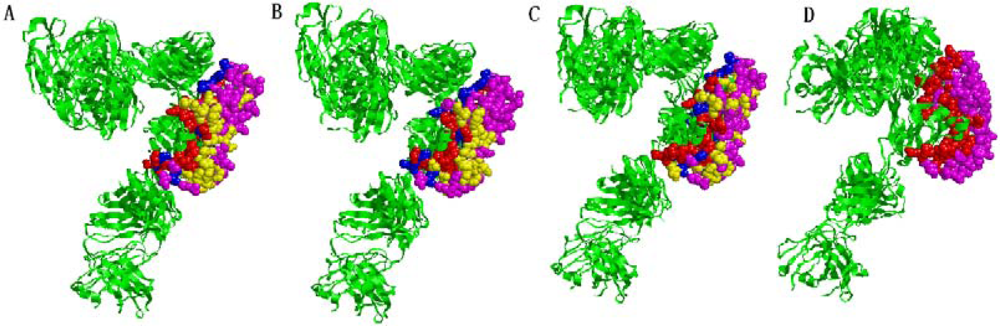
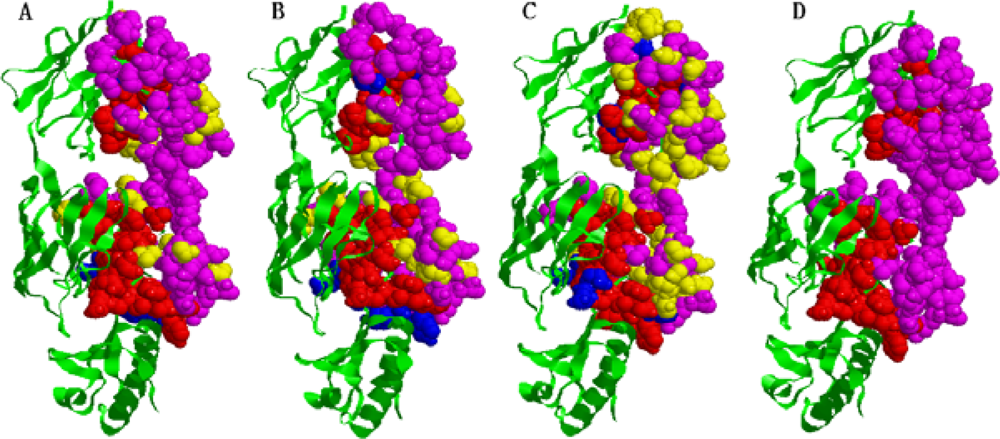
2.5. Some experimental examples
3. Experimental
3.1. Collection of data sets
3.2. Generation of the character vector
3.2.1. Protein sequence profile feature
3.2.2. ASA feature
3.3. Covering algorithm (CA) for classification
3.3.1. Algorithm 1
3.3.2. Algorithm 2 for making a cover C(i)
3.4. Predictor construction
3.5. Evaluation of performance
4. Conclusions
Acknowledgments
References
- Zhou, HX. Improving the understanding of human genetic diseases through predictions of protein structures and protein-protein interaction sites. Curr. Med. Chem 2004, 11, 539–549. [Google Scholar]
- Mrowka, R; Patzak, A; Herzel, H. Is there a bias in proteome research? Cold Spring Harbor Laboratory Press: New York, NY, USA, 2001; Volume 11, pp. 1971–1973. [Google Scholar]
- Berman, HM; Battistuz, T; Bhat, TN; Bluhm, WF; Bourne, PE; Burkhardt, K; Feng, Z; Gilliland, GL; Iype, L; Jain, S. The protein data bank. Acta Crystallogr. D 2002, D58, 899–907. [Google Scholar]
- Glaser, F; Steinberg, DM; Vakser, IA; Ben-Tal, N. Residue frequencies and pairing preferences at protein-protein interfaces. Proteins: Struct. Funct. Bioinf 2001, 43, 89–102. [Google Scholar]
- Young, L; Jernigan, RL; Covell, DG. A role for surface hydrophobicity in protein-protein recognition. Protein Sci 1994, 3, 717–729. [Google Scholar]
- Jones, S; Thornton, JM. Principles of protein-protein interactions. Proc. Natl. Acad. Sci. USA 1996, 93, 13–20. [Google Scholar]
- Conte, LL; Chothia, C; Janin, J. The atomic structure of protein-protein recognition sites. J. Mol. Biol 1999, 285, 2177–2198. [Google Scholar]
- Chen, H; Zhou, HX. Prediction of interface residues in protein-protein complexes by a consensus neural network method: test against NMR data. Proteins: Struct. Funct. Bioinf 2005, 61, 21–35. [Google Scholar]
- Fariselli, P; Pazos, F; Valencia, A; Casadio, R. Prediction of protein-protein interaction sites in heterocomplexes with neural networks. Euro. J. Biochem 2002, 269, 1356–1361. [Google Scholar]
- Zhou, HX; Shan, Y. Prediction of Protein Interaction Sites From Sequence Profile and Residue Neighbor List. Proteins: Struct. Funct. Bioinf 2001, 44, 336–343. [Google Scholar]
- Bradford, JR; Westhead, DR. Improved prediction of protein-protein binding sites using a support vector machines approach. Bioinformatics 2005, 21, 1487–1494. [Google Scholar]
- Chung, JL; Wang, W; Bourne, PE. Exploiting sequence and structure homologs to identify protein-protein binding sites. Proteins: Struct. Funct. Bioinf 2006, 62, 630–640. [Google Scholar]
- Koike, A; Takagi, T. Prediction of protein-protein interaction sites using support vector machines. Protein Eng. Des. Sel 2004, 17, 165–173. [Google Scholar]
- Res, I; Mihalek, I; Lichtarge, O. An evolution based classifier for prediction of protein interfaces without using protein structures. Bioinformatics 2005, 21, 2496–2501. [Google Scholar]
- Wang, B; San Wong, H; Huang, DS. Inferring protein-protein interacting sites using residue conservation and evolutionary information. Protein Pept. Lett 2006, 13, 999–1005. [Google Scholar]
- Wang, B; Chen, P; Huang, DS; Li, J; Lok, TM; Lyu, MR. Predicting protein interaction sites from residue spatial sequence profile and evolution rate. FEBS Lett 2006, 580, 380–384. [Google Scholar]
- Li, MH; Lin, L; Wang, XL; Liu, T. Protein-protein interaction site prediction based on conditional random fields. Bioinformatics 2007, 23, 597. [Google Scholar]
- Ofran, Y; Rost, B. Predicted protein–protein interaction sites from local sequence information. FEBS Lett 2003, 544, 236–239. [Google Scholar]
- Jaynes, ET. Information theory and statistical mechanics. Phys. Rev 1957, 106, 620–630. [Google Scholar]
- Chakrabarti, P; Janin, J. Dissecting protein-protein recognition sites. Proteins: Struct. Funct. Bioinf 2002, 47, 334–343. [Google Scholar]
- Wang, J; Lim, K; Smolyar, A; Teng, M; Liu, J; Tse, AGD; Hussey, RE; Chishti, Y; Thomson, CT. Atomic structure of an alpha beta T cell receptor (TCR) heterodimer in complex with an anti-TCR Fab fragment derived from a mitogenic antibody. EMBO J 1998, 17, 10–26. [Google Scholar]
- Prasad, L; Waygood, EB; Lee, JS; Delbaere, LTJ. The 2.5 Å resolution structure of the jel42 Fab fragment/HPr complex. J. Mol. Biol 1998, 280, 829–845. [Google Scholar]
- Kabsch, W; Sander, C. Dictionary of protein secondary structure: pattern recognition of hydrogen-bonded and geometrical features. Biopolymers 1983, 22, 2577–2637. [Google Scholar]
- Rost, B; Sander, C. Conservation and prediction of solvent accessibility in protein families. Proteins: Struct. Funct. Bioinf 1994, 20, 216–226. [Google Scholar]
- Zhang, L; Zhang, B. A geometrical representation of McCulloch-Pitts neural model andits applications. IEEE Trans Neural Netw 1999, 10, 925–929. [Google Scholar]
- Zhang, L; Zhang, B; Yin, HF. An alternative covering design algorithm of multi-layer neural networks. J. Soft 1999, 10, 737–742. [Google Scholar]
- Dodge, C; Schneider, R; Sander, C. The HSSP database of protein structure-sequence alignments and family profiles. Nucleic Acids Res 1998, 26, 313. [Google Scholar]
- Burgoyne, NJ; Jackson, RM. Predicting protein interaction sites: binding hot-spots in protein-protein and protein-ligand interfaces. Bioinformatics 2006, 22, 1335–1342. [Google Scholar]


| Dataset | Method | Sensitivity | Specificity | Accuracy | F1-mesure | CC |
|---|---|---|---|---|---|---|
| Complete | CA | 0.5612 | 0.5883 | 0.6962 | 0.5916 | 0.2893 |
| Random | 0.4535 | 0.4764 | 0.5582 | 0.4462 | 0.0604 | |
| Trim | CA | 0.6559 | 0.5334 | 0.6086 | 0.5863 | 0.2124 |
| Random | 0.5036 | 0.4555 | 0.4955 | 0.4550 | −0.0065 |
| Data set | Method | Sensitivity | Specificity | F1-measure | Accuracy | CC |
|---|---|---|---|---|---|---|
| SVM | 0.5547 | 0.6294 | 0.5796 | 0.6896 | 0.2443 | |
| Complete | ME | 0.5011 | 0.6734 | 0.5408 | 0.6761 | 0.2719 |
| CA | 0.5612 | 0.5883 | 0.5916 | 0.6962 | 0.2893 | |
| SVM | 0.5807 | 0.5883 | 0.5639 | 0.6662 | 0.2032 | |
| Trim | ME | 0.6103 | 0.6101 | 0.6576 | 0.5860 | 0.2417 |
| CA | 0.6559 | 0.5334 | 0.5863 | 0.6086 | 0.2124 |
© 2009 by the authors; licensee Molecular Diversity Preservation International, Basel, Switzerland. This article is an open-access article distributed under the terms and conditions of the Creative Commons Attribution license (http://creativecommons.org/licenses/by/3.0/).
Share and Cite
Du, X.; Cheng, J.; Song, J. Identifying Protein-Protein Interaction Sites Using Covering Algorithm. Int. J. Mol. Sci. 2009, 10, 2190-2202. https://doi.org/10.3390/ijms10052190
Du X, Cheng J, Song J. Identifying Protein-Protein Interaction Sites Using Covering Algorithm. International Journal of Molecular Sciences. 2009; 10(5):2190-2202. https://doi.org/10.3390/ijms10052190
Chicago/Turabian StyleDu, Xiuquan, Jiaxing Cheng, and Jie Song. 2009. "Identifying Protein-Protein Interaction Sites Using Covering Algorithm" International Journal of Molecular Sciences 10, no. 5: 2190-2202. https://doi.org/10.3390/ijms10052190